wfp fao mission cereal balance sheet somalia oct0828 · wfp/fao joint mission to somalia for...
TRANSCRIPT

WFP/FAO Joint Mission to Somalia for technical support to FSAU on methodological improvements to the Cereal Balance Sheet. Final report, 5th November 2008.
1
Project OSRO/SOM/604/EC - Technical Support to FSAU on Cereal Balance
Sheet & Crop Production Survey
WFP/FAO Joint Mission to FSAU-Somalia for Technical Support on Methodological Improvements to the Somalia Cereal Balance Sheet
Nairobi, 21 - 27 October 2008
Mission Report
I. INTRODUCTION
The FAO Food Security Analysis Unit (FSAU) for Somalia in collaboration with WFP VAM Somalia has been calculating an annual Cereal Balance Sheet (CBS) since 2004. FSAU (FAO) and WFP VAM Somalia have requested technical expertise to review and improve on the data and methods used for estimating components of this Cereal Balance Sheet. Under the Project OSRO/SOM/604/EC “Technical Support to FSAU on Cereal Balance Sheet & Crop Production Survey”, a seven day joint WFP/FAO technical mission has been undertaken to Nairobi-Kenya from 21-27 October 2008 to work with FSAU and WFP VAM Somalia to review current methods, data availability, and develop a work plan for methodological improvements to specific components of the Cereal Balance Sheet. The mission was composed of Mr. Vincent Ngendakumana (Regional Statistician, FAO Regional Office for Africa, Accra-Ghana) and Ms. Kathryn Ogden (Food Security and Nutrition Specialist, WFP Food Security Analysis Unit, Rome). The overall objectives and tasks under the FAO Mission responsibility were to review and improve: i) the commercial cereal import estimation adjusted to account for cross-border cereal flows, and ii) the estimation of crop production (i.e. crop production survey methods), post harvest losses, seed and animal feed use. The overall objective and task under the WFP Mission were to review and improve the per capital cereal requirements estimation. The detailed terms of reference of the whole WFP/FAO mission are presented in Annex 1.
The CBS is completed every June (period June to May) following the main rains and crop production harvest and the estimates are updated after the second rains and second annual harvest in January. Since 2004, the FSAU CBS has continuously applied four assumptions from the 1999 CFSAM:
1) estimation of opening commercial stocks (16,000MT), 2) per capita cereal consumption of 80 kg/year, 3) 10% seed and losses, and 4) feed use (3000 Mt). It is important to review these assumptions taken from the 1999 CFSAM, as well as to improve
the methodology used to estimate commercial imports taking into account informal cross-border cereal flows. The assumptions of per capita consumption and commercial imports are especially important to the
WFP/FAO Joint Mission to Somalia for technical support to FSAU on methodological improvements to the Cereal Balance Sheet. Final report, 5th November 2008.
2
overall surplus/deficit conclusion of the analysis; therefore, it is critical to ensure that these variables are estimated as accurately as possible.
Within WFP Somalia and FSAU there are doubts that the 1999 assumptions are still valid in
2008. WFP is concerned that some of these assumptions (in particular the per capita consumption) are no longer accurate and thus the soundness of the final CBS is undermined.
This report presents, for each of the specific components of the CBS identified for review by the Mission, the current weaknesses in the methods and estimations, comparison to other methods and approaches in similar countries in Africa, and recommendations on improved methods and estimation techniques which are feasible and able to be implemented in the Somalia context. The findings, conclusions and recommendations of this mission were shared and discussed with FSAU and WFP VAM Somalia through a debriefing meeting held on 27 October 2008. Their comments and observations have been integrated into this version. II. ACKNOWLEDGMENTS
The mission would like to express its sincere gratitude to the staff of FSAU and WFP VAM Somalia as well as other partners met for their valuable co-operation and information obtained. In particular, the mission highly appreciated the attention and encouragement received from Peter Goossens the WFP Country Director for Somalia, from Ms. Cindy Holleman, Chief Technical Advisor (CTA) FSAU and Ms. Genevieve Chicoine, Programme Officer, Vulnerability Analysis and Mapping Unit (VAM), WFP Somalia as well as other FSAU and WFP technical staff. We especially thank Consolata for taking care of all administrative and logistic issues related to our time in Nairobi.

WFP/FAO Joint Mission to Somalia for technical support to FSAU on methodological improvements to the Cereal Balance Sheet. Final report, 5th November 2008.
3
III. ACTIVITIES UNDERTAKEN BY THE JOINT MISSION 1. Meetings with FSAU and WFP VAM Somalia as well as other partners • The FAO Mission arrived in Nairobi on 20 October 2008 and had a briefing meeting with the FSAU
management and technical staff (the CTA, Nutritive, Technical and Data Systems Managers, the Agricultural Livelihood Analyst) and the FEWSNET/Somalia Market and Trade Advisor, on 21 October 2008. The objectives and work plan were discussed at that occasion.
• The FAO Mission was joined by that of WFP on 22 October 2008. Together with the FSAU-CTA,
the WFP Programme Officer-VAM and the FEWSNET/Somalia Market and Trade Advisor, they met (the same morning) with the WFP Country Director for Somalia. Respective objectives and expectations from the WFP/FAO Joint Mission were clarified.
• On 23 October 2008, the FAO Mission met with the Senior Statistician, Agricultural Statistics
Department of the Kenya National Bureau of Statistics (KNBS) to discuss on their experience and status of the compilation of Food Balance Sheets as well as on their perspective in regard capturing cross-border trade flows.
• The Deputy FEWSNET/Kenya and Regional Representative were also met (the same day) in order to
discuss about their project for “Strengthening institutional capacity for cross-border monitoring of trade and markets in the Eastern Africa Region”.
• On 24 October 2008, the Agricultural Officer of the Special Emergency Programmes Services
(TCES) for FAO Somalia was also met in order to discuss about their activities, perspectives and possible collaboration with FSAU for collecting agricultural statistics in Somalia.
• On 24 October 2008, the WFP Mission met with other agencies working in food security and
nutrition in Somalia: Action Contre la Faim and Save the Children-UK to discuss their experiences with food consumption patterns in their project areas. The WFP Mission was also able to have a telephone discussion with a member of the team conducting the CFSAM Somalia 1997 and 1999.
• During the duration of the whole mission, FSAU technical staff were met as required in order to
discuss on any issues related to the current methods used for collecting and/or estimating crop data and per capita cereal consumption and compiling Cereal Balance Sheets (CBS).
• At the end the mission (on 27 October 2008), a debriefing meeting was organized and held with
FSAU and WFP VAM Somalia on the findings and the conclusions of the mission. • The list of all persons met is presented in Annex 2.
2. Reading reports and reviewing technical/methodological documents and crops data availability The joint mission consulted an abundance of reports and technical/methodological documents related to the crops data collection in Somalia, the perspectives of monitoring cross-border trade, crops data availability (crop production, area harvested and yield data, commercial imports and food aid data, etc.) and the compilation of CBS. Household level food security, socio-economic, nutrition and vulnerability studies were reviewed as well as other CFSAM reports for the region. The list of all documents consulted is in Annex 3. Below are the main findings from the review of existing technical/methodological documents and discussions held with FSAU, WFP VAM Somalia and other partners.

WFP/FAO Joint Mission to Somalia for technical support to FSAU on methodological improvements to the Cereal Balance Sheet. Final report, 5th November 2008.
4
IV. FINDINGS OF THE JOINT MISSION1
1. Regarding the commercial cereal imports estimation adjusted to account for cross-border cereal flows
Currently the trade data used for compilation of CBS for Somalia are from the following sources:
- Commercial imports data collected on a monthly basis by field analysts from the three active/operational ports of Somalia (Berbera, Bossaasso and Mogadishu).
- Food Aid data (as total cereal) obtained from WFP and CARE.
- The cereal equivalent conversion factors used are those estimated in 1999 by an FAO/WFP
mission (1.33 for wheat flour and 2.00 for pasta). Weaknesses Comments Proposal for improvement Deadline 1. There may be some trade flows through Kismaayo port
It is not sure that this port is active or not (because of the insecurity prevailing in that area)
Security permitting, to assess if this port is active, evaluate the importance of its trade flow and establish the data collection mechanism
By the next CBS
2. The possible exports are not taken into consideration
Their importance may be currently minor. However, in 2002, the trading partner’s data revealed that Somalia exported about 24000 Mt of Wheat. The same source reports about 1000 Mt of milled paddy rice exported by Somalia in 2006
To ensure that exports flows are also requested from the ports. This may be complemented by cross-border trade data (in the future)
By the next CBS
3. Trading Partners (TP) data are not considered
These data can be obtained from the Statistics Division, FAO and used as complementary and mirror data (checking data obtained from the ports). For example, in 2005, the FAO TP established the imports of wheat (in cereal equivalent) at 289500 Mt, while FSAU was at 243000 Mt. Moreover, there are other type of cereals TP data (processed items) which don’t seem to be recorded from the Ports (cases of pastry, Rice husked and broken, flour of maize, etc.): see the table of FAO cereals TP data (imports) in Annex 4
- To establish contact/ collaboration with ESS and collect required TP data.
- To check commercial trade data obtained from the ports against FAO trading partners data (trade matrix)
By the next CBS
4. Food aid data are obtained as total cereal
This would not allow to establish Supply Utilization Accounts at single commodity level and calculate nutritive content equivalent (if needed)
To request it by single cereal commodities
By the next CBS
1 Parts 1-6 refer to the findings from the FAO Mission, part 7 the findings of the WFP mission.

WFP/FAO Joint Mission to Somalia for technical support to FSAU on methodological improvements to the Cereal Balance Sheet. Final report, 5th November 2008.
5
5. The conversion factor used for pasta seems to be very high
According to the commodity tree, the extraction rate of Wheat flour->Macaroni=100%. Therefore the conversation rate of pasta should be more or less the same as that one for Wheat Flour (see the Annex 5)
To reconsider the conversion factor used for Pasta
By the next CBS
6. The cross-border flows may be important but they are unknown
There are national/regional and partner initiatives to establish a monitoring system of cross-border flows: Uganda and EAC as country/regional initiatives, and RATIM2 (Regional Agricultural Trade Intelligence Network) as partner initiative. FEWSNET is also initiating a project (funded by WFP) to “Strengthen institutional capacity for cross-border monitoring of trade and markets in the Eastern Africa Region”.
- To establish a relevant cross-point sample frame (through a study on cross-border profiles) and select purposively the required sample to be monitored for the trade flows.
- To recruit/train field analysts and recruit a consultant for this purpose (a trade statistician with a relevant experience).
- To ensure coordination and synergies between national/ regional and partner initiatives
- The national institutions responsible of trade data statistics (Customs and National Bureau of Statistics) should be the key players of this initiative.
- To ensure the constitution of a unique national database (one shopping point) on cross-border data flows (using the same classification -HS- and concepts/definitions). Those data should be integrated to pre-existing trade databases of neighboring countries.
- To take advantage of the experience gained by some countries in the region (Uganda and South Africa).
ASAP
2. Regarding the estimation of crop production (i.e. crop production survey methods)
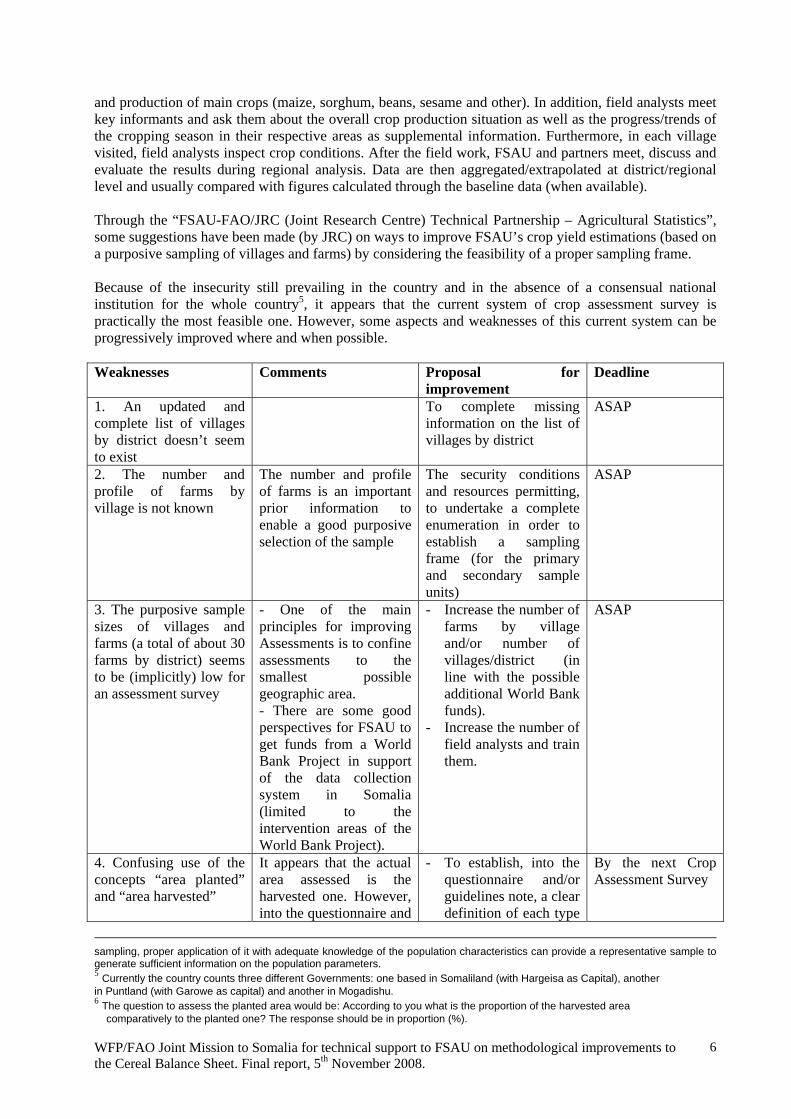
The crop production data are obtained from the Crop Assessment Survey. Currently, this survey is carried twice a year (at Gu and Deyr seasons) which takes place 2 to 3 weeks before the harvest period. This task is done by 15 FSAU Field Analysts who are complemented by other field staff of NGOs and UN agencies (WFP, FEWSNET, CARE, etc.) as well as local authorities. A regional workshop is organized before each crop assessment survey during which the number of villages to be visited in each district (10-15, depending on the concentration of farming communities in a district) and the number of farmers (1-2 or 4-5 farms/village)3 and key informants (2-5/district) to be formally interviewed in each village is fixed and purposively selected4. Questionnaires for the farmers provide information about the area harvested, yield 2 RATIM is presently housed within the Eastern Africa Grain Council (EAGC). It is the main institution currently monitoring formal and informal cross-border trade (for maize, beans and rice) at some cross-border points in the region (Rwanda-Uganda, Uganda-Kenya, Tanzania-Kenya, Uganda-Tanzania and Rwanda-RDC) 3 This gives about 30 farmers selected by district. 4 Gini and Galvani adopted purposive Sampling technique with Italian Census data. It involves selecting sample units according to a purposive principle to achieve desired objective. Although this method is subject to bias and less efficient compared to stratified
WFP/FAO Joint Mission to Somalia for technical support to FSAU on methodological improvements to the Cereal Balance Sheet. Final report, 5th November 2008.
6
and production of main crops (maize, sorghum, beans, sesame and other). In addition, field analysts meet key informants and ask them about the overall crop production situation as well as the progress/trends of the cropping season in their respective areas as supplemental information. Furthermore, in each village visited, field analysts inspect crop conditions. After the field work, FSAU and partners meet, discuss and evaluate the results during regional analysis. Data are then aggregated/extrapolated at district/regional level and usually compared with figures calculated through the baseline data (when available). Through the “FSAU-FAO/JRC (Joint Research Centre) Technical Partnership – Agricultural Statistics”, some suggestions have been made (by JRC) on ways to improve FSAU’s crop yield estimations (based on a purposive sampling of villages and farms) by considering the feasibility of a proper sampling frame. Because of the insecurity still prevailing in the country and in the absence of a consensual national institution for the whole country5, it appears that the current system of crop assessment survey is practically the most feasible one. However, some aspects and weaknesses of this current system can be progressively improved where and when possible. Weaknesses Comments Proposal for
improvement Deadline
1. An updated and complete list of villages by district doesn’t seem to exist
To complete missing information on the list of villages by district
ASAP
2. The number and profile of farms by village is not known
The number and profile of farms is an important prior information to enable a good purposive selection of the sample
The security conditions and resources permitting, to undertake a complete enumeration in order to establish a sampling frame (for the primary and secondary sample units)
ASAP
3. The purposive sample sizes of villages and farms (a total of about 30 farms by district) seems to be (implicitly) low for an assessment survey
- One of the main principles for improving Assessments is to confine assessments to the smallest possible geographic area. - There are some good perspectives for FSAU to get funds from a World Bank Project in support of the data collection system in Somalia (limited to the intervention areas of the World Bank Project).
- Increase the number of farms by village and/or number of villages/district (in line with the possible additional World Bank funds).
- Increase the number of field analysts and train them.
ASAP
4. Confusing use of the concepts “area planted” and “area harvested”
It appears that the actual area assessed is the harvested one. However, into the questionnaire and
- To establish, into the questionnaire and/or guidelines note, a clear definition of each type
By the next Crop Assessment Survey
sampling, proper application of it with adequate knowledge of the population characteristics can provide a representative sample to generate sufficient information on the population parameters. 5 Currently the country counts three different Governments: one based in Somaliland (with Hargeisa as Capital), another in Puntland (with Garowe as capital) and another in Mogadishu. 6 The question to assess the planted area would be: According to you what is the proportion of the harvested area
comparatively to the planted one? The response should be in proportion (%).

WFP/FAO Joint Mission to Somalia for technical support to FSAU on methodological improvements to the Cereal Balance Sheet. Final report, 5th November 2008.
7
the guidelines note, both the two concepts are sometimes used one for another
of area to be considered.
- Proposal to include into the questionnaire the two types of area6. The planted are would help to evaluate the quantity of seeds.
5. Production data are reported by split year and not by calendar year
The crop assessment being conducted by season, it is technically possible to compute related data by calendar year (the Gu data for the year t and t+1 and the Deyr data for the year t+1)
To re-compute related data by calendar year
By the next CBS
6. No proper sample survey is conducted
It is know that the Somaliland area is more secure with a more or less local stable Government
To undertake a sample survey in that area: - FSAU to ask to the
local Government to take the lead of this activity.
- Recruit an Expert in sampling to assist for a sampling design.
- To establish a sampling frame.
ASAP
3. Regarding the Post Harvest Losses (PHL)
FSAU evaluates the losses together with the quantity used for seed. They are all (seed + losses) estimated at 10% of production. Mars-Food Sec, in Association with AIDCO and FAO, has commissioned a project to obtain more realistic figures for the PHL of cereal grains. The project is developing a database and information system to provide PHL ranges in East and Southern Africa (in particular IGAD and SADC countries), for grain staples by country and by province. The losses are defined as “reduction in weight or ready to consume grain incurred during harvesting operations, farm storage, transport and market storage”7. The project team is lead by NRI (Natural Resources Institute) and ISICAD who are collaborating with partners in 23 countries of the IGAD and SADC region8. The types of losses considered include the following: harvesting loss, drying loss, threshing/shelling loss, storage loss and transport loss. Among the countries covered there are: Somalia, Eritrea, Ethiopia, Sudan, Tanzania, Uganda, etc. The database constituted could therefore be an alternative source of information for PHL in Somalia. However, a particular attention should be paid to the definition of “Losses” to be used for the purpose of the CBS compilation. Indeed, as the cereal production data produced by FSAU is in dried grain, the harvesting and drying, threshing/shelling and winnowing loss shouldn’t be considered. 7 Cfr the note on “Post Harvest Losses information system for better estimates of food availability. Study in support to MARS FOOD SEC action”. 8 The Project is funded by the EC and supervised by the MARS Food Sec Action at JRC-Ispra. It started in February 2008 and will come to an end in February 2009. It is being explored the possibility of its extension. Besides actual losses data, the database established will also hold data on yield and climate.

WFP/FAO Joint Mission to Somalia for technical support to FSAU on methodological improvements to the Cereal Balance Sheet. Final report, 5th November 2008.
8
The mission would therefore suggest referring to the current FAO definition for this concept which excludes the losses occurring during the pre-harvest and harvesting stages. Alternatively, FSAU may also refer to the waste rate being used by FAO (among other technical conversion factors used in FAOSTAT) and review it in light of the reality of the country (see those technical conversion factors in Annex 5). That waste rate should be applied not only to the production but also to imports and stock withdrawals.
FAO current definition of waste Amounts of the commodity lost through wastage (waste) during the year at all stages between farms and the household level in handling, storage and transport should be recorded as waste. Not included is the waste of the edible and inedible parts of the commodity which occurs after the commodity has entered the household. The quantities lost during processing are also not included under this element because they are implicitly considered in applying the extraction rate. Waste is usually calculated as a fixed percentage of availability, the latter being defined as production plus imports plus stock withdrawals.
4. Regarding the seed use FSAU evaluates the seeds together with the losses. They are all (seed + losses) estimated at 10% of production. The mission would suggest including a related question (quantity of each commodity foreseen to be used as seeds9) into the questionnaire being used for the crop assessment survey (by the next Crop Assessment Survey). By waiting, FSAU may proceed as FAO does (in many cases), by considering the seed quantity as a ratio of the planted area of the following year. FSAU may wish to refer and review the seeding rates currently used by FAO, in FAOSTAT (see Annex 5).
Practice when compiling FBS in FAO-ESS In the absence of official information on the utilization of seeds, these data are very often estimatds on the basis of data relating to seed rate and the "area sown" of the following year. If no data for area sown is available, area harvested should enter in the computation.
5. Regarding the animal feed use FSAU has been always considering the quantity of feed use as constant (set at 3000 Mt). This is based on the assumption made in 1999 by the FAO/WFP mission (see the “Special Report: FAO/WFP Crop and Food Supply Assessment Mission to Somalia, 3 September 1999”). From that report, it is stated that the use of cereals as feed is minimal. According to the actual current situation prevailing in Somalia, it seems odd to consider that there is such quantity of food from cereals used for feeding animals (moreover being always considered constant). The mission would suggest including a related question (quantity of each commodity used for feeding animal) into the questionnaire being used for the crop assessment survey (by the next Crop Assessment Survey). Additional questions would be to ask the number of livestock (by type) and if they are fed from cereal products. By waiting, FSAU may set the quantity of cereals used for animal feed to nil.
9 The question would be: What is the quantity (for each commodity), including the part from the production or any other source (market, etc.) foreseen to be used as seed for the next season?

WFP/FAO Joint Mission to Somalia for technical support to FSAU on methodological improvements to the Cereal Balance Sheet. Final report, 5th November 2008.
9
6. Regarding the reference period and other aspects of the CBS methodology The mission has reviewed the approach followed in compiling CBS as well as the reference period considered. The following points would merit attention for improvement (by the next CBS):
- The CBS components are currently presented as aggregates of total cereal. The mission would propose breaking it down by single cereal items.
- The current FSAU CBS is showing groups of SUA elements. The mission would suggest keeping
the SUA’s at their single level, ensuring that they are all covered and that their definitions correspond to the standard ones (see the points 3-5 presented above).
- The current FSAU CBS is presented on a split year basis (From June of the year t to May of the
year t+1) due to the harvesting period of the Deyr seasons (January-December). The mission would suggest reconsidering the reference period and bringing it to the calendar year system. This is technically feasible as the production data are produced by season (Gu+Karan and Deyr) and trade ones by month. The advantages of the calendar year system would be the following: comparability of the results to other countries, easy use of other data sources (trade matrix/TP data, etc.), possibility to accommodate other commodities (in the future) which don’t follow the same split year period, etc.
The Cereal calendar year in Somalia Deyr (Harvesting in Dec-Jan.) Gu (Harvesting: July-August) Oct. Nov. Dec. Jan. Feb. March April May June July Aug. Sept. Jilal (No production) Karan (Prod. -> to Gu)
7. Regarding the per capita cereal consumption Key Findings from the cereal consumption review:
- The CFSAM 1997 assumed a per capita cereal consumption of 90 kg per person per year. The report does not state where this assumption came from. Discussion with one of the team members from this mission revealed that there was no specific assessment on which this figure was based. The assumption however was derived from a figure which suggested that 110kg was a usual per capita intake in the region but this was adjusted downwards for Somalia taking into account the high proportion of pastoralists (60-70%) and the structure of Somali society10. The report itself however, states that 50% of the population is nomadic. It also followed a poor Gu season.
- The CFSAM 1999 took the 1997 per capita consumption figure and made further revisions downwards stating reasons as adjustments in the populations’ food consumption patterns mainly to more livestock products, fish, bananas and pulses in response to successive cereal crop failures. The team member whom I spoke to told me that he had never agreed with this figure and felt it was derived just to ensure that other elements of the Cereal Balance Sheet fit together. Whilst this remains the pint of view of one of the team members it is nevertheless important to note.
10 This remains anecdotal and it is not known where the 110kg figure is documented.
WFP/FAO Joint Mission to Somalia for technical support to FSAU on methodological improvements to the Cereal Balance Sheet. Final report, 5th November 2008.
10
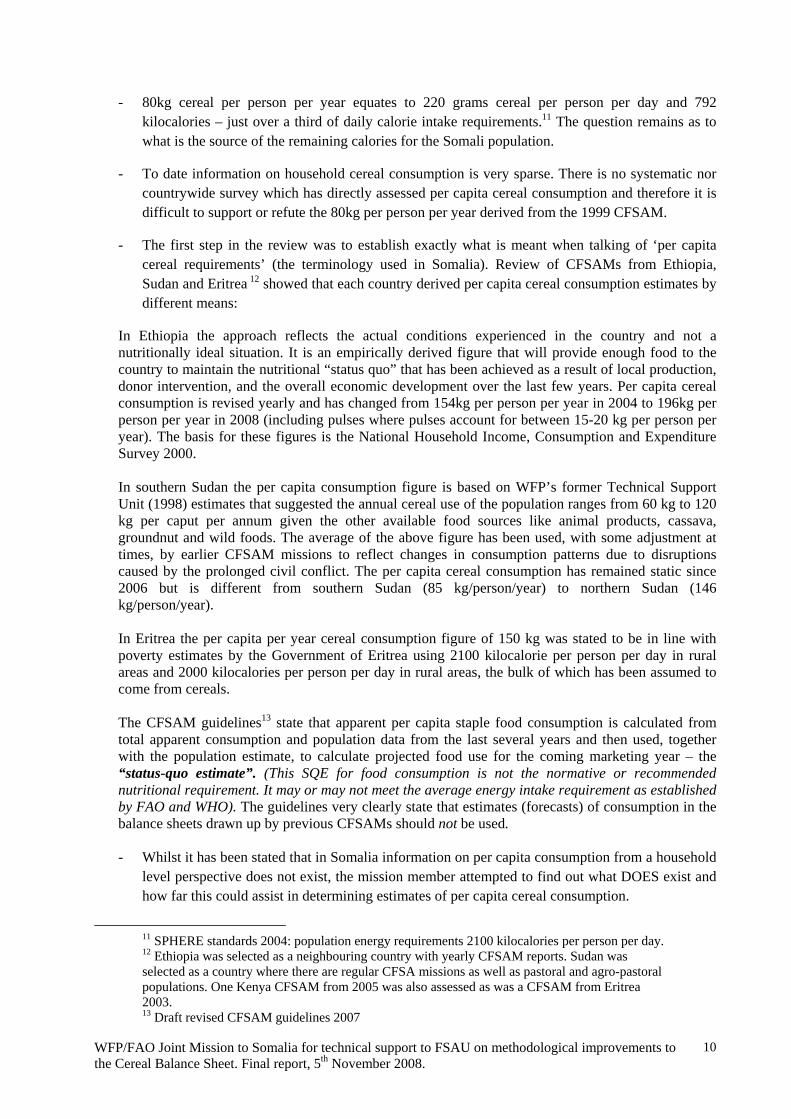
- 80kg cereal per person per year equates to 220 grams cereal per person per day and 792 kilocalories – just over a third of daily calorie intake requirements.11 The question remains as to what is the source of the remaining calories for the Somali population.
- To date information on household cereal consumption is very sparse. There is no systematic nor countrywide survey which has directly assessed per capita cereal consumption and therefore it is difficult to support or refute the 80kg per person per year derived from the 1999 CFSAM.
- The first step in the review was to establish exactly what is meant when talking of ‘per capita cereal requirements’ (the terminology used in Somalia). Review of CFSAMs from Ethiopia, Sudan and Eritrea 12 showed that each country derived per capita cereal consumption estimates by different means:
In Ethiopia the approach reflects the actual conditions experienced in the country and not a nutritionally ideal situation. It is an empirically derived figure that will provide enough food to the country to maintain the nutritional “status quo” that has been achieved as a result of local production, donor intervention, and the overall economic development over the last few years. Per capita cereal consumption is revised yearly and has changed from 154kg per person per year in 2004 to 196kg per person per year in 2008 (including pulses where pulses account for between 15-20 kg per person per year). The basis for these figures is the National Household Income, Consumption and Expenditure Survey 2000. In southern Sudan the per capita consumption figure is based on WFP’s former Technical Support Unit (1998) estimates that suggested the annual cereal use of the population ranges from 60 kg to 120 kg per caput per annum given the other available food sources like animal products, cassava, groundnut and wild foods. The average of the above figure has been used, with some adjustment at times, by earlier CFSAM missions to reflect changes in consumption patterns due to disruptions caused by the prolonged civil conflict. The per capita cereal consumption has remained static since 2006 but is different from southern Sudan (85 kg/person/year) to northern Sudan (146 kg/person/year). In Eritrea the per capita per year cereal consumption figure of 150 kg was stated to be in line with poverty estimates by the Government of Eritrea using 2100 kilocalorie per person per day in rural areas and 2000 kilocalories per person per day in rural areas, the bulk of which has been assumed to come from cereals. The CFSAM guidelines13 state that apparent per capita staple food consumption is calculated from total apparent consumption and population data from the last several years and then used, together with the population estimate, to calculate projected food use for the coming marketing year – the “status-quo estimate”. (This SQE for food consumption is not the normative or recommended nutritional requirement. It may or may not meet the average energy intake requirement as established by FAO and WHO). The guidelines very clearly state that estimates (forecasts) of consumption in the balance sheets drawn up by previous CFSAMs should not be used. - Whilst it has been stated that in Somalia information on per capita consumption from a household
level perspective does not exist, the mission member attempted to find out what DOES exist and how far this could assist in determining estimates of per capita cereal consumption.
11 SPHERE standards 2004: population energy requirements 2100 kilocalories per person per day. 12 Ethiopia was selected as a neighbouring country with yearly CFSAM reports. Sudan was selected as a country where there are regular CFSA missions as well as pastoral and agro-pastoral populations. One Kenya CFSAM from 2005 was also assessed as was a CFSAM from Eritrea 2003. 13 Draft revised CFSAM guidelines 2007

WFP/FAO Joint Mission to Somalia for technical support to FSAU on methodological improvements to the Cereal Balance Sheet. Final report, 5th November 2008.
11
- The ideal would be to have per capita cereal consumption estimates from each livelihood zone and from each wealth group within that livelihood zone. Taking an weighted average of all of this would produce a countrywide estimate that would help to determine if the 80kg per person per year figure is realistic or not.
What documentation exists in terms of informing knowledge on cereal consumption at the household level?
- FEWSNET with SC-UK and FSAU undertook an urban assessment in Hargeisa in 2003. On the basis of focus group discussions, the assessment was able to derive yearly kilogram intakes of cereals for each of the 5 wealth groups defined. This allows a rough estimate of per capita cereal consumption taking an average across the wealth groups or better still by applying a weighting to take into account the proportion of the population in each group.
- FSAU baseline assessments do collect information on a variety of topics which could be analysed
together to give a rough estimate of cereal consumption in livelihood zones and across wealth groups. This information includes crop production or Gu and Deyr seasons, the amount of production sold, the amount of production for other uses, food purchased in kilograms, the amount of food from gifts and relief and food received in kind. There is also the expenditure on staple food, the cultivated area and the proportion of kilocalories from each cereal, all of which could provide means to cross-check the previous information.
- WFP food security and vulnerability assessments (CFSVA) in Puntland and Somaliland from
2007 and 2008 respectively, analysed food consumption of households based on 7-day dietary frequency of key food groups. Whilst these assessments only give information on the northern more pastoral regions, there are elements which can be used to cross-check the feasibility of cereal consumption (such as the high expenditure on sugar and the importance of milk in defining food consumption profiles).
- FSAU Dietary Diversity in Dangarayo and Dinsor Districts study 2004 compared agro-pastoral
diets with those of pastoral populations. Following a relatively good Gu season households in the agro-pastoral area had sufficient food stocks. The pastoral area however, was assessed during a drought when there was acute shortage of meat and milk affecting normal dietary patterns. The study nevertheless found that cereals was the biggest food group for both pastoral and agro-pastoral groups and that milk and meats were more consumed by agro-pastorals than by pastorals. For both groups after cereal, sugar was the second most consumed product providing almost 50% of those calories provided by cereals. This information highlights the fact that one cannot assume low cereal consumption by pastoralists and that their diet (and calorie intake) is mostly comprised of meat and milk.
- FSAU Seasonal food availability and household food access in Somalia report July 2006 gives
useful information on food patterns across the key livelihood groups: pastoral, agro-pastoral, riverine and urban.

WFP/FAO Joint Mission to Somalia for technical support to FSAU on methodological improvements to the Cereal Balance Sheet. Final report, 5th November 2008.
12
8. CONCLUSIONS AND RECOMMANDATIONS The following actions are proposed in order to improve the components of the current CBS. a) Improvement of commercial cereal imports estimation adjusted to account for
cross-border cereal flows.
- The security permitting, to assess if the Kasmaayo port is active, evaluate the importance of its trade flow and establish the data collection mechanism. Action: FSAU (by the next CBS cycle).
- To ensure that exports flows are also requested from the ports. Action: FSAU (by the next CBS cycle).
- To complement and check commercial trade data obtained from the ports against FAO trading
partners data (trade matrix) which should be requested to FAO-ESS. Action: FSAU (by the next CBS).
- To reconsider the conversion factors used for converting the Wheat Flour and Pasta into Wheat
Grain equivalent. Action: FSAU (by the next CBS).
- To compile and establish food-aid data by single cereal commodities. Action: FSAU, WFP and CARE (by the next CBS).
- Based on the experience gained by some other countries in the region (Uganda and South Africa),
to establish a relevant cross-point sample frame (through a study on cross-border profiles) and select purposively the required sample to be monitored for the trade flows. To recruit a consultant (a trade statistician with a relevant experience) and recruit/train field analysts for this purpose. This activity should be done in coordination and synergies with other national/regional and partner initiatives. The national institutions responsible of trade data statistics (Customs and National Bureau of Statistics) should be the key players of this initiative. This would ensure the constitution of a unique national database (one shopping point) on cross-border data flows (using the same classification -HS- and concepts/definitions) which should be integrated to pre-existing trade databases. Action: FSAU, WFP and FEWSNET (by the next CBS).
b) Improvement of the estimation of crop production (i.e. crop production survey
methods)
- To establish an updated and comprehensive list of villages by district. The security conditions and resources permitting, to establish the profile and number of farms by village which (if possible through a complete enumeration) in order to constitute a sampling frame (for the primary and secondary sample units). Action: FSAU (as soon as possible).
- To increase the number of farms by village and/or number of villages/district (in line with the
possible additional World Bank funds. Accordingly, the number of trained field analysts should be increased as well. Action: FSAU (by the next CBS).
- To collect data on both area planted and harvested. This would require to include, into the
questionnaire, related questions and to establish, into the questionnaire and/or guidelines note, a clear definition of each of the two types of crop areas. Action: FSAU (by the next CBS).
- To re-compute production data by calendar year (and not by split year as it is currently done).
Action: FSAU (by the next CBS).
- To undertake, on a pilot basis, an agricultural sample survey in Somaliland which is in a more secure situation. Action: FSAU and the Local Government (by the next CBS).
WFP/FAO Joint Mission to Somalia for technical support to FSAU on methodological improvements to the Cereal Balance Sheet. Final report, 5th November 2008.
13
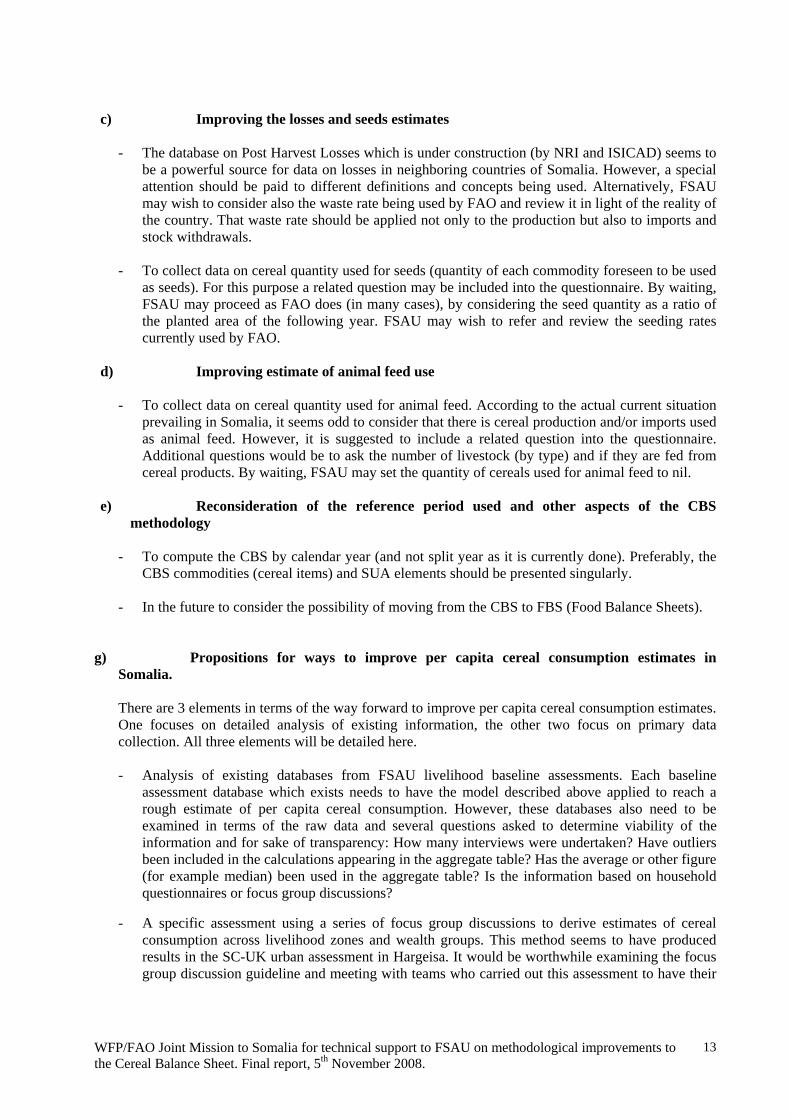
c) Improving the losses and seeds estimates
- The database on Post Harvest Losses which is under construction (by NRI and ISICAD) seems to
be a powerful source for data on losses in neighboring countries of Somalia. However, a special attention should be paid to different definitions and concepts being used. Alternatively, FSAU may wish to consider also the waste rate being used by FAO and review it in light of the reality of the country. That waste rate should be applied not only to the production but also to imports and stock withdrawals.
- To collect data on cereal quantity used for seeds (quantity of each commodity foreseen to be used
as seeds). For this purpose a related question may be included into the questionnaire. By waiting, FSAU may proceed as FAO does (in many cases), by considering the seed quantity as a ratio of the planted area of the following year. FSAU may wish to refer and review the seeding rates currently used by FAO.
d) Improving estimate of animal feed use
- To collect data on cereal quantity used for animal feed. According to the actual current situation
prevailing in Somalia, it seems odd to consider that there is cereal production and/or imports used as animal feed. However, it is suggested to include a related question into the questionnaire. Additional questions would be to ask the number of livestock (by type) and if they are fed from cereal products. By waiting, FSAU may set the quantity of cereals used for animal feed to nil.
e) Reconsideration of the reference period used and other aspects of the CBS
methodology
- To compute the CBS by calendar year (and not split year as it is currently done). Preferably, the CBS commodities (cereal items) and SUA elements should be presented singularly.
- In the future to consider the possibility of moving from the CBS to FBS (Food Balance Sheets).
g) Propositions for ways to improve per capita cereal consumption estimates in
Somalia. There are 3 elements in terms of the way forward to improve per capita cereal consumption estimates. One focuses on detailed analysis of existing information, the other two focus on primary data collection. All three elements will be detailed here. - Analysis of existing databases from FSAU livelihood baseline assessments. Each baseline
assessment database which exists needs to have the model described above applied to reach a rough estimate of per capita cereal consumption. However, these databases also need to be examined in terms of the raw data and several questions asked to determine viability of the information and for sake of transparency: How many interviews were undertaken? Have outliers been included in the calculations appearing in the aggregate table? Has the average or other figure (for example median) been used in the aggregate table? Is the information based on household questionnaires or focus group discussions?
- A specific assessment using a series of focus group discussions to derive estimates of cereal consumption across livelihood zones and wealth groups. This method seems to have produced results in the SC-UK urban assessment in Hargeisa. It would be worthwhile examining the focus group discussion guideline and meeting with teams who carried out this assessment to have their

WFP/FAO Joint Mission to Somalia for technical support to FSAU on methodological improvements to the Cereal Balance Sheet. Final report, 5th November 2008.
14
vision on the accuracy of this method14. The benefits if using focus groups are that the discussion would focus only on food consumption with an emphasis on cereals and would thus allow interviewers opportunities to cross-check and verify information in a relatively rigorous manner. The other main benefit is that each livelihood zone would be covered specifically and within these zones focus groups could be held with each wealth group again providing a detail of information on the specific questions posed and the range of foods eaten by different wealth groups and over different periods of the year. Another advantage is that existing information such as high sugar consumption and pasta and bread consumption can be verified (see in section on issues that still require discussion). The qualitative approach would provide a means to cross-check information obtained from household interviews. It may be advantageous to undertake focus group discussions prior to addition of questions in household surveys in order to determine the best way to pose the question in household questionnaires.
- Addition of questions in regular on-going data collection rounds. The nutrition surveys are suggested for a number of reasons: the statistically representative nature of the sample, the fact that the respondent is likely to be the female carer and thus more knowledgeable about cereals cooked in the household, the nutrition survey questionnaire already asks questions regarding dietary diversity and therefore it would be much of an extra burden to add a couple of additional questions nor would it require further training of survey teams. What the household questionnaires will not do is to separate out households from different wealth groups. Nor will these questionnaires allow time for development of the theme with respondents as the question will remain quantitative with the focus being on amount of cereal consumed by the household in the previous 24 hours and the ‘normality’ of this. However, valuable information will be collected which can be triangulated with the information from the focus group discussions as well as from the secondary review of the FSAU baseline study databases.
Issues that still require discussion. - Pasta consumption is quite widespread in Somalia but seems to be consumed in larger quantities
by better off and urban households. The amount may be negligible in poorer households but may be quite significant in better off households and therefore needs to be captured as part of overall cereal consumption. A conversion factor to wheat equivalents needs to be established to represent this food commodity15. However, as pasta consumption in larger quantities appears to be limited to better-off urban households it is not likely to have a significant impact on overall countrywide cereal consumption.
- Bread consumption is probably more widespread than pasta consumption and across all wealth groups and thus should be considered in the same way as pasta especially during focus group discussions to determine the extent to which it contributes cereal to household consumption16.
- There is no information on food stocks at a household level which is a flaw in terms of the methodology proposed above of analyzing FSAU baseline databases. Whilst existing information points to the fact that in a below average production year food stocks are minimal, in a good or bumper year stocks may be quite substantial. As cereals are often stored underground there are possibilities of storage losses and again the limited information on this issue points to high
14 Since the mission information has been obtained that the consultant who carried out the work did not provide anything other than the report which did not include the guideline and thus it is not possible to recuperate the guideline. 15 Composition of foods consumed in Somalia FSAU July 2006 states that pasta provides 79kcal per 100grams. The FAO mission colleague found that a conversion factor for pasta to wheat cereal equivalent of 2 was used. 16 The FAO mission colleague found that a conversion factor for bread to wheat cereal equivalent of 1.33 was used.

WFP/FAO Joint Mission to Somalia for technical support to FSAU on methodological improvements to the Cereal Balance Sheet. Final report, 5th November 2008.
15
storage losses. However, for the approach proposed of assessing per capita consumption from actual cereals consumed via focus groups and household questionnaires, the stock issue should not be so important.
- Sugar consumption is high and existing studies point to high proportions of food expenditure on sugar and increased purchase of sugar when cereals become scarce and expensive17. The proportion of kilocalories provided by sugar in the diet should be captured in order to again cross-check information on total calorie consumption.
- The results of the cereal consumption studies as outlined above should allow us to test the hypothesis that cereal consumption as a proportion of total calorific intake does not differ when total energy intake increases. This is stated in the CFSAM draft revised guidelines: energy from starchy food hovers randomly about an average of 1300 kcal, without any perceptible trend along the whole range of variation of total energy intake.
- The focus group discussion guideline used in the Hargeisa urban assessment should be reviewed in terms of questions asked. Ideally team members involved in this survey should be interviewed for their inputs when developing this guideline.
Suggestions for questions to be added to the nutrition survey questionnaires and focus group discussion guideline.
Nutrition Survey Questionnaire Responses and analysis Q: How much cereal did you consume in the household yesterday (based on 24 hour recall method)?
Response: in local measure (confirmation that local measure is standard and weighed by assessment teams). Analysis: conversion from local unit into kgs and calculation of per capita quantity. Calculation of total per capita consumption per livelihood zone.
Q: Is this amount usual for this household? Response: Y N Analysis: frequency
Q: If N to previous question how does the amount change?
Response: Increase, decrease Analysis: frequency
Q: When would this amount change? Response: multiple choice options Poor harvest, reduced income (to be determined based on focus group discussions) Incorporate responses into seasonal variations in cereal consumption
Focus Group Discussion Guideline (to be refined according to SC-UK guideline used
in Hargeisa assessment)
Analysis
Establish/verify characteristics of wealth group for the livelihood zone (should be available from baselines; household size, proportion of this wealth group in this livelihood zone). What is the range of foods eaten by households in this group? How does this differ according to seasons/shocks
Analysis by quantity of different food items consumed and by proportion of kilocalories this provides. Extrapolation of annual per capita cereal consumption per wealth group using average household size. Calculation of annual per capita cereal
17 WFP and FSAU respectively
WFP/FAO Joint Mission to Somalia for technical support to FSAU on methodological improvements to the Cereal Balance Sheet. Final report, 5th November 2008.
16
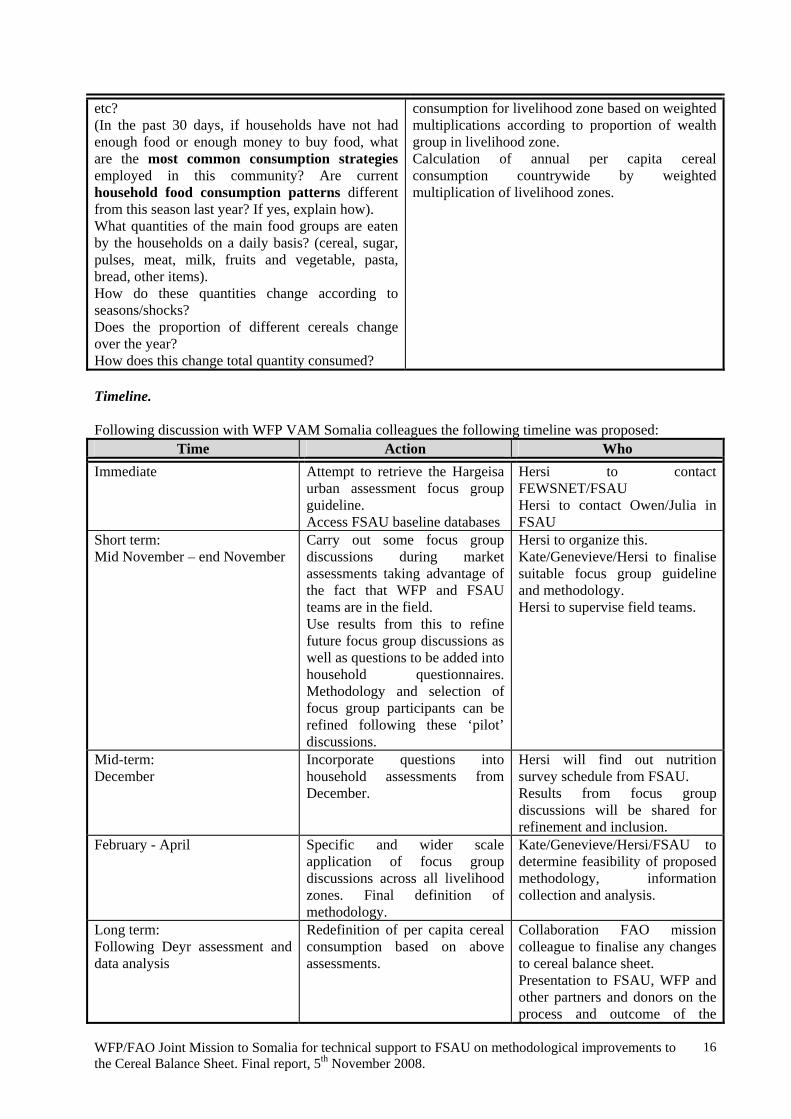
etc? (In the past 30 days, if households have not had enough food or enough money to buy food, what are the most common consumption strategies employed in this community? Are current household food consumption patterns different from this season last year? If yes, explain how). What quantities of the main food groups are eaten by the households on a daily basis? (cereal, sugar, pulses, meat, milk, fruits and vegetable, pasta, bread, other items). How do these quantities change according to seasons/shocks? Does the proportion of different cereals change over the year? How does this change total quantity consumed?
consumption for livelihood zone based on weighted multiplications according to proportion of wealth group in livelihood zone. Calculation of annual per capita cereal consumption countrywide by weighted multiplication of livelihood zones.
Timeline. Following discussion with WFP VAM Somalia colleagues the following timeline was proposed:
Time Action Who Immediate
Attempt to retrieve the Hargeisa urban assessment focus group guideline. Access FSAU baseline databases
Hersi to contact FEWSNET/FSAU Hersi to contact Owen/Julia in FSAU
Short term: Mid November – end November
Carry out some focus group discussions during market assessments taking advantage of the fact that WFP and FSAU teams are in the field. Use results from this to refine future focus group discussions as well as questions to be added into household questionnaires. Methodology and selection of focus group participants can be refined following these ‘pilot’ discussions.
Hersi to organize this. Kate/Genevieve/Hersi to finalise suitable focus group guideline and methodology. Hersi to supervise field teams.
Mid-term: December
Incorporate questions into household assessments from December.
Hersi will find out nutrition survey schedule from FSAU. Results from focus group discussions will be shared for refinement and inclusion.
February - April Specific and wider scale application of focus group discussions across all livelihood zones. Final definition of methodology.
Kate/Genevieve/Hersi/FSAU to determine feasibility of proposed methodology, information collection and analysis.
Long term: Following Deyr assessment and data analysis
Redefinition of per capita cereal consumption based on above assessments.
Collaboration FAO mission colleague to finalise any changes to cereal balance sheet. Presentation to FSAU, WFP and other partners and donors on the process and outcome of the

WFP/FAO Joint Mission to Somalia for technical support to FSAU on methodological improvements to the Cereal Balance Sheet. Final report, 5th November 2008.
17
revision.

WFP/FAO Joint Mission to Somalia for technical support to FSAU on methodological improvements to the Cereal Balance Sheet. Final report, 5th November 2008.
18
ANNEX 1
Terms of Reference
WFP/FAO Joint Mission
Methodological Improvements to the Somalia Cereal Balance Sheet
FSAU (FAO) in collaboration with WFP VAM Somalia has been calculating an annual Cereal Balance Sheet (CBS) since 2004. At this time FSAU and WFP VAM Somalia are seeking technical expertise to review and improve on the data and methods used for estimating components of this Cereal Balance Sheet. A five to seven day joint WFP/FAO technical mission to Nairobi, Kenya is requested comprising of relevant expertise from WFP and FAO, to travel to Nairobi, Kenya to work with FSAU and WFP VAM Somalia to review current methods, data availability, and develop a work plan for methodological improvements to specific components of the Cereal Balance Sheet. This mission is requested for 7 days from Oct. 26 – Nov. 1, 2008. Overall Objectives and Tasks The three specific data estimation components of the Cereal Balance Sheet (CBS) to be reviewed and improved are i) per capital cereal requirements estimation, ii) commercial cereal import estimation adjusted to account for cross-border cereal flows, and iii) the estimation of crop production (i.e. crop production survey methods), post harvest losses, seed and animal feed use. In consultation with FSAU and WFP VAM, the specific tasks are:
i.) a systematic review of the current data and methods employed in the estimation of the three specific components identified,
ii.) identify implementable ways for improving these estimates, either through the use of additional data already available or through the introduction of new data gathered through WFP and/or FSAU data collection system, either by the addition of new questions within already used instruments or the design of new instruments and methods of estimation,
iii.) recommend a timeline and technical work plan for implementing the improved methods,
including the development, testing and training of new instruments or monitoring systems, and revising the estimations of the annual Cereal Balance Sheet .
The WFP/FAO mission is to work in close consultation with FSAU and WFP VAM Somalia, considering methods and data collection that can be effectively implemented building off and using existing local information from NGOs, UN and other agencies as well as FSAU and WFP analysis systems and which takes into consideration the Somalia specific context of operational opportunities and constraints. FSAU and WFP VAM Somalia will employ their staff and resources to implement improved methods for data collection, processing, analysis and estimation. Given the focus of this mission is to review and identify methodological improvements, and develop a phased work plan approach to testing and implementation, it is expected that there will be need for further follow-up technical mission(s) to advise on progress and revision of the actual Somalia Cereal Balance Sheet prior July 2009. Deliverables A report detailing, for each of the three specifics components of the CBS identified for reviewed, the current weakness in the methods and estimations, comparison to other methods and approaches in similar countries in Africa, and recommendations on implementable improved methods and estimation

WFP/FAO Joint Mission to Somalia for technical support to FSAU on methodological improvements to the Cereal Balance Sheet. Final report, 5th November 2008.
19
techniques. The report should include annexes of specific revised or new field instruments, methods for data collection and estimation, as well as a work plan for training, if needed, and a timeline for implementation. The consultant team will also hold a debriefing meeting with FSAU and WFP Somalia, on the findings of the mission at the conclusion of the mission. Composition of WFP/FAO Team and Desired Expertise and Experiences A two member team is requested, one from WFP and one from FAO. The team composition should ensure balanced experience in the estimation of annual Cereal Balance Sheets, and specific expertise in the three components identified for review, namely the estimation of per capita cereal requirements, commercial cereal import estimation, and crop production surveys and the estimation of post harvest losses, seed and animal feed use. Experience and expertise in estimation of Cereal Balance Sheets in the context of information deficit countries, with informal cross-border trade, and challenging data collection environments is highly desirable. Experience in conducting CFSAM in countries neighboring Somalia, especially Ethiopia is highly desirable, given the importance of informal cross-border trade between the two countries, as well as similarities in pastoral based consumption patterns. Experience in conducting CFSAMs in war torn countries or in countries with similar livelihoods (pastoral and agro-pastoral would also be an advantage. Dates and Location
• 5 to 7 days, in the third or fourth week of October 2008, preferably from Oct. 26 to Nov. 1, 2008, • FSAU, Nairobi , Kenya
Funding FSAU (Somalia) will cover the costs of the FAO mission member, while WFP will cover the costs of the WFP mission member.
WFP/FAO Joint Mission to Somalia for technical support to FSAU on methodological improvements to the Cereal Balance Sheet. Final report, 5th November 2008.
20
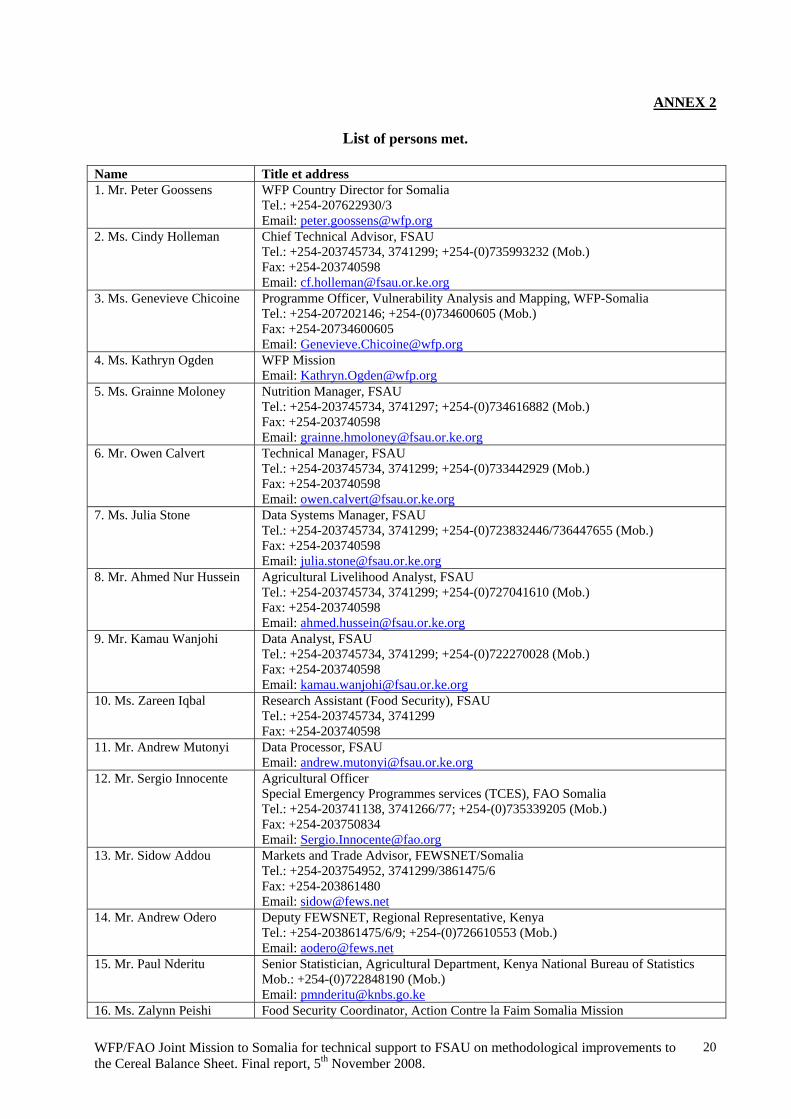
ANNEX 2
List of persons met. Name Title et address 1. Mr. Peter Goossens WFP Country Director for Somalia
Tel.: +254-207622930/3 Email: [email protected]
2. Ms. Cindy Holleman Chief Technical Advisor, FSAU Tel.: +254-203745734, 3741299; +254-(0)735993232 (Mob.) Fax: +254-203740598 Email: [email protected]
3. Ms. Genevieve Chicoine Programme Officer, Vulnerability Analysis and Mapping, WFP-Somalia Tel.: +254-207202146; +254-(0)734600605 (Mob.) Fax: +254-20734600605 Email: [email protected]
4. Ms. Kathryn Ogden WFP Mission Email: [email protected]
5. Ms. Grainne Moloney Nutrition Manager, FSAU Tel.: +254-203745734, 3741297; +254-(0)734616882 (Mob.) Fax: +254-203740598 Email: [email protected]
6. Mr. Owen Calvert Technical Manager, FSAU Tel.: +254-203745734, 3741299; +254-(0)733442929 (Mob.) Fax: +254-203740598 Email: [email protected]
7. Ms. Julia Stone Data Systems Manager, FSAU Tel.: +254-203745734, 3741299; +254-(0)723832446/736447655 (Mob.) Fax: +254-203740598 Email: [email protected]
8. Mr. Ahmed Nur Hussein Agricultural Livelihood Analyst, FSAU Tel.: +254-203745734, 3741299; +254-(0)727041610 (Mob.) Fax: +254-203740598 Email: [email protected]
9. Mr. Kamau Wanjohi Data Analyst, FSAU Tel.: +254-203745734, 3741299; +254-(0)722270028 (Mob.) Fax: +254-203740598 Email: [email protected]
10. Ms. Zareen Iqbal Research Assistant (Food Security), FSAU Tel.: +254-203745734, 3741299 Fax: +254-203740598
11. Mr. Andrew Mutonyi Data Processor, FSAU Email: [email protected]
12. Mr. Sergio Innocente Agricultural Officer Special Emergency Programmes services (TCES), FAO Somalia Tel.: +254-203741138, 3741266/77; +254-(0)735339205 (Mob.) Fax: +254-203750834 Email: [email protected]
13. Mr. Sidow Addou Markets and Trade Advisor, FEWSNET/Somalia Tel.: +254-203754952, 3741299/3861475/6 Fax: +254-203861480 Email: [email protected]
14. Mr. Andrew Odero Deputy FEWSNET, Regional Representative, Kenya Tel.: +254-203861475/6/9; +254-(0)726610553 (Mob.) Email: [email protected]
15. Mr. Paul Nderitu Senior Statistician, Agricultural Department, Kenya National Bureau of Statistics Mob.: +254-(0)722848190 (Mob.) Email: [email protected]
16. Ms. Zalynn Peishi Food Security Coordinator, Action Contre la Faim Somalia Mission

WFP/FAO Joint Mission to Somalia for technical support to FSAU on methodological improvements to the Cereal Balance Sheet. Final report, 5th November 2008.
21
Tel: + 254-204349602/3/4 Mob: +254-(0)727288079 Email: [email protected]
17. Mr. Ranjan Poudyal
Deputy Country Director, Somalia/Somaliland Programme Save the Children-UK Tel:+254-20-2737201, +254-202737227 Mob: +254-(0)733640446 Email: [email protected]
18. Mr.Renato……… Team member 1997 and 1999 Crop Assessment Missions Somalia Mob: +254-(0)735128020

WFP/FAO Joint Mission to Somalia for technical support to FSAU on methodological improvements to the Cereal Balance Sheet. Final report, 5th November 2008.
22
ANNEX 3
List of documents and data files consulted by the Joint Mission
1. FSAU Crop Yield and Area Estimation Methods and Survey Instruments – 1995 to 2008 (Draft). 2. FSAU field Questionnaires on Crop Assessment (2007/2008 Gu/Karan Season, Crop Production
Survey). 3. FSAU Crop Survey Guideline for Somalia, 25 October 2008. 4. FSAU Pastoral Assessment Guideline. 5. Special report: FAO/WFP crop and food supply assessment mission to Somalia. FAO Global
Information and Early Warning System on Food and Agriculture. 3 September 1999. 6. Special report: FAO/WFP Crop and Food Supply Assessment Mission to Somalia. FAO/GIEWS-
WFP. 5 September 1997. 7. Special report: FAO/WFP Crop and Food Supply Assessment Mission to Eritrea. FAO/GIEWS-WFP
2003. 8. Special report: FAO/WFP Crop and Food Supply Assessment Mission to Ethiopia. FAO/GIEWS-
WFP (reports from 2004, 2005, 2006, 2007, 2008). 9. Special report: FAO/WFP Crop and Food Supply Assessment Mission to Kenya. FAO/GIEWS-WFP
(1996, 2000). 10. Special report: FAO/WFP Crop and Food Supply Assessment Mission to Sudan. FAO/GIEWS-WFP
(reports from 2006, 2007, 2008). 11. Food Supply Situation and Crop Prospects in Sub-Saharan Africa, Number 3 December 2005,
GIEWS/FAO. 12. Joint FAO-WFP Guideline for Food Crop and Supply Assessment Missions + Annexes, Draft 13
April 2007. 13. Draft program of support JRC/FSAU – “Technical support to Horn of Africa Food Security
Information System & Assesment” (Ref. CRIS/FOOD/2005/0114-046). European Commission, Joint Research Centre (JRC), Institute for the Protection and Security of the Citizen. Agricultural Unit, 29 November 2007.
14. Part IV. Analysis the Aggregate Food Supply/demand Situation (internal ESTG Draft report on Food
Balance Sheets Methodology. 15. Post Harvest Losses information system for better estimates of food availability. Study in support to
the MARS FOOD SEC Action. 16. FSAU Food security Analysis System: Technical Manual Draft. Version 1. Technical Series, Report
No IV.9, 20 June 2006. 17. Integrated Food Security and Humanitarian Phase Classification: Technical Manual. Version 1.
Technical Series, Report No IV.11, 11 May 2006.
WFP/FAO Joint Mission to Somalia for technical support to FSAU on methodological improvements to the Cereal Balance Sheet. Final report, 5th November 2008.
23
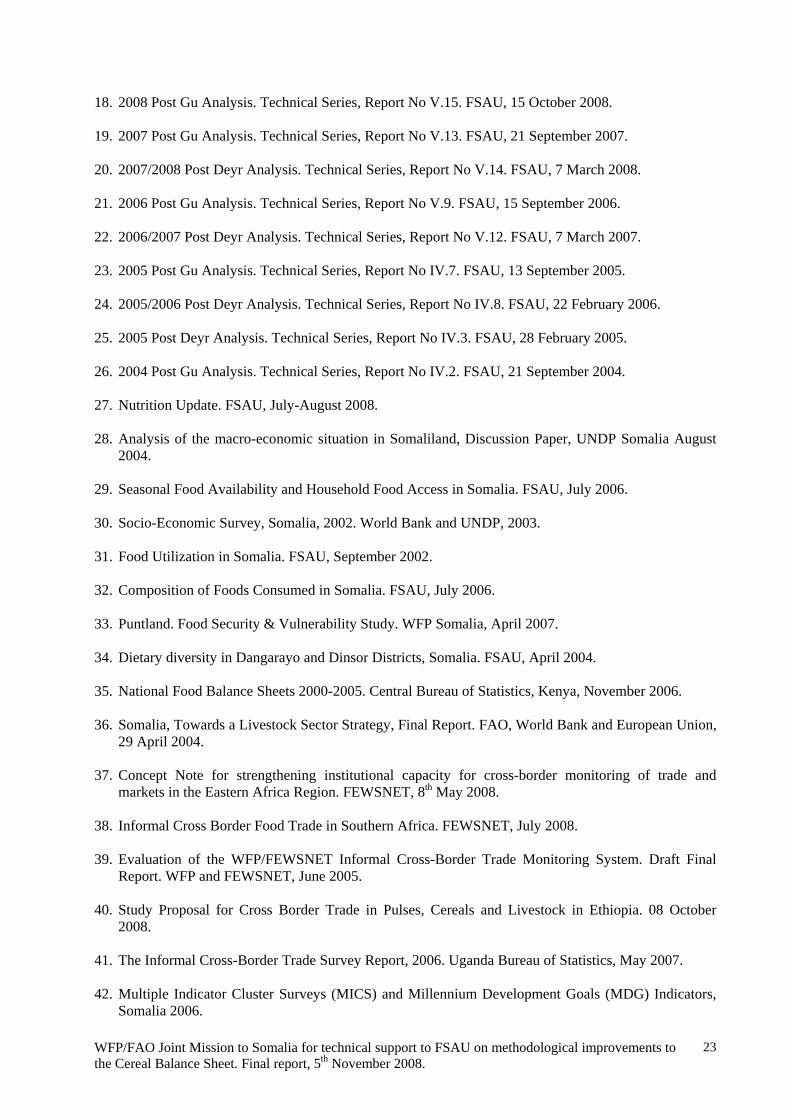
18. 2008 Post Gu Analysis. Technical Series, Report No V.15. FSAU, 15 October 2008. 19. 2007 Post Gu Analysis. Technical Series, Report No V.13. FSAU, 21 September 2007. 20. 2007/2008 Post Deyr Analysis. Technical Series, Report No V.14. FSAU, 7 March 2008. 21. 2006 Post Gu Analysis. Technical Series, Report No V.9. FSAU, 15 September 2006. 22. 2006/2007 Post Deyr Analysis. Technical Series, Report No V.12. FSAU, 7 March 2007. 23. 2005 Post Gu Analysis. Technical Series, Report No IV.7. FSAU, 13 September 2005. 24. 2005/2006 Post Deyr Analysis. Technical Series, Report No IV.8. FSAU, 22 February 2006. 25. 2005 Post Deyr Analysis. Technical Series, Report No IV.3. FSAU, 28 February 2005. 26. 2004 Post Gu Analysis. Technical Series, Report No IV.2. FSAU, 21 September 2004. 27. Nutrition Update. FSAU, July-August 2008. 28. Analysis of the macro-economic situation in Somaliland, Discussion Paper, UNDP Somalia August
2004. 29. Seasonal Food Availability and Household Food Access in Somalia. FSAU, July 2006. 30. Socio-Economic Survey, Somalia, 2002. World Bank and UNDP, 2003. 31. Food Utilization in Somalia. FSAU, September 2002. 32. Composition of Foods Consumed in Somalia. FSAU, July 2006. 33. Puntland. Food Security & Vulnerability Study. WFP Somalia, April 2007. 34. Dietary diversity in Dangarayo and Dinsor Districts, Somalia. FSAU, April 2004. 35. National Food Balance Sheets 2000-2005. Central Bureau of Statistics, Kenya, November 2006. 36. Somalia, Towards a Livestock Sector Strategy, Final Report. FAO, World Bank and European Union,
29 April 2004. 37. Concept Note for strengthening institutional capacity for cross-border monitoring of trade and
markets in the Eastern Africa Region. FEWSNET, 8th May 2008. 38. Informal Cross Border Food Trade in Southern Africa. FEWSNET, July 2008. 39. Evaluation of the WFP/FEWSNET Informal Cross-Border Trade Monitoring System. Draft Final
Report. WFP and FEWSNET, June 2005. 40. Study Proposal for Cross Border Trade in Pulses, Cereals and Livestock in Ethiopia. 08 October
2008. 41. The Informal Cross-Border Trade Survey Report, 2006. Uganda Bureau of Statistics, May 2007. 42. Multiple Indicator Cluster Surveys (MICS) and Millennium Development Goals (MDG) Indicators,
Somalia 2006.

WFP/FAO Joint Mission to Somalia for technical support to FSAU on methodological improvements to the Cereal Balance Sheet. Final report, 5th November 2008.
24
43. Soft copy of crops data. Internal FSAU database. 44. Soft copy of population data by district. UNDP. 45. Soft copy of commercial imports. Internal FSAU database. 46. Livelihood Baseline Profiles. Internal FSAU database and factsheets. 47. Reduction of farm grain post-harvest losses and improvement of grain storage facilities in South
Somali. Concept note. 48. Annual Cereal Balance Sheet for Gu 2008 Somalia June 2008 – May 2009, FSAU. 49. Baseline study SC-UK project area - Karkaar region, Puntland May 2006. 50. Bay/Bakool agro-pastoral high potential integrated spread sheet from baseline update FSAU October
2007. 51. Questionnaires and guidelines for FSAU baselines and nutrition household assessments. 52. Food Economy Baseline Profiles Factsheets: Various FSAU. 53. Food Security Assessment Wajid, ACF Somalia. November 2007. 54. Hargeisa Urban Household Economy Assessment. FEWS-NET, FSAU, SC-UK, Municipality of
Hargeisa, Candlelight. February-March 2003. 55. Livestock Study in the Greater Horn of Africa; Somalia Country Profile, ICRC 2004. 56. Nutrition pilot project: Impact Monitoring Reports, Belet Weyne District, SC-UK April 2007, June
2007, September 2007. 57. Nutrition Update July/August 2008 FSAU Somalia. 58. Post harvest Monitoring Post-Gu Report 2008, ACF Somalia (unpublished report). 59. SC-UK food security baseline project Riverine livelihood Hiran region 9 September -8 October, 2006
(Unpublished report).

WFP/FAO Joint Mission to Somalia for technical support to FSAU on methodological improvements to the Cereal Balance Sheet. Final report, 5th November 2008.
25
ANNEX 4
FAO Cereals TP data (Import)
Code Product 2000 2001 2002 2003 2004 2005 2006 15 Wheat 2996 13336 2440 2693 603 16 Flour of Wheat 31178 29952 68504 70543 80742 133923 61776 18 Macaroni 10338 4560 21816 16782 9312 54374 3352 20 Bread 26 5 0 6 18 0 22 Pastry 46 274 1818 2434 2422 4180 3979 27 Rice Paddy 12000 1499 23 217 28 Rice Husked 2099 806 3592 31 Milled Paddy Rice 58475 43156 38795 58847 166142 128818 169520 32 Rice Broken 0 3018 200 4000 7803 20 41 Breakfast Cereals 134 65 915 72 632 56 Maize 17337 1502 297 6390 11826 2571 10213 58 Flour of Maize 1 0 10 578 3158 60 Oil of Maize 3 1567 2919 15 6188 76 Oats Rolled 53 5 18 0 130 83 Sorghum 2701 4506 1308 87 18319 84040
108 Cereals NES 295 20 0 109 Infant Food 124 165 161 30 44 478 127 111 Flour of Cereals NES 7500 17712 120 10 235 113 Cereals Prepared NES 4320 26884 18223 26 0 114 Mixes and Doughs 2 22 294 115 Food Prep. Flour Malt Extract 525 7 0 522 14 1629 2760 162 Sugar Centrifigal Raw 10700 682 38600 3400 5430 12129 36722 164 Sugar Refined 141438 231375 282529 267156 277688 230596 222868 168 Sugar Confectionery 427 695 227 1544 3374 2182 2173 172 Glucose and Dextrose 5 28 18 1 87 18 173 Lactose 370 757 2328 0 3219 13 176 Beans Dry 70 0 4009 929 542 187 Peas Dry 1121 1007 2103 8 1728 5514 191 Chick-Peas 15 27 352 201 Lentils 102 1199 1475 93 3521 3717 4991
ANNEX 5
Technical conversion factors used by FAO for Somalia Commodity Seeding rate (Kg/Ha) Extraction rate (%) Waste of supply (%) 15. Wheat 80 - 2 16. Flour of Wheat - 80 3 18. Macaroni - 100 -27. Paddy Rice 80 - 5 37. Milled Paddy Rice - 67 -56. Maize 30 - 5.5 58. Flour of Maize - 95 283. Sorghum 20 - 5.7 84. Flour of Sorghum - 95 2

WFP/FAO Joint Mission to Somalia for technical support to FSAU on methodological improvements to the Cereal Balance Sheet. Final report, 5th November 2008.
1