wfp response to the food and financial crises€¦ · wfp: 2/3 of 56 countries: cost food basket:...
TRANSCRIPT

McGill Conference on Global Food Security
5-7 October 2009
Henk-Jan Brinkman,Senior Adviser for Economic Policy
WFP Response to the Food and Financial Crises
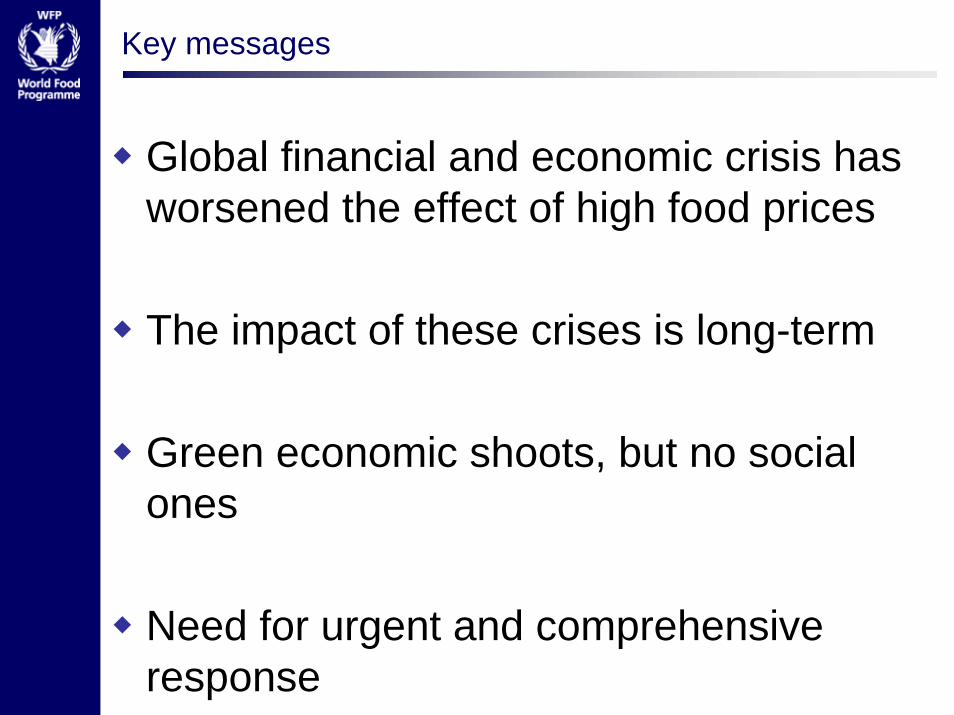
Key messages
Global financial and economic crisis has worsened the effect of high food prices
The impact of these crises is long-term
Green economic shoots, but no social ones
Need for urgent and comprehensive response

Food access compromised long-term impact
Food access = f (prices, incomes)High food prices pricesGlobal financial crisis incomes
Vulnerability at household level:High % of income spend on foodBuy more food than sell (net-buyer)High % of income from exportsHigh % of income from remittancesFew coping mechanisms

Food prices soared and fell but stay high

Food prices high at local level
FAO:
WFP: 2/3 of 56 countries: Cost food basket: > 20% above 5-year average
Wheat price ($/MT)

Prices up coping
Live
lihoo
d Diversify incomes
Spend less on non-essentials Selling some assets
Drop out of school Migration
Child labor Borrow
Selling of produc-tive assets
Selling of all assets
Spend less on essential items
Hea
lth
thre
aten
ing
activ
ities
Food
/Nut
rtio
n Cheaper food
Less nutritious food
Reduce size / number of meals
Consume wild foods, seeds
Begging for food
Entire day without eating
Eat ab normal items (e.g. plants and insects)
Chi
ld
mal
nutr
ition

Prices nutritional status: Bangladesh
Rice prices up non-rice expenditures (vegetables, protein) down underweight

Poor nutrition < age 2 stunted for life
45
50
55
60
65
70
75
80
85
90
0 6 12 18 24
Age (Months)
Leng
th (C
entim
eter
)
USAOmanNorwayIndiaGhanaBrazilBolivia
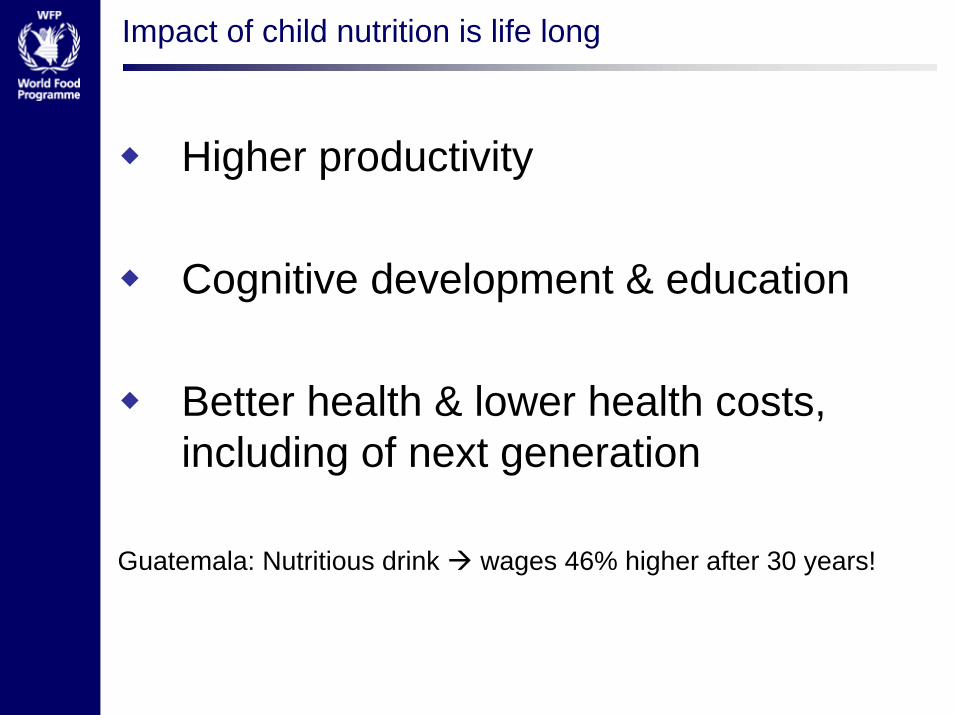
Impact of child nutrition is life long
Higher productivity
Cognitive development & education
Better health & lower health costs, including of next generation
Guatemala: Nutritious drink wages 46% higher after 30 years!

40 assessments in 2008: Food consumption down
• Quantity and quality food consumption down• School drop-out rates up in some• Sale of economic assets in some
• Impacts in absolute terms higher in towns, but severity was higher for rural poor
• New face of hunger: Salaried workers in towns and agriculturalists near towns (Ethiopia, Pakistan and Tajikistan)

Food prices will remain high
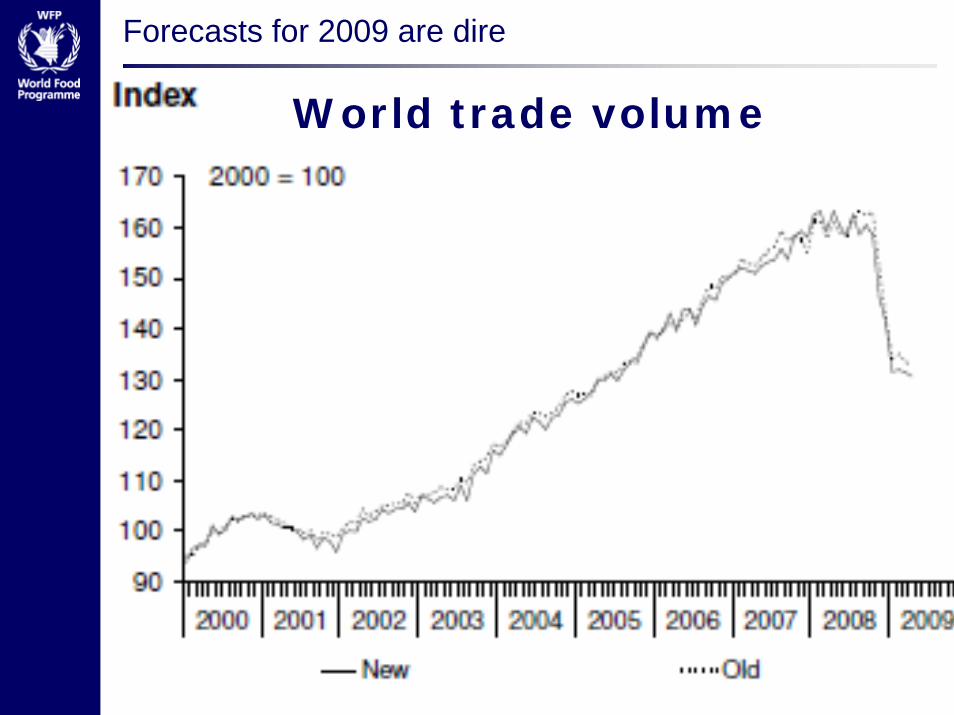
Forecasts for 2009 are dire
World trade volume

13
Framework to analyze transmission from Wall St to hungry
Exc
han
ge
rate
Exc
han
ge
rate
MACROMACRO--LEVELLEVEL HOUSEHOLD HOUSEHOLD LEVELLEVEL IMPACTSIMPACTS
HealthHealth
EducationEducation
FoodFoodinsecurity/insecurity/
HungerHunger
Reduced Reduced copingcoping
capacitycapacity
Tensions
GDP growth
Imports
Remittances
ODA
Tourism
GDP growth
Employment
Finance
Exports
Return migr
Remittances
Gvt spending
Investment
Food prices
Incomes/wages
Remittances
Social transfers
Developed countries
Developing countries
Finance
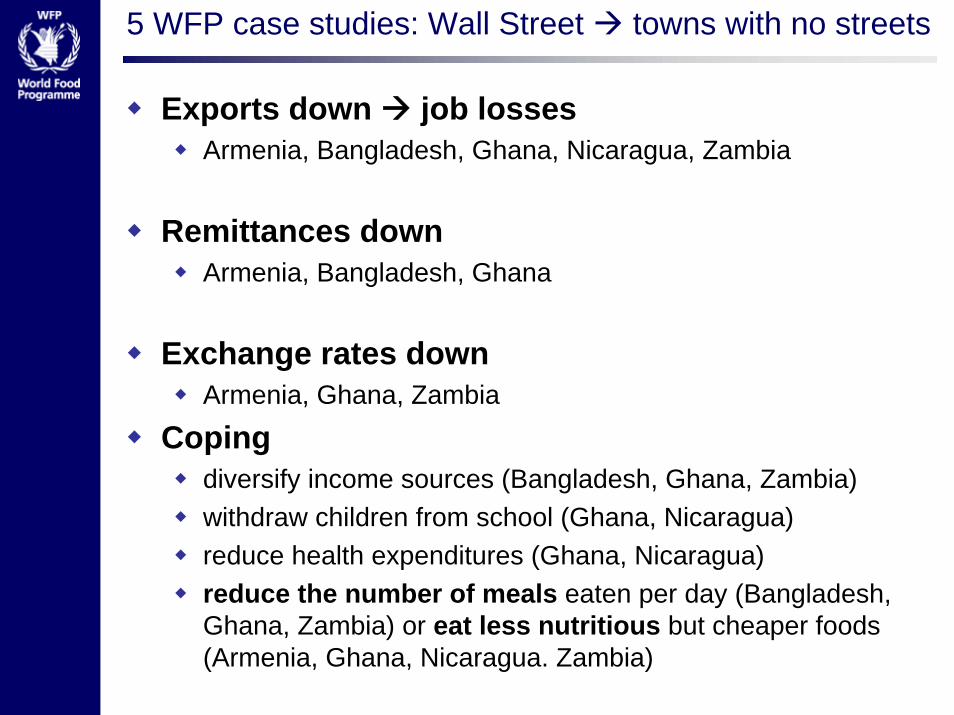
5 WFP case studies: Wall Street towns with no streets
Exports down job lossesArmenia, Bangladesh, Ghana, Nicaragua, Zambia
Remittances downArmenia, Bangladesh, Ghana
Exchange rates downArmenia, Ghana, Zambia
Copingdiversify income sources (Bangladesh, Ghana, Zambia)withdraw children from school (Ghana, Nicaragua)reduce health expenditures (Ghana, Nicaragua)reduce the number of meals eaten per day (Bangladesh, Ghana, Zambia) or eat less nutritious but cheaper foods (Armenia, Ghana, Nicaragua. Zambia)
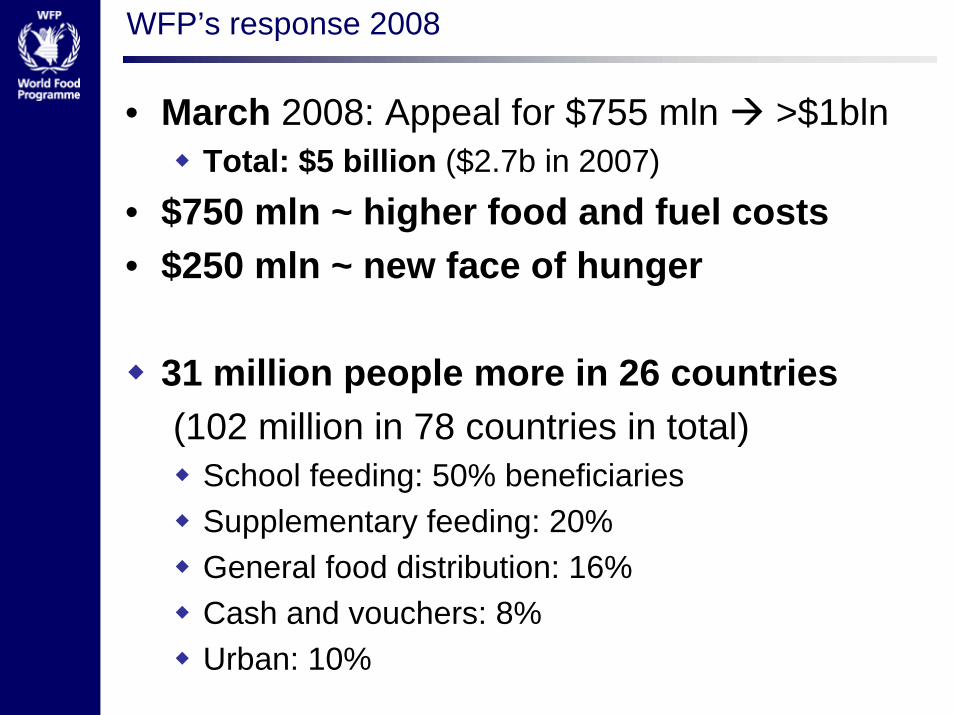
WFP’s response 2008
• March 2008: Appeal for $755 mln >$1blnTotal: $5 billion ($2.7b in 2007)
• $750 mln ~ higher food and fuel costs• $250 mln ~ new face of hunger
31 million people more in 26 countries(102 million in 78 countries in total)
School feeding: 50% beneficiariesSupplementary feeding: 20%General food distribution: 16%Cash and vouchers: 8%Urban: 10%
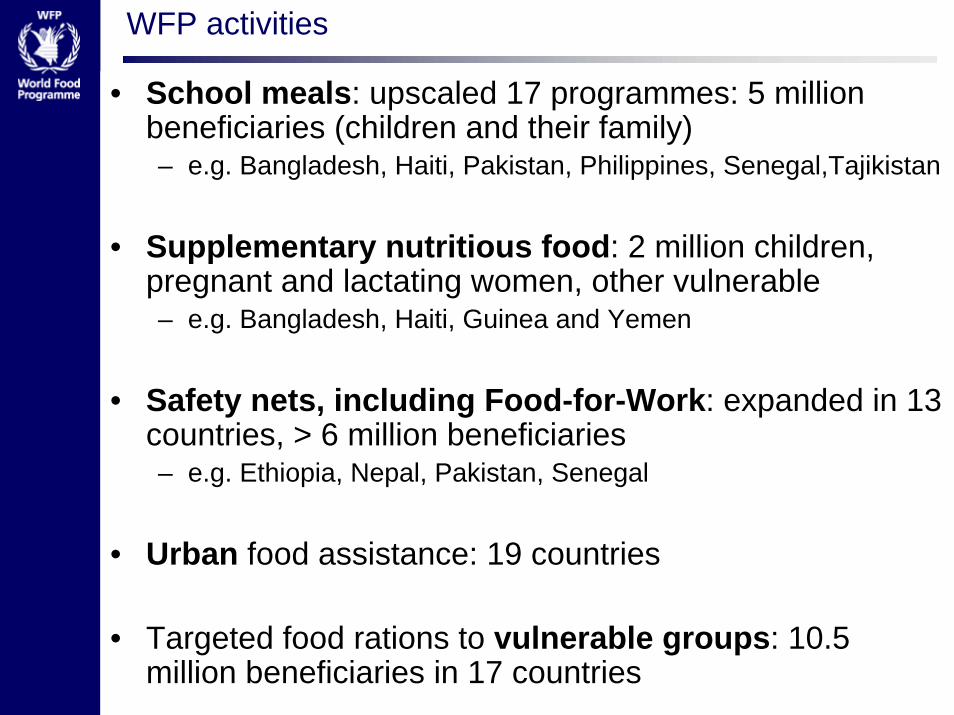
WFP activities
• School meals: upscaled 17 programmes: 5 million beneficiaries (children and their family) – e.g. Bangladesh, Haiti, Pakistan, Philippines, Senegal,Tajikistan
• Supplementary nutritious food: 2 million children, pregnant and lactating women, other vulnerable – e.g. Bangladesh, Haiti, Guinea and Yemen
• Safety nets, including Food-for-Work: expanded in 13 countries, > 6 million beneficiaries – e.g. Ethiopia, Nepal, Pakistan, Senegal
• Urban food assistance: 19 countries
• Targeted food rations to vulnerable groups: 10.5 million beneficiaries in 17 countries
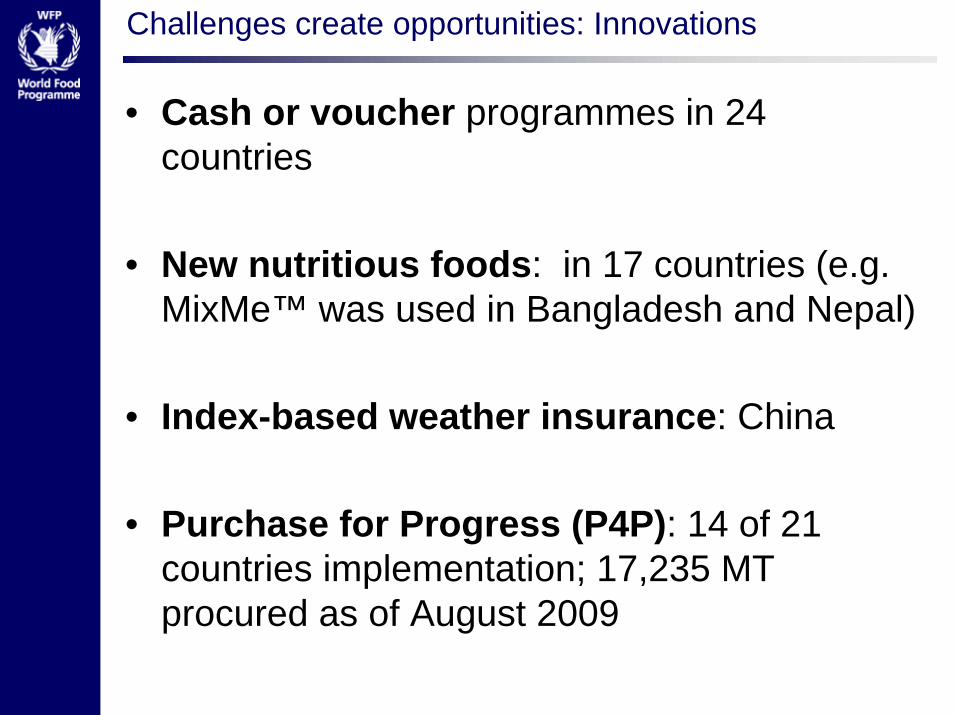
Challenges create opportunities: Innovations
• Cash or voucher programmes in 24 countries
• New nutritious foods: in 17 countries (e.g. MixMe™ was used in Bangladesh and Nepal)
• Index-based weather insurance: China
• Purchase for Progress (P4P): 14 of 21 countries implementation; 17,235 MT procured as of August 2009
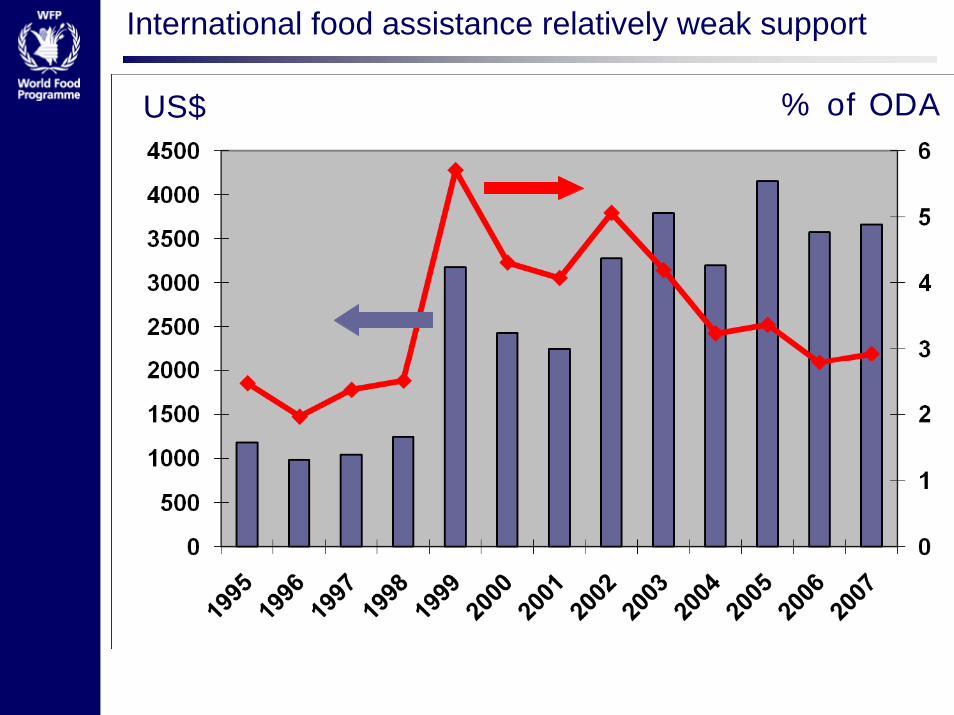
International food assistance relatively weak support
US$ % of ODA

Global food aid deliveries are down
Metric tons
Thank you

Demand > Supply prices up: Agreement on list, but not on relative weight
DemandEmerging markets, changing demand patterns BiofuelsInstitutional investorsDepreciating dollar
Supply Low stocksWeather-related shocksLow productivity growthExport restrictionsOil price
Inputs: Fertilizer and transport costsOutputs: Link between food and energy prices

Poor spend more on food
01020304050607080
2 3 4 5 6 7Log of per capita income in U.S. dollars
Food
wei
ght i
n C
PI (%
)
USA
Bangladesh
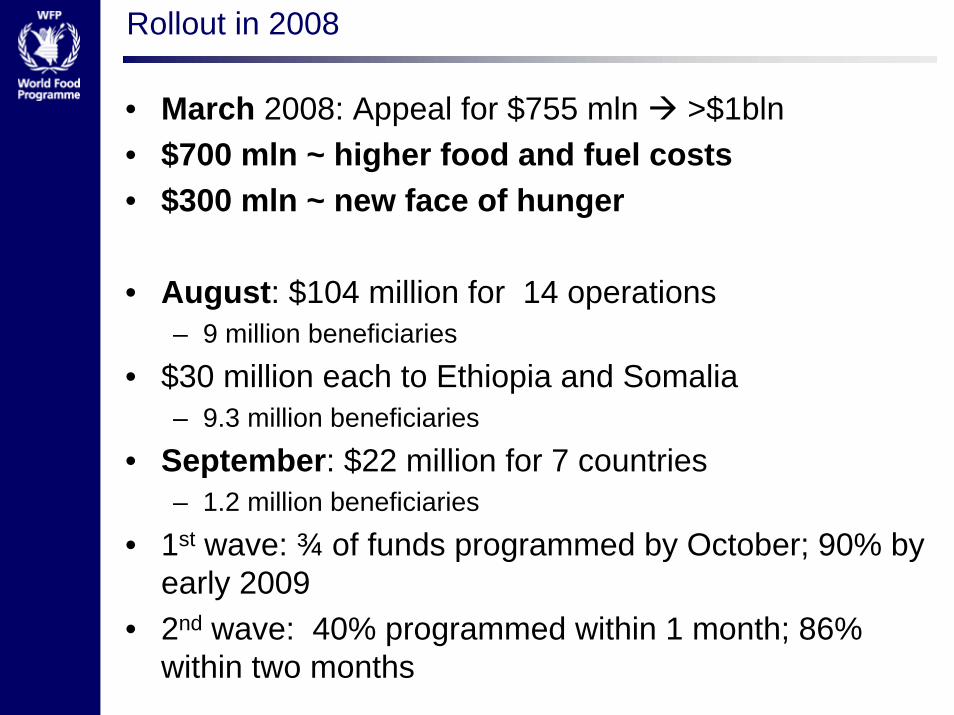
Rollout in 2008
• March 2008: Appeal for $755 mln >$1bln• $700 mln ~ higher food and fuel costs• $300 mln ~ new face of hunger
• August: $104 million for 14 operations – 9 million beneficiaries
• $30 million each to Ethiopia and Somalia – 9.3 million beneficiaries
• September: $22 million for 7 countries – 1.2 million beneficiaries
• 1st wave: ¾ of funds programmed by October; 90% by early 2009
• 2nd wave: 40% programmed within 1 month; 86% within two months
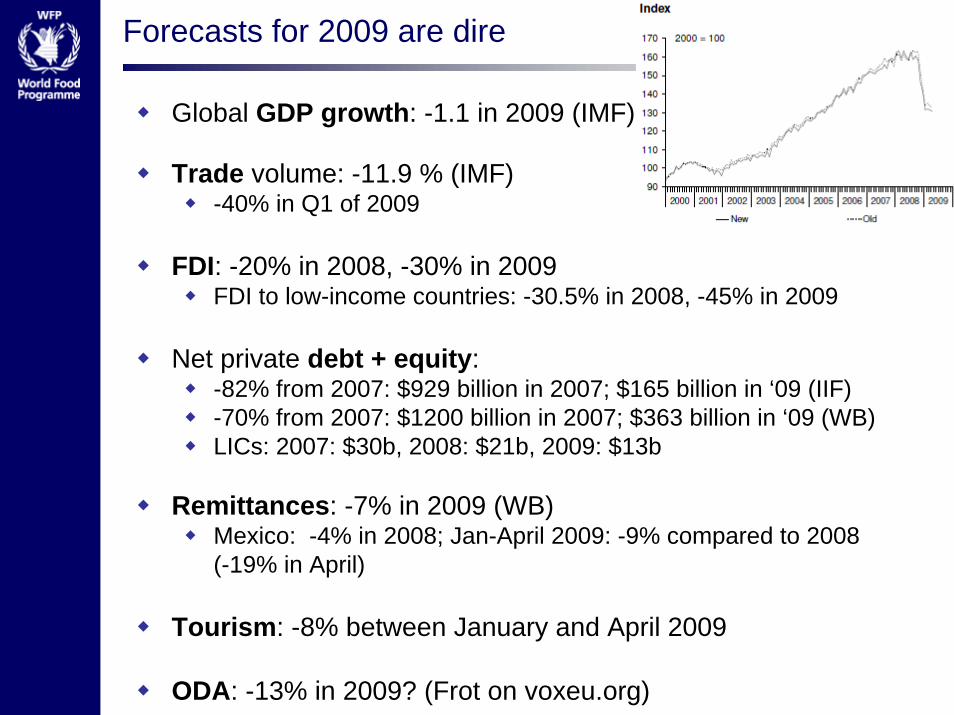
Forecasts for 2009 are dire
Global GDP growth: -1.1 in 2009 (IMF)
Trade volume: -11.9 % (IMF) -40% in Q1 of 2009
FDI: -20% in 2008, -30% in 2009FDI to low-income countries: -30.5% in 2008, -45% in 2009
Net private debt + equity:-82% from 2007: $929 billion in 2007; $165 billion in ‘09 (IIF)-70% from 2007: $1200 billion in 2007; $363 billion in ‘09 (WB)LICs: 2007: $30b, 2008: $21b, 2009: $13b
Remittances: -7% in 2009 (WB)Mexico: -4% in 2008; Jan-April 2009: -9% compared to 2008 (-19% in April)
Tourism: -8% between January and April 2009
ODA: -13% in 2009? (Frot on voxeu.org)
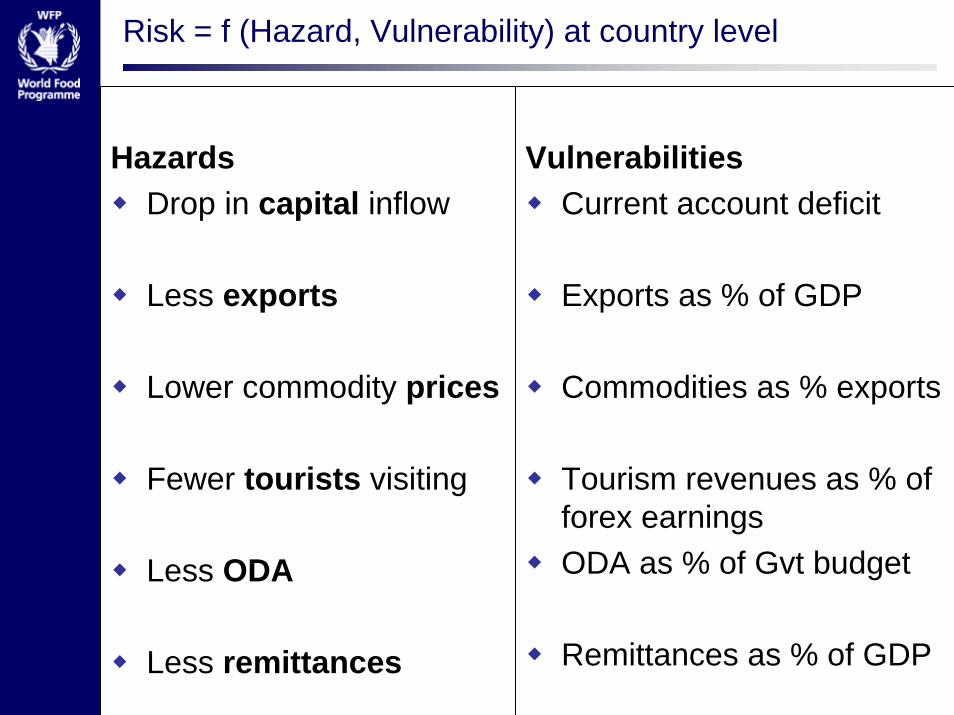
Risk = f (Hazard, Vulnerability) at country level
HazardsDrop in capital inflow
Less exports
Lower commodity prices
Fewer tourists visiting
Less ODA
Less remittances
VulnerabilitiesCurrent account deficit
Exports as % of GDP
Commodities as % exports
Tourism revenues as % of forex earningsODA as % of Gvt budget
Remittances as % of GDP
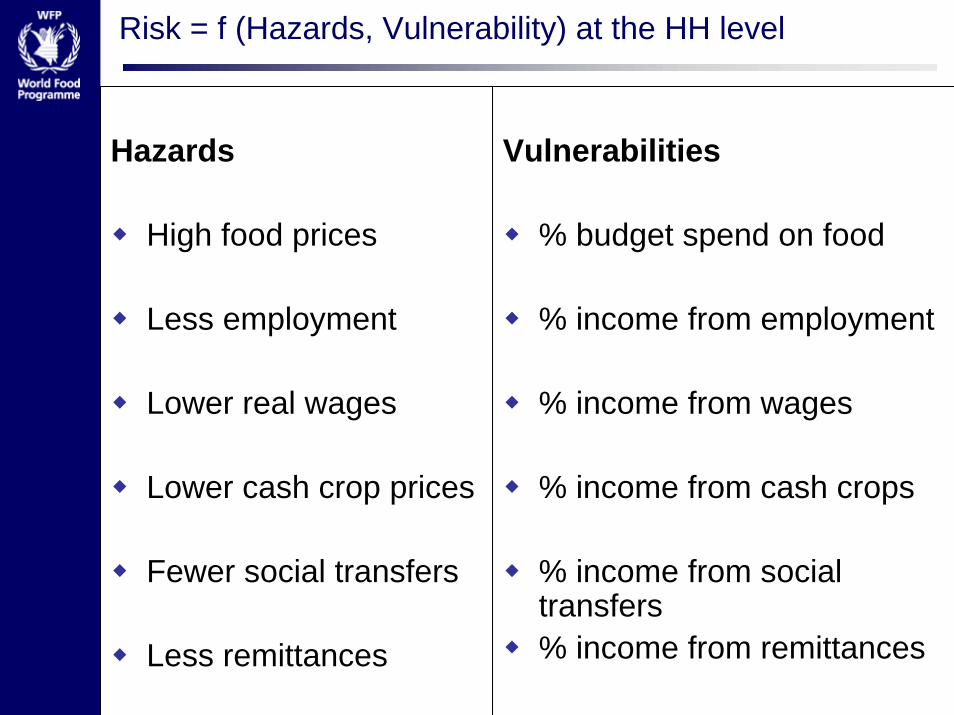
Risk = f (Hazards, Vulnerability) at the HH level
Hazards
High food prices
Less employment
Lower real wages
Lower cash crop prices
Fewer social transfers
Less remittances
Vulnerabilities
% budget spend on food
% income from employment
% income from wages
% income from cash crops
% income from social transfers% income from remittances