whangarei district council - whangarei, new zealand · whangarei district council ... cr c b...
TRANSCRIPT

Whangarei District Council
Notice of Meeting A meeting of the Whangarei District Council will be held in the Council Chamber, Forum North, Whangarei on:
Wednesday
28 November 2012 10.00 am
Committee His Worship the Mayor (Chairperson)
Cr C B Christie Cr S J Deeming Cr A J Edwards
Cr S M Glen Cr P R Halse
Cr J S Jongejans Cr G M Martin
Cr B L McLachlan Cr S L Morgan
Cr K J Sutherland Cr W L Syers
Cr M R Williams Cr J D T Williamson

Whangarei District Council CONFIDENTIAL – not for publication
Notice of Meeting A meeting of the Whangarei District Council will be held in the Council Chamber, Forum North, Whangarei on:
Wednesday
28 November 2012 10.00 am
Committee His Worship the Mayor (Chairperson)
Cr C B Christie Cr S J Deeming Cr A J Edwards
Cr S M Glen Cr P R Halse
Cr J S Jongejans Cr G M Martin
Cr B L McLachlan Cr S L Morgan
Cr K J Sutherland Cr W L Syers
Cr M R Williams Cr J D T Williamson

INDEX
Item No Page No
1. Public Forum ............................................................................................................................. 1
2. Minutes of a Meeting of the Whangarei District Council held 24 October 2012 ....................... 2
3. Minutes of an Extra-ordinary Whangarei District Council meeting held14 November 2012.................................................................................................................... 6
4. Minutes of a Meeting of the 20/20 Inner City Development (City Centre/Urban Design)Subcommittee held 17 October 2012 ....................................................................................... 8
5. Police Report............................................................................................................................. 9
6. Northland Regional Council Representation Arrangements Review ......................................12WDC Submission on the NRC Representation Arrangements Review..................................15Final Proposal for the NRC 2012 Representation Arrangements Review..............................18NRC’s submission on the LGA (2002) Amendment Bill..........................................................44
7. Submission on the Proposed Regional Policy Statement.......................................................80
CONFIDENTIAL INDEXItem No Page No
C.1 Contract Extension.................................................................................................................... 1
C.2 Property Transaction...............................................................................................................13
C.3 Property Proposal ...................................................................................................................18
Recommendations contained in the Council agenda are NOT Council decisions. Please refer to Council minutes for resolutions

Whangarei District Council 26 September 2012
1. Public Forum
Reporting officer Carolyne Brindle (Senior Meeting Co-ordinator)
Date 12 November 2012
Public ForumAppendix F in Standing Orders allows for a period of up to 15 minutes to be set aside for a public forum at the commencement of each monthly council meeting.
The time allowed for each speaker is 3 minutes.
Members of the public who wish to participate should send a written application setting out the subject matter and the names of the speakers to the Chief Executive Officer at least 5 working days before the day of the meeting.
SpeakersThere were no applications to speak at this month’s Public Forum received prior to the agenda being circulated.
Public Forum – Report on actions taken Where practicable actions taken on matters raised by previous speakers are reported back to public forum.
Speaker/Subject Report
Bart van der Meer – Setting up a Volunteer Centre in Whangarei
Councillors Jongejans, Edwards and His Worship the Mayor and staff met with Mr van der Meer on a number of occasions over the last month.
These conversations covered suitable actions to progress the concept of a volunteer centre in Whangarei and how council processes, including the LTP and community funding, guide council’s involvement.
Mr van der Meer presented information from other volunteer centres around the country and identified the range of involvement from the respective local authorities. The number of funding applications their Trust were making to secure funding for the initiative was also discussed and the Mayor’s Office has provided a letter of support.
Kim Feickert – Infrastructure & Services - Roading
The Infrastructure and Services Committee considered the proposed seal extension programme on 10 October. Council resolved to approve the sealing of Whangaruru North, Old School and McKinley Roads over the next 3 years.
Roads are to be sealed under the council’s ratepayer subsidised seal extension scheme, which requires each property on the road section to be sealed to contribute $2,500 towards the sealing project. The roads are to be sealed one per year and the first road to be sealed will be the project that receives ratepayer agreement first.
Council has agreed to review the seal extension programme after three years.
Whangarei District Council 28 November 2012
2. Minutes: Whangarei District Council Wednesday, 24 October 2012
Minutes of a meeting of the Whangarei District Council held in the Council Chamber, Forum North on Wednesday 24 October 2012 at 10.00am
Present:His Worship the Mayor M C A Cutforth (Chairperson)
Crs C B Christie, S J Deeming, A J Edwards, S M Glen, P R Halse, J S Jongejans, G M Martin, B L McLachlan, S L Morgan, K J Sutherland, W L Syers, M R Williams and J D T Williamson
Also present: Bart van der Meer, Kim Feickert, (Public Forum)Acting Area Commander Tracy Phillips (New Zealand Police)John Scott (Director Audit New Zealand)
In Attendance:Chief Executive Officer (M P Simpson), Group Manager District Living (P Dell), Group Manager Infrastructure and Services (S Weston), Group Manager Support Services (A Adcock), Group Manager Positive Growth (J Thompson), District Promotions and Tourism Manager (T McInnes), Economic Development Manager (P Gleeson), Financial Controller (H McKenzie), Property Manager (M Hibbert), Community Services Manager (O Thomas), Roading Manager (J Devine), Venues and Events Manager (J Lynch), Business Analyst (S Gavin), Financial Accountant (K Welford), Senior Communications Advisor (R Pascoe), Community Safety Officer (D Palmer), Executive Assistant (J Walters), Councillor Support (J Crocombe) andSenior Meeting Co-ordinator (C Brindle)
1. Public Forum
Bart van der Meer – Setting up a Volunteer Centre in WhangareiKim Feickert – Infrastructure and Services (Roading)
2. Confirmation of Minutes of a Meeting of the Whangarei District Council held on 26 September 2012
Moved: Cr MartinSeconded: Cr Jongejans
“That the minutes of the meeting of the Whangarei District Council held on Wednesday 26 September2012, including the confidential section, having been circulated, be taken as read and now confirmed and adopted as a true and correct record of proceedings of that meeting.”
CARRIED
3. Confirmation of Minutes of an Extra-ordinary Meeting of the WhangareiDistrict Council meeting held 20 September 2012
Moved: Cr JongejansSeconded: Cr Morgan
“That the minutes of Extra-ordinary meeting of the Whangarei District Council held on Thursday 20 September 2012, including the confidential section, having been circulated, be taken as read and now confirmed and adopted as a true and correct record of proceedings of that meeting.”
CARRIED

Whangarei District Council 28 November 2012
4. Police Report
Inspector Tracy Phillips spoke to the report and answered questions from Councillors.
Moved: Cr GlenSeconded: Cr Deeming
“That the information be received.”CARRIED
5. 2011-2012 Annual Report
John Scott provided comment on audit matters and answered questions from Councillors.
Moved: Cr SyersSeconded: Cr McLachlan
“1. That the Annual Report for the year ending 30 June 2012 and Summary Annual Report for the year ending 30 June 2012 be adopted.
2. That Council authorises the Chief Executive Officer to make any minor amendments, typographical/formatting/editing changes if required.
On the motion being put Cr Williams called for a division:
For the motion:Crs Halse, Edwards, Deeming, Williamson, McLachlan, Martin, Glen, Jongejans, Christie, Sutherland, Morgan, Syers and His Worship the Mayor (13)
Against the motion:Cr Williams
CARRIED
6. Tender Report for Contract 12047 Stormwater and SewerageMaintenance and Operation
Moved: Cr McLachlanSeconded: Cr Morgan
“That Contract 12047 Stormwater and Sewerage Maintenance and Operation be awarded to Hydrotech Drainage and Plumbing Ltd for the sum of four million, one hundred and sixty one thousand, two hundred and fourteen dollars and eighty seven cents ($4,161,214.87).
CARRIED
Cr Martin declared a potential conflict of interest and withdrew from the table taking no part in discussions or voting on this item.Cr Halse requested it be recorded that he is currently chairman of the Hikurangi Swamp Working Party (not a formal committee of council).The Chief Executive Officer declared an interest and declined to comment on this item.

Whangarei District Council 28 November 2012
7. Review of Class 4 Gambling Policy
Moved: Cr HalseSeconded: Cr Deeming
“1. That council adopt the Statement of Proposal for the review of the Whangarei District Class 4 Gambling Policy and seeks submissions to the proposed Whangarei District Class 4 Gambling Policy in accordance with the special consultative procedure as provided in section 83 of the Local Government Act 2002.
2. That council gives notice of the Statement of Proposal to each society that holds a class 4 venue licence for a venue in the district and to organisations representing Maori in the district, and to gambling focus group members by sending to each of these a copy of the Summary of Information contained in the Statement of Proposal.”
CARRIED
8. Review of Board Venue Policy
Moved: Cr DeemingSeconded: Cr Williamson
“1. That council adopt the Statement of Proposal for the review of the Whangarei Board Venue Policy and seeks submissions to the proposed Whangarei District Board Venue Policy in accordance with the special consultative procedure as provided in section 83 of the Local Government Act 2002.
2. That council gives notice of the Statement of Proposal to the New Zealand Racing Club, organisations representing Maori in the district and to each gambling focus group member, by sending to each a copy of the summary of information contained in the Statement of Proposal.”
CARRIED
9. Local Government in Northland
Moved: Cr SyersSeconded: Cr Halse
“1. That this information be received.
2. That, as a result of discussion at this meeting:
That staff work with all elected members to identify options for more detailed analysis.
A detailed report examining these options is prepared.
A public consultation program and associated materials are developed.
The detailed report and consultation program are brought back to council for approval.”
CARRIED
10. Northland Events Centre Trust – Trust Deed Amendment
Moved: His Worship the MayorSeconded: Cr Syers
“That Whangarei District Council approve the amendments to the Northland Events Centre Trust Deed clause 4.3.”
CARRIED

Whangarei District Council 28 November 2012
The meeting closed at 11.20am
Confirmed this 28th
day of November 2012
M C A Cutforth (Chairperson)

Whangarei District Council 28 November 2012
3. Minutes: Extra-ordinary Whangarei District Council Wednesday 14 November 2012
Minutes of an Extra-ordinary Whangarei District Council meeting held in the Council Chamber, Forum North on Wednesday 14 November 2012 at 11.00am
Present:His Worship the Mayor M C A Cutforth (Chairperson)
Crs C B Christie, S J Deeming, A J Edwards, S M Glen, P R Halse, G M Martin, B L McLachlan, S L Morgan, K J Sutherland, M R Williams and J D T Williamson
Apologies:Crs J S Jongejans and W L Syers
Moved: Cr MartinSeconded: Cr Edwards
“That the apologies be sustained.”CARRIED
In Attendance:Chief Executive Officer (M P Simpson), Group Manager Support Services (A Adcock), Property Manager(M Hibbert), Councillor Support (J Crocombe) and Senior Meeting Co-ordinator (C Brindle)
1. Submissions for the Proposed Hotel Development 8-10 Dent Street
Moved: Cr DeemingSeconded: Cr Morgan
“1. That any submissions identified as being received after the close of the submission period be accepted for consideration by council.
2. That the submissions be received and heard.”CARRIED
Cr Edwards requested that it be noted that he had no involvement with his employer’s contractual arrangement with the council and provided assurance he has no conflict of interest.
The submitters who spoke to their submissions are as follows:
Vince Cocurullo (NorthChamber)Paul BerksRohan BaileyMr BakkerRobyn HembryBeverley Ngaropo (Forum North Child Care Centre Representative)Margaret HicksDavid LaurieVivienne ShepherdDon HedgesJacqui OrganDeanna Lee NihaIan Reeves Lisa ThompsonAlbert ErueraSelwyn Norris

Whangarei District Council 26 September 2012
Mira Norris.
The meeting closed at 1.00pm
Confirmed this 28th day of November 2012
M C A Cutforth (Chairperson)

Whangarei District Council 28 November 2012
4. Minutes: 20/20 Inner City Development (City Centre/Urban Design) Subcommittee Wednesday, 17 October 2012
Minutes of a meeting of the20/20 Inner City Development (City Centre/Urban Design) Subcommittee held in the Council Chamber Forum North on Wednesday, 17 October 2012 at 1.02pm
Present:Cr P R Halse (Chairperson)
Crs S J Deeming, G M Martin,, K J Sutherland and M R Williams
Apology:Cr A J Edwards
Moved: Cr MartinSeconded: Cr Deeming
“That the apology be sustained.”CARRIED
Absent:His Worship the Mayor M C A Cutforth
Also present:Crs C B Christie (1.14pm), S M Glen (1.07pm), J S Jongejans, S L Morgan and B L McLachlan
In Attendance:Chief Executive Officer (M P Simpson), Group Manager Environment (P Dell), Property and Community Services Manager (M Hibbert), Senior Specialist Urban Design (N Karlovsky), Strategic Planner (I Prentice)and Senior Meeting Co-ordinator (C Brindle)
1. CBD Upgrade State 1Moved Cr HalseSeconded Cr Martin
“1. That the report be received.
2. That the project proceeds to further stakeholder engagement and detailed design.”
3. That the final design be presented to Council for approval and that the construction tenders align with WDC full budget.””
CARRIEDCr Glen joined the meeting at 1.07pm.Cr Christie joined the meeting at 1.14pm.
The meeting closed at 1.48pm
Confirmed this 28th day of November 2012
P R Halse (Chairperson)

Whangarei District Council 28 November 2012
5. Police Report
Reporting officer Carolyne Brindle (Senior Meeting Co-ordinator
Date 12 November 2012
The attached report has been received from Relieving Area Commander, Acting Area Commander Tracy Phillips for Whangarei/Kaipara.
RecommendationThat the information be received.
Attachment
Police Report

Whangärei / Kaipara Area
Council Report Submitted November 2012
Introduction
Crime
Road Policing
Whangärei /Kaipara Area

Whangärei / Kaipara Area
Operation Fire Alarm

Whangarei District Council 28 November 2012
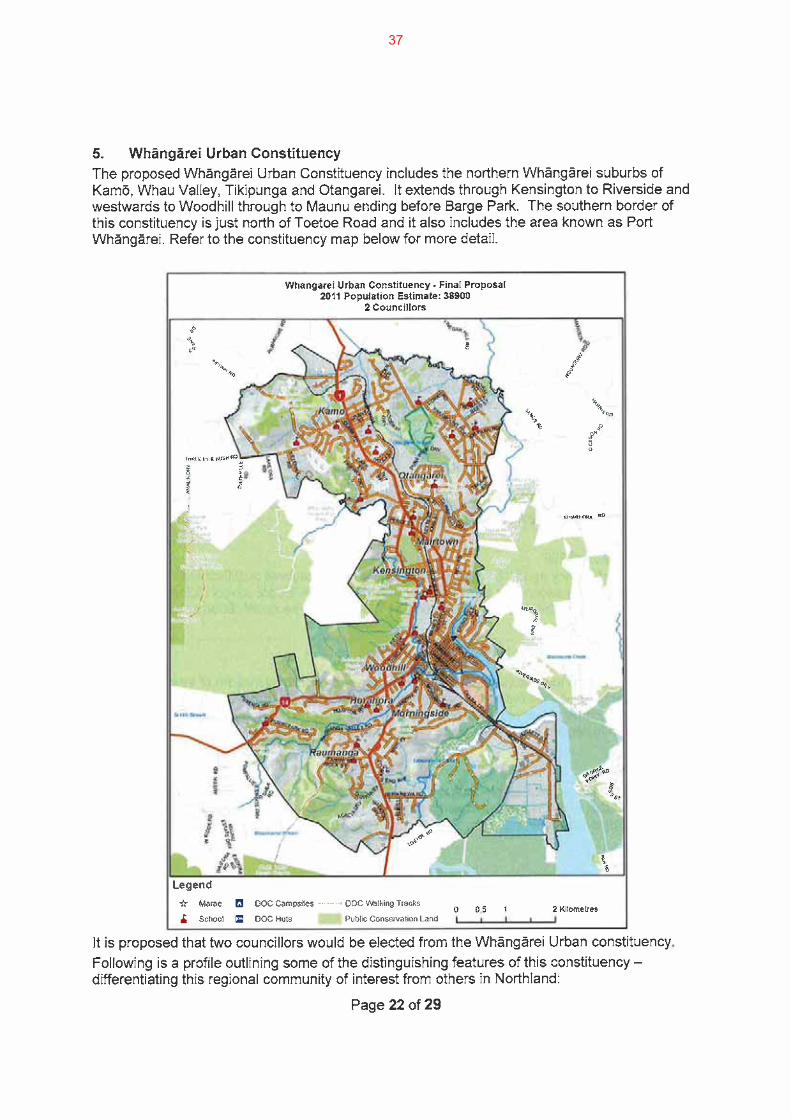
6. Northland Regional Council Representation Arrangements Review Final Proposal
Reporting officer Dominic Kula (Governance Manager)
Date 13 November 2012
Vision, mission and values This item is in accord with Council’s vision, mission and values statement as it considers communities of interest and the fair and effective representation of the region
Local Government Act 2002 – The four well-beings
Cultural The review considers "communities of interest" in the region, which has cultural implications
Economic No direct link
Environmental No direct link
Social The review considers how the region is to be represented, which has social implications
BackgroundThe Local Electoral Act 2001 (the Act) requires all local authorities to carry out a representation arrangements review at least once every six years. Submissions on the Initial Proposal for the Northland Regional Council (NRC) representation arrangements review closed on 1 October 2012.
The notified Initial Proposal moved away from the current constituency arrangement proposing an eight constituency model with nine councillors, being Te Hiku (one), Hokianga–Kaikohe (one), Coastal North (one), Coastal Central (one), Hikurangi–and Kaipara (one).
Whangarei District Council (WDC) considered that the Initial Proposal did not best meet the legislation’s requirements nor the regional representation needs of Northland. Existing constituencies based on territorial authority boundaries were considered to recognise established communities of interest and provide effective and fair representation. As a result WDC submitted in opposition to the Initial Proposal (Attachment 1). NRC received 38 submissions on its proposal, with 22 in support and 16 in opposition.
Having considered submissions NRC’s Final Proposal (Attachment 2) provides for nine regional councillors elected from seven constituencies being, Te Hiku (one), Hokianga – Kaikohe (one), Coastal North (two) Hikurangi-
Concerns relating to the legislation’s requirement for regional communities of interest, effective representation and fair representation remain however and, for reasons that will be outlined in more detail below, WDC are in opposition to the Final Proposal. It is anticipated that this Agenda will, subject to any changes made at the Council meeting of 28 November, form the basis of a WDC appeal of the Final Proposal. The Agenda should be read in conjunction with WDC’s submission on the Initial Proposal which will also form part of any appeal of the Final Proposal.
Identifying regional communities of interestIn outlining the key factors that a local authority must address when determining their representation proposals the October 2011 Local Government Commission (the Commission) Guidelines to Assist Local Authorities in Undertaking Representation Reviews (the Guidelines) identify communities of interest, effective representation and fair representation as inter-related considerations.
While the term ‘community of interest’ is not defined in the Act the Guideline recognises that it is “a term that can mean different things to different people”. The Guideline goes on to broadly define a community of interest in terms of a ‘sense of community identity and belonging’ and ‘dependence on shared facilities and services in an area’. Giving proper consideration to defining local communities of interest is identified as anessential part of the representation review process and a necessary precursor to determining effective representation.
Whangarei District Council 28 November 2012
On the basis of information provided WDC have outstanding concerns regarding communities of interest identified in the Final Proposal. Other than listing ‘profile’ statistics in each constituency limited detail is provided on how factors considered by NRC contributed to forming the boundaries in the Final Proposal and there is no compelling argument as to how boundaries proposed identify communities of interest better than the status quo. There is also limited consideration of why a dramatic change to communities of interest is required now given that communities of interest based on territorial authority boundaries have been deemed adequate by NRC for the last 20 years.
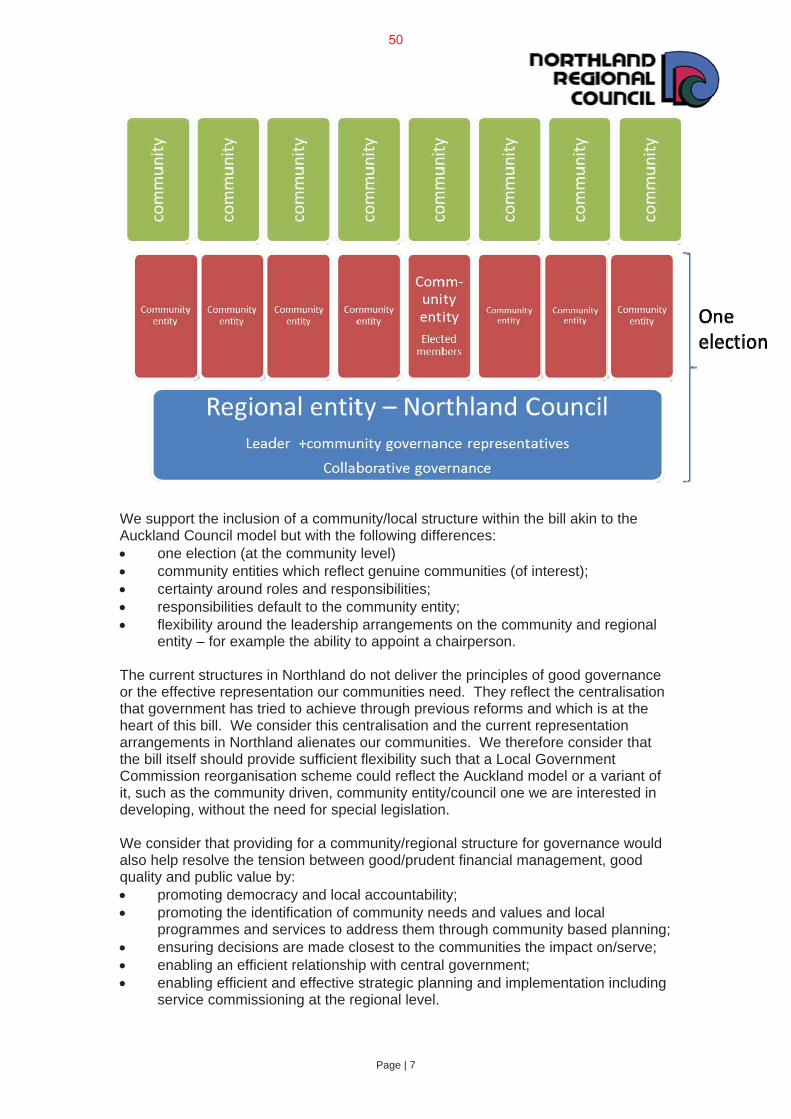
NRC’s submission on the Local Government Act (2002) Amendment Bill (Attachment 3) may however provide insight to the thinking supporting this change. Section 4 of that submission is particularly relevant as it outlines NRC’s support for a Northland governance structure based on one regional entity supported by “community entities which reflect genuine communities (of interest)”. The diagrammatic representation of thatgovernance model (page seven of the attached NRC submission) envisions eight community entities to reflect communities of interest. The Initial Proposal was also based on eight communities of interest. NRC’s submission on the Local Government Act (2002) Amendment Bill predates hearings being held on the Initial Proposal and the subsequent reduction to seven communities of interest, primarily as a result of submissions, in the Final Proposal.
While the first principles approach taken by NRC in defining communities of interest is noted, as are changes included in the Final proposal as a result of submissions, the different interpretations as to where communities of interest actually fall can be seen in the diversity of submissions for and against the Initial Proposal. WDC remains convinced that communities of interest would be better meet through alignment of constituencies to territorial authority and/or ward boundaries. This position is supported by the Guideline which highlights the inter-related nature of communities of interest and effective representation in stating that;
The Commission also agrees that it is appropriate for the different local authority electoral subdivisionboundaries (e.g. constituency and ward boundaries) to coincide as far as is practicable. This supports communities of interest and local electors’ identification with their area. In turn this can facilitate participation such as standing as a candidate and voting at local elections.
Identifying effective representationWDC’s submission on the Initial Proposal argued that effective representation would better be achieved by the status quo based on territorial authority boundaries. Should NRC consider smaller constituencies necessary to achieve it’s goal of ‘strengthening democratic representation at a more meaningful regional community of interest level’ it was argued that the community is likely to be better served by a revised proposal which keeps existing constituencies based on territorial authority boundaries but further subdividesthese to mirror the ward structure of territorial authorities (where necessary wards within each territorial authority boundary could be joined to form a subdivided constituency).
This position was in part based on the requirements of Section 19U(c) of the Act which states that in determining the review of representation arrangements for elections of regional councils the regional council and, where appropriate, the Commission must ensure “that, so far as is practicable, constituency boundaries coincide with the boundaries of 1 or more territorial authority districts or the boundaries of wards”.
The term so far as is practicable is not defined in the Act but if taken by dictionary definition could broadly translate to ‘so far as is capable of being done’. So far as we are aware the Commission has not set criteria around this provision nor has a determination of the Commission been challenged on this point of law. Theterm is peppered throughout New Zealand legislation however. While the Commission’s consideration of this point in relation to the Final Proposal will be fact specific the case law should assist in determining how the parameters are found.
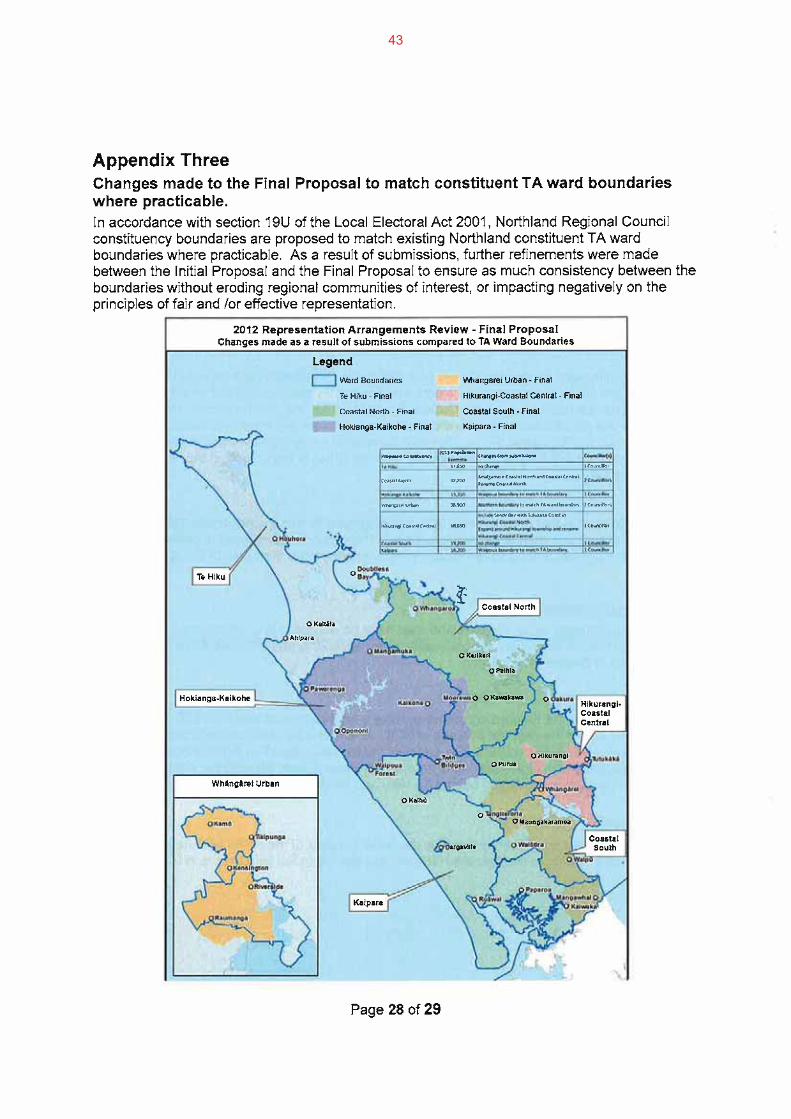
What is clear from both the Act and the Guideline is that the key factors that must be considered through a representation review are inter-related rather than one being more important than, or achieved at the expense of, another. While NRC’s Final Proposal makes changes to align constituency boundaries in some areas the points at which the boundaries coincide are relatively few compared to current representation arrangements (see Appendix Three of the Final Proposal). As outlined above WDC consider that communities of interest can be better achieved through mirrored territorial authority boundaries with a further subdivision based on wards if necessary. Mirrored boundaries would avoid duplication and confusion, empowering communities to serve their own needs and aspirations whilst also contributing to regional decision-making.
In this context it is considered that the boundaries of constituencies in the Final Proposal will not provide effective representation and the Initial Proposal as notified is not considered to meet the requirements of

Whangarei District Council 28 November 2012
19U(a). Given the above discussion of communities of interest the extent to which constituency boundaries should practicably, coincide with the boundaries of ‘1 or more’ territorial authority districts or the boundaries of wards under 19U(c) becomes a key consideration for the Commission.
WDC consider that the current constituencies based on territorial authority boundaries (or some subdivision thereof based on ward boundaries) meets communities of interest while satisfying the requirements of 19U(c).
Identifying fair representationUnder this provision, membership of constituencies is required to provide approximate population equality per councillor. This ensures that all councillors represent approximately the same number of residents. The legal requirement for fair representation is calculated using what is known as the “+/- 10% rule”.
In reaching it’s Final Proposal NRC has declined some submissions on the basis of non compliance with fair representation criteria while supporting other submissions that create non compliance but were deemed to comply with regional communities of interest. This has resulted in non compliance with fair representation criteria in the proposed Hokianga – Kaikohe and the es which will need to be considered by the Commission.
It is clear from the Initial Proposal that, should the Commission find in favour of WDC, current constituencies based on territorial authority boundaries meet the legal requirement for fair representation
Requested amendments to the Final ProposalIt is considered that the Final Proposal does not best meet the regional representation needs of Northland. Existing constituencies based on territorial authority boundaries are considered to recognise established communities of interest and provide effective and fair representation. As a result WDC seek that the Commission retain the current constituencies based on territorial authority boundaries.
Should the Commission consider smaller constituencies necessary WDC submit that this would be best achieved through a proposal which keeps existing constituencies based on territorial authority boundaries but further subdivides these to mirror the ward structure of territorial authorities (where necessary wards within each territorial authority boundary could be joined to form a subdivided constituency).
However, notwithstanding the comments made in the paragraph above, WDC submit that the status quo should prevail at this time.
Recommendation1. That Council receive this information.
2. That Council adopt the relevant sections of this agenda as an appeal on the Final Proposal for the Northland Regional Council 2012 Representation Arrangements Review.
3. That Council authorises the Chief Executive Officer to make any changes agreed at this meeting and any necessary drafting, typographical or presentation corrections required to finalise the appeal.
4. That the Chief Executive Officer and the Chair of the Finance and Support Committee be delegated to be heard in support of the adopted appeal and undertake any actions required to conclude Whangarei District Council participation in the representation review process.
Attachments
1 WDC submission on the Northland Regional Council Representation Arrangements Review 2012
2 Final proposal for the Northland Regional Council 2012 Representation Arrangements Review
3 Northland Regional Council’s submission on the Local Government Act (2002) Amendment Bill


Page | 1
Northland Regional Council’s submission to the Local Government and Environment Select Committee
In the matter of: The Local Government Act 2002 Amendment Bill
July 2012
Northland Regional Council (council) welcomes the opportunities to submit on the Local Government Act 2002 Amendment Bill (the bill). We think Northland’s local governance and its local government structures must be reformed. We are committed to ensuring this reform happens for the benefit of Northland communities. This submission was signed off in principle by the council and submitted under delegated authority. We would like to be heard in support of our submission.
1. Council’s key messages on the bill:
1. We welcome the examination of the purpose and role of local government and the opportunity to ensure structures are fit for purpose.
2. We support keeping the purpose of local government as it is in section 10 of the Local Government Act 2002. We do not support the change proposed by clause 7.
3. We want the bill to deliver sufficient flexibility for the Local Government Commission’s reorganisation scheme to promote optimum good local governance and government for a community / communities without special legislation being necessary.
4. Local government is inherently an expression of local democracy and community empowerment.
5. Communities have the right to participate in decision making.
6. Local government is and must be accountable – to its communities. We support the committee exploring options that will deliver this accountability.
7. Communities – their needs and values – are diverse.
8. Services must be designed to meet community needs and values – to enable sustainable communities - to promote quality of life and community well-being. We therefore think the purpose of local government should not be changed.
9. Service delivery models are not the same as governance models. Governance models must support communities as well as sensible, effective and efficient service delivery.
10. A community/regional structure for local government in Northland will achieve the best outcomes for Northland and should be provided for in the bill.

Page | 2
2. Purpose of local government – clause 7:
The purpose of local government is to empower, reflect, recognise and provide for the values and interests of local communities, to enable the development of sustainable communities, and to be accountable to those communities. Local government is inherently an expression of local democracy and community empowerment.
The council therefore supports retaining section 10(a) and section 10(b) of the Local Government Act 2002 – that is we support keeping the current purpose: “The purpose of local government is— (a) to enable democratic local decision-making and action by, and on behalf of, communities(b) to promote the social, economic, environmental, and cultural well-being of communities, in the present and for the future”.
The well-being of Northland communities underpins the decisions we make. There are core needs and values within Northland – clean water, employment, adequate infrastructure - and core services – wise management of natural and physical resources, regional promotion, efficient and effective planning and funding - that need to be provided across the region - but there are also distinct communities of interest that exist at a level much more local than the current regional and district council boundaries. It is these local communities and their needs and values that we need to represent and their interests and needs that we need to factor into our decision making alongside wider regional concerns.
We recommend:
Retaining section 10(a) and section 10(b) of the Local Government Act 2002 – maintaining the well-beings will best meet the needs of Northlanders. We do not support the change proposed by clause 7.
Well-being is a suitable local government decision making framework for Northland’s communities.
We want the bill to deliver sufficient flexibility for the Local Government Commission’s reorganisation scheme to promote optimum good local governance and government structures for Northland communities without special legislation being necessary.
If the committee considers that despite the diverse needs of communities it is necessary to change section 10(b), then we think that clause 7 of the bill should be expanded to promote local government’s contribution to the delivery of sustainable communities - and enable activity in economic, social, cultural and environmental spheres where this best delivers public value and is supported by communities and addresses their needs.

Page | 3
2.1. Northland’s people and communities – why we need to focus on well beingand community solutions and structures
The following gives you a snapshot of the current context for local governance and service delivery in Northland. (Appendix 1 contains further data and analysis.) It is this context that has shaped our recommendation on keeping the purpose of local government as it is and in providing the flexibility for Northlanders to find their own local governance solutions that reflect our small, largely rural communities, and the high proportion of Maori in Northland. Northland communities
The Northland region is home to just over 158,000 people, 3.6% of New Zealand’s population. We live on a land area of 13,800 sq km. The Northland population is split evenly between urban and rural areas (49% rural) and when you compare us to other regions you see that Northland is the most rural, with the highest proportion of its population living outside urban areas (14% nationally). We are also becoming more rural. Over the last ten years we have had higher growth rates in rural areas than urban areas. We also have significant differences at the sub regional level between Whangarei and Kaipara and the Far North, e.g. just over 75% of the Kaipara district population is rural.
Just over 50,000 M ori live in Northland, one-third of our population. We think the economy is affecting our ethnic growth rates – Maori returning home, less inward migration by Europeans etc. Northland also has a relatively high proportion of persons outside the working age, i.e. children under 15 and adults over 65. Almost 40% of Northland’s population fit into one of these two categories, making it the region with the highest proportion of non-working age persons (and the region with the lowest proportion of working age persons). When you look sub-regionally these figures are accentuated in the Far North and in the Kaipara districts, particularly if you project forward to 2031. (See Appendix 1.)
Northland economyThe Northland economy, when measured in terms of Gross Domestic Product (GDP), was valued at just over $5 billion in 2011, equivalent to 2.6% of New Zealand’s1. The recession brought on by the global financial crisis saw Northland’s GDP growth rate fall from 3.4% in 2007 to -2% in 2009 and it has taken Northland longer to move out of negative growth than others. Northland has the lowest GDP per capita among the 16 regions and our economic activity is not uniform across our region – predominantly centering on Whangarei. At current population levels, it would take a one-off $200 million (4%) increase in Northland’s GDP for it to overtake Gisborne, the next lowest GDP per capita region. It requires a $2 billion (40%) increase in GDP for Northland GDP per capita to equal the New Zealand average.
Our economy is also structured differently to that of the national economy. Primary industries – agriculture, fishing, forestry and logging, and mining – account for 14% of Northland’s GDP compared to only 8% nationally. Service industries account for just 50% of Northland’s GDP (c.f. 65% nationally).
1 GDP is the standard indicator of economic growth. It measures the total market value of
goods and services produced, after deducting the cost of goods and services purchased as inputs in the production process (intermediate consumption). It indicates the “value added” of production and the income available to reward the factors of production involved.

Page | 4
Unemployment, household incomes and life chancesNorthland’s unemployment rate has returned to levels that existed in the early 2000s and is the highest among the 12 regions for which unemployment rates are calculated. We realise that unemployment is more widely spread throughout New Zealand than in the early 2000s, and is not just a Northland problem, but the large number of people unemployed in Northland, especially those aged 18-24 years whose number on the unemployment benefit has risen by more than 300%, is of great concern to us. Unsurprisingly given the economic context and high unemployment, Northland has the highest proportion of low-income households - 1.37 times higher than the national proportion in 2011. This disparity of incomes is even more skewed at the sub-regional and communities levels. Therefore some degree of cross-subsidisation to ensure minimum provision of infrastructure and services that impact on community health and well-being is required (e.g. water and waste water treatment). The Deprivation maps for New Zealand and Northland2
graphically illustrate clearly that Northland and many of Northland’s communities face substantial challenges3.
Northland Deprivation Profile 2006 NZ Deprivation Profile 2006
2 Atlas of Socioeconomic Deprivation in New Zealand NZDep2006
3 As noted in the Atlas of Socioeconomic Deprivation in New Zealand NZDep2006 at page 8
“deprivation of area of residence is increasingly recognised as a salient predictor of life chances (Krieger 1992; Krieger et al 1997; Macintyre et al 1993)” and there is general agreement that they provide powerful means of measuring variations in health status.

Page | 5
In summary, within Northland there is a large disparity in income, health and education. Many of these differences are acutely felt in rural areas in the north and west of our region, and at the very local level. We have some communities that really need assistance, and that are unable to afford in isolation a range of services and infrastructure.
Our population demographics and the life chances within our communities are such that local decision making must consider well-being in a wide sense and prioritise action accordingly. Council would like to see this wider role reflected in the bill – and the prioritisation of local government activities to be made on the basis of community needs and values at both local community and regional community levels. Given the issues and opportunities in Northland to deliver value to our communities, local government in Northland is as likely to need to focus on and work (with others) on economic improvement projects and programmes as it is to concentrate on regulation.
We think that the four well-beings provide us with an effective framework for determining how we can best address these diverse regional and local community needs, values and interests and we would like to see local governance solutions – focusing on our communities and their needs - being catered for within the bill.
3. Good governance principles:
The Northland Regional Council’s principles of local government and good local governance are:
Representation Local government derives its legitimacy from:
o local communities; o the long tradition of local representation and the principle that there should be
no taxation without representation; o the long tradition of governance and service delivery to meet community
needs and values.
Local governance must be representative. o Communities should see themselves reflected in their representatives. o Local government exists to represent local communities and their interests –
including advocating on their behalf to central government. o Local government exists to create/deliver community value.
Accountability Local government is and must be accountable – to its communities.
We need to know where we are going, why, and how we will get there and to report to our communities on what we have achieved with their money.
Participation With compulsory taxation comes the right to participate in the decision making -
the right of communities to participate in matters that directly affect them.
Good local governance empowers communities to participate in all facets of local governance – from elections through to vision, policy and service level setting.

Page | 6
Diversity Communities – their needs and values – are diverse. (Beyond a core set of
needs/values.)
Community representatives should reflect the diversity of their community.
Governance models must reflect and recognise this diversity.
Governance models are not synonymous with service delivery models.Different models for each can apply.
Flexibility Good governance and governance structures must be capable of adapting, or
of being adapted, to local circumstances.
4. Local government reorganisation (clause 11 and schedule 1) andgovernance models:
We recommend: The bill delivers sufficient flexibility for the Local Government Commission’s reorganisation scheme to promote optimum good local governance and government for a community/communities without special legislation being necessary.
The Local Government Commission be empowered to deal with the structure of a reorganised entity including the establishment of local boards, community entities/community councils. This should include their membership, powers and responsibilities.
We consider that catchment-based flooding and water management are important matters to be considered in any reorganisation process.
Given the infrastructure issues in Northland we also consider transport, the three waters, and energy should also be strategically planned on a regional basis and that this should be taken into account in considering reorganisation proposals.
We agree with the government that the current reorganisation process can be improved. There must be scope for meaningful change. The process and eventual governance models chosen must empower, reflect, recognise and be accountable to communities – their diversity, their needs, and their values. Therefore flexible governance arrangements and structures should be provided for in the bill, arrangements that acknowledge that “one size fits all” governance models are neither necessary nor desirable.
We consider that the bill should provide for local governance close to communities – while also enabling a regional vision, a regional voice and advocacy, regional policy and standards, and partnerships with others – including central government. We would like the bill to be able to provide for a structure that reflects community driven representation, with elected representatives on community based entities, and representation from those entities on a regional entity, as follows:
Page | 7
We support the inclusion of a community/local structure within the bill akin to the Auckland Council model but with the following differences:
one election (at the community level)
community entities which reflect genuine communities (of interest);
certainty around roles and responsibilities;
responsibilities default to the community entity;
flexibility around the leadership arrangements on the community and regional entity – for example the ability to appoint a chairperson.
The current structures in Northland do not deliver the principles of good governance or the effective representation our communities need. They reflect the centralisation that government has tried to achieve through previous reforms and which is at the heart of this bill. We consider this centralisation and the current representation arrangements in Northland alienates our communities. We therefore consider that the bill itself should provide sufficient flexibility such that a Local Government Commission reorganisation scheme could reflect the Auckland model or a variant of it, such as the community driven, community entity/council one we are interested in developing, without the need for special legislation.
We consider that providing for a community/regional structure for governance would also help resolve the tension between good/prudent financial management, good quality and public value by:
promoting democracy and local accountability;
promoting the identification of community needs and values and local programmes and services to address them through community based planning;
ensuring decisions are made closest to the communities the impact on/serve;
enabling an efficient relationship with central government;
enabling efficient and effective strategic planning and implementation including service commissioning at the regional level.

Page | 8
Catchment-based flooding and water management are important matters to be considered in any reorganisation process. Given the infrastructure issues in Northland we also consider transport and energy should also be strategically planned on a regional basis and that this should be taken into account in considering reorganisation proposals.
A mixed community/regional structure would promote good governance in Northland, allowing decisions to be made at the right geographical, catchment and population based “level” and also assist in delivering equitable and affordable solutions for Northlanders. It would enable strategic, co-ordinated and integrated decision making and also streamline the region’s planning documents such as those produced under the RMA. It would enable Northland’s resources to be more sustainably managed - balancing use and development with protection - and would promote catchment based flood management and improving our region’s overall water quality and protecting the values of outstanding water bodies and wetlands, as identified in Northland Water, our programme which includes Northland’s implementation programme for the Freshwater NPS. It would also facilitate a regional voice and a central point of contact for regional stakeholders and central government, while maintaining local place shaping ability.
It would be inefficient to have a reorganisation application/proposal process where the best governance model(s) were not able to become the Commission’s draft/final reorgansiation proposal or scheme because the ambit of Amendment was not wide enough. Given the difficulties in pursuing special legislation, the bill could provide discretion for the Commission to adopt Auckland models and variants of it where this better served communities, principles of good governance and delivered effective and reflective representation.
Diagram: channels of communication

Page | 9
The entities would require a leader and leadership. We ask that the bill provide for flexibility in the head of the community or regional entity. We recognise that in some circumstances a chairperson chosen from and by the elected representatives may be a better arrangement than a directly elected leader, for instance within a regional entity.
We also ask that the committee consider the +/- 10 per cent rule that local government must follow when drawing boundaries to allow for better alignment of boundaries with genuine communities of interest. We think it could be removed for a mixed model such as the one we propose.
4.1. Local government decision making, roles and responsibilities andreorgansiation
Decision making responsibilities must be clear. One way to achieve this is to allocate all decision making responsibilities in the bill. That is, the bill could allocate all of the regulatory and non-regulatory activities of local government (from emergency management to consenting, monitoring and enforcement, from aspects of funding, procuring, managing and delivering services, facilities and infrastructure, including transport and flood protection, etc.) to an appropriate local governance entity. This list approach is not favoured where responsibilities could be split between a community entity and a regional entity. The list approach is likely to perpetuate or exacerbate the overlaps and gaps that have existed between districts and regional councils. However many issues can be overcome by transferring powers and responsibilities between entities. The issue is in ensuring sensible, efficient and effective transfers are made.
Another approach would be for these responsibilities to be cemented in the reorganisation scheme that is implemented. This may necessitate the Commission having the specific power to do this and for an amendment to be made to the proposed schedule. We note that Greater Wellington has suggested that this power could be given effect through an Order in Council. We would like the committee to seriously consider this option.
A further option, which the council favours, is that the bill could set out the criteria for this allocation. For example, activities could be allocated to a council entity with the regional overview where:
there are cross community-boundary impacts; or
integration between communities is required; or
the benefits of a consistent or co-ordinated approach outweigh the benefits of achieving the preferences of individual communities. (For example to address equity issues, affordability, minimum standards of protection, etc.)
In all other circumstances activities would be allocated to a local community entity, i.e. the default would be that decision making occurred at the level of governance closest to the community. Again these responsibilities could be cemented in the reorganisation scheme that is implemented.
In particular, council wishes to avoid the situation where the regional entity or the community entity refuses to delegate a power or function that most appropriately sits with the other entity or delegates a power or function and then rescinds this delegation without proper cause.

Page | 10
Whichever choice is made - lists or criteria - the community’s ability to pay as well as the community benefits to be delivered must be a key consideration in decisions. The community entity must be able to make an annual recommendation to the regional entity on rating and expenditure in the community. Where this recommendation is within the responsibilities of the community entity then the recommendation should stand. This principle should be reflected in the bill too.
We are aware that Auckland, Clutha, South Otago and Thames Coromandel models all involve delegations to community entities including power to recommend and have accepted the rate for the community. We are looking to learn how these processes are working and the committee might like to seek specific evidence from Clutha, South Otago and Thames Coromandel to assist in the preparation of its final report.
4.2. Enhancing accountabilityWe think that local government is and must be accountable – to its communities. We support the committee exploring options that will deliver this accountability. We accept that relying on the ballot box is not perfect. We realise that some decisions require more scrutiny than others. Councils have significance policies and apply specific consultation procedures to important decisions that affect communities. We have just changed our significance policy to strike a better balance and to clearly articulate when and how communities will be involved in decision making. There may be other options, such as polls/referenda to gain community approval for specific types of decisions - for example for major capital expenditure - which could be included in the legislation to increase accountability.
5. ServicesThe wide range of “services” delivered by local government is well known. They include:
Visions, programmes, policy, plans and projects to enable sustainable communities – addressing economic, environmental, social and cultural issues at scales relevant to the issues being addressed.
Wise management of resources – including freshwater, land, air and coastal waters and the effects of their use and development, including hazardous substances, natural hazards and indigenous biodiversity, noise, etc.
Managing rivers, mitigating soil erosion and flood control.
Emergency management and civil defence preparedness.
Transport planning and passenger services.
Harbour navigation and safety, oil spills and other marine pollution.
The provision of local infrastructure, including water, sewerage, stormwater, roads, community facilities, recreation and open space.
Environmental safety and health.
We recommend:
Any changes to the purpose, functions, and principles of local government or the legislation to make reorganisation for better governance easier should be driven by better governance principles not by service delivery arrangements.
The full suite of service delivery options must be available to local government.
Page | 11
5.1. Principles of Service Delivery
Council has adopted the following principles of service delivery
People/customer - centric, access and equity Northland’s service delivery strategies should be driven by customer needs and
expectations.
Services should be readily available to all customers.
Our customers should not need to understand how local government in Northland is structured to receive services.
Efficiency and effectiveness Economies of scale are a function of individual services. Therefore each
service and its delivery structure needs to be considered on a case by case basis cognisant of customer needs and preferences and service delivery realities.
Collaboration and partnership Collaboration can build capacity and capability, maximise efficiency and
effectiveness, reduce duplication and close gaps.
Northland’s service deliverers should work collaboratively to ensure effective and efficient service delivery.
Local government should enter partnerships with others - stakeholders, central government, non-government organisations and/or private sector organisations – where this provides long term benefits to customers and local government, i.e. where value is enhanced.
Service delivery models are not synonymous with and are separate from governance models The drivers of service and governance models are different and therefore
optimum governance structures for a community may be vastly different from service delivery structures.
There are benefits from separating service delivery models from governance models for example the potential to attract the right people to each entity at the governance and staff level. People with specialist service delivery skills can be matched to service delivery entities e.g. professional advisors, directors, government and regional agency appointments, staff etc.
Enabling a service and providing a service are not synonymous Local government can commission a service without having to deliver it itself.
Arrangements for efficient and effective service delivery should not be confused with the drivers and structures for good local governance.
Flexibility and adaptability Customer needs will change.
How best to deliver a service will be depend on the particular service or services being delivered – some are best delivered nationally, others regionally, and some will be community specific or need to be delivered locally.
A variety of models and structures for delivery need to be available to local government.

Page | 12
It must be possible to change from one model to another where this is appropriate, for example when customer needs change, new technologies emerge, or other partners or market players arrive.
5.2. Service delivery models:To meet the principles above, the full range of service delivery mechanisms and tools must be available to local government and local government must be empowered to choose the appropriate one(s) for the service or services to be delivered and the customers to be served.
Any changes to the purpose, functions, and principles of local government or the legislation to make reorganisation for better governance easier should be driven by better governance principles - not by service delivery arrangements. (While there is some consistency in terminology used within our principles for each e.g. flexibility and adaptability, the focus of each is different.) Regardless of governance models contained in the final legislation, or empowered by it, the legislation and reorganisation processes should not limit (by law or as an indirect consequence) local government’s choices around service delivery methods (if better service delivery is to be achieved).
Diagram: SERVICE DELIVERY OPTIONS

Page | 13
6. Good quality infrastructure, services… clause 7
We agree that good quality local infrastructure, services, regulatory (and for that matter non-regulatory) functions is necessary to achieve sustainable communities. It must be supported by quality catchment, regional and national infrastructure, services and policy and management options.
We recommend:
Any definition of good-quality must take into account effectiveness, efficiency and current and future needs and values of communities.
We would like the committee to resolve the inherent tension the bill contains between the proposed purpose of local government - cost-effectiveness for households… - and the definition of good quality in favour of enabling community needs and values to be achieved. We think, based on experience, the well-being framework achieves this and, as above, do not support a change to the purpose of local government.
If the select committee recommends that clause 7 is enacted, then we ask that the words “in a way that is most cost-effective for households and businesses” is deleted. It appears redundant in light of the definition of “good quality” proposed by clause 7 and does not promote good public value.
6.1. Infrastructure and services in NorthlandThe inadequate supply of infrastructure is the second biggest issue when it comes to doing business in New Zealand; behind access to finance but ahead of regulation, tax and labour force issues.4 The amount of and quality of infrastructure has traditionally been a contributing factor to Northland’s less favourable position compared to other regions in New Zealand, particularly in terms of economic performance and social and community wellbeing.
The geographic characteristics of Northland - a long thin landmass north of Auckland with a low density population spread over a large geographic area – makes infrastructure delivery here challenging. Our population is difficult to service with conventional infrastructure models. Not only are there long distances between towns, the populations per community are low. Because public investment in infrastructure tends to parallel the number of households in a geographical area, funding of rural infrastructure is limited by the depth of the ratepayer revenue base in the area. (This becomes even more of an issue if the infrastructure provider is seeking a commercial gain.) The numerous outlying areas, which are extremely remote and are difficult to economically service, contribute to high deprivation for some communities.
This impacts on all aspects of our service delivery, for example, the way we deliver civil defence. These rural communities have the potential to become quickly isolated in an emergency, due to remoteness, access and geography. The vulnerability of the
4
World Economic Forum, 2008. The Global Competitiveness Report 2009-2010, World Economic Forum,
Geneva. http://www.weforum.org/en/initiatives/gcp/Global%20Competitiveness%20Report/index.htm

Page | 14
infrastructure that services the (power, roads) can impact on community and therefore regional ability to recover quickly from and emergency. High levels of deprivation also mean that communities are more susceptible to the negative effects of hazards and have fewer resources to support recovery, which in turn affects the speed and extent to which these communities can recover. Self-reliance and preparedness is extremely important for these communities. Given the ethnic make-up of many of these communities – high proportion of Maori –access to the internet – below the national average – and limited telecommunications in some communities, our communication of information and measures to assist preparedness can be different throughout the region and is different from more urbanised regions.
Our current infrastructure is also a barrier to improving our regional economic position and the position of our communities. The region is less well connected to the economically key Auckland region than is desirable. As a result Northland is less attractive as a business location than other places and less attractive than it should be as Auckland’s neighbour. Energy security and reliability (and the existence and standard of the associated infrastructure) affects business operations, productivity, cost, attractiveness and long-term investment decisions. We are vulnerable to transmission limitations, national grid faults, and future growth / growing energy demands in the region without additional supply being secured. In particular voltage instability can seriously affect Northland's major industries such as the New Zealand Refinery and Golden Bay Cement. (Specific roading, and energy facts and examples are given in Appendix 1.)
We also have telecommunications issues (as highlighted above in the way we deliver emergency management and civil defence) and issues with water and especially waste water management and the provision of infrastructure in Northland. There is no denying that there are significant challenges effectively funding the maintenance, repair and replacement of existing - and the development of new - water, stormwater, and waste water infrastructure to service growth, fix known issues, meet the needs and values of our communities and accommodate climate variability. There are also challenges for providing soft and social infrastructure.
It is usually uneconomic to duplicate infrastructure. The aggregation of demand ensures that infrastructure can be deployed in a cost effective way. There may be real opportunities to remodel service delivery arrangements to get these economies of scale – delivery of the three waters springs to mind – but fundamentally Northland’s arrangements must suit our context and effective representation is necessary to ensure community voices are heard.
6.2. Is good quality the same least cost?Despite the issues described above, there have been a number of infrastructure improvements in Northland recent years – for example in the region’s sewage treatment and waste water networks. Continued investment in infrastructure will help lift the region by encouraging business growth and employment opportunities, enhancing health and safety, improving communication and helping to relieve pressure on the environment.
We support the idea of choosing programmes that produce large outcomes and have low costs, which is integral to the notion of cost-effectiveness. But we also support pursuing programmes with multiple benefits that deliver more sustainable communities. While we appreciate the drive to examine the cheapest way of doing something and establishing how much “bang for the buck” you get from a

Page | 15
programme, a service, or a piece of infrastructure, we consider that the life of the asset and public value are also important. Too often the least cost action today is not the least cost over the lifetime of the asset or in achieving the overall vision or goal, such as an improvement in or the maintenance of water quality.
Affordability is often raised as an issue for infrastructure development, maintenance and improvement. All relevant information, such as the existing or projected costs and benefits of the infrastructure, the degree to which costs are or can be recovered from end-users (and, in cases of shortfall, from others), the current state of the existing asset, current standards, current performance against standards, comparison with alternative options, knock on costs and benefits, etc. are required to evaluate affordability.
In Northland the cost-effectiveness - bang for buck - drive within infrastructure has not served our communities well. We have had many examples of delaying the development of new infrastructure because it is not the least cost option today, of deferring maintenance, repair, upgrading and replacement, of not meeting Government targets and ratios for cost / benefit (congestion, passenger transport, “inability” to / “affordability” issues associated with collecting the local share) – all of which have contributed the infrastructure picture described in section 2 and Northland’s underperformance as a region.
Alongside cost-effectiveness local government, and other commissioners and providers of infrastructure, services and policy and management functions, must consider other forms of effectiveness and efficiency. Dynamic, allocative, productive, technical, scale, social and distributive efficiency etc. are all part of the mix. Benefits must also be part of the analysis. So benefit cost analysis - from all perspectives, but particularly that of the community – is as much part of the equation as costs to/for households and businesses.
6.2.1. Community value – the Kaeo exampleIf the cost effectiveness had been the only or main determinant in assessing the Kaeo community’s flood issues then it is unlikely that the Kaeo community would have bought into the current programme or that this council and government would be funding the current programme of works. Morally and ethically sticking with the status quo or walking away from Kaeo was not an option, but the numbers of homes and businesses affected and their ability to pay, could have, on a cost effectiveness analysis, led to a very different decision than the programme the community, council and stakeholders have agreed to.
Following NZS 9401:2008 Managing Flood Risk – A Process Standard, a number of potentially feasible flood risk reduction options were developed to the conceptual stage, assessed based on community well beings, technical feasibility and degree of flood mitigation, and tested with others. The analysis indicated that the preferred long-term flood risk reduction options were: managed retreat from the flood plain, enhanced status quo, development of a flood proofed site for relocation and flood protection works to reduce flood velocity through the township.

Page | 16
Note: 1 = scores low (poorly) with respect to criteria, 5 = scores high (positively) with respect to criteria
Through a collaborative process – using a Flood Liaison Committee with a mixture of community representatives and other stakeholders - flood mitigation scheme proposals were developed. This process has evolved and the programme is a mixture of several of the original options, consulted on as part of our long term strategic planning, and is influenced by affordability (targeted rates are applied) and sustainability – particularly enabling the programme to adapt as options advance or emerge in the future - future proofing and avoiding unnecessary costs for future generations to meet.
This process has confirmed that the well-being framework is an appropriate framework for council decision making and that it delivers quality infrastructure and services that the community values, and that the process for decision making and representing communities in those processes, empowers them and achieves sustainable long term solutions.
7. Support for LGNZ/SOLGM
Rather than repeat the specific clause by clause analysis that LGNZ and SOLGM have done on behalf of the local government sector, the council supports the submission of LGNZ and SOLGM on the bill, particularly the reorganisation and fiscal aspects of the submission. One key point we would highlight is that financial constraints are a specific concern to us.
7.1. Financial constraints and CPI (Clause 22)As explained in the SOLGM/LGNZ submission, the cost of providing local government services is higher than normal household costs. Tying Northland’s investment in infrastructural assets and services to CPI is to perpetuate historic underinvestment in Northland. We would like to see more central government investment in Northland but are aware of the competing national needs. Therefore

Page | 17
Northland’s communities need to be able to determine their own destiny, set their own course and be empowered to invest in their own futures, including investing in the necessary infrastructure to maintain and improve our quality of life. We recognise that we must make ourselves an attractive place to live, work, visit and invest. Artificial, centrally imposed limits to rate increases or debt (beyond those limits identified by the OAG or rating agencies) are at best likely to be a brake on our development, on our communities’ ability to meet their aspirations. At worst they may undermine the maintenance and replacement of our limited infrastructure, further exacerbating socio-economic statistics, and impairing our ability to meet our legislative responsibilities, such as our resource management functions, as devolved by government.
If benchmarks and thresholds are introduced, they must recognise the current condition of communities and their “assets” - infrastructural, economic, social and environmental etc. - and provide for improvements to be made and sustained. Northland must be empowered to improve itself and not be constrained to the current state of its assets. Prudent management is not about achieving or remaining with an arbitrary parameter, it is about sustainability and genuine affordability. In Northland it is not sustainable or affordable to perpetuate historic underinvestment in infrastructure or maintain the least cost approach.
We support prudent financial management.
We do not support the setting of arbitrary benchmarks and / or parameters for assessing whether a local-authority is prudently managing its finances and financial dealings.
If benchmarks and thresholds are introduced, they must recognise the current condition of communities and their “assets” - infrastructural, economic, social and environmental etc. - and provide for improvements to be made and sustained. Any limit set must avoid imposing under-investment decisions – e.g. to underinvest in maintenance of assets - on councils. Under-investment has negative consequences in the future.
8. ConclusionCouncil welcomes the examination of local government and governance. This submission has covered a number of matters set out in the bill and supports the submissions of Local Government New Zealand and SOLGM.
Our key points are that:
we support keeping the purpose of local government as it is in section 10 of the Local Government Act 2002. We do not support the change proposed by clause 7.
we want the bill to deliver sufficient flexibility for the Local Government Commission’s reorganisation scheme to promote optimum good local governance and government for a community / communities without special legislation being necessary.
We trust that the information contained in this submission about our communities in Northland, the challenges we face, and the desire for improved governance and service delivery arrangements has been helpful to you and that it has illustrated the value of well-being as a decision making framework in and for Northland. We are

Page | 18
keen to pursue future reorganisation that brings benefits to our communities and strongly urge the committee to ensure the Local Government Commission can structure local government in Northland in a way that delivers for our communities. In particular we would the Commission to have the power to establish local communities entities / community councils.
We look forward to being heard in support of our submission.
Craig Brown Malcolm Nicolson Chairperson Chief Executive Officer Northland Regional Council Northland Regional Council

Page | 19
Appendix 1
Northland and its communities(This information has largely been prepared by Darryl Jones, Economist, Northland Regional Council for the upcoming State of the Environment Report for Northland – due to be published 2012/13.)
Our people
The Northland region is home to just over 158,000 people, 3.6% of New Zealand’s population, and we live on a land area of 13,800 sq km. Our population grows at roughly the same rate as other New Zealand regions, if you exclude the Auckland region from calculations.
Northland has one (provincial) city, a number of rural towns, numerous townships and hamlets and areas of coastal settlement with minimal services.
The Northland population is split evenly between urban and rural areas (Table 1 and Figure 2). This is very different from the New Zealand population as a whole: 86% of the national population lives in urban areas and only 14% in rural environments.
Northland is New Zealand’s most rural region, with the highest proportion of its population living outside urban areas. We are becoming more rural, with higher growth rates in rural areas than urban areas over the last ten years.
One-third of our people reside in the Wh ng rei urban area, with a further 18% living in the Wh ng rei rural area. In total, just over 50% of the Northland population lives

Page | 20
in the Wh ng rei district. In contrast, a far greater proportion of the populations in both the Far North and Kaipara districts live in rural areas. In the Far North district, which accounts for 37% of Northland’s population, 60% of people live in rural areas. The proportion is even greater in Kaipara, where just over 75% of the Kaipara district population is rural.
Table 1. Selected population and household indicators for Northland
Indicator Region Number % region total5 years 2007-11
5 years 2002-06
Northland 158,200 100% 0.7% 1.1%
New Zealand 4,405,200 100% 1.0% 1.5%
Position among 14 regions1
8th n.a. 8th 8th
Northland 80,120 51% 0.5% 1.0%
New Zealand 3,795,460 86% 1.0% 1.6%
Position among 14 regions1
10th 14th 8th 8th
Northland 78,080 49% 0.9% 1.3%
New Zealand 609,740 14% 1.0% 1.1%
Position among 14 regions3
3rd 1st 8th 5th
Northland 50,500 32% 1.0% 0.4%
New Zealand 671,100 15% 1.5% 1.3%
Position among 14 regions1
5th 2nd 11th 13th
Northland 98,000 62% 0.2% 1.2%
New Zealand 2,838,000 64% 0.2% 0.6%
Position among 14 regions1
10th 12th 6th 2nd
Northland 9,600 6% 4.0% 5.3%
New Zealand 896,100 20% 3.8% 5.8%
Position among 14 regions1
9th 10th 9th 9th
Northland 34,500 22% -0.5% -0.6%
New Zealand 894,500 20% 0.1% 0.3%
Position among 14 regions1
8th 3rd 11th 7th
Northland 42,900 27% 0.1% 0.0%
New Zealand 1,499,000 34% 0.5% 1.1%
Position among 14 regions1
9th 14th 12th 7th
Northland 54,600 35% 1.1% 2.5%
New Zealand 1,424,700 32% 1.5% 2.7%
Position among 14 regions1
8th 3rd 8th 6th
Northland 26,200 17% 3.5% 3.0%
New Zealand 587,100 13% 2.8% 2.1%
Position among 14 regions1
8th 2nd 2nd 1st
Northland 62,400 100% 1.4% 1.4%
New Zealand 1,671,600 100% 1.5% 1.6%
Position among 14 regions1
9th n.a. 5th 6th
Northland 44,600 71% 1.0% 1.6%
New Zealand 1,190,400 71% 1.2% 1.8%
Position among 14 regions1
8th 5th 6th 6th
Northland 16,200 26% 2.7% 1.3%
New Zealand 405,900 24% 2.3% 0.0%
Position among 14 regions1
8th 9th 1st 6th
Northland 21,200 46% 2.5% 2.6%
New Zealand 528,700 43% 2.5% 2.5%
Position among 14 regions1
8th 6th 3rd 4th
Northland 15,400 33% -0.9% 1.2%
New Zealand 480,100 39% 0.0% 1.9%
Position among 14 regions1
8th 14th 8th 6th
Northland 9,600 21% 0.6% 1.2%
New Zealand 230,800 19% 1.0% 1.1%
Position among 14 regions1
7th 3rd 7th 2nd
Over 65 years
Annual growth rate
Total population
Urban
0-14 years
Rural
Other3
As at June 2011
European
Population by place of residence
Population by ethnicity2
Population by broad age group
Maori
40-64 years
Couples without children
15-39 years
Households by type
Total households
Families
One person
Families by type4
Couples with child(ren)
Single parent with child(ren)
1. The 14 regions are Northland, Auckland, Waikato, Bay of Plenty, Gisborne, Hawke's Bay, Taranaki, Manawatu-Wanganui, Wellington, Tasman/Nelson/Marlborough, West Coast, Canterbury, Otago and Southland. 2. NRC estimate based on Statistics New Zealand population estimates and projections.

Page | 21
3. Includes Pacific Islanders, Asian, Middle Eastern, South American and Africans. 4. The total number of families is greater than the number of family households because some households contain more than one family. Source: Statistics New Zealand, Population Estimates and Projections, Census for 2001 and 2006.
Figure 2. Composition of Northland and New Zealand population by rural and urban areas, 2011
0%
10%
20%
30%
40%
50%
60%
70%
80%
90%
100%
Northland New Zealand
% population
As at June
Rural-Kaipara
Rural-Far North
Rural-Wh ng rei
Urban-Kaipara
Urban-Far North
Urban-Wh ng rei
Rural-Total
Urban-Total
Source: Statistics New Zealand
During 2007-11, the 3.6% increase in Northland’s population has mainly taken place in the Wh ng rei urban and rural areas, which together accounted for about 70% of the growth. In most other areas (i.e. outside Kerikeri) we are seeing a static population or a population decline.
Figure 3. Contribution of rural and urban areas to Northland’s population growth, 2002-11
-0.5% 0.0% 0.5% 1.0% 1.5% 2.0% 2.5% 3.0%
Urban-FarNorth:Coastal
Urban-Kaipara
Urban-Far North:Other
Rural-Far North
Rural-Kaipara
Urban-FarNorth:Kerikeri
Urban-Wh ng rei
Rural-Wh ng rei
% change in Northland population
2007-11 2002-06
1. Measured by the area's contribution to the percentage point change in Northland's population during the five year period. For example, in the five years 2007-11, the Wh ng rei rural area contributed a 1.5% increase in Northland's population, which in total increased by 3.6%. 2. Area’s ordered according to 2007-11 growth rates. 3. Urban-Far North: Coastal area includes settlements at Taipa-Manganui, Paihia and Russell. .
Source: Statistics New Zealand

Page | 22
Northland has a relatively high proportion of persons of M ori ethnicity. Almost one-third of the population is M ori compared to just 15% at the national level. (Only Gisborne, with 48%, has a higher proportion of M ori.) Just over 50,000 M ori live in Northland, representing 7.5% of the total M ori population.
We think that the economy has had an effect on the ethnic growth rates in Northland. Northland’s M ori population is estimated to have increased by 2,500 persons or 5.2% between 2007-11, accounting for almost half the population increase. This is a complete reversal of the situation in the proceeding five years, when the 5.7% increase in Northland’s population was predominately driven by a rise in persons of European ethnicity. Economic-induced migration patterns could explain these numbers. When the Northland and national economies were growing during 2002-06, Europeans were attracted to Northland for lifestyle reasons while M ori perhaps headed south for employment. The opposite may have occurred during 2007-11. The economic slowdown may have led to Europeans leaving the region to find jobs and M ori, unable to secure employment elsewhere, returning to their ancestral homes and communities.
Another important feature of the demographic structure of Northland is the relatively high proportion of persons outside the working age, i.e. children under 15 and adults over 65. Almost 40% of Northland’s population fit into one of these two categories, making it the region with the highest proportion of non-working age persons (and conversely the region with the lowest proportion of working age persons).
Within the working age population, Northland also has the lowest proportion of persons aged 15-39 years. Why? Many young people move out of the region once they have finished secondary school for tertiary education and training. Northland also has relatively low level of wages and salaries which is not attractive for young people beginning their working career, particularly those who may have accumulated student debt.
A few years ago we investigated how this population profile played out at the sub-regional level in year 2031 using NZ statistics figures and population (medium) projections. As can be seen from the following graphs the projected population structures will have significant impacts on the economic potential of the districts and the ability of communities to pay.

Page | 23
Northland Population Structure 2031
-8,000 -6,000 -4,000 -2,000 0 2,000 4,000 6,000 8,000
0-4 5-9
10-1415-19 20-24 25-29 30-34 35-39 40-44 45-49 50-54 55-59 60-64 65-69 70-74 75-79 80-84
85+A
ge
Population
Female
Male
The Atlas of Socioeconomic Deprivation in New Zealand NZDep2006 (2008) used the following basket of measures to construct New Zealand’s deprivation index which is included in the body of our submission.
Whangarei Population Structure 2031
-4,000 -2,000 0 2,000 4,000
0-4 5-9
10-1415-19 20-24 25-29 30-34 35-39 40-44 45-49 50-54 55-59 60-64 65-69 70-74 75-79 80-84
85+
Age
Population
Female
Male
Far North Population Structure 2031
-3,000 -2,000 -1,000 0 1,000 2,000 3,000
0-4 5-9
10-1415-19 20-24 25-29 30-34 35-39 40-44 45-49 50-54 55-59 60-64 65-69 70-74 75-79 80-84
85+
Age
Population
Female
Male
Kaipara Population Structure 2031
-1,000 -500 0 500 1,000
0-45-9
10-1415-19 20-24 25-29 30-34 35-39 40-44 45-49 50-54 55-59 60-64 65-69 70-74 75-79 80-84
85+
Age
Population
Female
Male
FN age distribution
0
10000
20000
30000
1 2 3 4 5 6
2 0 0 6 - 2 0 3 1
Far Nort h Dist r ict
0-14 Years
Far Nort h Dist r ict
15-39 Years
Far Nort h Dist r ict
40-64 Years
Far Nort h Dist r ict
65 Years and over
Whangarei age distribution
0
10000
20000
30000
1 2 3 4 5 6
2 0 0 6 - 2 0 3 1
Whangarei Dist r ict
0-14 Years
Whangarei Dist r ict
15-39 Years
Whangarei Dist r ict
40-64 Years
Whangarei Dist r ict
65 Years and over
Kaipara age distribution
0
5000
10000
1 2 3 4 5 6
2 0 0 6 - 2 0 3 1
Kaipara Dist r ict 0-
14 Years
Kaipara Dist r ict 15-
39 Years
Kaipara Dist r ict 40-
64 Years
Kaipara Dist r ict 65
Years and over

Page | 24
Our economy The Northland economy, when measured in terms of Gross Domestic Product (GDP), was valued at just over $5 billion in 2011, equivalent to 2.6% of New Zealand’s GDP (Table 1 and Figure 1)5. The recession brought on by the global financial crisis saw Northland’s GDP growth rate fall from 3.4% in 2007 to -2% in 2009. When compared to the national economy you can see that it took Northland longer to move out of negative growth during 2010-11.
Figure 1. Northland GDP, 2002-11
-3%
-2%
-1%
0%
1%
2%
3%
4%
5%
6%
-3,000
-2,000
-1,000
0
1,000
2,000
3,000
4,000
5,000
6,000
2002 2003 2004 2005 2006 2007 2008 2009 2010 2011
$million, 2011 prices
Year ended December
Northland GDP (left axis)Northland GDP growth rate (right axis)NZ GDP growth rate (right axis)Northland as a percentage of NZ GDP (right axis)
Source: Infometrics Regional Database
In 2011, Northland’s GDP per capita was $31,800, equivalent to 71% of the national average GDP per capita (Table 1 and Figure 2), and Northland has the lowest GDP per capita among the 16 regions.
5 GDP is the standard indicator of economic growth. It measures the total market value of
goods and services produced, after deducting the cost of goods and services purchased as inputs in the production process (intermediate consumption). It indicates the “value added” of production and the income available to reward the factors of production involved.

Page | 25
Figure 2. Northland GDP per capita, 2002-11
65%
66%
67%
68%
69%
70%
71%
72%
73%
74%
75%
0
5,000
10,000
15,000
20,000
25,000
30,000
35,000
40,000
45,000
50,000
2002 2003 2004 2005 2006 2007 2008 2009 2010 2011
$, 2011 prices
Year ended December
Northland GDP per capita (left axis)
NZ GDP per capita (left axis)
Northland as a percentage of NZ average (right axis)
Source: Infometrics Regional Database
During 2002-06 Northland’s GDP per capita grew by 1.2% per annum, but it has been relatively stagnant since then. However, the gap with the national GDP per capita average has closed slightly. At current population levels, it would take a one-off $200 million (4%) increase in Northland’s GDP for it to overtake Gisborne, the next lowest GDP per capita region. It requires a $2 billion (40%) increase in GDP for Northland GDP per capita to equal the New Zealand average.
Economic activity is certainly not uniform across our region. Almost 60% of the Northland’s GDP is produced in the Wh ng rei district. The Far North and Kaipara districts are much smaller, accounting for 32% and 11% of Northland’s GDP respectively. (These figures are currently under review.) There is consideration variation in GDP per capita between the territorial authorities. Wh ng rei’s GDP per capita is $36,000 (13% above the Northland average), while it is $29,600 in Kaipara and $27,000 in the Far North, being 7% and 15% below the Northland average respectively.
Figure 3. Contribution of TAs to Northland economic growth, 2002-11
-3%
-2%
-1%
0%
1%
2%
3%
4%
5%
-3%
-2%
-1%
0%
1%
2%
3%
4%
5%
2002 2003 2004 2005 2006 2007 2008 2009 2010 2011
Annual growth rate in Northland
GDP
Year ended December
Contribution of Whangarei Contribution of Far North
Contribution of Kaipara Northland GDP growth rate
Source: Infometrics Regional Database

Page | 26
Table 1. Selected economic indicators for Northland
Economic Indicator Region5 years2007 11
5 years2002 06
Northland 5,036$ 0.7% 2.4%New Zealand 196,482$ 0.7% 3.6%Position among 16 regions3 11th 7th 12thNorthland 31,833$ 0.0% 1.2%New Zealand 44,602$ 0.0% 0.0%Position among 16 regions3 16th 9th 12thNorthland 64,334 0.2% 2.7%New Zealand 2,215,436 0.7% 3.0%Position among 16 regions3 9th 13th 9thNorthland 8.5 10.3% 8.7%New Zealand 6.5 11.3% 6.8%Position among 12 regions5 12th 7th 5thNorthland 78,280$ 0.5% 0.4%New Zealand 88,688$ 0.1% 0.6%Position among 16 regions3 8th 2nd 12thNorthland 20,067 0.3% 3.1%New Zealand 505,194 0.5% 4.0%Position among 16 regions3 8th 15th 10thNorthland 1,044$ 1.2% 5.8%New Zealand 1,289$ 0.1% 2.3%Position among 12 regions5 12th 10th 1stNorthland 37% 2.2% 4.9%New Zealand 27% 0.7% 1.2%Position among 12 regions5 12th 11th 1stNorthland 78% 1.1% 2.9%New Zealand 76% 0.5% 2.0%Position among 12 regions5 10th 4th 11thNorthland 19.9 7.8% 20.5%New Zealand 22.3 6.3% 12.8%Position among 12 regions10 6th 5th 10thNorthland 96 4.0% 1.1%New Zealand 101 3.0% 0.0%Position among 11 regions12 8th 8th 1st
Year endedDecember
20111
Home affordability index9
Consumer confidenceindex11
Annual growth rate2
GDP ($ million, current)
GDP per capita ($,current)
GDP per personemployed ($, current)
Business units (number)
Unemployment rate (%)4
Employment (persons)4
Median weeklyhousehold income $6
Low income households(% households)7
Low income depth (50:60ratio %)8
1. Except Business units (February), and Median weekly household income, low income households and poverty depth (June). 2. Growth for money related indicators is calculated on a real (inflation adjusted) basis. 3. The 16 regions are Northland, Auckland, Waikato, Bay of Plenty, Gisborne, Hawke's Bay, Taranaki, Manawatu-Wanganui, Wellington, Tasman, Nelson, Marlborough, West Coast, Canterbury, Otago and Southland. 4. Annual average of the four quarters ended December. 5. The 12 regions are Northland, Auckland, Waikato, Bay of Plenty, Gisborne/Hawke's Bay, Taranaki, Manawatu-Wanganui, Wellington, Tasman/Nelson/Marlborough/West Coast, Canterbury, Otago and Southland. 6. Includes wages and salaries, self-employment, investment income, government transfers and other transfers, before tax. Growth measured for the four year period 2003-06 because the definition on income changed in 2002. Median income for households with at least one person aged 15-64. 7. Measured by the proportion of all households with household income below a constant value threshold equivalent to 60% of the 2002 national median household income adjusted each year with the Consumers Price Index (CPI). A negative change indicates an improvement, i.e. a reduction in low income households.

Page | 27
8. The 50:60 ratio % is the number of households with income below 50% of the national median household income as a proportion of the number of households with income below 60% of the national median. The lower the proportion the less depth there is, and a negative change indicates an improvement. 9. The lower the index the more affordable is housing, and a negative change indicates an improvement. 10. The 12 regions are Northland, Auckland, Waikato/BOP, Hawke's Bay, Taranaki, Manawatu-Wanganui, Wellington, Nelson/Marlborough, Canterbury/Westland, Otago, Central Otago Lakes and Southland. 11. Summarizes responses to questions about households' own financial position, their expectations for the NZ economy as a whole and their current willingness to spend. A value over 100 indicates positive confidence. 11. The 11 regions are Northland, Auckland, Waikato, Bay of Plenty, Gisborne/Hawke's Bay, Taranaki/ Manawatu-Wanganui, Wellington, Tasman/Nelson/Marlborough/West Coast, Canterbury, Otago and Southland.
Sources: GDP and Employment: Infometrics; Unemployment rate, Business units, Median weekly household income, Low income households and Low income depth: Statistics New Zealand; Home affordability index: Massey University; and Consumer confidence index: Westpac McDermott Miller.
Table 2. Contribution of TAs and industries to economic growth in Northland, 2002-11
5 years 5 years 5 years 5 years2007 11 2002 06 2007 11 2002 06
Contribution by TAFar North 31.8% 0.0% 2.7% 0.0% 4.6%Wh ng rei 56.8% 1.3% 2.2% 3.7% 6.3%Kaipara 11.4% 0.5% 2.2% 0.3% 1.4%
Northland 100.0% 0.7% 2.4% 3.4% 12.3%
Contribution by industryAgriculture 8.5% 4.2% 2.3% 1.0% 1.1% 0.6%Fishing 0.4% 7.9% 13.2% 1.6% 0.5% 0.1%Forestry and logging 5.2% 9.7% 6.9% 4.3% 1.5% 1.1%Mining 0.4% 0.9% 11.3% 8.1% 0.3% 0.4%
Primary industries 14.5% 4.7% 0.5% 2.1% 0.4% 2.0%Food, beverage and tobacco manufacturing 2.8% 1.7% 3.1% 3.8% 0.5% 0.7%Textile and apparel manufacturing 0.1% 0.9% 0.4% 3.9% 0.0% 0.0%Wood and paper product manufacturing 3.2% 4.9% 2.3% 8.2% 0.4% 1.1%Printing, publishing and recorded media 0.5% 1.3% 0.5% 3.4% 0.0% 0.1%Petroleum, chemical, plastic and rubber products 6.4% 13.2% 7.9% 2.4% 2.1% 0.7%Non metallic mineral products manufacturing 1.0% 4.7% 2.2% 3.8% 0.1% 0.2%Metal product manufacturing 0.7% 1.3% 0.7% 3.0% 0.0% 0.1%Machinery and equipment manufacturing 1.3% 1.8% 2.8% 2.9% 0.2% 0.2%Furniture and other manufacturing 0.3% 2.6% 0.4% 1.7% 0.0% 0.0%Electricity, gas and water supply 3.0% 3.8% 3.2% 8.9% 0.6% 1.4%Construction 3.3% 2.1% 5.3% 8.8% 1.1% 1.7%
Goods producing industries 22.6% 3.1% 0.2% 4.1% 0.2% 4.8%Wholesale trade 3.0% 1.0% 1.1% 7.2% 0.2% 1.7%Retail trade 6.9% 2.8% 1.1% 4.6% 0.4% 1.5%Accommodation, cafes and restaurants 1.7% 2.9% 2.4% 3.8% 0.2% 0.4%Transport and storage 3.0% 1.6% 0.2% 3.0% 0.0% 0.5%Communication services 2.4% 1.0% 7.0% 0.5% 0.7% 0.0%Finance and insurance 3.6% 1.2% 3.0% 6.2% 0.5% 0.9%Property services 6.1% 2.3% 1.2% 8.0% 0.4% 2.4%Business services 5.0% 1.4% 3.8% 5.0% 0.9% 1.0%Central government admin and defence 3.0% 2.0% 3.9% 8.1% 0.5% 0.9%Local government administration 2.1% 4.0% 1.2% 9.9% 0.1% 0.9%Education 3.9% 2.9% 1.1% 1.1% 0.2% 0.2%Health and community services 7.8% 3.4% 2.4% 3.5% 0.9% 1.3%Cultural and recreational services 0.6% 0.9% 1.0% 3.9% 0.0% 0.1%Personal and Other services 1.5% 2.7% 0.4% 2.4% 0.0% 0.2%
Service industries 50.6% 1.9% 1.4% 3.3% 3.5% 8.3%Ownership of owner occupied dwellings2 9.2% 3.4% 1.3% 1.5% 0.6% 0.7%Unallocated 3.1% 2.4% 2.9% 2.8% 0.5% 0.5%
Total 100.0% 2.5% 0.7% 2.4% 3.4% 12.3%
Annual growth rate% point contribution to
Northland's GDP growth1TA/industry
as % ofNorthland'sGDP in 2011
Northlandindustry as %
of NZindustry
1. Measured by the total percentage point change in Northland's total GDP during the period rather than an annual average. For example, in the five years 2007-11, growth in the Forestry and logging industry contributed a 1.5 percentage point increase in Northland's GDP, which in total increased by 3.4%. 2. Represents the service that dwellings provide to their owner-occupiers.
Source: Infometrics Regional Database

Page | 28
The structure of the Northland economy is also different to that of the national economy (Table 2). Primary industries – agriculture, fishing, forestry and logging, and mining – account for 14% of Northland’s GDP compared to only 8% nationally.

Page | 29
Alternatively, service industries account for just 50% of Northland’s GDP but contribute 65% nationally.
Looking broadly growth in the Northland economy during 2007-11 was mainly due to the expansion of activity in the service industries. There was little growth in economic activity in the goods-producing industries, while activity in the primary industries sector declined.
Within the primary industries sector, we have seen certain sectors perform better than others. For example, the contribution of agriculture, fishing and mining to GDP fell during 2007-11. By comparison, economic activity in forestry and logging grew by almost 7% per annum, contributing to a 1.5% rise in Northland’s GDP. There are a number of reasons for this performance - extreme weather conditions, such as floods and droughts, have contributed to this decrease in agricultural production and there has been an increase in the quantity of wood processed in line with the increase in the quantity of wood harvested. For example, the quantity of sawn timber produced in the Northland wood supply region has risen from an annual average of 228,000 m3 in 2002-06 to 327,000 m3 in 2007-11. (Output from the refinery has also expanded over the period.)
Among the service industries, a major change has been in the contribution of property services to growth and there has been a large drop in building activity, and therefore construction (one of our main goods-producing industries) has shrunk.
Northland also has a relatively lower level of entrepreneurial activity than the country in general. In February 2011, there were just over 20,000 geographic units located in Northland6. This is 345 less than in 2006, a reduction of 1.5%. By comparison, the number of businesses in New Zealand grew by 2.6% over the five years. Only the Manawatu-Wanganui region had a larger percentage reduction than we did. This decrease is a large turnaround from 2002-06 when the number of businesses in Northland rose by 15% as the economy expanded.
Business start-ups are also down. During the mid-2000s, some 2,500 new businesses were started each year in Northland. In 2011, around half that number of businesses began operation. Furthermore, in 2010 and 2011 the business birth to death ratio fell below 1 for the first time in ten years, indicating that the number of businesses that ceased operation was greater than the number of new businesses that started. This indicator of entrepreneurial activity peaked in 2004 and has been steadily tracking down since then. In general, the ratio of business births to deaths in Northland is less than in New Zealand as a whole.
This economic picture is reflected in our employment figures. The number of persons employed in Northland, both self-employed and employees, has remained relatively static over the past five years at around 64,000 people, with annual growth rates varying between 2% and -2%. Unsurprisingly, given the sectoral analysis
6
A geographic unit is defined as a separate operating unit engaged in New Zealand in one, or predominately one, kind of economic activity from a single physical location or base. This is the preferred measure for counting the number of businesses in a particular area. The coverage of business demography statistics is limited to economically significant enterprises that are engaged in the production of goods and services in New Zealand. In particular it does not include self-employed operators with annual expenses or sales less than $30,000 per annum.

Page | 30
above, the greatest reduction in employment since 2008, both in absolute and percentage terms, has occurred in the construction and primary production (agriculture, forestry and fishing) industries.
Employment growth in Northland during 2007-11 has also been much slower than in the economy as a whole. A consequence of near static employment growth has been a rise in the unemployment rate, which has more than doubled from its historical low of 4.3% in 2007 to around 9% in 2009 and 2010. (It has fallen to 8.5% in 2011.)
Our slow employment growth is also shown by a fall in the labour force participation rate from 66% in 2006 to 63% in 2011. This indicates that a larger proportion of the working age population in Northland is choosing not to participate in the labour force because of fewer job opportunities.
Figure 9. Unemployment rate in Northland, 2002-11
90%
100%
110%
120%
130%
140%
150%
160%
170%
180%
190%
0
1
2
3
4
5
6
7
8
9
10
2002 2003 2004 2005 2006 2007 2008 2009 2010 2011
% unemployed
Year ended December
Northland Unemployment rate (left axis)
New Zealand Unemployment rate (left axis)
Northland as a percentage of national average (right axis)
Source: Statistics New Zealand, Household Labour Force Survey
While Northland’s GDP per person employed was just over $78,000 in 2011, around 88% of the national average and the eight highest among the 16 region, this labour productivity indicator needs to be considered in the context of our population and labour force. The significantly higher level of GDP per person employed as compared to GDP per capita in Northland is a consequence of two factors: the relatively high proportion of the population outside the working-age (15-64 years) and the relatively low participation rate of the working-age population. With employment growing at a slower rate than GDP over 2007-11, this productivity measure has increased by 0.5% per annum over the period, which is much higher than the rate of increase for New Zealand as a whole, and is the second fastest increase among the 16 regions.

Page | 31
Figure 10. Northland GDP per worker, 2002-11
80%
81%
82%
83%
84%
85%
86%
87%
88%
89%
90%
0
10,000
20,000
30,000
40,000
50,000
60,000
70,000
80,000
90,000
100,000
2002 2003 2004 2005 2006 2007 2008 2009 2010 2011
$, 2011 prices
Year ended December
Northland GDP per worker (left axis)
New Zealand GDP per worker (left axis)
Northland as a percentage of New Zealand average (right axis)
Source: Infometrics Regional Database
But you need to separate out GDP growth into employment and productivity components to understand what is going on. In 2002-06 you see that GDP growth was primarily driven by an increase in the number of persons employed, with the value of GDP per worker remaining constant. While changes in employment also impacted on GDP growth in 2007-11, an increase in productivity has also contributed to growth, i.e. an increasing value of output is being produced with the same amount of people. If anything this means that we often need to dig behind the GDP figures to really understand the wellbeing of our communities.
Figure 11. Contribution of employment and productivity to Northland economic growth, 2002-11
-3%
-2%
-1%
0%
1%
2%
3%
4%
5%
-3%
-2%
-1%
0%
1%
2%
3%
4%
5%
2002 2003 2004 2005 2006 2007 2008 2009 2010 2011
Annual growth rate in Northland
GDP
Year ended December
Contribution of employment
Contribution of GDP per worker
Northland GDP growth rate
Source: Infometrics Regional Database

Page | 32
What about households and household income?
The median weekly income for households in Northland was $1,044 in June 2011 (Table 1 and Figure 12). This is equivalent to 81% of the national median household weekly income and is the lowest among the 12 regions for which data is available.
Figure 12. Real household income in Northland, 2002-11
60%
65%
70%
75%
80%
85%
90%
95%
100%
0
200
400
600
800
1,000
1,200
1,400
1,600
2002 2003 2004 2005 2006 2007 2008 2009 2010 2011
$, 2011 prices
As at June
Northland median weekly household income (left axis)
New Zealand median weekly household income (left axis)
Northland as a percentage of New Zealand (right axis)
1. Median household income adjusted for inflation using the Consumer Price Index (CPI) 2. Household income includes wages and salaries, self-employment, investment income, government transfers and other transfers, before tax.
Source: Statistics New Zealand, New Zealand Income Survey
Over the period 2007-11, the median weekly household income in Northland fell by 11% from its high of $1,177 in 2007 when measured in real terms (adjusted by CPI). Only two regions, Waikato and Gisborne/Hawke’s Bay, had larger decreases. This indicates that Northland households have considerably less purchasing power in 2011 compared to 2007, having around the same level as they had in 2005.
This contrasts markedly with developments during 2002-06 when the median household income in Northland increased by almost 6% per annum, the highest rate of increase among the 12 regions and considerably faster than the 2.3% per annum rise in the national median. One reason for this rapid rise was the strong employment growth in the region which saw a switch in income from government transfers such as unemployment benefits to wages and salaries. Similarly, the decrease in median household income during 2007-11 reflects the growing number of households dependent on benefits or outside the paid workforce altogether, as well as lower investment returns. (The progressive introduction of the central government’s Working for Families package from 2004 to 2007 may also have contributed to the rise in median income levels.)
What worries us is that during 2007-11, the proportion of low-income households in Northland rose from 30% to 37% of all households, an annual increase of 2.2% (Table 1 and Figure 13). Households are considered to be low-income if there income is below a constant value threshold equivalent to 60% of the 2002 national

Page | 33
median household income adjusted each year with the Consumers Price Index (CPI).7
Figure 13. Low-income households in Northland, 2002-11
1.00
1.05
1.10
1.15
1.20
1.25
1.30
1.35
1.40
1.45
1.50
0%
5%
10%
15%
20%
25%
30%
35%
40%
45%
50%
2002 2003 2004 2005 2006 2007 2008 2009 2010 2011
% of all households
As at June
Proportion of low-income households in Northland (left axis)
Proportion of low-income households in New Zealand (left axis)
Ratio of Northland proportion to New Zealand proportion (right axis)
1. Measured by the proportion of all households with household income below a constant value threshold equivalent to 60% of the 2002 national median household income adjusted each year with the Consumers Price Index (CPI).
Source: Statistics New Zealand, New Zealand Income Survey
Northland has the highest proportion of low-income households according to this measure, being 1.37 times higher than the national proportion in 2011. The recent rise in low-income households reverses the downward trend observed during 2002-06 when Northland experienced the greatest reduction in the proportion of low-income households among the 12 regions for which data is available.
The depth of low-income households appears to be the same as for other regions. (i.e. we do not have more households at the very bottom of income brackets than other regions.)
7 For a detailed discussion of various low-income indicators and an overview of poverty in
New Zealand see Perry, B. (2011), “Household incomes in New Zealand: Trends in indicators of inequality and hardship 1982 to 2010”, http://www.msd.govt.nz/about-msd-and-our-work/publications-resources/monitoring/household-incomes/index.html.

Page | 34
Figure 14. Low-income depth in Northland, 2002-11
0.75
0.80
0.85
0.90
0.95
1.00
1.05
1.10
1.15
1.20
1.25
0%
10%
20%
30%
40%
50%
60%
70%
80%
90%
100%
2002 2003 2004 2005 2006 2007 2008 2009 2010 2011
50:60 ratio %
As at June
Northland 50:60 ratio (left axis)
New Zealand 50:60 ratio (left axis)
Ratio of Northland's 50:60 to New Zealand's 50:60 (right axis)
1. The 50:60 ratio % is the number of households with income below 50% of the national median household income as a proportion of the number of households with income below 60% of the national median. The lower the proportion the less depth there is, and a negative change indicates an improvement.
Source: Statistics New Zealand, New Zealand Income Survey
Northland is the sixth most affordable region in which to purchase a home at the end of 2012, behind Southland, Otago, Taranaki, Manawatu-Wanganui and Hawke’s Bay/Gisborne (Table 1 and Figure 15).
Figure 15. Home affordability in Northland, 2002-11
70%
75%
80%
85%
90%
95%
100%
105%
110%
0
5
10
15
20
25
30
35
40
2002 2003 2004 2005 2006 2007 2008 2009 2010 2011
Home Affordability Index
As at November
Northland Home Affordability Index (left axis)
New Zealand Home Affordability Index (left axis)
Northland as a percentage of national average (right axis)
1. Home affordability is assessed by comparing the average weekly earnings with the median dwelling price and the mortgage interest rate. The earnings figure represents the money available to the family, or household unit, and the median dwelling price combined with the mortgage interest rates provide an indicator of the expense involved. The lower the index the more affordable is the housing.
Source: Massey University, Home Affordability Report

Page | 35
During 2002-07, the Northland home affordability index increased by 20% per annum, the largest rise in any region except Taranaki (the 12th region, Central Otago lakes was not separately identified in this period). While household incomes were improving in Northland, house prices were increasing at a much faster rate. Consequently, the gap between Northland and the national index closed rapidly. The index has subsequently decreased during 2007-11, driven by falling house prices and interest rates. However, the index suggests that it is still more expensive for a Northlander to purchase a home in the region than it was in the early 2000s.
The Northland infrastructure inventory
RoadingCranleigh Merchant Bankers conducted a study for us (updated in 2007) into our
region’s infrastructure and produced the report ‘Regional Capability: Infrastructure for Northland Region’. Taking one aspect – the roading network - the report noted Northland was considerably underdeveloped when compared to many other regions, with 65.3% of local roads unsealed, compared with 40.3% nationwide. It also noted that in terms of travel time, the region is less well connected to the economically key Auckland region than is desirable. As a result Northland is less attractive as a business location than other places and less attractive than it should be as Auckland’s neighbour.
As anyone who has travelled through our regional will know a key feature of the roading network here is the ratio of road length kilometres per square kilometre of land area and the ratio of road length per head of population, which is higher than the national average. Once again this is partly due to the region’s challenging topography which has numerous inlets, harbours and peninsulas and winding hill sections but it also emphasises the relatively high burden of road maintenance on the Northland population and particularly for a sparsely populated district such as Kaipara. Essentially, Northland has a large roading network for a relatively small population, which means we spent a large proportion of our rates revenue on roading.
Northland has one key road into and through the region, State Highway 1. This route contains accident black spots and poses route security issues in places such as the Brynderwyns, Te Hana Bridges and Dome Valley. When events cause the road to be closed in these locations, the diversion routes are insufficient for the class of road they replace. In one case, the Te Hana Bridges, there is no viable alternative route. The unstable geology and terrain of the region and the resulting landslides and soil compaction (especially in severe weather events) affects the security of a number of other routes in the region leading to delays and uncertainty. The west coast of the region is less accessible by road than the east.
As the committee will be aware, rail is limited to one freight line into the region through Auckland and a subsidiary line to Dargaville. Our council has worked with other in the region to send a very strong message that the mothballing of the freight line from Auckland (the North Auckland Line) would represent a major setback for regional development. For our part we have worked hard to securing a potential rail corridor to link to the North Auckland to the main port in the region, Northport. This link would help safeguard the North Auckland Line as well as greatly increasing the

Page | 36
attractiveness of the port for bulk movement of freight. As always funding is an issue.
There are three commercial airports at Kaitäia, Whängärei and Kerikeri.
Energy There is very little energy produced in Northland. The only generation schemes of significance are the Wairua dam, which produces 11MW output, and the Ngäwhä geothermal power station near Kaikohe, which has recently been increased from 10MW output to 25MW output (still only approximately three percent of the peak load for Northland). There is significant potential for the development of further renewable energy sources, for example, biofuels, wind, wave and solar generation6 and there are current proposals for wind (Poutö) and tidal generation (Kaipara Harbour) within the region. There is only one high capacity transmission line (220KV) through Auckland serving Northland (Henderson to Otahuhu). Its capacity is insufficient to meet the needs of those it serves. A programmed upgrade will not be in place until 2014 at the earliest. There are increasing energy demands from the Bay of Islands due to growth, which will necessitate a transmission line upgrade however there is only a single line north of Maungatapere.
A variety of land uses occur beneath the overhead transmission line, which at times compromises the security of supply (through accidents etc.) and introduces reverse sensitivity issues. Energy security and reliability (and the existence and standard of the associated infrastructure) affects business operations, productivity, cost, attractiveness and long-term investment decisions. In particular voltage instability can seriously affect Northland's major industries such as the New Zealand Refinery and Golden Bay Cement.
Substantially increasing electrical generation capacity north of Auckland would benefit Northland by:
1) helping meet peak demand in regional networks; 2) reducing transmission demand on electricity networks passing north of
Auckland; and 3) providing Northland with secure supply while incurring lower transmission
losses and therefore supplying consumers at greater efficiency.

Whangarei District Council 28 November 2012
7. Submission on the Proposed Regional Policy Statement
Reporting officer Paul Waanders (Policy and Monitoring Manager)
Date 14 November 2012
Vision, mission and values
This item is in accord with Council’s vision, mission and values statement as the Regional Policy statement (RPS) has to be given effect to in the district Plan and therefore plays a pivotal role inn creating the ultimate living environment. The RPS should build the relationship between the management of natural and physical resources and how that is provided for on the ground through the District Plan. Integrating all planning will assist the customers but that can only happen with innovative actions and creativity. Achieving the best outcome will be by valuing the inputs form all partners including the Northland regional Council (NRC) and Whangarei District Council (WDC). Leadership in various fields required.
Local Government Act 2002 – The four well-beings
Cultural Historic and cultural wellbeing will be affected in the manner how resources are managed
Economic The RPS will influence the economic and financial instruments through the Long Term Plan
Environmental The purpose of the RPS is to manage the natural and physical resources – the environment
Social The management of resources will impact on the social wellbeing of inhabitants
Proposed Regional Policy Statement1. The Northland Regional Council (NRC) released a discussion document regarding the issues and
options for Northland late 2010. Simultaneously the required survey of the effectiveness and efficiency of the RPS was released.
2. The Draft New Regional Policy statement was released on 20 October 2011 and through presentations and discussions Whangarei District Council views were formulated which lead to thedecisions under item 4 of the District Living Committee Meeting dated 14 December 2011
As an attachment to that Agenda was a document (TRIM 11/89927) which is still relevant and is attached again as attachment 1 to this report explaining the relationship between the Regional Policy Statement and the District Plan.
3. During the following 10 months the staff and the Regional Policy and Development Committee of the NRC with representatives of the Territorial Authorities (Cr John Williamson) with inputs from a Technical Steering Committee compiled the Proposed Regional Policy statement.
4. The Regional Council also conducted a mapping program to determine the coastal environment, identified the outstanding natural landscape and features and identified and described the natural coastal character for the whole of Northland with notification of affected parties
5. The Proposed Regional Policy Statement for Northland was notified on 8 October 2012 for submissions closing on 3 December.
6. The Staff have worked through the Proposed RPS and have compiled a submission which is attachedto this report (TRIM 12/89354).
The submission follows the structure of the Proposed RPS rather than topic by topic as was the case with the Draft Regional Policy Statement.

Whangarei District Council 28 November 2012
7. Some legal provisions are highlighted as part of the submission process.
Section 30 (1) of the Resource Management Act 1991 assign the following functions to the Regional Council.
30 Functions of regional councils under this Act
(1) Every regional council shall have the following functions for the purpose of giving effect to this Act in its region:
(a) the establishment, implementation, and review of objectives, policies, and methods to achieve integrated management of the natural and physical resources of the region
(b) the preparation of objectives and policies in relation to any actual or potential effects of the use , development, or protection of land which are of regional significance: (own emphasis)
(c) the control of the use of land for the purpose of –
(i) soil conservation:
(ii) the maintenance and enhancement of the quality of water in water bodies and coastal water:
(iii) the maintenance of the quantity of water in water bodies and coastal water:
(iiia) the maintenance and enhancement of ecosystems in water bodies and coastal water:
(iv) the avoidance or mitigation of natural hazards:
(v) the prevention or mitigation of any adverse effects of the storage, use, disposal, or transportation of hazardous substances:
(ca) the investigation of land for the purpose of identifying and monitoring contaminated land:
(g) in relation to any bed of water body, the control of the introduction or planting of any plant in, on or under that land, for the purpose of-
(i) soil conservation:
(ii) the maintenance and enhancement of the quality of water in that water body:
(iii) The maintenance of the quantity of water in that water body:
(iv) The avoidance or mitigation of natural hazards:
(ga) the establishment, implementation, and review of objectives, policies, and methods for maintaining indigenous biological diversity:
(gb) the strategic integration of infrastructure with land use through objectives, policies, and methods:
In the context of the RPS and the relationship with the District Plan the following principles are important.
The Regional Council has to control the use of recourses for the purpose of
Soil conservation
Quality and Quantity of water
Ecosystems in water
Avoidance or mitigation of natural hazards and
Prevention or mitigation of hazardous substances
Investigations etc of contaminated land
Control over maintenance of biological diversity
Integration of infrastructure with land use
Whangarei District Council 28 November 2012
In terms of Section 31 of the Resource Management Act the Territorial Authorities deal with the effects of land uses for the purpose to:
Avoid or mitigate natural hazards
Prevention or mitigation of the effects of hazardous substances
Prevention or mitigation of the effects of use of contaminated land
The maintenance of biological diversity
Control of emissions of noise
Effects of activities on water.
The Regional Councils therefore control the use of land whilst the Territorial Authorities deal with the effect of the land use. Both functions need each other and influence each other even if it appears sometimes to be duplicating or contradicting. The submission has been written in the light of these functions with the aim to complement each other.
8. Section 62 of the Resource Management act 1991 prescribes the content of the Regional Policy Statement.
The RPS must state
The significant resource management issues
Objectives, Polices, Methods (excluding rule) to address the significant issue.
It will give the reasons and the anticipated environmental result
It also has to make a statement which authority will deal with the control of the use of land in case of
i) Natural hazard
ii) Use of hazardous substances and
iii) Maintenance of biological diversity.
If no responsibility is assigned
i) The natural hazards function remain the sole responsibility of the Regional Council; and
ii) The Territorial Authorities retain the sole responsibilities for Hazardous substances.
iii) Both authorities will deal with Biodiversity.
The Operative Regional Policy Statement states that the Regional Council will deal with hazardous substances. The proposal is to divide the responsibility of natural hazards and hazardous substances between the NRC and Territorial Authorities as the Act intended. NRC to deal with the use of land and TA’s with the effects on land.
It is important to note that only significant issues are included in the RPS. The Regional Plans will deal with all issues The Section 32 report has been used to determine the significance.
Extracts of the Resource Management Act 1991 is attached to this report.
9. The Submissions consist of 3 points-
Part 1 deals with matters that have not been included but need to be recognised or provided for in the RPS.
Part 2 deals with the Submissions on the content of the RPS in the order as they appear in the Proposed RPS, and
Part 3 is Appendix 1 dealing with the Management of Genetically Modified Organisms in the Environment
10. The structure of the submission is generally as follows:
a) The provision in the Proposed Regional Policy Statement to be submitted on;
b) The relief sought – sometimes with track changes to identify the proposed changes;
c) The proposal final wording of the provision if the track changes are accepted;
d) The reasons for the submission; and

Whangarei District Council 28 November 2012
e) Sometimes only comments are offered.
11. The submission in short:
Part A: Matters that should be included:
Topic 1: Outstanding natural character landscapes and Outstanding Natural Features. This submission accompanies the Mapping project.
The main aim of the submission is to include the criteria that have been used in the mapping project in order to guide the District Plan provisions (policies and rules).
Topic 2: Management of Genetically Modified organisms in the Environment.
The Whangarei District Council is of the opinion that the Section 32 report is incomplete and this matter should have been included in the RPS. Appendix 1 is a fuller justification of the submission and forms part for the submission.
Topic 3: Contaminated land
With the NES on contaminated land and the NRC holding information on applications processed by the Environmental Protection Agency (EPA) it is considered to bean issue to be included in the RPS.
Topic 4: Elite Soils
With the loss of versatile soils in Northland at an alarming rate this regional function should be recognised as being an issue. The reports make the assertion that the Territorial Authorities will and are looking after this matter whilst in actual fact the information is obtained from outside sources with such an important economic factor that retention of elite soils should be considered as an issue.
Topic 5 – State of Resources
The reduction of resources and the values of existing natural resources are underestimated. The whole issue of ecosystem services where the environment is used with the products available is considered as an issue worth including into the RPS.
Part B – Issues
1.3 Regional Policy Statement Guiding Principles
Whangarei District Council accepts the principles that underpin the RPS but would want to see some adjustments to bring the RPS back to its purpose as defined in section 59 of the RMA as achieving integrated management of the natural and physical resources rather than being an economic plan.
1.4 Relationship between plans
As stated in paragraph 9, the RPS has to make a statement which authority will be responsible for
i) Natural hazards;
ii) Use of hazardous substances; and
iii) Maintenance of biological diversity.
This is done to an acceptable role with hazardous substances not classified as an issue to be further dealt with by the RPS.
2.1 Fresh and Coastal Water
Some minor amendments are requested from the premise that the situation is not as bad as is being portrayed in the press.
2.2 Indigenous ecosystems and species.
This would be the right place to reference ecosystem services.
2.3 Economic Wellbeing
Although this issue has moved markedly from an economic issue to a resource management issue which is commended but a little push towards the effect of the resource management on the economic wellbeing would bring this issue into the realm of the RMA.
2.4 Regional Form
A proposal is made to make this issue more purposeful than just to make a statement.

Whangarei District Council 28 November 2012
2.5 and 2.6 Tangata Whenua
WDC is supportive of these issues.
2.7 Natural Hazards
The relation with environmental issues rather than blunt allegations are proposed. Active management of this issue is supported.
2.9 State of Resources
The inclusion of ecosystem services is promoted.
Objectives
Objectives 3.14 and 3.15 on Natural Hazards and on Protecting Natural Character, Landscape/Features and Historic Heritage require some detailed adjustments to be objectives rather than policies.
Policies and Methods
Smaller amendments are suggested to make the policies more practical.
A new method 4.5.8 to provide for identification of adverse effects which will assist in the formulation of provisions in the Regional Plans and the District Plan.
The Policy 4.6.2 providing for the redefining of the Coastal environment is supported but will create numerous practical problems with implementation. A more workable solution which will not require subsequent plan changes has to be developed.
Policies 4.7.1, 4.7.2, 4.7.3 and method on protecting landscapes require cross referencing to the Mapping project. The NRC should investigate if the provisions of Part 3 of Schedule 1 to the RMA can be applied to the Regional Policy statement as such a provision is not directly indentified in the Act.
Rewording of the Methods will make it less cumbersome to incorporate into the policy driven District Plan.
Policy 6.1 Efficient and Effective Planning under the heading Supporting Economic Growth will create major problems as the interpretation may well be outside the scope of the RMA. It is considered that the provision may even be ultra vires.
As a consequence some provisions in Method 6.1.3 should be deleted or altered.
Some natural hazard policies and methods under 7 could be reworded, added or altered to make these more effective.
The provision regarding Tangata Whenua under 8 are mainly accepted with some amendments suggested.
Appendix 2 makes provision for Regional Form and Development guidelines. Whangarei District Council is of the opinion that these should be principles rather than guidelines which can be ignored when it suits. The Whangarei Growth Strategy: Sustainable Futures 30/50 together with Chapter 6 of the District Plan deal with Urban (Built) Form are principled instructions and the Regional Policy Statement should not have a more relaxed attitude suggested with guidelines.
Maps: Various Whangarei District Council properties, especially those associated with services as well as open space infrastructure, are within the coastal environment or identified landscapes, and operating these services and safe guarding infrastructures will require flexibility within the policy constraints.

Whangarei District Council 28 November 2012
Recommendation1. That the report and attachments be received.
2. That the documents made available be acknowledged.
3. That the submission on the Proposed Regional Policy Statement for Northland as contained in Attachment 3 be adopted and sent to the Northland Regional Council.
4. That staff be delegated to finalise the administrative process.
5. That staff be delegated to attend pre-hearing meetings (if any) and present submission at a hearing.
Attachments
1 Memorandum 9 November 2011 on a presentation by the NRC
2 Extracts from the Resource Management Act 1991
Under separate cover
3 Submissions
Documents available on request
1. Proposed Regional Policy Statement for Northland
2. Section 32 analysis report (summary)
3. Issues not included in the RPS
4. Te Ture Whakamanu ngà Iwi o Taitokerau statutory acknowledgments in Northland
5. Section 32 analysis (Volume 1 and 2)
6. Mapping Mythology for Coastal Environment
7. Mapping Mythology on Outstanding Natural Landscapes
8. Mapping Mythology on Outstanding Natural Features
9. Mapping Mythology on Natural Character
10. Natural character work book
11. Map book identifying the coastal environment, outstanding landscapes and features and coastal natural character areas
12. Worksheets for Outstanding Landscapes and Natural Character in Whangarei District
13. Frequently asked questions

Memorandum
Presentation by the Northland Regional Council on the Draft Regional Policy Statement – 9 November 2011
Background
1 Legal functions of the Regional Council under the Resource Management Act 1991
(1) Every regional council shall have the following functions for the purpose of giving effect to this Act in its region:
(a) The establishment, implementation, and review of objectives, policies, and methods to achieve integrated management of the natural and physical resources of the region:
(b) The preparation of objectives and policies in relation to any actual or potential effects of the use, development, or protection of land which are of regional significance:
(c) The control of the use of land for the purpose of- ....(d) In respect of any coastal marine area in the region, the control (in conjunction with the Minister
of Conservation) of- ....(e) The control of the taking, use, damming, and diversion of water, and the control of the quantity,
level, and flow of water in any water body, including- ....(f) The control of discharges of contaminants into or onto land, air, or water and discharges of
water into water; ....(g) ....
(2),(3),(4) ....
59 Purpose of regional policy statements
The purpose of a regional policy statement is to achieve the purpose of the Act by providing an overview of the resource management issues of the region and policies and methods to achieve integrated management of the natural and physical resources of the whole region.
62 Contents of regional policy statements
(1) A regional policy statement must state-
(a) the significant resource management issues for the region; and(b) the resource management issues of significance to-
(i) iwi authorities in the region; ....

(c) the objectives sought to be achieved by the statement; and(d) the policies for those issues and objectives and an explanation of those policies; and (e) the methods (excluding rules) used, or to be used, to implement the policies; and
(g) the environment results anticipated from implementation of those policies and methods; and(h) ...(i) ...(j) ...(k) ...
2 Hierarchy of planning instruments
3 The Northland Regional Policy Statement

4 The New RPS Discussion Document
5 The Draft Regional Policy Statement

6 Presentation by the Northland Regional Council
Attachments