what are we missing? hmda asset-excluded...
TRANSCRIPT
What Are We Missing?
HMDA Asset-Excluded Filers

What Are We Missing? HMDA Asset-Excluded Filers
Housing Assistance Council
2011

$5.00 August 2011 Housing Assistance Council 1025 Vermont Avenue, N.W. Suite 606 Washington, DC 20005 202-842-8600 (voice) 202-347-3441 (fax) [email protected] http://www.ruralhome.org ISBN: 978-1-58064-163 This report was prepared by Keith Wiley of the Housing Assistance Council (HAC). The work that provided the basis for this publication was supported by funding under Cooperative Agreement H-21564 CA with the U.S. Department of Housing and Urban Development (HUD). Ndeye Jackson served as Government Technical Representative. The substance and funding of that work are dedicated to the public. HAC is solely responsible for the accuracy of the statements and interpretations contained in this publication and such interpretations do not necessarily reflect the views of the United States Government. HAC, founded in 1971, is a nonprofit corporation that supports the development of rural low-income housing nationwide. HAC provides technical housing services, loans from a revolving fund, housing program and policy assistance, research and demonstration projects, and training and information services. HAC is an equal opportunity lender.

4 Housing Assistance Council
TABLE OF CONTENTS
Executive Summary .........................................................................................................................2
Introduction ......................................................................................................................................5
Identifying Potential Filing-Exempt Lenders ................................................................................15
Geographic Concentration .............................................................................................................21
Bank Specifics ...............................................................................................................................25
Service Area Population ................................................................................................................32
Conclusion: Policy Implications ....................................................................................................37
References ......................................................................................................................................38
Appendix ........................................................................................................................................40

What Are We Missing? 5
EXECUTIVE SUMMARY The Home Mortgage Disclosure Act (HMDA) of 1975 was established to protect communities that may be denied access to mortgage credit. The law mandates public disclosure of mortgage lending data to help identify areas potentially suffering from disinvestment and/or discrimination in the local credit market. Although mortgage credit is an almost universal need for most homebuyers, HMDA does not provide comprehensive data for all communities and mortgages. Small lending institutions and those operating entirely outside of metropolitan statistical areas (MSAs) are exempt from filing HMDA data. Consequently, the mortgage practices of these institutions, as well as the impact these activities may have on certain communities, remains unknown. Given the recent mortgage foreclosure crisis that has devastated the national economy and local communities, it is critical that we expand our knowledge of mortgage credit access in all types of communities. There are two primary reasons for concern regarding the HMDA data exemptions. First, these small, limited-asset institutions may be concentrated in areas that are home to vulnerable populations, such as low-income and minority residents. To be unaware of the lending activities in such areas would be to disregard the primary HMDA goal of shedding light on local credit markets, particularly for those most susceptible to disinvestment or discrimination. Second, it is important, from a research perspective, to better understand all lenders and the people they serve, regardless of assets. HMDA-exempt institutions may, in fact, play a critical role in a particular type of community. For example, there are concerns that rural communities may contain the majority of these lenders (Avery et al. 2007). This research addresses these concerns and fills in the knowledge gap by analyzing publicly available financial filings for Federal Deposit Insurance Corporation (FDIC)–insured banks and thrifts. Using these data, the research identified small lenders with assets falling below the annual HMDA threshold over a 12-year period and evaluated their financial portfolios and the populations they serve. Then, based on the aforementioned information, all asset-exempt lenders were assessed based on their geographic concentration and their service area populations, with a focus on rural activities. This paper serves as an initial assessment of HMDA-excluded lenders and forms a baseline for further exploration of these institutions. Research Approach Overview This study examines HMDA asset-excluded small banks by identifying and describing these institutions, their financial portfolios, and the areas they serve. In addition, the analysis covers a 12-year time period (1997–2009) in order to fully explore patterns and trends. The following research questions guided this effort:
1. What proportion of the banking market do these small banks comprise? 2. Have these small bank numbers changed over time? 3. Are these institutions concentrated in certain geographic areas? 4. What do the portfolios of these small banks look like? 5. What communities and populations do these institutions serve?

6 Housing Assistance Council
In order to respond to these questions, the research team closely explored FDIC-insured lenders with assets below the HMDA filing threshold. Given that the majority of banks and thrifts are covered by the FDIC, a review of such lenders provides us with a good picture of what is occurring in the market. In particular, it helps us understand the activities of small lenders and in turn what the HMDA exclusion might be overlooking. The analysis initially involved identifying, locating, and creating a database of all FDIC covered lenders over the last 12 years. This was accomplished by reviewing bank Call Reports and summary of deposit statements which provide institutional portfolio and location data. Once all lenders and their pertinent financial information were identified from the reports, researchers compiled the information in a single data set representing all FDIC-covered lenders, 1997-2009. Finally, the institutions were categorized based on whether they would qualify for an HMDA exemption based on end of year asset totals. Lenders with assets falling below the HMDA threshold for a given year were then identified as such and examined more closely. These institutions were then evaluated based on financial portfolio information and HMDA asset designation (filing or non-filing). In particular, characteristics such as bank types, deposits, assets, profitability (return on assets), branches, and years in operation were examined. Each bank’s headquarters was mapped using ArcGIS (a geographic information system). Once located, each case was linked to demographic data so that we could evaluate service area populations. The focus was on identifying areas of HMDA-excluded bank concentration. In addition, service area demographic data were reviewed to assess whether certain populations depended on these lenders. All comparisons involved presenting data for urban and rural small lenders. Findings Overview This study provides a descriptive analysis of FDIC-insured lenders in an attempt to assess how many lending institutions are being excluded from filing mortgage data by the HMDA asset threshold and to briefly describe these lenders in terms of activity and the populations they serve. The goal of this research is to better understand how these HMDA filing exemptions might affect our knowledge of rural lending markets. The research reveals several findings. First, the number of FDIC-insured lenders that fall under the HMDA asset threshold is not small. In 1997, approximately 25 percent of rural banks and thrifts and more than 1,000 institutions were excluded from HMDA filing based on asset size. Over the past 12 years, these institutions declined in number, but they still make up more than 10 percent of all rural banks and approximately 900 lenders. The research also confirmed that approximately 70 percent of all small banks are found in rural communities. Kansas, Illinois, and other parts of the Midwest are areas of high concentration. More than 90 percent of all counties have had, at one time or another during the study period, a small bank with assets so small that they fell below the HMDA threshold. Based on the analysis, many of these non-HMDA filers are not heavily engaged in mortgage and consumer lending. Fewer than 10 percent of these lenders made a significant proportion of

What Are We Missing? 7
mortgage and consumer loans. The majority (60 percent) of these lenders specialized in agricultural lending. Given this analysis, it is likely that the banks that were identified as qualifying for an HMDA exemption might not make many mortgage loans.

8 Housing Assistance Council
INTRODUCTION The Home Mortgage Disclosure Act (HMDA) of 1975 was established to protect communities that may be denied access to mortgage credit. The law mandates public disclosure of mortgage lending data to help identify areas potentially suffering from disinvestment and/or discrimination in the local credit market. Although mortgage credit is an almost universal need for most homebuyers, HMDA does not provide comprehensive data for all communities and mortgages. Small lending institutions and those operating entirely outside of metropolitan statistical areas (MSAs) are exempt from filing HMDA data. Consequently, the mortgage practices of these institutions, as well as the impact these activities may have on certain communities, remains unknown. Given the recent mortgage foreclosure crisis that has devastated the national economy and local communities, it is critical that we expand our knowledge of the accessibility and type of mortgage credit available to borrowers. There are two primary reasons for concern regarding the HMDA data exemptions. First, these small, limited-asset institutions may be concentrated in areas that have vulnerable populations, such as low income and minorities. To be unaware of the lending activities in such areas would be to disregard the primary HMDA goal of shedding light on local credit markets, particularly for those most susceptible to disinvestment or discrimination. Second, it is important, from a research perspective, to better understand all lenders and the people they serve, regardless of assets. HMDA-exempt institutions may, in fact, play a critical role in a particular type of community. In particular, there are concerns that rural communities may contain the majority of these lenders (Avery et al. 2007). This paper addresses these concerns and fills in the knowledge gap by analyzing publicly available financial filings for Federal Deposit Insurance Corporation (FDIC)–insured banks and thrifts. Using these data, the researchers identified all institutions that have assets falling below the annual HMDA asset threshold and therefore qualify for a filing exemption. These cases then represent a sample of potential HMDA filing exempt institutions.1 Next, all lenders were identified and explored based on their geographic concentration and their service area populations. Our efforts concentrated on identifying trends and patterns for lenders with assets below the HMDA threshold (sample) and, in particular, those institutions operating in rural communities. This paper serves as an initial assessment of HMDA-excluded lenders and forms a baseline for further exploration of these institutions. Literature Review Since its passage into law in 1975, HMDA has served as a valuable source of information on our nation’s mortgage-lending activities in that it requires most mortgage lenders to disclose all loan 1 The process of identifying FDIC insured institutions with assets below the HMDA reporting threshold involved first identifying total assets for each bank for their fourth quarter Summary of Deposit Report. This total is then compared to the Federal Reserve determined threshold for the upcoming year. If an institution had an asset total below the threshold it was identified as potentially qualifying for an exemption. These cases then represent a sample of banks with assets below the HMDA reporting requirement. We can then explore the data to get a better understanding of what these lenders look like and the populations they serve. This in turn helps us better understand what the HMDA data does not include. See Appendix Tables A1, A2, A3 and A4 for a breakdown of FDIC lenders.

What Are We Missing? 9
records annually. These records are then made available to the public by the Federal Financial Institutions Examination Council (FFIEC). The hope is that through analysis of the data by legislators, researchers, advocates, and others, potential problems regarding access to credit will come to light, thus fulfilling the ultimate goal behind the HMDA legislation—that is, to address the twin ills of discrimination and disinvestment (McCoy 2007). Two types of providers are exempt from these requirements: lenders operating entirely outside of metropolitan statistical areas (MSAs) and lenders with an extremely small amount of assets. These exemptions likely cover similar institutions that operate primarily in rural areas (Van Walleghem and Willis 1998), which could mean that HMDA is not fully covering lending activity for a particularly at-risk segment of the population. The goal of this paper then is to address the degree to which this occurs. The following literature review explores what we do and do not know about HMDA-excluded lenders. The discussion focuses primarily on small rural banks and the efforts to evaluate changes affecting these institutions over time, primarily from mergers. In many cases, these efforts involve assessing how mergers involving small banks affect access to credit in rural markets (Keeton 1998; Shields, Stokes, and Bae 2004; Van Walleghem and Willis 1998). Although they do not directly evaluate non-HMDA filers, these studies do provide insight into what such providers might look like and how they may have changed over time. HMDA Studies A review of relevant research literature discovers no studies that directly explore HMDA asset-excluded institutions.2 Although little in the literature justifies the asset exclusion, an obvious reason would be to limit undue burden on small providers.3 Research mentioning HMDA-filing-exempt institutions usually does so to provide general background information on the data source (McCoy 2007) and/or to point out that these exemptions greatly limit coverage in rural areas (Avery, Brevoort, and Canner 2007). For example, Avery, Brevoort, and Canner (2007) noted that coverage in rural areas is often so limited that researchers drop those regions from their studies. This is not to say that research has failed to explore limited-asset (i.e., small) banks. In fact, many studies have analyzed small banking trends; in all cases, however, small bank definitions are not restricted to just HMDA-filing-excluded lenders. For example, the 2008 HMDA asset threshold excluded banks with assets totaling less than $37 million from filing; however, Dolan’s (2000) analysis of lenders considered those institutions with less than $500 million to be “small banks.” The FDIC’s smallest bank category, for which aggregate data are provided, is $100 million.4 Van Walleghem and Willis (1998) provided one of the only studies that categorize 2 FDIC Office of Inspector General audit report 02-009 of March 2002 noted that the FFIEC was unable to evaluate fair lending practices for certain small lenders, including HMDA nonfilers. 3 Small banks raise concerns about filing requirements associated with the Community Reinvestment Act (Independent Community Bankers Association of America2004). One can assume that such concerns might have been raised and are the reasoning behind exempting HMDA filing requirements from small and rural banks. 4 FDIC aggregate bank tables can be found at the FDIC website (www2.fdic.gov/qbp/index.asp) under the section labeled “Bank Data & Statistics.” The specific subsection is called “FDIC Quarterly Banking Profile;” from there, one can pull up reports that show the smallest asset category as less than $100 million.
10 Housing Assistance Council
banks with assets below $100 million in assets, but their groups still do not conform to the HMDA asset thresholds. The aforementioned research studies’ choice of category sizes also says something about the HMDA asset threshold: This threshold is so low that it does not include enough lenders to warrant a full category in an aggregate data presentation. To put the asset threshold into some perspective, Van Walleghem and Willis (1998) identified $500 million as the amount necessary for a bank to achieve economies of scale and high profitability. Small Bank Studies Although no research specifically explores HMDA-filing-exempt institutions, several small bank studies do provide important insight (Dolan 2000; Keeton 1998; Shields, Stokes, and Bae 2004; Van Walleghem and Willis 1998; Walser and Anderlik 2004). These studies focused on rural banks, as well as on issues surrounding bank mergers and access to credit. Although these studies do not focus specifically on HMDA filing exemptions, they do identify patterns that likely influence HMDA-filing-exempt institutions. For example, previous research points to high numbers of small bank mergers in rural areas, which strongly suggests that there will be declining numbers of HMDA-filing-exempt lenders. Service Areas The literature tends to agree that rural areas are dominated by small banks (Keeton 1998; Economic Research Services [ERS] 1997; Van Walleghem and Willis 1998). For the most part, the research simply assumed this to be true; in several cases, however, the research was able to support such assertions. Van Walleghem and Willis (1998) found that more than 70 percent of all midwestern banks with assets totaling less than $50 million were headquartered in rural areas. The Independent Community Bankers of America 2007 testimony before the House Subcommittee on Conservation, Credit, Energy, and Research reported that more than 57 percent of community banks operate in small towns of 10,000 or less. Finally, the USDA Economic Research Services 1998 Rural Credit Report found that the average asset total for banks headquartered in rural areas was consistently less than 20 percent of urban area totals—$73 million for rural areas and $434.7 million for urban. This study also indicated that 74 percent of all bank offices in rural counties were operated by rural-headquartered banks. These data are a bit dated now and conditions have changed due to recent increased bank consolidation, market penetration, and Internet access. Still, these findings suggest that small banks are likely to be concentrated in rural areas. The literature also provides insight into service areas. The service areas for extremely small banks are probably limited to a single jurisdiction—that is, the county where they are headquartered. Walser and Anderlik (2004) stated that banks with assets totaling around $250 million or less primarily operated in one county—that is, the one in which the company headquarters were located. Small institutions probably have few branches and even fewer assets

What Are We Missing? 11
to branch out too far. This suggests that our analysis of HMDA-exempt institution service areas will be limited in coverage to a single county or two per lender. The ERS Credit in Rural America report (1997) found that the poorest counties had the fewest number of bank branches available to its residents. Banking industry competition would be limited in such areas because of small populations and poor economies. These circumstances would also restrict the growth of intuitions already serving these communities. These economically depressed areas might also have large minority populations. Concerns already exist regarding lending practices amid rural minority residents (Singleton et al. 2006). Insufficient HMDA coverage for such communities would essentially represent a failure of the law to shed light on at-risk credit markets. Adding a somewhat different twist, Walser and Anderlik (2004) found that 1,451 banks are headquartered in counties with declining populations. This depopulation and shrinking of assets might mean that such areas have a higher concentration of small banks. Walser and Anderlik also stated that a majority of such counties are located in the Great Plains. The findings noted above only suggest certain small bank patterns. Countering forces might also offset these assertions. For example, mergers, which we discuss below, might result in shrinking numbers of small banks. Research suggests that mergers do occur, even in small areas with limited customer basis (Van Walleghem and Willis 1998; Walser and Anderlik 2004), which means that the data may not be as clear as they initially seem. Mergers A significant amount of research has focused on the impact of bank mergers on small banks (Gilbert 1997; Keeton 1999; Van Walleghem and Willis 1998). These studies usually describe the changes in lender numbers and portfolio holdings, along with assessing the overall impact those changes have on access to credit. A major concern is that larger banks, which usually do not have ties to a region, will not be as attached to the communities they serve as smaller community banks would (Keeton 1998). Because the large banks are not as attached and do not fully know their new customer base, they may make fewer loans and be less involved in the community. Several studies have documented the dramatic number of bank mergers that occurred during the 1990s (Keeton 1998; Nissan 2001; Van Walleghem and Willis 1998; Walraven 1999; Walser and Anderlik 2004). For example, Nissan’s review of Gary A. Dymski’s The Bank Merger Wave found that in the 1980s and 1990s, an average of 1.7 banks disappeared per day due to mergers. Walser and Anderlik (2004) stated that between 1984 and 2003, the number of FDIC-insured institutions shrank by more than half, with most of this change being due to mergers. Finally, Jones and Nguyen (2004) wrote that 5,200 bank mergers, involving more than $4.9 trillion in assets, occurred from 1990 through 2003. Many of these studies paid particular attention to mergers and small rural banks. Walraven (1999) found that from 1992 to 1998, roughly 45 percent of all bank merger activity involved rural targets, while rural banks made up only one-third of all commercial banks. Keeton’s (1998)
12 Housing Assistance Council
analysis of rural mid-western banks and funding pressures found that urban lenders acquired through merger more than $1 billion in rural deposits during the first half of the 1990s with the number picking up to $2.2 billion in the second half. To highlight how dramatic the decline has been in some areas, Shields, Stokes and Bae’s (2004) analysis of rural Pennsylvania banking found that the drop in such lenders, if current patterns continued, would result in no banks being headquartered in rural Pennsylvania by 2025. This study clearly suggests that we might see a decline in HMDA-exempt banks, particularly in rural areas. Van Walleghem and Willis’s (1998) research is particularly insightful here. The authors’ review of bank mergers in the Midwest between 1987 and 1997 found that the number of institutions declined by more than 30 percent. Similar to other work, they reported that small banks made up the greatest portion of banks lost to merger in that region. Unique to their study, however, is their suggestion that lenders with assets of $500 million dollars or less often find it difficult to maximize profits. In other words, larger banks are more efficient due to improvements in data processing, communications technologies, branch networks, and reduced overhead costs. The authors actually documented one bank manager as saying that mergers made his bank more profitable. The authors also stated that most mergers in the area of the Midwest that was studied involved two small banks, suggesting that not all mergers are big banks consuming small ones. The Van Walleghem and Willis (1998) discussion on economies of scale suggests that mergers are actually an issue of survival, which would be particularly true for the smallest banks. Their findings note that even in areas where large banks have not been involved in such activities, consolidation still occurs with so-called extremely small banks, defined by the authors as those institutions with less than $50 million in assets, merging other similar rural lenders.5 All of these mergers ultimately point toward increased banking and finance industry concentration. In 2003, one bank alone, Bank of America, held 9.8 percent of all domestic deposits, and the top 100 commercial bank holding companies held 81 percent of all deposits (Jones and Nguyen 2004). All of this indicates a shift toward more lending activity being done by only a few larger institutions. This change might mean that non-filing institutions are less and less important in the current mortgage-lending environment. Access to Credit Several studies have looked at access to credit in areas serviced by small banks. In many cases, these studies explored the post-merger impact—a major area of concern when this activity increased dramatically during the late 1980s and early 1990s (Gilbert 1997). For example, Keeton (1998) explored whether rural bank takeovers in the Midwest resulted in slower loan and deposit growth. But he actually found the opposite—loan growth increased. Van Walleghem and Willis (1998) also found that the mergers allowed the new institutions to make more loans.
5 It should be noted that the categories employed by researchers often vary (small banks can be lenders with $50 million or less in assets or institutions with less than $500 million)and there is no one agreed definition for small, medium, and large banks.

What Are We Missing? 13
The aforementioned research contradicts a commonly held belief. By finding that community banks actually provide fewer loans, the research suggests that mergers may increase competition and bring in economies of scale with increased lending access. In some cases, small local banks may hold a monopoly, and the introduction of other providers might bring down costs (Kilkenny and Jolly 2005). This finding suggests that areas where small exempt banks predominate could have lending levels that are actually lower than otherwise would be found if larger banks were involved. These credit access studies directly address the underlying issues that form the basis of this study. Are any markets dominated by HMDA-filing-exempt lenders? If certain markets exist and are home to particularly disadvantaged populations (e.g., rural, low-income residents), then is credit access limited and/or are discriminatory practices occurring? Currently, we do not know the answers to these questions. For example, the ERS Credit in Rural America report (1997) states the limitations of HMDA data and how it curtails efforts to access mortgage lending in rural regions. Literature Overview
Based on the previous discussion and literature review, we know three important things. First, it is clear that HMDA exempts certain lending institutions from filing requirements. Lenders operating exclusively in rural areas and those possessing extremely small amounts of assets are specifically exempt from making their mortgage data public (Avery, et al. 2007). Second, there is likely considerable overlap among these institutions as they are most likely both rural and have small asset sizes. Previous research findings suggest that small lenders tend to be disproportionately located in rural areas (Keeton 1998; ERS 1988; Van Walleghem and Willis 1998; Walser and Anderlik 2004). Third, the number of HMDA-filing-exempt institutions has likely declined over the past 10 to 15 years. Research exploring bank consolidation has documented a decline in the overall number of both lenders and rural providers (Keeton 1998; Shields, Stokes, and Bae 2004; Walraven 1999). Although all of the research findings are certainly informative and suggest certain ideas, they never really address the basic question: To what extent is the omission of these exempt institutions a problem? This question is of concern for two reasons. First, as noted earlier, if these lenders are or have been concentrated in certain markets, particularly those made up primarily of vulnerable populations (low income, minorities, etc.), a failure to provide information on the banks might be exposing these residents to many of the ills that HMDA was created to address—that is, disinvestment and discrimination (McCoy 2007). Even now, working with the current HMDA data limitations,6 research suggests that there is widespread use of high interest rate loans by rural minorities and families purchasing manufactured housing (Singleton et al. 2006).
6 The HMDA limitations referred to here are those associated with the exclusion of institutions from filing mortgage lending data. As noted earlier in the report, institutions are excluded from HMDA filing requirements based on both assets (the subject of this research) and branch locations (if they have no branches in metro area they do not need to file with HMDA). This means that HMDA likely overlooks lending activities from extremely small lenders and those operating entirely in non‐metro areas.
14 Housing Assistance Council
Second, a lack of knowledge about such institutions prevents both policymakers and the public from knowing the role these institutions play in the nation’s many local credit markets. The literature review touched on the idea that although studies do explore small banks in general and suggest possible industry concentration, no studies specifically analyze extremely small institutions, which are the ones exempt from HMDA filing. The only picture one gets of such lenders is the occasional newspaper story that highlights the central role these institutions play in small communities (Zezima 2008). Given the current financial problems the nation is experiencing, we cannot afford to overlook certain lenders. It might ultimately be that research into these institutions leads to be a better understanding of effective lending practices. For example, Katie Zezima’s New York Times article (2008) on the small, HMDA-filing excluded First National Bank of Orton (Vermont) detailed how the bank was able to thrive in the tough economic climate. To begin researching these institutions, we must identify where they are located and determine which populations they serve. This paper presents just such information. Methodology
The key to our analysis is identifying and locating the asset-limited institutions that are not required to file HMDA data. Once these cases have been identified, the analysis explores institutional and structural trends over time and describes patterns in service area populations. The FDIC, which makes available publicly considerable background data on all federally insured depository institutions, provides sufficient information to both identify and evaluate those small banks and thrifts which have assets falling below the HMDA threshold. Research Questions This paper explores FDIC-insured institutions that qualify for exemption from HMDA filing requirements due to limited assets. The analysis specifically looks at trends in the number of filing-exempt lenders over a 12-year period and the populations they serve. The primary focus is on rural communities, because these populations are most likely to be served by such lenders. The following questions guided this effort:
1. What proportion of the banking market do these small banks comprise? 2. Have these small bank numbers changed over time? 3. Are these institutions concentrated in certain geographic areas? 4. What do the portfolios of these small banks look like? 5. What populations do these institutions serve?
By answering these questions, this research will paint a picture of the small lending market that HMDA does not cover. Determining trends in the market will provide a better understanding of how many institutions are excluded from HMDA filing. Given the seemingly constant changes in credit markets over the past five to ten years, these data should help us better understand how these institutions have reflected local needs and the overall market shifts.

What Are We Missing? 15
This analysis will also directly address concerns that these small banks might be concentrated in rural communities. As noted earlier, a problem would certainly exist if such banks were concentrated in a particular area, because that would mean these credit markets were not subject to the critical analysis and review that is necessary to address potential coverage and service issues. This analysis addresses such questions by looking at bank location and concentration. Study Parameters
It is important to understand the parameters of the study and the limits of the available data. First, this analysis involves only banks and thrifts, because these institutions are often associated with small communities and key data are readily available on them. Non-depository mortgage lenders are not included, because most of these institutions are already covered by HMDA requirements (McCoy 2007).7 Credit unions were also excluded, because many of them make few mortgage loans (Avery et al. 2007). However, credit unions were not as affected by the recent economic downturn, and, as measured by HMDA filing, the percentage of mortgage loans provided by them increased. If this trend continues, then it might be wise to include these lenders in any future analysis. Second, this study employs the FFIEC methodology for determining an institution’s HMDA filing status as it relates to assets. That is, an institution’s asset total, as found in its year-end (December 31) call report, is weighed against the upcoming year’s threshold.8 A bank reporting total assets below the HMDA threshold is not required to file. We applied this criterion for each year during the study period for all FDIC-insured lenders. It should be noted that this study does not specifically explore institutions that are exempt from HMDA filing because they serve only rural communities. As noted earlier, in addition to the asset limit exemption, lenders operating entirely in non-metro areas (no branches in metropolitan communities) need not file HMDA data, regardless of assets. This research explores only those lenders with assets falling below the filing threshold. The study then certainly misses some non-filers, but because banks that operate solely in rural areas are likely very limited the number should be small. Still, future research exploring the existence of larger, HMDA filing excluded rural lenders would help improve our understanding of rural credit markets. The key impediment to it occurring is the data demands which would be substantial requiring a researcher to identify not only bank headquarters locations but also each and every individual branch.9 Third, this research analyzes HMDA-asset-excluded lenders for the 1997–2009 period. The beginning date was selected because this was the first year that the current HMDA thresholds approach was instituted. That is, in 1997, the asset threshold started to be adjusted annually to account for inflation (McCoy 2007). Before then, a $10 million dollar asset limit was applied. The end date was selected because it was the last year for which data were available. The result is a 12-year study period that should be sufficiently long to detect trends.
7 McCoy (2007) points out that the filing requirements for non-depository HMDA filing institutions have constantly been tightening over time to where the HMDA now captures most of these institutions. 8 See the FFIEC website (www.ffiec.gov/hmda/reportde2009.htm), “Reporting Criteria for Depository Institutions,” for an explanation of how the filing requirement is determined. 9When one considers that even a modest sized bank can have well over ten branches it is easy to see how exploring them all would be a very labor intensive undertaking.

16 Housing Assistance Council
Defining Rural We employ a modified definition of rural that uses a county-based method to define rural as all counties located outside a designated metropolitan area plus all counties that are part of a metropolitan area but that contain no urbanized population. As such, this approach uses both residential information, as found in the U.S. Census definition, and economic connections, as found in the Office of Management and Budget (OMB) definition, to establish a precise measure. Map 1 displays urban and rural counties (defined as areas, because including all county boundaries clutters maps, making them hard to read) as defined in this study. This definition of rural is not the same as the ones used by the U.S. Census or the OMB. Instead, our definition combines elements of both residential/population and economic linkages, as noted above, which generates different results. Because there is no one agreed-upon definition, we aim to blend the two most widely used approaches so that the definition, once operationalized, will reflect both dimensions of rural. As a result, the analysis will be as accurate as possible. Locating Institutions
ArcGIS was used to geo-code and locate all lenders. The geocoding process involves placing data on a map based on its geographic locations. In this case, both the street address and the zip code for each FDIC-insured lender were linked to the actual street address on a map. We located all FDIC-insured banks and thrifts based on their headquarters. Once placed on a map, the bank’s jurisdiction can be determined, allowing the researchers to identify patterns and trends based on states, counties, and regions. In particular, rural institutions can be identified to assess the degree to which lenders are concentrated in such communities and how this has or has not changed over time.

What Are We Missing? 17
Map 1. Rural America
We also linked U.S. Census and Bureau of Labor Statistics county-level demographic and economic data to each institution. These data include such things as population, racial makeup, income, and unemployment. Connecting these data sources allowed us to understand the service area for most institutions. The small size of the banks and thrifts in this study means that most restrict their lending efforts to a specific county (Walser and Anderlik 2004). Finally, a descriptive analysis of small bank lending was performed. The focus of this analysis was on trends and patterns that specifically address the research questions noted in the previous section. For example, the analysis identified areas in which small lending institutions were concentrated and the characteristics of the populations they served. It also looked at bank portfolios and assessed how the exempt institutions differed from the larger, non exempt lenders. Data Sources This research used two different data sources. First, the literature review used electronic databases, which included both academic and government documents. The second part of the analysis used lending institution data. Through the Internet, the FDIC makes available to the public banking records, which makes it possible to identify banks by asset level and to geographically locate an institution and its branches. The website data are generated from bank

18 Housing Assistance Council
filings, which include both call reports and summary of deposit reports dating back to the 1990s. The FDIC website provides this information in a searchable form. Small banks were identified and critical background information accessed using FDIC databases that are publicly available via the Internet. This identification process involved executing database searches that select lending institutions by asset level. For the purposes of this research, small banks are those institutions that fail to meet the HMDA filing threshold. (The HMDA threshold was $39 million in total assets for 2007.) In addition, rural banks are those located in counties that are either outside metropolitan statistical areas (MSAs) or in an MSA that has no urban population.

What Are We Missing? 19
IDENTIFYING POTENTIAL FILING-EXEMPT LENDERS The goal of this research is to improve understanding of HMDA-excluded banks and the people they serve. As noted in the literature review, current research simply acknowledges that certain lenders are exempt from filing; this exclusion compromises the results generated using HMDA for certain mortgage markets—in particular, rural markets. This compromise has resulted in speculation about such markets and any research exploring them. This analysis begins to address the issue directly by exploring those institutions specifically exempt from HMDA filing due to limited assets. To begin, we first identified all FDIC-insured banks and thrifts that had assets falling below the annual HMDA asset threshold, thus qualifying for filing exemptions if they made mortgage loans. These lenders were identified for each year from 1997 to 2009, and any trends or patterns were then evaluated. The analysis then determined where these lenders were headquartered, with a particular focus on regions (e.g., Midwest, South)10 and rural areas and the potential concentration of non HMDA filers. We then explored the types of institutions that fell below the HMDA asset thresholds during the study period. The analysis used the FDIC’s asset categorization to evaluate these institutions. Finally, our analysis concluded with a review of service area populations and institutional portfolios. All together, our analysis aims to provide a baseline description of those institutions and markets being overlooked by HMDA filing exclusions. Estimating Excluded Lenders Figure 1 presents the annual number of FDIC-insured lenders for select categories during the 1997–2009 study period. Both the red and blue lines (red represents all FDIC-insured banks and thrifts, while blue represents those that fall below the HMDA asset threshold) point to a steady decline in such institutions. As shown in Table 1, the number of FDIC-insured lenders fell by 27 percent during the study period, dropping from 11,455 in 1997 to 8,298 in 2009. Meanwhile, the decline in small asset banks and thrifts (those falling below the HMDA threshold) was much greater (52 percent), reflecting a drop in numbers from 2,065 in 1997 to 989 in 2009. (See Tables A1 and A2 in the Appendix for the raw data.) The reduction in lender numbers found here is similar to those reductions reported in many other studies mentioned in the literature review (Nissan 2001; Keeton 1998; Shields, Stokes, and Bae 2004; Van Walleghem and Willis 1998). Walraven’s (1999) study stands out for having found that mergers disproportionately involved small rural institutions. Our finding that small lenders suffered a more rapid decline in numbers fits well with Walraven’s research. This agreement with the literature indicates that our sample accurately reflects the banking market we are exploring, which is limited-asset rural lenders.
10The authors actually used FDIC regions and offices to divide cases for the location analysis. Although these offices do generally fall within specific regions, they are not the same as U.S. Census defined regions.

20 Housing Assistance Council
Figure 1. Trends in the Number of Banks and Thrifts 1997-200911
Source: FDIC data: Author tabulation of institutions based data download from the FDIC website on insured lenders (Based on institution filings, call reports, and Summaries of Deposits), which is organized and made available by the FDIC. The following FDIC website was accessed throughout 2009 and early 2010 to compile the data for this work: www.fdic.gov/quicklinks/analysts.html. HMDA data: Federal Financial Institutions Examination Council (FFIEC) compiled data on lenders filing HMDA data and make available at their website. The following FFIEC website was accessed in early 2010 by the author: www.ffiec.gov/hmda/history.htm
Figure 1 also includes the number of HMDA filers (represented by a green bar) to illustrate how the level of HMDA filers changed over the study period. Despite the overall decline in lenders, the number of filers grew slightly, increasing from 7,925 in 1997 to 8,388 in 2009 (see Table 1). Interestingly, a review of Federal Reserve Board reports finds that the number of commercial banks and savings institutions filing HMDA data actually dropped between 2004 and 2008 (latest available data) by 2 percent; however, FDIC-insured commercial banks and savings institution numbers declined by even more, 7 percent. (See Appendix Table A-3 for data.) This means that the proportion of such institutions filing records still increased.
11 It is important to remember here a few things with regards to HMDA coverage and FDIC-insured institutions. First off, not all HMDA filers are covered by FDIC. There are mortgage companies, credit unions, and likely even some uninsured banks that file. In Appendix Table A3 we show the number of credit unions and mortgage companies that have filed over the 2004 to 2005 period. Likewise, there could be some banks or thrifts which are below the HMDA asset threshold and are not insured. While the number is likely very small it is still possible.
0
2
4
6
8
10
12
14
1997 1998 1999 2000 2001 2002 2003 2004 2005 2006 2007 2008 2009
Number of Institutions in Thousands
Year
All HMDA Filers Asset Exempt Banks & Thrifts All FDIC Insured Lenders

What Are We Missing? 21
Table 1. Change in Lending Institutions, 1997–2009
1997 2009*
FDIC-Insured Lenders with Assets Below HMDA Threshold 2,065 989 -52.11
All FDIC Insured Lenders 11,455 8,297 -27.57
All HMDA Filers* 7,925 8,388 5.84
Institutions Year % Change
*We used 2008 data for the HMDA category because that was the most recent year available. Source: FDIC data: See Figure 1 for description. HMDA data: See Figure 1 for description.
Figure 2 displays the annual percentage of all FDIC-insured banks and thrifts that would qualify for an HMDA filing exemption based on assets. This figure shows that the overall percentage of FDIC-insured lenders that could qualify for the HMDA filing exemption was always relatively small, less than 20 percent of all institutions. It further highlights how these small lenders have declined over the past 12 years. In particular, in 1997, 18 percent of all FDIC-insured banks and thrifts had assets below the HMDA threshold; however, by 2009, that number had declined to less than 12 percent. Figure 2. Percentage Change in Lenders Falling Below HMDA Asset-Threshold, 1997–2009
0.00
2.00
4.00
6.00
8.00
10.00
12.00
14.00
16.00
18.00
20.00
1997 1998 1999 2000 2001 2002 2003 2004 2005 2006 2007 2008 2009
Percen
tage
of A
ll FD
IC In
sured Lend
ers
Calendar Year
Asset Exempt Banks & Thrifts
Source: FDIC data: See Figure 1 for description.
Consequently, Figure 2 shows us that in 2009 the HMDA could be overlooking as much as 12 percent of the FDIC-insured banks and thrifts because of the asset exclusion.12 Although this is a relatively small proportion of all institutions that have clearly been declining over the years, it does represent more than 900 lenders in 2009. Further exploration is needed to better understand these institutions, their activities, their locations, and the markets they serve.
12 We say “could” because in order for that to be true all of these lenders would have to make some mortgage loans. If a bank does not make mortgage loans then they would not be filing. As such, this estimates the upper limits of what could be excluded and the true number is smaller.
22 Housing Assistance Council
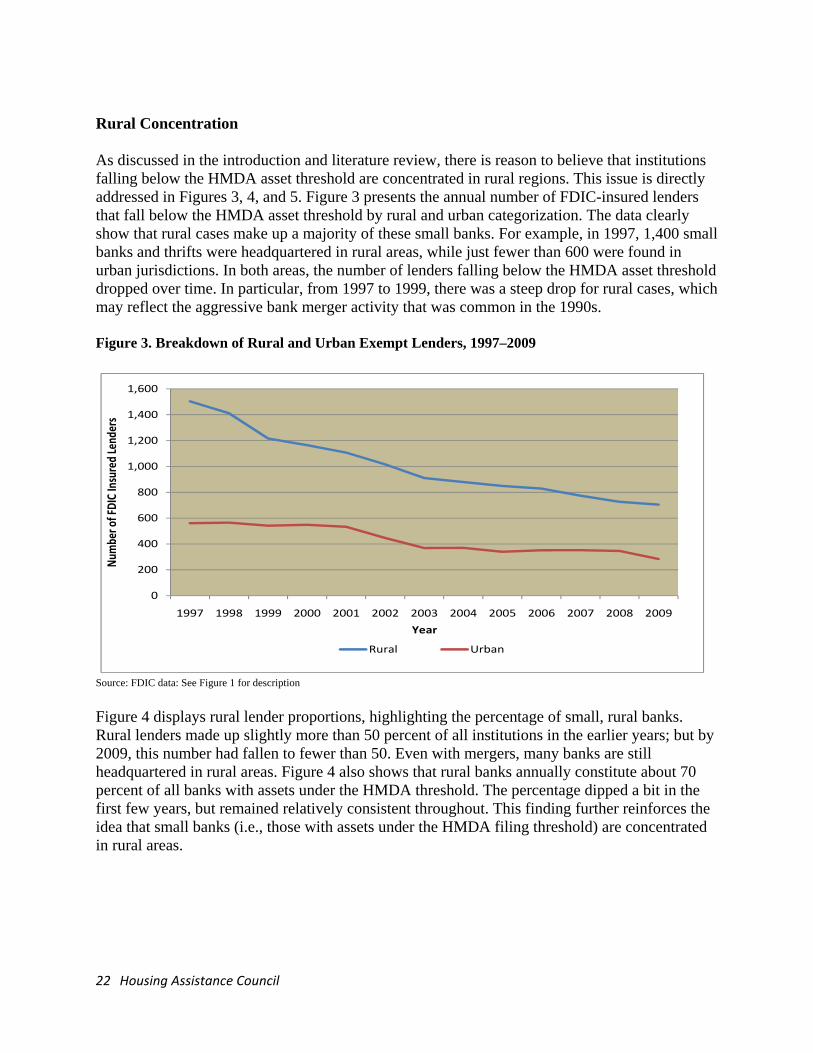
Rural Concentration As discussed in the introduction and literature review, there is reason to believe that institutions falling below the HMDA asset threshold are concentrated in rural regions. This issue is directly addressed in Figures 3, 4, and 5. Figure 3 presents the annual number of FDIC-insured lenders that fall below the HMDA asset threshold by rural and urban categorization. The data clearly show that rural cases make up a majority of these small banks. For example, in 1997, 1,400 small banks and thrifts were headquartered in rural areas, while just fewer than 600 were found in urban jurisdictions. In both areas, the number of lenders falling below the HMDA asset threshold dropped over time. In particular, from 1997 to 1999, there was a steep drop for rural cases, which may reflect the aggressive bank merger activity that was common in the 1990s. Figure 3. Breakdown of Rural and Urban Exempt Lenders, 1997–2009
0
200
400
600
800
1,000
1,200
1,400
1,600
1997 1998 1999 2000 2001 2002 2003 2004 2005 2006 2007 2008 2009
Num
ber o
f FDIC In
sured Lend
ers
Year
Rural Urban
Source: FDIC data: See Figure 1 for description
Figure 4 displays rural lender proportions, highlighting the percentage of small, rural banks. Rural lenders made up slightly more than 50 percent of all institutions in the earlier years; but by 2009, this number had fallen to fewer than 50. Even with mergers, many banks are still headquartered in rural areas. Figure 4 also shows that rural banks annually constitute about 70 percent of all banks with assets under the HMDA threshold. The percentage dipped a bit in the first few years, but remained relatively consistent throughout. This finding further reinforces the idea that small banks (i.e., those with assets under the HMDA filing threshold) are concentrated in rural areas.

What Are We Missing? 23
Figure 4. Annual Proportions of FDIC Rural Lenders, 1997–2009
Source: FDIC data: See Figure 1 for description Finally, Figure 5 provides some perspective. Rural banks do make up a majority of lenders falling below the HMDA asset threshold; however, these institutions do not constitute a significant portion of the rural lending market. Figure 5 shows that exempt banks constitute a minority of both rural and urban banks. In other words, there is no case in which such banks and thrifts constitute greater than 25 percent of rural or urban lenders. Although a number of these lending institutions exist, they do not constitute a significant proportion of either the rural or the urban market. Figure 5. Percentage of Rural and Urban FDIC Lenders Below the HMDA Asset Threshold
Source: FDIC data: See Figure 1 for description.

24 Housing Assistance Council
Rural Cases at the County Level To better assess potential areas of concentration, it is best to organize cases on the county level. Individual cases were aggregated over the 12-year study period; then counties were categorized based on the amount of rural lenders they had that fell below the HMDA asset threshold each year. Map 2 presents two categories of county. First are the counties that had at least one lender per year that fell below the HMDA threshold— over 80 percent of these counties were rural, a clear majority. More than half of these counties were located in the Midwest. The second county category in Map 2 identifies those cases in which an average of two or more small, HMDA filing exempt qualifying, lenders per year were operating. Once again, rural counties were a majority of cases in this group, making up over 70 percent of such counties. Excluding four counties, two in the West (Washington and Montana) and two in the South (Georgia and Mississippi), all of these high-concentration areas were in the Midwest (Texas included). Map 2. Rural Counties with at Least One Lender Falling below the HMDA Threshold
Source: FDIC data: See Figure 1 for description. Not all rural counties that had a bank or thrift operating with assets below the HMDA threshold were highlighted in this map. We chose not to include these counties because doing so would essentially highlight most of rural America (1,079 rural counties would have received this

What Are We Missing? 25
distinction). Such a map would make it difficult to identify patterns and trends that clearly appear on the more limited map provided here. Nevertheless, it is good to remember that Map 2 ignores such cases; we do not mean to imply that no small banks exist in counties that are not highlighted. Rural Concentration Overview Clearly, small FDIC-insured lenders—that is, institutions with assets falling below the HMDA filing threshold—are concentrated in rural areas. More than 70 percent of these lenders were headquartered in rural jurisdictions, and this proportion remained relatively constant throughout the study period. These banks were concentrated primarily in the Midwest, where several hundred counties had at least one small lender operating in their jurisdiction for each year of the study. The following section builds on this analysis by looking at the location of these lenders on a broader scale and comparing rural and urban areas of concentration.

26 Housing Assistance Council
GEOGRAPHIC CONCENTRATION FDIC Regions The following analysis examines the location of the small banks and thrifts with an aim of identifying any areas of concentration. This analysis begins by locating banks according to FDIC regions. Map 3 shows the eight FDIC regions, which are labeled according to the location of the primary regional office. This initial analysis locates the banks according to these regions in order to determine patterns or areas of concentration where these small institutions are the primary source of credit. Map 3. FDIC Regions
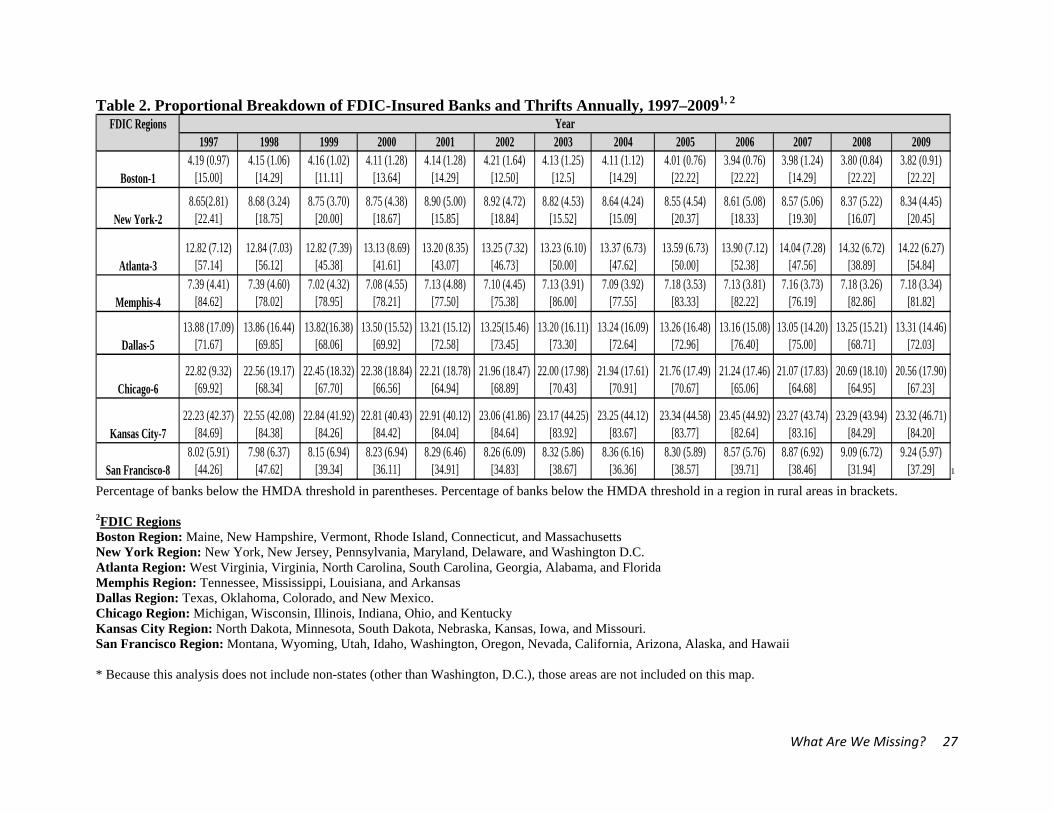
Source: FDIC data: See Figure 1 for description. Table 2 shows that the overwhelming proportion of small banks is located in what can be thought of as the central part (Midwest) of the country—consistently 77 percent of all asset-excluded banks are found in the Dallas, Kansas City, and Chicago regions. The Kansas City region stands out, with more than 40 percent of all excluded banks within its boundaries, confirming what we found in identifying areas of concentration in rural counties. Walser and Anderlik’s (2004) study of Midwest depopulation and the impact on access to credit also highlights the concentration of small banks in this region.
What Are We Missing? 27
Table 2. Proportional Breakdown of FDIC-Insured Banks and Thrifts Annually, 1997–20091, 2
1997 1998 1999 2000 2001 2002 2003 2004 2005 2006 2007 2008 2009
Boston-14.19 (0.97)
[15.00]4.15 (1.06)
[14.29]4.16 (1.02)
[11.11]4.11 (1.28)
[13.64]4.14 (1.28)
[14.29]4.21 (1.64)
[12.50]4.13 (1.25)
[12.5]4.11 (1.12)
[14.29]4.01 (0.76)
[22.22]3.94 (0.76)
[22.22]3.98 (1.24)
[14.29]3.80 (0.84)
[22.22]3.82 (0.91)
[22.22]
New York-28.65(2.81)
[22.41]8.68 (3.24)
[18.75]8.75 (3.70)
[20.00]8.75 (4.38)
[18.67]8.90 (5.00)
[15.85]8.92 (4.72)
[18.84]8.82 (4.53)
[15.52]8.64 (4.24)
[15.09]8.55 (4.54)
[20.37]8.61 (5.08)
[18.33]8.57 (5.06)
[19.30]8.37 (5.22)
[16.07]8.34 (4.45)
[20.45]
Atlanta-312.82 (7.12)
[57.14]12.84 (7.03)
[56.12]12.82 (7.39)
[45.38]13.13 (8.69)
[41.61]13.20 (8.35)
[43.07]13.25 (7.32)
[46.73]13.23 (6.10)
[50.00]13.37 (6.73)
[47.62]13.59 (6.73)
[50.00]13.90 (7.12)
[52.38]14.04 (7.28)
[47.56]14.32 (6.72)
[38.89]14.22 (6.27)
[54.84]
Memphis-47.39 (4.41)
[84.62]7.39 (4.60)
[78.02]7.02 (4.32)
[78.95]7.08 (4.55)
[78.21]7.13 (4.88)
[77.50]7.10 (4.45)
[75.38]7.13 (3.91)
[86.00]7.09 (3.92)
[77.55]7.18 (3.53)
[83.33]7.13 (3.81)
[82.22]7.16 (3.73)
[76.19]7.18 (3.26)
[82.86]7.18 (3.34)
[81.82]
Dallas-513.88 (17.09)
[71.67]13.86 (16.44)
[69.85]13.82(16.38)
[68.06]13.50 (15.52)
[69.92]13.21 (15.12)
[72.58]13.25(15.46)
[73.45]13.20 (16.11)
[73.30]13.24 (16.09)
[72.64]13.26 (16.48)
[72.96]13.16 (15.08)
[76.40]13.05 (14.20)
[75.00]13.25 (15.21)
[68.71]13.31 (14.46)
[72.03]
Chicago-622.82 (9.32)
[69.92]22.56 (19.17)
[68.34]22.45 (18.32)
[67.70]22.38 (18.84)
[66.56]22.21 (18.78)
[64.94]21.96 (18.47)
[68.89]22.00 (17.98)
[70.43]21.94 (17.61)
[70.91]21.76 (17.49)
[70.67]21.24 (17.46)
[65.06]21.07 (17.83)
[64.68]20.69 (18.10)
[64.95]20.56 (17.90)
[67.23]
Kansas City-722.23 (42.37)
[84.69]22.55 (42.08)
[84.38]22.84 (41.92)
[84.26]22.81 (40.43)
[84.42]22.91 (40.12)
[84.04]23.06 (41.86)
[84.64]23.17 (44.25)
[83.92]23.25 (44.12)
[83.67]23.34 (44.58)
[83.77]23.45 (44.92)
[82.64]23.27 (43.74)
[83.16]23.29 (43.94)
[84.29]23.32 (46.71)
[84.20]
San Francisco-88.02 (5.91)
[44.26]7.98 (6.37)
[47.62]8.15 (6.94)
[39.34]8.23 (6.94)
[36.11]8.29 (6.46)
[34.91]8.26 (6.09)
[34.83]8.32 (5.86)
[38.67]8.36 (6.16)
[36.36]8.30 (5.89)
[38.57]8.57 (5.76)
[39.71]8.87 (6.92)
[38.46]9.09 (6.72)
[31.94]9.24 (5.97)
[37.29]
YearFDIC Regions
1
Percentage of banks below the HMDA threshold in parentheses. Percentage of banks below the HMDA threshold in a region in rural areas in brackets. 2FDIC Regions Boston Region: Maine, New Hampshire, Vermont, Rhode Island, Connecticut, and Massachusetts New York Region: New York, New Jersey, Pennsylvania, Maryland, Delaware, and Washington D.C. Atlanta Region: West Virginia, Virginia, North Carolina, South Carolina, Georgia, Alabama, and Florida Memphis Region: Tennessee, Mississippi, Louisiana, and Arkansas Dallas Region: Texas, Oklahoma, Colorado, and New Mexico. Chicago Region: Michigan, Wisconsin, Illinois, Indiana, Ohio, and Kentucky Kansas City Region: North Dakota, Minnesota, South Dakota, Nebraska, Kansas, Iowa, and Missouri. San Francisco Region: Montana, Wyoming, Utah, Idaho, Washington, Oregon, Nevada, California, Arizona, Alaska, and Hawaii * Because this analysis does not include non-states (other than Washington, D.C.), those areas are not included on this map.
28 Housing Assistance Council
Specifically looking at the states within the Kansas City FDIC regional office service area, Minnesota, Kansas, and Nebraska each averaged more than 100 of these extremely small lenders per year. The other two states with an average of 100 or more small lenders are Illinois and Texas. The number of HMDA-filing-exempt FDIC-insured lenders (assets), as was shown in earlier figures, dropped significantly (by at least 37 percent) for these five states. For example, Illinois had 212 FDIC lenders below the HMDA asset threshold in 1997, and by 2009, that number had fallen to 98. (See Appendix Table for state data.) An expected finding, based on the previous section, is that the percentage of FDIC-insured lenders with assets falling below the HMDA asset threshold and headquartered in rural counties (bracketed number in Table 2) is greater than 80 percent for the Kansas City office. More than 54 percent of the counties in Kansas and Minnesota had at least one FDIC-insured lender with assets below the HMDA threshold for each year of the study. Such level of activity indicates that this type of lender is an important part of that area’s credit market. The majority of these lenders were headquartered in rural counties in all but three regions—Boston, New York, and San Francisco. Although the New York and Boston region data and the lack of rural cases are not a surprise, given the heavily urbanized nature of these areas, San Francisco is a bit of a puzzle. This area contains a considerable amount of rural land; yet, less than half of the counties that are home to one of these institutions are outside of an urban jurisdiction. For the most part, the patterns seem to be fairly consistent over time, with certain regions having generally the same proportion of small lenders and in the same location (rural-urban counties). This finding means that the level of decline was relatively consistent among all areas—for both rural and urban jurisdictions; otherwise, one would expect to see a shift in proportions. Despite the wealth of rural examples, small banks cannot simply be considered a rural phenomenon. As shown in Map 4, small banks can be found in urban areas throughout the nation. For example, 80 percent of New Jersey counties contained a small bank with assets below the HMDA threshold at some time in the study. However, the more concentrated and long-term activity of small lenders (highlighted in Map 4 with pink) is much more predominant in rural areas of the country.

What Are We Missing? 29
Map 4. All FDIC-insured lenders falling below HMDA-asset-threshold by County Concentration

30 Housing Assistance Council
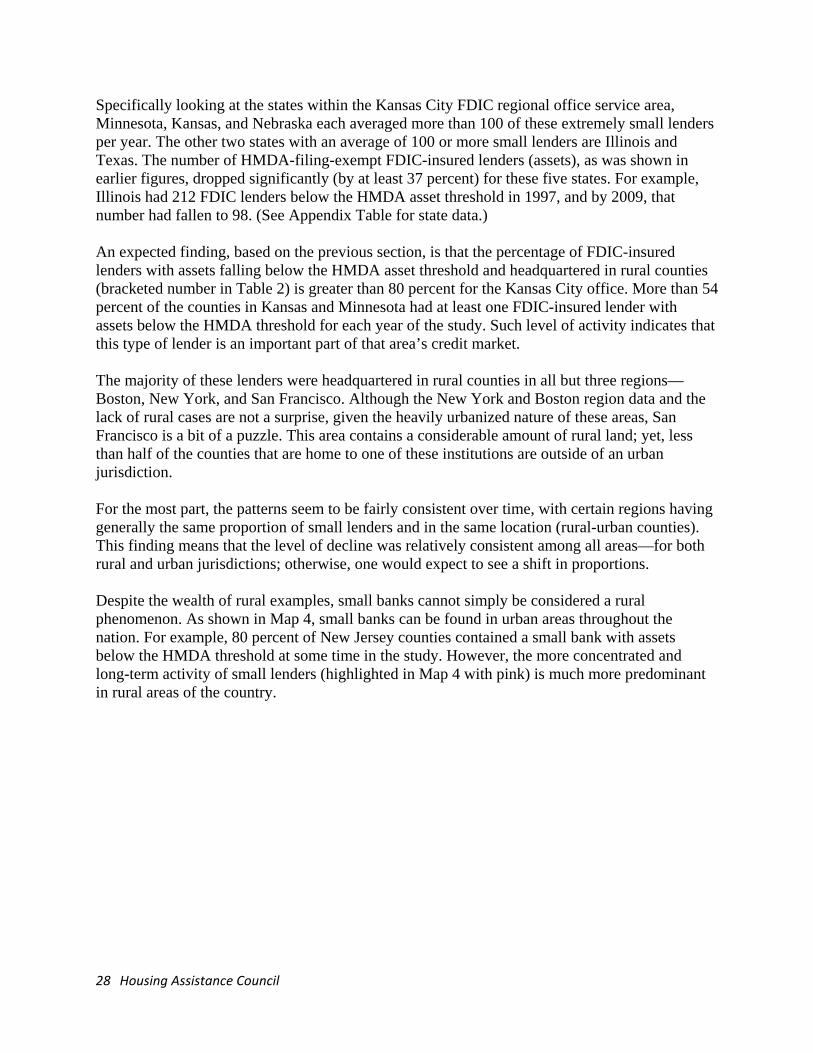
BANK SPECIFICS Another way to look at lenders that fall below the HMDA asset threshold is by their primary banking activity. Two classifications were used for this portion of the analysis. First, lenders were categorized according to whether they were commercial banks or savings institutions. Second, institutions were assessed based on their FDIC asset categorization. The FDIC classifies insured lenders into one of nine different classifications based on the assets they hold. Both of these approaches allowed us to identify the segments of the financial services industry that were being excluded through HMDA. Commercial Banks and Thrifts The FDIC insures both commercial banks and savings institutions. Savings institutions also referred to as thrifts or savings and loans, have traditionally been small, community-based institutions charged primarily with focusing on home mortgage lending. In fact, these institutions are specifically limited to how much money they can lend in commercial loans and, through a host of other restrictions, must keep most of their assets invested in consumer loans. Commercial banks, on the other hand, provide a host of financial services. They are not restricted to the amount of loans they can make, and they do not have to focus on mortgage lending. Over time, however, thrifts and banks have come to look more and more alike, with thrifts providing more varied services. Commercial banks are still thought of as the one-stop shopping for financial services, whereas savings institutions are considered primarily a way to save money or as a source for a mortgage loan. Figure 6 and Tables 3A and 3B present information on FDIC-insured lenders that fell below the asset threshold based on whether they were a savings institution or a commercial bank. The trend lines in Figure 6 illustrate how the overwhelming majority of institutions falling below the HMDA asset threshold are commercial banks. These commercial banks annually represent approximately 90 percent of all small lenders. Over time, savings institutions have slightly increased their percentage, due primarily to the more rapid decline in banks. Table 3A addresses the question of whether commercial banks are disproportionately represented among small institutions. The last two columns for each year show the proportion of all FDIC lenders that each bank type contains and then the proportion of these institutions falling below the HMDA asset threshold. This table shows that, initially, commercial banks were overrepresented, and savings institutions underrepresented. Columns six and seven highlight these same percentages for the final year of the study (2009). There was clearly a reduction in the proportion of extremely small commercial banks. On the other side, savings institutions now have proportional representation among lenders falling below the HMDA asset threshold. Table 3B clearly explains what has driven this change: There was a 54 percent change in the number of commercial banks falling below the HMDA asset threshold, which is much larger than the 26 percent reduction in this type of lender overall. This means that small commercial banks declined very quickly as compared with larger banks. Savings institutions, on the other hand, experienced relatively consistent levels of decline across the board (approximately 30
What Are We Missing? 31
percent). Although the savings institution decline overall was greater than what commercial banks experienced, the rate for small commercial banks was higher. This explains how the proportion of savings institutions qualifying for an HMDA asset reduction could increase, even as the overall numbers dropped. The two columns in Table 3A also indicate the percentage of each small lender found in a rural area. In both cases, commercial banks were overwhelmingly rural, and savings institutions were about evenly split. There is no easy answer for why this was the case; however, one could have expected the high proportion of rural commercial banks, because they constituted the overwhelming majority of lenders in question. Figure 6. FDIC-Insured Commercial Banks and Savings Institutions, 1997–2008
Source: FDIC data: See Figure 1 for description. The rapid decline in commercial banks may indicate a continuation of the rapid decline in small lenders with assets falling below the HMDA filing threshold. For example, if the current rate of decline were to continue, in another 12 years the number of commercial institutions falling below the HMDA asset threshold would go from 869 in 2009 to 400 in 2021. Because these banks make up the majority of rural exempt institutions, this decline could mean a particularly large decline in their numbers. Of course, one cannot assume that this trend will continue, especially when it is based on just 12 years of data.

32 Housing Assistance Council
Table 3A. Percentage Breakdown of Commercial-Savings FDIC Lenders Bank Type 1997 2009
% of All FDIC-
Insured Lenders
Lenders with Assets Below HMDA Threshold1
% of All FDIC
Insured Lenders
Lenders with Assets Below HMDA Threshold1
% by Bank Type1
% of Bank Type Located in Rural
Area1
% by Bank Type1
% of Bank Type Located in Rural
Area1 Commercial Banks 83.19% 91.23% 75.00% 85.30% 87.87% 74.57% Savings Institutions 16.81% 8.77% 50.30% 14.70% 12.13% 47.50%
1 For these percentages they were calculated as follows: “% by Bank Type” refers to the percentage of FDIC insured lenders with assets below the HMDA threshold that were commercial banks and those that were Savings institutions (this equals 100%); and “% of Bank Type Located in Rural Area” refers to the percentage of these types of limited asset banks which are located in rural areas (these do not sum to 100% since they simply tell us of those commercial banks or savings institutions a certain percentage were headquartered in rural communities.) See Appendix Tables A5 through A8 for raw numbers from which these percentages were derived. Source: FDIC data with HAC tabulation. See note under Figure 1 for more details.
Table 3B. Change 1997 to 2009 Commercial-Savings FDIC Lenders Institution All Lenders Lenders with Assets Below
HMDA Threshold 1997 2009 Percent
Change 1997 2009 Percent
Change
Commercial Banks 9,508 7,070 -25.64 1,884 869 -53.87
Savings Institutions 1,921 1,218 -36.60 181 120 -33.70 Source: FDIC data with HAC tabulation. Lenders Categorized by Asset Type A more focused way to look at these institutions is based on their assets. For example, certain lenders may primarily provide loans involving agriculture or credit cards. One can then look at an institution’s assets (loans it holds) and identify an area of concentration. Once this is done, it is possible to better understand whether the threshold is or is not primarily excluding mortgage providers. The FDIC categorizes banks according to their assets. This categorization is based on a bank’s portfolio which reflects the lender’s activities and areas of specialization. Table 4 describes each of the nine asset categories the FDIC employs. Each group is mutually exclusive, and every FDIC-insured institution is placed in a group. Using this dichotomy, we can identify a bank by its type and compare all insured institutions during the study period to just those falling below the HMDA asset threshold. These data are presented in Figures 7 and 8.

What Are We Missing? 33
Table 4. FDIC-Insured Lender Asset Categories Category Definition International Specialization
Institutions with assets greater than $10 billion and more than 25 percent of total assets in foreign offices
Agricultural Specialization
Banks with agriculture production loans, plus real estate loans secured by farmland in excess of 25 percent of total loans and leases
Credit Card Specialization
Institutions with credit card loans, plus securitized receivables in excess of 50 percent of total assets, plus securitized receivables
Commercial Lending Specialization
Institutions with commercial and industrial loans, plus real estate construction and development loans, plus loans secured by commercial real estate properties in excess of 25 percent of total assets
Mortgage Lending Specialization
Institutions with residential mortgage loans, plus mortgage-backed securities in excess of 50 percent of total assets
Consumer Lending Specialization
Institutions with residential mortgage loans, plus credit card loans, plus other loans to individuals in excess of 50 percent of total assets
Other Specialization < $1 Billion
Institutions with assets less than $1 billion and with loan leases less than 40 percent of total assets
All Other < $1 Billion
Institutions with assets less than $1 billion that do not meet any of the definitions above; they have significant lending activity with no identified asset concentrations
All Other > $1 Billion
Institutions with assets greater than $1 billion that do not meet any of the definitions above; they have significant lending activity with no identified asset concentrations
Source: FDIC data: See Figure 1 for description. The trend lines in Figure 7 illustrate how, over time, the proportional makeup of lenders changed. In particular, commercial banks increased from around 30 percent of all lenders to almost 60 percent. This change largely resulted from the decline in lenders classified as “All Other Under $1 Billion,” which declined from 22 percent to 9 percent of all lenders. In fact, this change almost mirrors the rise of banks involved in commercial banks. In addition, the amount of lenders focusing on mortgage lending decreased during the study, from 15 percent to 10 percent of all cases.

34 Housing Assistance Council
Figure 7. All FDIC-Insured Lenders by Asset Categories, 1997–2009
Source: FDIC data: See Figure 1 for description. A comparison of the trend lines in Figure 7 with those in Figure 8, which highlights patterns for lenders that fall below the HMDA asset threshold, shows a huge difference. Banks that had assets of 25 percent or more in agriculture production constituted a majority of small FDIC lenders that fell below the HMDA asset threshold. This pattern is relatively consistent throughout, ranging from 46 percent to 48 percent. If we look only at rural lenders that qualify for the HMDA asset filing exemption, however, agriculture represents approximately 60 percent of all cases annually. Similar to all FDIC-insured lenders in Figure 8, the proportion of commercial banks did increase among the small institutions. However, it was only from 12 to 20 percent, and the actual change was driven by a reduction in small banks overall; not by an increase in commercial institutions, as was the case for all lenders. Mortgage and consumer lenders constituted 13 percent of all exempt lenders at the end of the study period. For rural lenders qualifying for the exemption, these two categories combined never reached 10 percent of all lenders. Figure 9 plots the number of rural, limited-asset cases classified as either a mortgage or a consumer lender according to assets. This number amounts to fewer than 100 lenders in the past few years. The amount of mortgage lending being overlooked might be as bad as it first appeared when one considers the larger numbers of several hundred lenders being excluded.

What Are We Missing? 35
Figure 8. All FDIC-Insured Lenders Falling Below HMDA Threshold by Asset Categories, 1997–2009
Source: FDIC data: See Figure 1 for description. A caveat must be made here: Even though an institution was not categorized as “mortgage” or “consumer,” it probably did still make mortgage loans. A local banking institution primarily focusing on farm loans may have provided mortgage loans to supply a service to the local community. In addition, other banks may have been excluded from HMDA filing because they did not have an office in a metropolitan area. What this finding really means is that the degree of mortgage or consumer lending did not constitute 50 percent of all assets at a great majority of those institutions that have assets below the HMDA threshold. It means the amount of lending being overlooked by HMDA in rural regions might not be as significant as one would first be led to believe by looking only at the raw data.

36 Housing Assistance Council
Figure 9. Rural Limited Asset Mortgage and Consumer Banks, 1997–2009
Source: FDIC data: See Figure 1 for description.

What Are We Missing? 37
SERVICE AREA DEMOGRAPHICS This section of the analysis specifically looked at demographic and economic data for the counties in which each lender had its headquarters. As Walser and Anderlik (2004) noted, small lender activity is usually limited to a single county, primarily where an institution’s headquarters is located, because such banks have too few resources to extend beyond that area. The research proceeded by initially categorizing counties according to the number of small asset institutions headquartered in them and the duration for which they had these institutions. This research is similar to the data on bank locations presented earlier. Once this was done, we generated cross tabs to look at the proportional makeup (service area population and demographic condition) of the different categories. The aim of this effort was to identify differences across groups that might suggest specific traits common to areas serviced by these limited-asset banks. Minority Populations The average minority population in rural counties was 19 percent as illustrated in Table 5. In those rural counties with at least one lender falling below the HMDA asset threshold, the average minority population was slightly less (16.9 percent). As the number of lenders potentially qualifying for an HMDA exemption increased, the minority population decreased, suggesting that these lenders are not concentrated in communities that are disproportionately minority. Table 5. Minority Population in Service Area Counties
County Type Mean (median)
All Lenders Rural Urban
All counties (Lenders Above and Below Asset Threshold)
19% (10.7%)
25.6% (27.2%)
At least one lender operating in county during study below HMDA Threshold
16.9 % (9.3%)
27.2% (23.4%)
At least one lender below HMDA threshold serving each year
12.4% (6.5%)
25.4% (19.6%)
Two or more lenders below HMDA threshold serving the county per year
11.0% (6.2%)
29.7% (25.8%)
Source: 2000 Census Summary File Data. Based on this analysis there was no dramatic difference among the service populations regarding race. Second, there does not appear to be any concentration of lenders in counties with significant minority populations. If that had been the case, the average and median percentage of minority population would increase as the number of potential HMDA exempt institutions grew. Third, the mean county percentage of minority residents is lower in such counties than we see when looking at the average for all rural counties, with the exact opposite being the case for urban jurisdictions. There is no easy explanation for these patterns. Elderly Populations In addition to race, the age of a service area population is an important consideration. Residents older than 60 years of age may be more restricted in access to credit and, as a result, may suffer
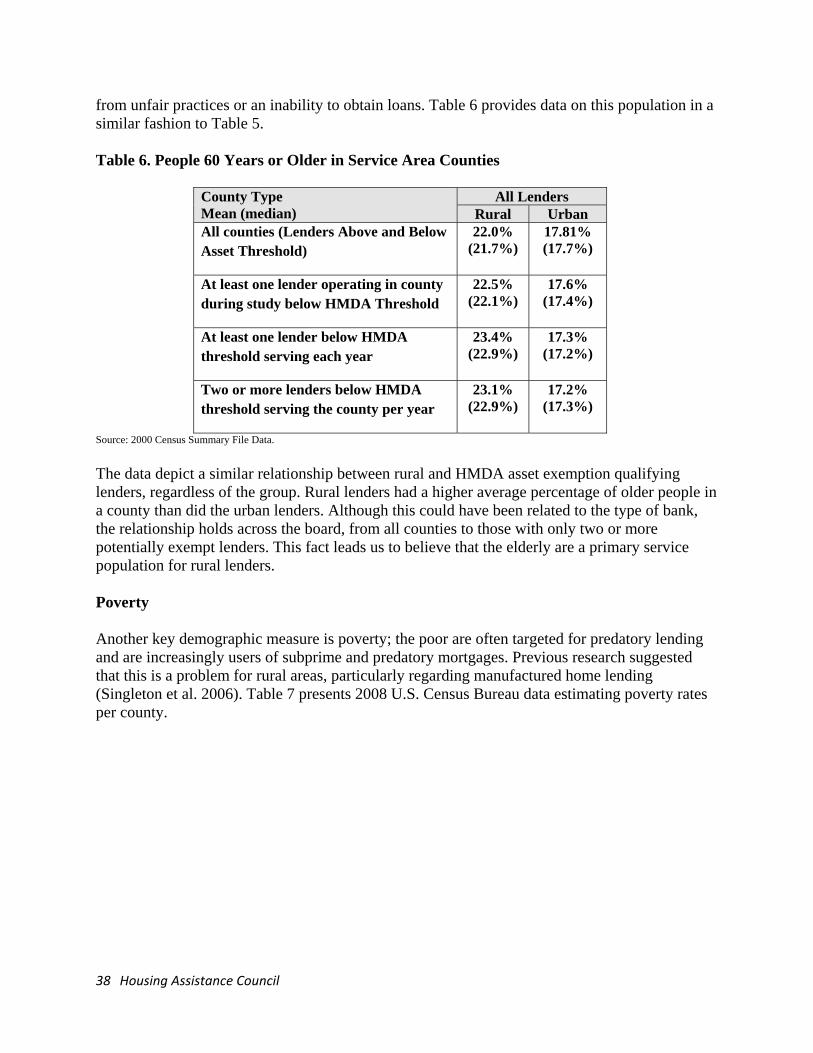
38 Housing Assistance Council
from unfair practices or an inability to obtain loans. Table 6 provides data on this population in a similar fashion to Table 5. Table 6. People 60 Years or Older in Service Area Counties
County Type Mean (median)
All Lenders Rural Urban
All counties (Lenders Above and Below Asset Threshold)
22.0% (21.7%)
17.81% (17.7%)
At least one lender operating in county during study below HMDA Threshold
22.5% (22.1%)
17.6% (17.4%)
At least one lender below HMDA threshold serving each year
23.4% (22.9%)
17.3% (17.2%)
Two or more lenders below HMDA threshold serving the county per year
23.1% (22.9%)
17.2% (17.3%)
Source: 2000 Census Summary File Data. The data depict a similar relationship between rural and HMDA asset exemption qualifying lenders, regardless of the group. Rural lenders had a higher average percentage of older people in a county than did the urban lenders. Although this could have been related to the type of bank, the relationship holds across the board, from all counties to those with only two or more potentially exempt lenders. This fact leads us to believe that the elderly are a primary service population for rural lenders. Poverty Another key demographic measure is poverty; the poor are often targeted for predatory lending and are increasingly users of subprime and predatory mortgages. Previous research suggested that this is a problem for rural areas, particularly regarding manufactured home lending (Singleton et al. 2006). Table 7 presents 2008 U.S. Census Bureau data estimating poverty rates per county.

What Are We Missing? 39
Table 7. Percentage of Residents Living in Poverty
County Type Mean (median)
All Lenders Rural Urban
All counties (Lenders Above and Below Asset Threshold)
16.0% (14.9%)
12.3% (11.9%)
At least one lender operating in county during study below HMDA Threshold
15.1% (13.8%)
12.2% (11.9%)
At least one lender below HMDA threshold serving each year
14.0% (12.6%)
12.3% (12.0%)
Two or more lenders below HMDA threshold serving the county per year
12.9% (11.8%)
12.3% (12.0%)
Source: 2000 Census Summary File Data. There is no easily visible pattern in Table 7 for urban counties. The poverty rate for the service areas appeared to stay the same, even as the amount and concentration of small lenders increased. Rural lenders seemed to exhibit a counterintuitive association in which the number of small banks with assets below the HMDA threshold was indirectly related to a service area’s poverty rate. A better measure for identifying long-term economic woes is the persistent poverty measure. A county that has experienced poverty rates at 20 percent or higher for four straight decennial censuses is considered to be in a state of “persistent poverty.” The USDA Economic Research Services created the measure, and we use it Table 8. Table 8. Persistent Poverty Measure
County Type Mean (median)
All Lenders Rural Urban
All counties (Lenders Above and Below Asset Threshold)
15.5% 2.4%
At least one lender operating in county during study below HMDA Threshold
14.3% 3.1%
At least one lender below HMDA threshold serving each year
7.5% 1.7%
Two or more lenders below HMDA threshold serving the county per year
4.3% 0%
Source: USDA Economic Research Services. Website for information: http://www.ers.usda.gov/publications/aib710/aib710l.htm

40 Housing Assistance Council
Once again, there does not seem to be any troubling association in Table 9. As the number of small banks increases, the proportion of persistent poverty counties decreases. While there are fewer institutions in these counties, it appears that lenders with assets below the HMDA threshold are concentrated in persistent poverty counties. A final measure is population change. In particular, research, such as that by Walser and Anderlik (2004), points toward rural depopulation as a major issue for banking in rural communities. This research often finds, particularly in the Midwest, that small banks are left to try to provide services to these vanishing communities. Table 10 presents data on the percentage change in population from 2000 to 2008. Although a single snapshot in time, this table does provide a picture of demographic change during the study period. The data are from Census Bureau population estates. Local Economy Economic viability is directly linked to a region’s quality of life, with one of the key attributes being homeownership opportunities. As such, measures of a service area’s economic condition are important to better understand what, if anything is being missed with the HMDA asset threshold. Table 9 examines median household income measure and its association with small lenders. In this case, we calculated a measure, based on 2000 Census Bureau income data that is a ratio of county median household income to the state average. The idea is to see whether any patterns exist, in particular within areas that have a poor ratio and small asset lenders below the HMDA threshold. Table 9 shows no real pattern. There is the initial difference in percentages for rural and urban counties, but that is to be expected, and the first row in the table shows this to be a normal state. There is a bit of movement, with the income rate increasing along with the income ratio for lenders in general; however, that movement is small. Table 9. Service Area County Median Household Income as a Percentage of State Average
County Type Mean (median)
All Lenders Rural Urban
All counties (Lenders Above and Below Asset Threshold)
78.0% (76.2%)
102.3% (96.5%)
At least one lender operating in county during study below HMDA Threshold
79.1% (77.7%)
103.9% (98.6)
At least one lender below HMDA threshold serving each year
83.3% (81.5%)
101.3% (98.3%)
Two or more lenders below HMDA threshold serving the county per year
82.0% (81.9%)
102.4% (102.4%)
Source: 2000 Census Summary File Data.

What Are We Missing? 41
Table 10. Percentage Population Change, 2000–2008
County Type Mean (median)
All Lenders Rural Urban
All counties (Lenders Above and Below
Asset Threshold)
0.5% (–0.31%)
10.92% (7.77%)
At least one lender operating in county
during study below HMDA Threshold
0.3% (–0.87%)
11.9% (8.45%)
At least one lender below HMDA
threshold serving each year
–3.13% (–3.14%)
7.63% (4.72%)
Two or more lenders below HMDA
threshold serving the county per year
–3.26% (–3.43%)
8.12% (6.04%)
Source: Census Population estimates webpage: . http://www.census.gov/popest/estimates.html
The first and most obvious finding is that small lenders falling below the HMDA asset threshold in rural jurisdictions served many areas with declining populations, whereas the opposite was true for similar urban lenders. This pattern held not just for all small rural lenders but also for those concentrating in mortgage and consumer lending. However, the pattern was not as strong for this latter case, which likely reflects the fact that these lenders are not located in the Midwest, where depopulation is a major issue. Summary For the most part, this limited review of service area populations did not uncover significant problem areas. Exploration of the three demographic variables did not show any relationships among counties with various degrees of lenders which would qualify for an HMDA asset exemption and minority, elderly, or low-income residents. The different rural bank groups, regardless of limited assets, had similar average and median service area populations. On the economic side was one finding of note: The averages suggest a relationship between population decline and small lenders with assets below the HMDA threshold. This relationship may be a serious issue if community residents are being left behind and are unable to access multiple avenues of credit. Ultimately, if these small lenders close, these residents may be without access entirely.

42 Housing Assistance Council
CONCLUSION: POLICY IMPLICATIONS Findings Review This study provides a descriptive analysis of FDIC-insured lenders in an attempt to assess how many lending institutions are being excluded from filing mortgage data by the HMDA asset threshold and to briefly describe these lenders in terms of activity and the populations they serve. We mainly focused on the relationship between these lenders and rural communities. Our goal was to begin the process of better understanding how these HMDA filing exemptions affect rural research and our knowledge of these markets. Our research revealed several things of note. First, the number of FDIC-insured lenders that fall under the HMDA asset thresholds is not insignificant. The numbers at the beginning of the study were around 25 percent of rural banks and thrifts and more than 1,000 institutions. Over the 12 years of the study, that number declined considerably but still made up more than 10 percent of all rural banks and approximately 900 lenders. In addition to number of small lenders, we discovered that approximately 70 percent of such small institutions were concentrated in rural communities. The Midwest, Kansas, and Illinois were a few areas of high concentration. In some cases, more than 90 percent of all counties, at one time or another during the study, had a small bank with assets so small that they fell below the HMDA threshold. Many of these banks and thrifts were not primarily mortgage or consumer lending. A large portion (60 percent) of these lenders specialized in agricultural lending. Only about 10 percent made mostly mortgage and consumer loans. This finding likely means that despite the large numbers, these banks might not make as many mortgage loans as one initially thinks. Finally, a brief look at service area populations found, in general, that these extremely small lenders appear to not be serving populations different from what one finds in other rural counties. The one caveat is that there was an association between average population change and amount of small lender activity. Those areas losing population were being served by these small institutions. This result is similar to what Walser and Anderlik (2004) discovered. The key factor is that some depopulating areas in the Midwest are driving such trends. Implications These data should serve as a first step. It appears that there are enough lenders falling through the cracks to warrant future research. Even though many of the lenders are not primarily mortgage lending institutions, the fact that they are concentrated in a particular region with an at-risk population (i.e., rural counties) indicates that we need to learn more about them. This general concentration, when combined with the link to depopulating areas, means that the need for more information will only get stronger. Ultimately there will likely need to be a policy response to this phenomenon; the more one knows, the better the proscription will be.

What Are We Missing? 43
REFERENCES Avery, Robert B., Kenneth P. Brevoort, and Glenn B. Canner. 2007. Opportunities and issues in
using HMDA data. The Journal of Real Estate Research 29(4): 352–379. Dolan, Julie. 2000. Rural banks and the federal home loan bank system. Rural America 15(3):
44–49. Economic Research Services (ERS). 1997. Credit in Rural America. Agricultural Economics
Research Paper ER749. Washington, D.C.: United States Department of Agriculture. Feinberg, Robert M. 2009. Patterns of Determinants of Entry in Rural County Markets. Journal
of Industry, Competition and Trade, 9(2):101-115. Gilbert, R. Alton. 1997. Implications of bank consolidation for the financing of rural America. In
Financing Rural America. Kansas City, MO: Kansas City Federal Reserve. Independent Community Bankers of America. 2007. Testimony of Frank A. Pinto on behalf of
the Independent Community Bankers of America before the Congress of the United States House of Representatives, Subcommittee on Conservation, Credit, Energy, and Research of the Committee on Agriculture Hearing on “The Availability of Credit in Rural America” March 27.
Jones, Kenneth D., and Chau Nguyen. 2004. Increased concentration in banking: Megabanks and
their implications for deposit insurance. Financial Markets, Institutions, and Instruments 14(1): 1–42.
Keeton, William R. 1998. Are rural banks facing increased funding pressures? Evidence from
Tenth District states. Economic Review (2nd quarter): 43–67. Kilkenny, Maureen, and Robert W. Jolly. 2005. Are rural credit markets competitive? Is there
room for competition in rural credit markets? Choices 20(1): 25–29. McCoy, A. Patricia. 2007. The Home Mortgage Disclosure Act: A synopsis and recent
legislative history. Journal of Real Estate Research 24(4): 381–397. Nissan, Edward. 2001. Book review: Gary A. Dymski, The Bank Merge Wave: The Economic
Causes and Consequences of Financial Consolidation. Review of Industrial Organization 19: 503–505.
Shields, Martin, Jeffrey R. Stokes, and Jeong Hwan Bae. 2004. An Analysis of Banking
Consolidation Trends in Rural Pennsylvania. Paper prepared for presentation at the American Agriculture Economics Association Annual Meeting, Denver, Colorado, August 1–4.

44 Housing Assistance Council
Singleton, Theresa, Lance George, Carla Dickstein, and Hannah Thomas. 2006. Carsey Institute Policy Brief 4 (Fall).
Van Walleghem, Joe, and Paul Willis. 1998. An overview and analysis of community bank
mergers. Financial Industry Perspectives: 1–14. Walraven, Nicholas A. 1999. Lending by rural banks involved in mergers. Journal of
Agricultural and Applied Economics 31(2): 201–214. Walser, Jeffrey, and John Anderlik. 2004. The future of banking in America: Rural depopulation:
What does it really mean for future economic health of rural areas and the community banks that support them? FDIC Banking Review 16(3): 57–95.
Zezima, Katie. 2008. Vermont Bank Thrives Whiles Others Cut Back. New York Times, Business
Sec.: B4.

What Are We Missing? 45
APPENDIX

46 Housing Assistance Council
Table A1. FDIC-insured Lenders and HMDA Filers 1997 to 2009 Institutions
Total Year
1997 1998 1999 2000 2001 2002 2003 2004 2005 2006 2007 2008 2009 FDIC-insured Lenders with Asset below HMDA threshold1 2,065 1,977 1,758 1,714 1,640 1,462 1,279 1,249 1,189 1,180 1,127 1,072 989 18,701 FDIC-insured lenders with assets Above the HMDA threshold1 9,390 8,946 8,705 8,505 8,260 8,148 8,072 7,927 7,782 7,648 7,546 7,454 7,308 105,691
All FDIC-insured Lenders2 11,455 10,923 10,463 10,219 9,900 9,610 9,351 9,176 8,971 8,828 8,673 8,526 8,297 124,392
HMDA Filers3 7,925 7,836 7,829 7,713 7,631 7,771 8,121 8,853 8,848 8,886 8,610 8,388 -- 1 This refers to an institutions total assets being either below or above the HMDA asset threshold. This is independent of whether or not they filed HMDA data. (FDIC data) 2 This represents all FDIC-insured lenders, which is a sum of those below and those above the HMDA asset threshold. (FDIC data) 3 This data comes directly from FFIEC reports of raw tabulation of annual filers. See source below (HMDA data) for url where information was gathered. Source: FDIC data: HAC tabulation of institutions based data download from the FDIC website on insured lenders (Based on institution filings: Call Reports and Summary of Deposits) which is organized and made available by the FDIC. The following FDIC website was accessed throughout 2009 and early 2010 to compile the data for this work: http://www.fdic.gov/quicklinks/analysts.html. HMDA data: Federal Financial Institutions Examination Council (FFIEC) compiled data on lenders filing HMDA data and make available at their website. The following FFIEC website was accessed in early 2010 by the author: http://www.ffiec.gov/hmda/history.htm
Table A2. Percentage Change FDIC-insured Lenders and HMDA Filers 1997 to 2009
Institutions Years 1997-2009* Annual Change Year-to-Year
1997 1998 1999 2000 2001 2002 2003 2004 2005 2006 2007 2008 2009 FDIC-insured Lenders with Asset below HMDA threshold1 -- 4.26 11.08 2.50 4.32 10.85 12.52 2.35 4.80 0.76 4.49 4.88 7.74 -52.11 FDIC-insured lenders with assets Above the HMDA threshold1 -- 4.73 2.69 2.30 2.88 1.36 0.93 1.80 1.83 1.72 1.33 1.22 1.96 -22.16
All FDIC-insured Lenders2 -- 4.64 4.21 2.33 3.12 2.93 2.70 1.87 2.23 1.59 1.76 1.69 2.69 -27.57
HMDA Filers3* -- 1.12 0.09 1.48 1.06 -1.83 -4.50 -9.01 0.06 -0.43 3.11 2.58 -- 5.84 1 This refers to an institutions total assets being either below or above the HMDA asset threshold. This is independent of whether or not they made mortgage loans. (FDIC data) 2 This represents all FDIC-insured lenders, which is a sum of those below and those above the HMDA asset threshold. (FDIC data) 3 Data directly from FFIEC reports raw tabulation of annual filers. See source below (HMDA data) for url where information was gathered. *HMDA data does not include 2009 because that is not yet available for download. Also HMDA filers include not only banks, but also credit unions and mortgage companies. Source: FDIC data: HAC tabulation of institutions based data download from the FDIC website on insured lenders (Based on institution filings: Call Reports and Summary of Deposits) which is organized and made available by the FDIC. The following FDIC website was accessed throughout 2009 and early 2010 to compile the data for this work: http://www.fdic.gov/quicklinks/analysts.html. HMDA data: Federal Financial Institutions Examination Council (FFIEC) compiled data on lenders filing HMDA data and make available at their website. The following FFIEC website was accessed in early 2010 by the author: http://www.ffiec.gov/hmda/history.htm

What Are We Missing? 47
Table A3. HMDA Filers by Lender Type 2004-2008 Year Type of Lender Total FDIC Covered Lenders
Commercial Banks
Savings Institution
s
Credit Unions
Mortgage Companies
FDIC-insured Type of
Lenders*
All FDIC Lenders
2004 3946 1017 2030 1860 8853 4963 9176
2005 3904 974 2047 1923 8848 4878 8971
2006 3900 946 2036 2004 8886 4846 8828
2007 3910 929 2019 1752 8610 4839 8673
2008 3942 913 2026 1507 8388 4855 8526 % Change 2004-2008 -0.10 -10.23 -0.20 -18.98 -5.25 -2.18 -7.08
*Types of FDIC Lenders is simply the combination of Commercial and Savings Banks from the “Type of Lender” categories. I consider them to be types of FDIC-insured lenders because these are the types of lenders covered by them. Source: HMDA filer data comes from the annual reports published in the Federal Reserve Bulletin every year since 2004 which describe HMDA data. The citations are as follows: The 2004 Data-Avery, Robert E. and Glenn B. Canner.2005. New Information Reported Under HMDA and Its Application in Fair Lending Enforcement. Federal Reserve Bulletin: Summer 2005 Edition: 344-394. The 2005 Data- Avery, Robert E., Kenneth P. Brevoort and Glenn B. Canner. 2006. Higher-Priced Home Lending and the 2005 HMDA Data. Federal Reserve Bulletin: 2006 Winter Edition: A123-A66. The 2006 Data- Avery, Robert E., Kenneth P. Brevoort and Glenn B. Canner. 2006. The 2006 HMDA Data. Federal Reserve Bulletin: 2006 Winter Edition: A73-A109. The 2007 Data - Avery, Robert E., Kenneth P. Brevoort and Glenn B. Canner. 2008. The 2007 HMDA Data. Federal Reserve Bulletin: 2008 Winter Edition: A107-A146. The 2008 Data - Avery, Robert E., Neil Bhutta, Kenneth P. Brevoort, Glenn B. Canner and Christa N. Gibbs. 2010. The 2008 HMDA Data: The Mortgage Market During a Turbulent Year. Federal Reserve Bulletin: Forthcoming Issue.
Table A4. Three-Year Average Percentage Change in FDIC Lenders 1997-2009
Three Averages 3- Year Period 1997-1999
1998-2000
1999-2001
2000-2002
2001-2003
2002-2004
2003-2005
2004-2006
2005-2007
2006-2008
2007-2009
FDIC-insured Lenders with Asset below HMDA threshold1 1933 1816 1704 1605 1460 1330 1239 1206 1165 1126 1063 All FDIC-insured Lenders 10947 10535 10194 9910 9620 9379 9166 8992 8824 8676 8499 Three Average-Percentage Change
1997-1999
1998-2000
1999-2001
2000-2002
2001-2003
2002-2004
2003-2005
2004-2006
2005-2007
2006-2008
2007-2009
FDIC-insured Lenders with Asset below HMDA threshold1 ---- -6.05 -6.18 -5.79 -9.03 -8.92 -6.84 -2.66 -3.37 -3.35 -5.65 All FDIC-insured Lenders ---- -3.76 -3.24 -2.79 -2.92 -2.51 -2.27 -1.90 -1.86 -1.68 -2.04
1 This refers to an institutions asset total being either below or above HMDA asset threshold. This is independent of whether or not they made mortgage loans.

48 Housing Assistance Council
Table A5. All FDIC‐Insured Lenders 1997‐2009 Broken Down by Institution Type1
1997 1998 1999 2000 2001 2002 2003 2004 2005 2006 2007 2008 2009
Commerical 9508 (83.00%) [83.19%]
9124 (83.53%) [83.71%]
8756 (83.69%) [83.85%]
8562 (83.79%) [83.93%]
8297 (83.81%) [83.94%]
8062 (83.69%) [84.03%]
7871 (84.17%) [84.31%]
7753 (84.49%) [84.61%]
7615 (84.88%) [85.00%]
7510 (85.07%) [85.19%]
7384 (85.14%) [85.25%]
7266 (85.23%) [85.25%]
7070 (85.21%) [85.30%]
104,778 (84.23%) [84.37%]
Savings Institution
1921 (16.77%) [16.81%]
1776 (16.26%) [16.29%]
1687 (16.12%) [16.15%]
1639 (16.04%) [16.07%]
1587 (16.03%) [16.06%]
1532 (15.94%) [15.97%]
1465 (15.67%) [15.69%]
1410 (15.37%) [15.39%]
1344 (14.98%) [15.00%]
1306 (14.79%) [14.81%]
1278 (14.74%) [14.75%]
1250 (14.66%) [14.68%]
1218 (14.68%) [14.70%]
19413 (15.61%) [15.63%]
Foreign Bank, US Branch
26 (0.23%)
23 (0.21%)
20 (0.19%)
18 (0.18%)
16 (0.16%)
16 (0.17%)
15 (0.16%)
13 (0.14%)
12 (0.13%)
12 (0.14%)
11 (0.13%)
9 (0.11%)
9 (0.11%)
202 (0.16%)
Total-1 11,455 10,923 10,463 10,219 9,900 9,610 9,351 9,176 8,971 8,828 8,673 8,525 8,297 124,393
Total-2 Exclude Foreign Banks
US Branch
11,429 10,900 10,443 10,201 9,884 9,594 9,336 9,163 8,959 8,816 8,662 8,516 8,288 124,191
Institution Type2 Year Total
1Percentage in parenthesis is calculated using “Total‐1” which includes foreign banks. The percentages in brackets are calculated using “Total‐2”which excludes the foreign banks. All percentage calculated down columns and for each year. 2 Refers to the FDIC classification of the institution by type (chartered as either bank or thrift). This is different from the FDIC classification based on assets and activities.
Source: FDIC data from Summary of Deposit reports compiled by HAC. The data was downloaded from the following FDIC website: http://www.fdic.gov/quicklinks.analysts.html The Website was accessed throughout 2009 and early 2010 to download and compile data.
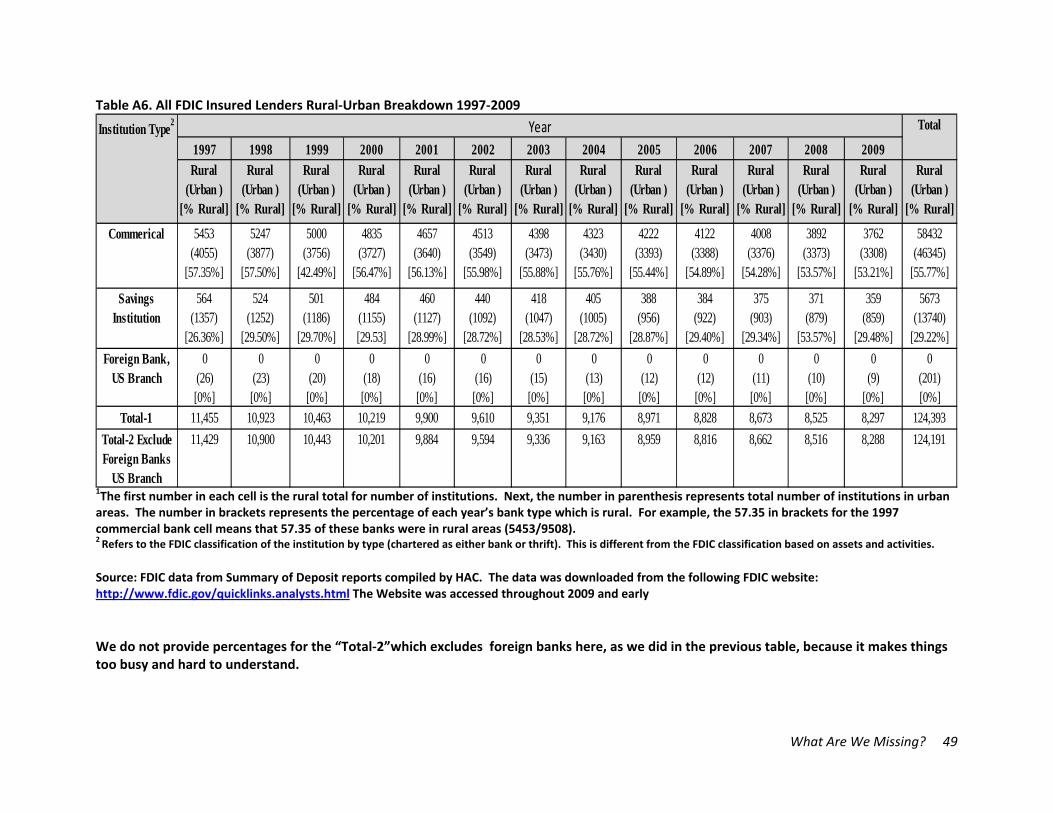
What Are We Missing? 49
Table A6. All FDIC Insured Lenders Rural‐Urban Breakdown 1997‐2009
1997 1998 1999 2000 2001 2002 2003 2004 2005 2006 2007 2008 2009Rural
(Urban ) [% Rural]
Rural (Urban )
[% Rural]
Rural (Urban )
[% Rural]
Rural (Urban )
[% Rural]
Rural (Urban )
[% Rural]
Rural (Urban )
[% Rural]
Rural (Urban )
[% Rural]
Rural (Urban )
[% Rural]
Rural (Urban )
[% Rural]
Rural (Urban )
[% Rural]
Rural (Urban )
[% Rural]
Rural (Urban )
[% Rural]
Rural (Urban )
[% Rural]
Rural (Urban )
[% Rural]
Commerical 5453 (4055)
[57.35%]
5247 (3877)
[57.50%]
5000 (3756)
[42.49%]
4835 (3727)
[56.47%]
4657 (3640)
[56.13%]
4513 (3549)
[55.98%]
4398 (3473)
[55.88%]
4323 (3430)
[55.76%]
4222 (3393)
[55.44%]
4122 (3388)
[54.89%]
4008 (3376)
[54.28%]
3892 (3373)
[53.57%]
3762 (3308)
[53.21%]
58432 (46345)
[55.77%]
Savings Institution
564 (1357)
[26.36%]
524 (1252)
[29.50%]
501 (1186)
[29.70%]
484 (1155) [29.53]
460 (1127)
[28.99%]
440 (1092)
[28.72%]
418 (1047)
[28.53%]
405 (1005)
[28.72%]
388 (956)
[28.87%]
384 (922)
[29.40%]
375 (903)
[29.34%]
371 (879)
[53.57%]
359 (859)
[29.48%]
5673 (13740)
[29.22%]
Foreign Bank, US Branch
0 (26) [0%]
0 (23) [0%]
0 (20) [0%]
0 (18) [0%]
0 (16) [0%]
0 (16) [0%]
0 (15) [0%]
0 (13) [0%]
0 (12) [0%]
0 (12) [0%]
0 (11) [0%]
0 (10) [0%]
0 (9)
[0%]
0 (201) [0%]
Total-1 11,455 10,923 10,463 10,219 9,900 9,610 9,351 9,176 8,971 8,828 8,673 8,525 8,297 124,393
Total-2 Exclude Foreign Banks
US Branch
11,429 10,900 10,443 10,201 9,884 9,594 9,336 9,163 8,959 8,816 8,662 8,516 8,288 124,191
Institution Type2 Year Total
1The first number in each cell is the rural total for number of institutions. Next, the number in parenthesis represents total number of institutions in urban areas. The number in brackets represents the percentage of each year’s bank type which is rural. For example, the 57.35 in brackets for the 1997 commercial bank cell means that 57.35 of these banks were in rural areas (5453/9508). 2 Refers to the FDIC classification of the institution by type (chartered as either bank or thrift). This is different from the FDIC classification based on assets and activities.
Source: FDIC data from Summary of Deposit reports compiled by HAC. The data was downloaded from the following FDIC website: http://www.fdic.gov/quicklinks.analysts.html The Website was accessed throughout 2009 and early We do not provide percentages for the “Total‐2”which excludes foreign banks here, as we did in the previous table, because it makes things too busy and hard to understand.

50 Housing Assistance Council
Table A7. All FDIC‐Insured Lenders 1997‐2009 with assets below the HMDA threshold Broken down by Institution Type
1997 1998 1999 2000 2001 2002 2003 2004 2005 2006 2007 2008 2009
Commerical1884
(91.23%) [91.23%]
1807 (91.40%) [91.40%]
1584 (90.10%) [90.10%]
1531 (89.32%) [89.32%]
1459 (88.96%) [88.96%]
1296 (88.65%) [88.65%]
1141 (89.21%) [89.21%]
1112 (89.03%) [89.03%]
1059 (89.07%) [89.07%]
1048 (88.81%) [88.89%]
993 (88.11%) [88.11%]
938 (87.50%) [87.58%]
869 (87.87%) [87.87%]
16721 (89.41%)
Savings Institution
181 (8.77%) [8.77%]
170 (8.60%) [8.60%]
174 (9.90%) [9.90%]
183 (10.68%) [10.68%]
181 (11.04%) [11.04%]
166 (11.35%) [11.35%]
138 (10.79%) [10.79%]
137 (10.97%) [10.97%]
130 (10.93%) [10.93%]
131 (11.10%) [11.11%]
134 (11.89%) [11.89%]
133 (12.41%) [12.42%]
120 (12.13%) [12.13%]
1978 (10.58%)
Foreign Bank, US Branch
0 (0.00%)
0 (0.00%)
0 (0.00%)
0 (0.00%)
0 (0.00%)
0 (0.00%)
0 (0.00%)
0 (0.00%)
0 (0.00%)
1 (0.00%)
0 (0.00%)
1 (0.00%)
0 (0.00%)
2 (0.01%)
Total-1 2065 1977 1758 1714 1640 1462 1279 1249 1189 1180 1127 1072 989 18,701
Total-2 Exclude Foreign Bank
Branches2065 1977 1758 1714 1640 1462 1279 1249 1189 1179 1127 1071 989 18669
Institution TypeYear
Total
1Percentage in parenthesis is calculated using “Total‐1” which includes foreign banks. The percentages in brackets are calculated using “Total‐2”which excludes the foreign banks. All percentage calculated down columns and for each year. 2 Refers to the FDIC classification of the institution by type (chartered as either bank or thrift). This is different from the FDIC classification based on assets and activities.
Source: FDIC data from Summary of Deposit reports compiled by HAC. The data was downloaded from the following FDIC website: http://www.fdic.gov/quicklinks.analysts.html The Website was accessed throughout 2009 and early 2010 to download and compile data.
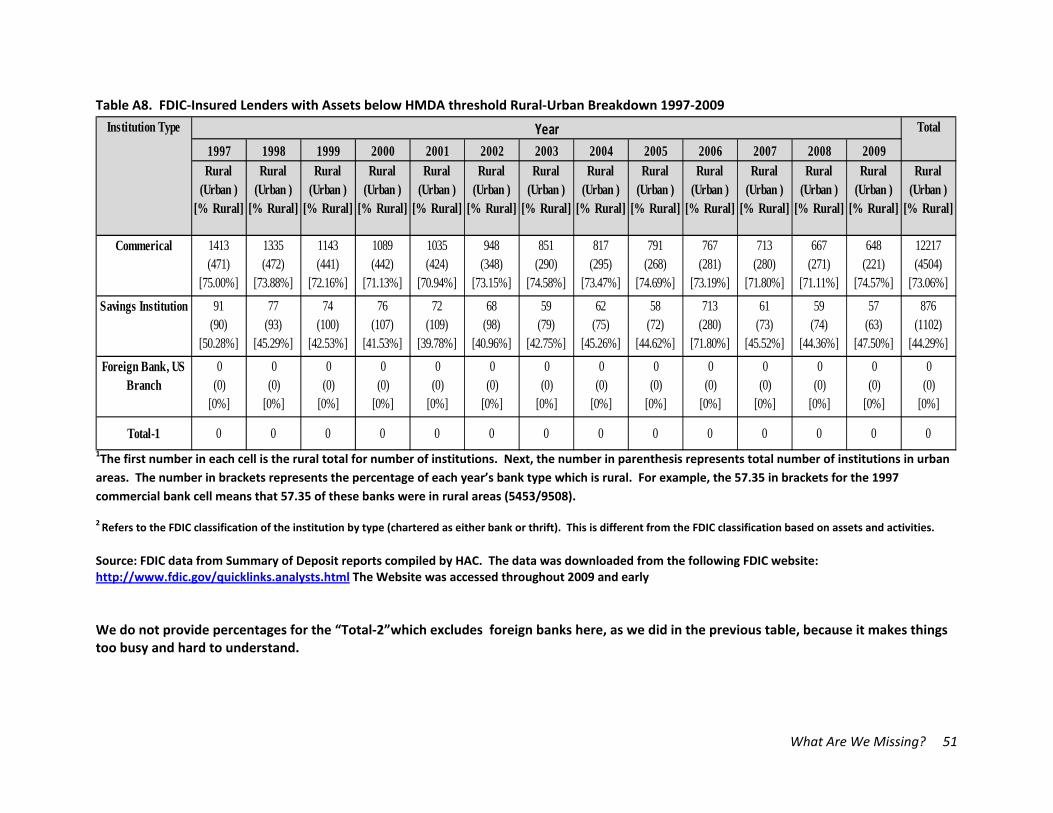
What Are We Missing? 51
Table A8. FDIC‐Insured Lenders with Assets below HMDA threshold Rural‐Urban Breakdown 1997‐2009
1997 1998 1999 2000 2001 2002 2003 2004 2005 2006 2007 2008 2009Rural
(Urban ) [% Rural]
Rural (Urban )
[% Rural]
Rural (Urban )
[% Rural]
Rural (Urban )
[% Rural]
Rural (Urban )
[% Rural]
Rural (Urban )
[% Rural]
Rural (Urban )
[% Rural]
Rural (Urban )
[% Rural]
Rural (Urban )
[% Rural]
Rural (Urban )
[% Rural]
Rural (Urban )
[% Rural]
Rural (Urban )
[% Rural]
Rural (Urban )
[% Rural]
Rural (Urban )
[% Rural]
Commerical 1413 (471)
[75.00%]
1335 (472)
[73.88%]
1143 (441)
[72.16%]
1089 (442)
[71.13%]
1035 (424)
[70.94%]
948 (348)
[73.15%]
851 (290)
[74.58%]
817 (295)
[73.47%]
791 (268)
[74.69%]
767 (281)
[73.19%]
713 (280)
[71.80%]
667 (271)
[71.11%]
648 (221)
[74.57%]
12217 (4504)
[73.06%]
Savings Institution 91 (90)
[50.28%]
77 (93)
[45.29%]
74 (100)
[42.53%]
76 (107)
[41.53%]
72 (109)
[39.78%]
68 (98)
[40.96%]
59 (79)
[42.75%]
62 (75)
[45.26%]
58 (72)
[44.62%]
713 (280)
[71.80%]
61 (73)
[45.52%]
59 (74)
[44.36%]
57 (63)
[47.50%]
876 (1102)
[44.29%]
Foreign Bank, US Branch
0 (0)
[0%]
0 (0)
[0%]
0 (0)
[0%]
0 (0)
[0%]
0 (0)
[0%]
0 (0)
[0%]
0 (0)
[0%]
0 (0)
[0%]
0 (0)
[0%]
0 (0)
[0%]
0 (0)
[0%]
0 (0)
[0%]
0 (0)
[0%]
0 (0)
[0%]
Total-1 0 0 0 0 0 0 0 0 0 0 0 0 0 0
Institution Type Year Total
1The first number in each cell is the rural total for number of institutions. Next, the number in parenthesis represents total number of institutions in urban
areas. The number in brackets represents the percentage of each year’s bank type which is rural. For example, the 57.35 in brackets for the 1997
commercial bank cell means that 57.35 of these banks were in rural areas (5453/9508).
2 Refers to the FDIC classification of the institution by type (chartered as either bank or thrift). This is different from the FDIC classification based on assets and activities.
Source: FDIC data from Summary of Deposit reports compiled by HAC. The data was downloaded from the following FDIC website: http://www.fdic.gov/quicklinks.analysts.html The Website was accessed throughout 2009 and early We do not provide percentages for the “Total‐2”which excludes foreign banks here, as we did in the previous table, because it makes things too busy and hard to understand.

52 Housing Assistance Council
Table A9. Annual Number of State FDIC Insured Lenders Falling Below HMDA Asset Threshold 1997-2009 State Year Total Average
1997 1998 1999 2000 2001 2002 2003 2004 2005 2006 2007 2008 2009
Alaska 0 0 0 0 0 0 0 0 0 0 0 0 0 0 0
Alabama 23 23 17 17 17 16 13 16 13 12 10 10 7 194 15
Arkansas 31 30 25 23 25 20 18 16 10 12 12 10 10 242 19
Arizona 4 9 11 10 11 10 7 5 4 4 9 11 7 102 8
California 24 22 26 23 17 20 12 17 12 18 17 16 12 236 18
Colorado 58 49 43 34 30 29 25 24 21 16 15 13 12 369 28
Connecticut 2 1 5 6 5 8 5 3 2 2 4 2 3 48 4
District of Columbia 1 0 1 1 0 0 0 0 0 0 1 0 0 4 0
Delaware 2 2 2 5 4 3 1 2 2 4 5 3 2 37 3
Florida 25 25 26 50 39 23 10 17 13 14 15 22 11 290 22
Georgia 39 37 37 37 36 30 27 26 26 30 29 20 21 395 30
Hawaii 3 4 4 3 2 2 1 0 0 0 0 0 0 19 1
Iowa 142 133 119 106 96 86 81 76 69 68 70 64 59 1169 90
Idaho 2 5 3 0 1 2 2 1 1 2 3 2 1 25 2
Illinois 212 195 169 173 157 145 125 122 114 111 106 106 98 1833 141
Indiana 18 16 13 14 17 15 11 9 9 8 7 7 7 151 12
Kansas 177 167 151 149 139 134 127 125 121 123 114 109 112 1748 134

What Are We Missing? 53
Kentucky 35 33 25 23 26 20 17 17 18 16 18 16 17 281 22
Louisiana 17 16 16 19 16 12 8 10 11 12 13 11 11 172 13
Massachusetts 12 14 10 9 9 8 4 4 4 4 6 3 3 90 7
Maryland 14 14 15 15 19 16 11 12 12 11 9 7 6 161 12
Maine 4 1 1 1 2 2 2 3 1 1 1 1 1 21 2
Michigan 11 14 11 10 13 13 10 9 9 9 9 10 8 136 10
Minnesota 189 186 161 154 152 145 127 126 124 125 112 112 109 1822 140
Missouri 115 104 87 77 78 64 62 62 61 66 59 55 53 943 73
Mississippi 17 18 16 16 16 11 10 7 7 5 6 6 4 139 11
Montana 36 38 28 24 21 20 19 18 17 17 16 15 17 286 22
North Carolina 16 18 20 10 15 12 9 9 13 8 8 8 10 156 12
North Dakota 49 45 43 41 37 34 30 28 28 25 22 20 20 422 32
Nebraska 153 152 137 128 118 116 108 104 100 98 93 88 86 1481 114
New Hampshire 1 2 1 5 3 2 1 1 0 0 1 1 0 18 1
New Jersey 2 7 10 11 12 6 6 5 3 5 3 5 4 79 6
New Mexico 4 6 6 6 7 5 5 4 4 4 3 2 2 58 4
Nevada 3 1 2 2 6 3 3 1 2 2 3 6 4 38 3
New York 11 11 11 14 14 12 15 12 13 17 17 18 14 179 14
Ohio 51 50 49 52 47 38 32 31 31 34 35 31 25 506 39
Oklahoma 110 102 91 88 80 76 69 69 69 66 57 52 44 973 75

54 Housing Assistance Council
Oregon 8 5 7 9 8 2 2 3 5 4 3 2 2 60 5
Pennsylvania 28 30 26 29 33 32 25 22 24 23 22 23 18 335 26
Rhode Island 0 1 0 0 1 3 3 2 1 1 1 1 1 15 1
South Carolina 16 16 14 17 15 13 11 9 7 9 9 4 3 143 11
South Dakota 50 45 39 38 38 33 31 30 27 25 23 23 23 425 33
Tennessee 26 27 19 20 23 22 14 16 14 16 11 8 8 224 17
Texas 181 168 148 138 131 116 107 104 102 92 85 96 85 1553 119
Utah 11 10 10 8 11 11 9 14 14 8 8 7 6 127 10
Virginia 12 8 8 12 9 7 5 4 5 7 7 5 7 96 7
Vermont 1 2 1 1 1 1 1 1 1 1 1 1 1 14 1
Washington 16 17 18 18 17 9 12 9 6 5 10 8 6 151 12
Wisconsin 72 71 55 51 48 39 35 32 27 28 26 24 22 530 41
West Virginia 16 12 8 6 6 6 3 3 3 4 4 3 3 77 6
Wyoming 15 15 13 11 12 10 8 9 9 8 9 5 4 128 10
Total 2065 1977 1758 1714 1640 1462 1279 1249 1189 1180 1127 1072 989 18701 1439

What Are We Missing? 55
Table A10. Annual Breakdown of FDIC Insured Lenders by Asset Category1997-2009 FDIC Asset Classifications Year Total
1997 1998 1999 2000 2001 2002 2003 2004 2005 2006 2007 2008 2009
International 11 11 11 8 7 5 5 6 5 0 4 5 6 84
Agriculture 2476 2377 2279 2113 1977 1875 1823 1767 1731 1685 1634 1592 1559 24888
Credit Card 81 74 69 64 56 56 40 36 34 33 26 27 26 622
Commercial 3495 3441 3373 3783 3956 3967 4070 4255 4423 4614 4706 4767 4748 53598
Mortgage 1728 1612 1447 1351 1262 1238 1104 1030 986 883 814 782 837 15074
Consumer 349 333 270 304 287 227 195 156 131 124 122 108 90 2696
Other Specialization Under 1 Billion 688 616 655 565 514 480 488 530 467 426 410 55 43 5937
All Other Over $1 Billion 97 92 90 86 85 99 97 87 72 61 57 373 281 1577
All Other Under $1 Billion 2530 2367 2269 1945 1756 1663 1527 1309 1122 998 900 817 707 19910
Total 11455 10923 10463 10219 9900 9610 9349 9176 8971 8824 8673 8526 8297 124386

56 Housing Assistance Council
Table A11. Annual Breakdown of FDIC Insured Lenders by Asset Category1997-2009 FDIC Asset Classifications Year Total
1997 1998 1999 2000 2001 2002 2003 2004 2005 2006 2007 2008 2009
International 0 0 0 0 0 0 0 0 0 0 0 0 0 0
Agriculture 995 925 818 755 693 645 582 571 542 535 501 468 461 8491
Credit Card 5 6 4 5 6 3 1 1 2 3 3 3 2 44
Commercial 239 241 223 255 260 208 190 203 201 204 207 212 193 2836
Mortgage 182 179 148 156 157 136 112 108 112 112 102 96 110 1710
Consumer 53 60 46 55 51 41 32 23 19 21 25 23 19 468
Other Specialization Under 1 Billion 192 200 216 192 188 165 152 160 148 149 151 145 90 2148
All Other Over $1 Billion 0 0 0 0 0 0 0 0 0 0 0 0 0 0
All Other Under $1 Billion 399 366 303 296 285 264 210 183 165 156 138 125 114 3004
Total 2065 1977 1758 1714 1640 1462 1279 1249 1189 1180 1127 1072 989 18701

What Are We Missing? 57
Table A12. Mean and Medians for All Counties
All Lenders
% Minority Population
Rural Urban Total
X M St.
Dev. #
Obs. X M St.
Dev. #
Obs. X M St.
Dev. # Obs.
All Counties 19.0 10.7 19.6 2370 25.6 21.5 17.8 772 21 13.2 19.4 3142 At least one exempt 16.9 9.3 17.7 1080 27.2 23.4 18 534 20.4 13.7 18.5 1614 One the entire time 12.4 6.5 14.7 401 25.4 19.6 17.7 87 15 8.2 16 488 Average 2 or more 11 6.2 12.7 147 29.7 25.8 18.8 52 15.9 8.4 16.7 199 % Population Change
Rural Urban Total
X M St.
Dev. #
Obs. X M St.
Dev. #
Obs. X M St.
Dev. # Obs.
All Counties 0.5 -
0.31 9.7 2370 10.9 7.8 14.1 772 3.0 1.3 11.8 3142 At least one exempt 0.3 -0.9 9.9 1080 11.9 8. 5 14.3 534 4.0 1.9 12.8 1614 One the entire time -3.1 -3.1 7.3 401 7.6 4.7 12.3 87 -1.2 -2.2 9.4 448 Average 2 or more -3.3 -3.4 6.1 147 8.1 6.0 12.6 52 -0.3 -1.8 9.7 199 Population 60 >
Rural Urban Total
X M St.
Dev. #
Obs. X M St.
Dev. #
Obs. X M St.
Dev. # Obs.
All Counties 22.0 21.7 4.71 2370 17.8 17.7 3.93 772 21.0 20.7 4.89 3142 At least one exempt 22.5 22.1 4.62 1080 17.6 17.4 3.95 534 20.8 20.4 4.97 1614 One the entire time 23.4 22.9 4.49 401 17.3 17.2 3.74 87 22.3 22.1 4.94 448 Average 2 or more 23.1 17.2 4.27 147 17.2 17.3 3.41 52 21.5 21.4 4.81 199 % in Pov.
Rural Urban Total
X M St.
Dev. #
Obs. X M St.
Dev. #
Obs. X M St.
Dev. # Obs.
All Counties 16.0 14.9 6.4 2368 12.3 11.9 4.9 772 15.0 14.1 6.2 3140 At least one exempt 15.1 13.8 5.8 1080 12.2 11.9 4.9 534 14.2 13.0 5.7 1614 One the entire time 14.0 12.6 5.2 401 12.3 12.0 4.3 87 13.7 12.5 5.1 488 Average 2 or more 12.9 11.8 4.7 147 12.3 12.0 4.3 52 12.8 11.8 4.6 199

58 Housing Assistance Council
Persist. Poverty
Rural Urban Total
Yes No # Obs. Yes No # Obs. Yes No # Obs.
All Counties 368 2001 2369 18 754 772 386 2755 3141 At least one exempt 135 945 1080 16 518 534 151 1463 1614 One the entire time 28 373 401 1 86 87 29 459 488 Average 2 or more 6 141 147 0 52 52 6 193 193 % income to State Median
Rural Urban Total
X M St.
Dev. #
Obs. X M St.
Dev. # Obs. X M St.
Dev. #
Obs. All Counties 78.0 76.2 16.5 2369 102.3 96.5 25.3 771 84.0 80.5 21.7 3141 At least one exempt 79.1 77.7 14.8 1080 103.9 98.6 24.6 534 87.3 83.4 22.0 1614 One the entire time 83.3 81.5 16.5 488 101.3 98.3 20.4 87 83.3 81.5 16.5 488 Average 2 or more 82.0 81.9 11.7 147 82.0 81.9 11.7 147 87.5 85.6 16.9 199 X=Mean, M=Median, St. Dev. = Standard Deviation, and # Obs.=Number of Observations