what brings ifrs 17 - dani- · pdf filefinance expense at locked in discount rate p&l:...
TRANSCRIPT

What brings IFRS 17
9 November 2017
Page 2
Introduction and agenda
Petr Sotona
Manager, Actuarial Services
Agenda: IFRS 17, Solvency 2, MCEV, Due diligence, Life modelling, Pricing, Reserving
Tel: +420 731 627 083
Email: [email protected]
Agenda
1. Quick overview
2. (R)Evolution in insurance accounting
• Actuarial models
• New reporting requirements
• Systems and architecture
3. Practical example comparing IFRS 4 and IFRS 17
4. Summary
Agenda
1. Quick overview
2. (R)Evolution in insurance accounting
• Actuarial models
• New reporting requirements
• Systems and architecture
3. Practical example comparing IFRS 4 and IFRS 17
4. Summary
Page 4
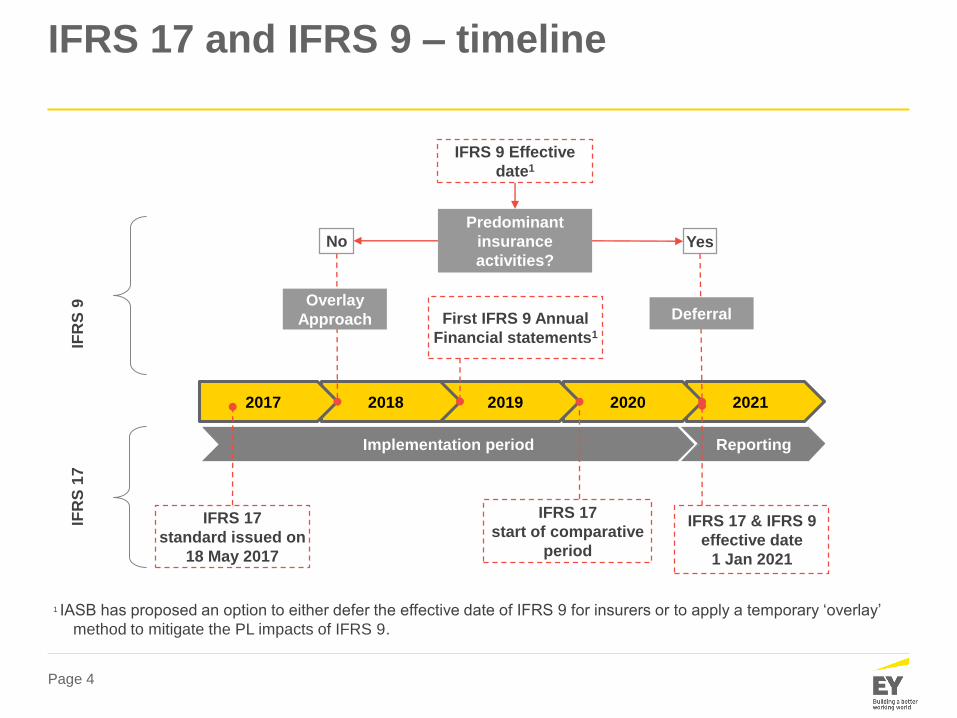
IFRS 17 and IFRS 9 – timeline
20212020201920182017
Implementation period Reporting
IFR
S 1
7IF
RS
9
IFRS 17
start of comparative
period
IFRS 17 & IFRS 9
effective date
1 Jan 2021
IFRS 9 Effective
date1
IFRS 17
standard issued on
18 May 2017
Predominant
insurance
activities?Yes
Overlay
Approach
No
DeferralFirst IFRS 9 Annual
Financial statements1
1 IASB has proposed an option to either defer the effective date of IFRS 9 for insurers or to apply a temporary ‘overlay’
method to mitigate the PL impacts of IFRS 9.
Page 5
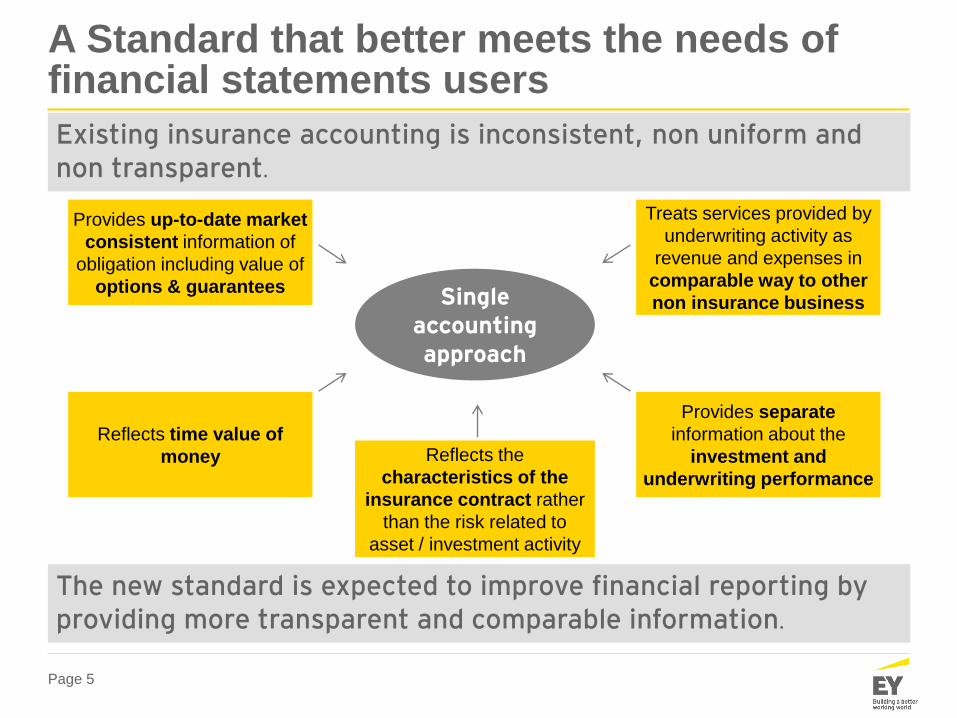
A Standard that better meets the needs of financial statements users
Single accounting approach
Provides up-to-date market
consistent information of
obligation including value of
options & guarantees
Reflects time value of
money
Treats services provided by
underwriting activity as
revenue and expenses in
comparable way to other
non insurance business
Provides separate
information about the
investment and
underwriting performance
Reflects the
characteristics of the
insurance contract rather
than the risk related to
asset / investment activity
Existing insurance accounting is inconsistent, non uniform and non transparent.
The new standard is expected to improve financial reporting by providing more transparent and comparable information.
Page 6
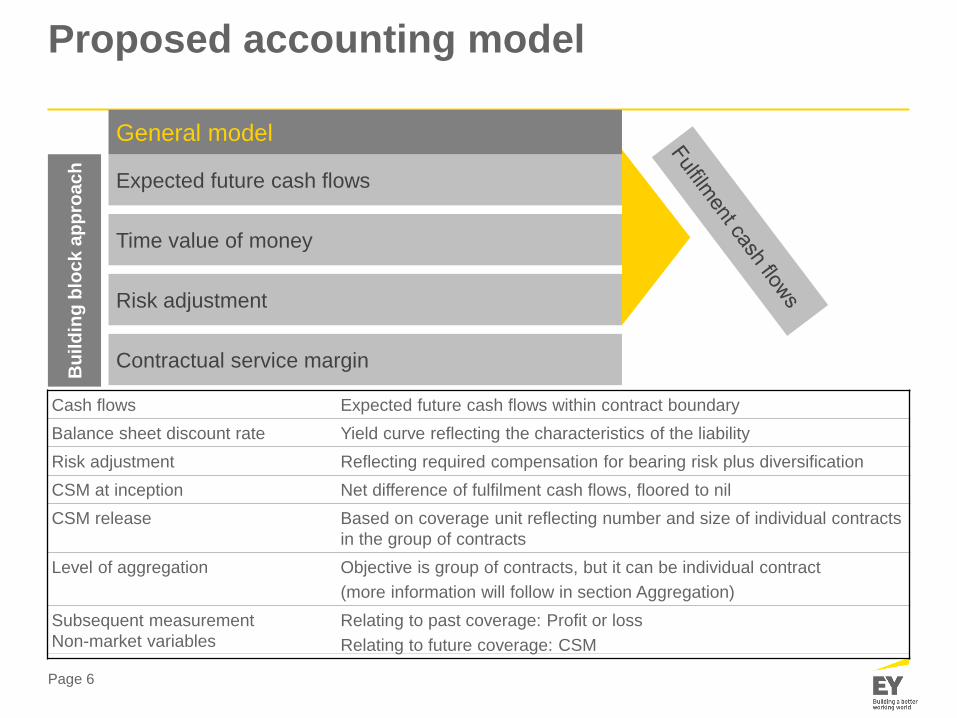
Proposed accounting model
Cash flows Expected future cash flows within contract boundary
Balance sheet discount rate Yield curve reflecting the characteristics of the liability
Risk adjustment Reflecting required compensation for bearing risk plus diversification
CSM at inception Net difference of fulfilment cash flows, floored to nil
CSM release Based on coverage unit reflecting number and size of individual contracts
in the group of contracts
Level of aggregation Objective is group of contracts, but it can be individual contract
(more information will follow in section Aggregation)
Subsequent measurement
Non-market variables
Relating to past coverage: Profit or loss
Relating to future coverage: CSM
Expected future cash flows
Time value of money
Risk adjustment
Contractual service margin
Bu
ild
ing
blo
ck
ap
pro
ac
h
General model
Page 7
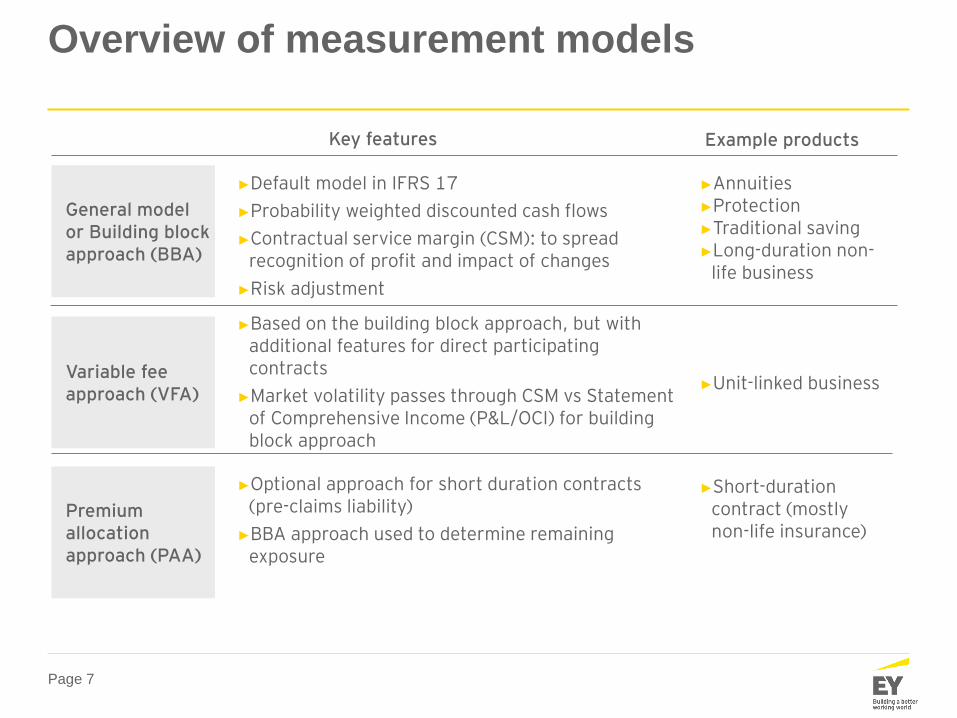
Overview of measurement models
General model or Building block approach (BBA)
Premium allocationapproach (PAA)
Variable feeapproach (VFA)
►Default model in IFRS 17
►Probability weighted discounted cash flows
►Contractual service margin (CSM): to spread recognition of profit and impact of changes
►Risk adjustment
►Optional approach for short duration contracts (pre-claims liability)
►BBA approach used to determine remaining exposure
►Based on the building block approach, but with additional features for direct participating contracts
►Market volatility passes through CSM vs Statement of Comprehensive Income (P&L/OCI) for building block approach
►Annuities►Protection►Traditional saving►Long-duration non-
life business
►Short-duration contract (mostly non-life insurance)
►Unit-linked business
Key features Example products
Page 8
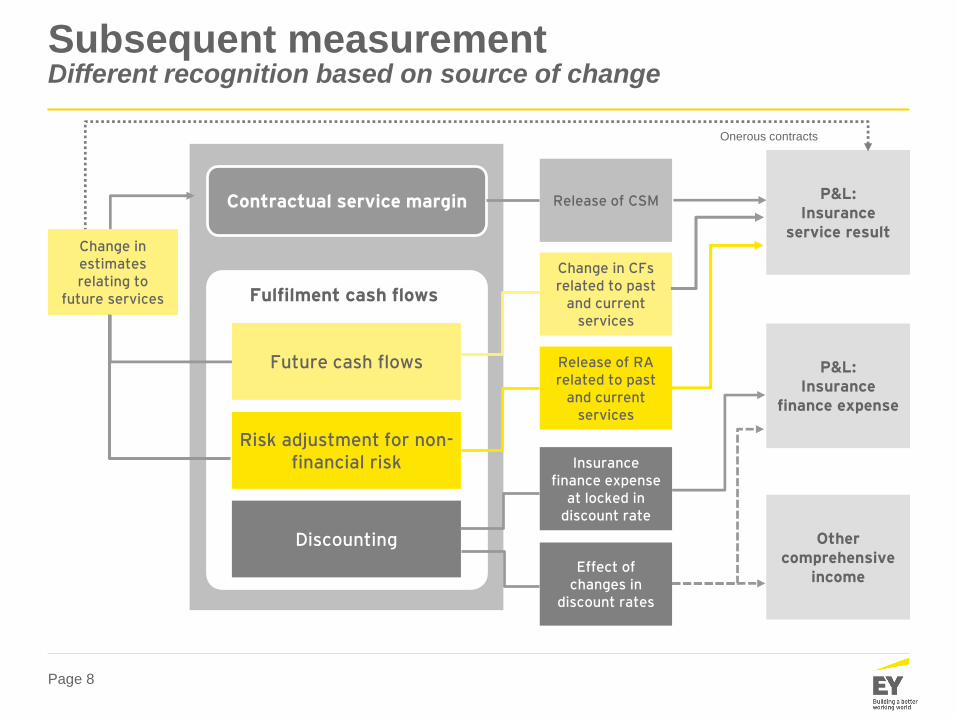
Subsequent measurementDifferent recognition based on source of change
Contractual service margin
Future cash flows
Risk adjustment for non-financial risk
Discounting
Fulfilment cash flows
Change in CFs related to past
and current services
Release of RA related to past
and current services
Effect of changes in
discount rates
Release of CSM
Insurance finance expense
at locked in discount rate
P&L:Insurance
service result
P&L:Insurance
finance expense
Other comprehensive
income
Change in estimates relating to
future services
Onerous contracts
Page 9
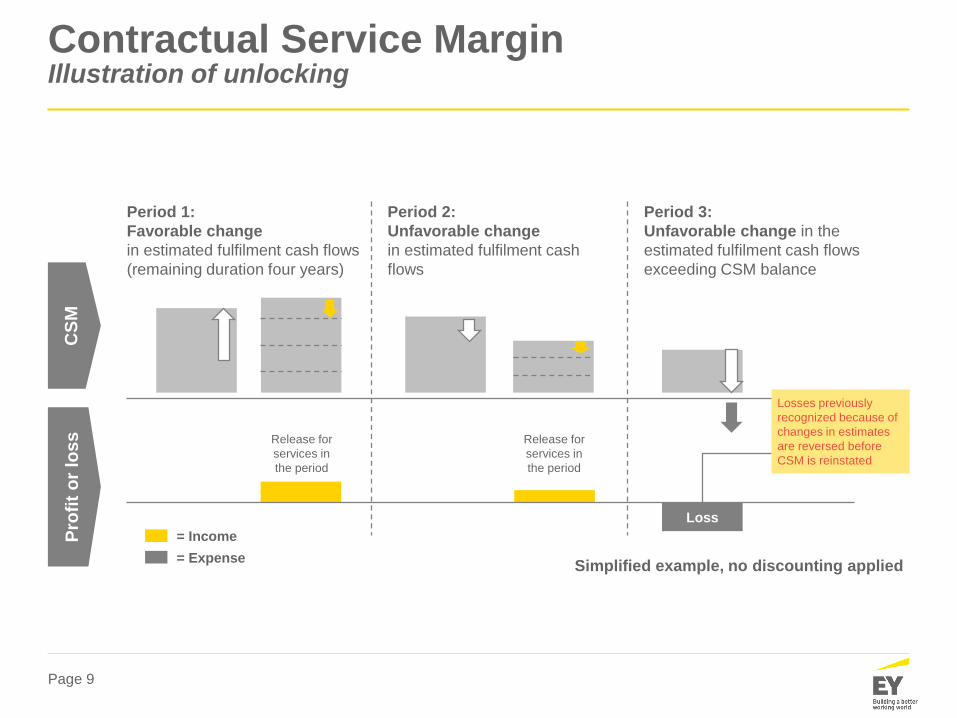
Contractual Service Margin Illustration of unlocking
Period 1:
Favorable change
in estimated fulfilment cash flows
(remaining duration four years)
CS
MP
rofi
t o
r lo
ss
Loss
Period 2:
Unfavorable change
in estimated fulfilment cash
flows
Period 3:
Unfavorable change in the
estimated fulfilment cash flows
exceeding CSM balance
= Income
= Expense
Release for
services in
the period
Simplified example, no discounting applied
Release for
services in
the period
Losses previously
recognized because of
changes in estimates
are reversed before
CSM is reinstated
Agenda
1. Quick overview
2. (R)Evolution in insurance accounting
• Actuarial models
• New reporting requirements
• Systems and architecture
3. Practical example comparing IFRS 4 and IFRS 17
4. Summary
Page 11
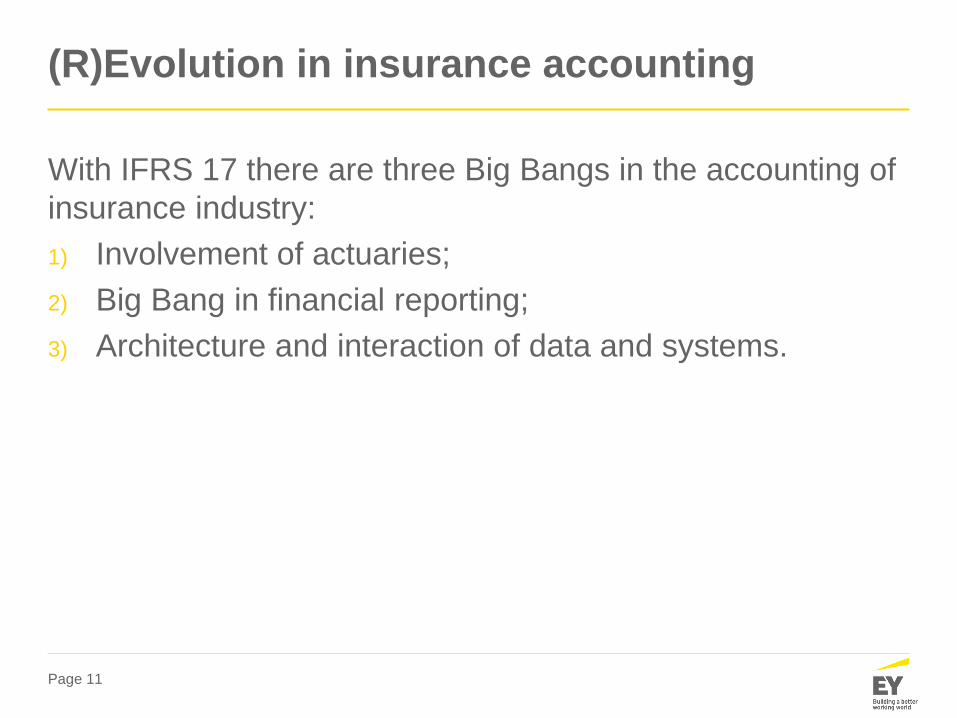
With IFRS 17 there are three Big Bangs in the accounting of
insurance industry:
1) Involvement of actuaries;
2) Big Bang in financial reporting;
3) Architecture and interaction of data and systems.
(R)Evolution in insurance accounting
Agenda
1. Quick overview
2. (R)Evolution in insurance accounting
• Actuarial models
• New reporting requirements
• Systems and architecture
3. Practical example comparing IFRS 4 and IFRS 17
4. Summary
Page 13
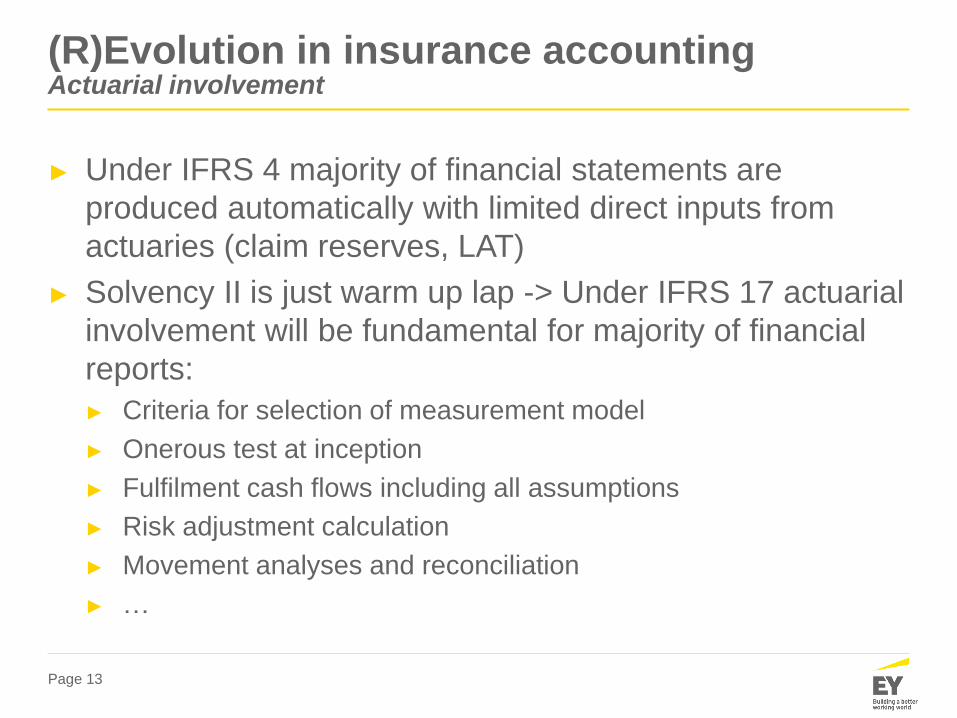
► Under IFRS 4 majority of financial statements are
produced automatically with limited direct inputs from
actuaries (claim reserves, LAT)
► Solvency II is just warm up lap -> Under IFRS 17 actuarial
involvement will be fundamental for majority of financial
reports:
► Criteria for selection of measurement model
► Onerous test at inception
► Fulfilment cash flows including all assumptions
► Risk adjustment calculation
► Movement analyses and reconciliation
► …
(R)Evolution in insurance accounting Actuarial involvement
Page 14
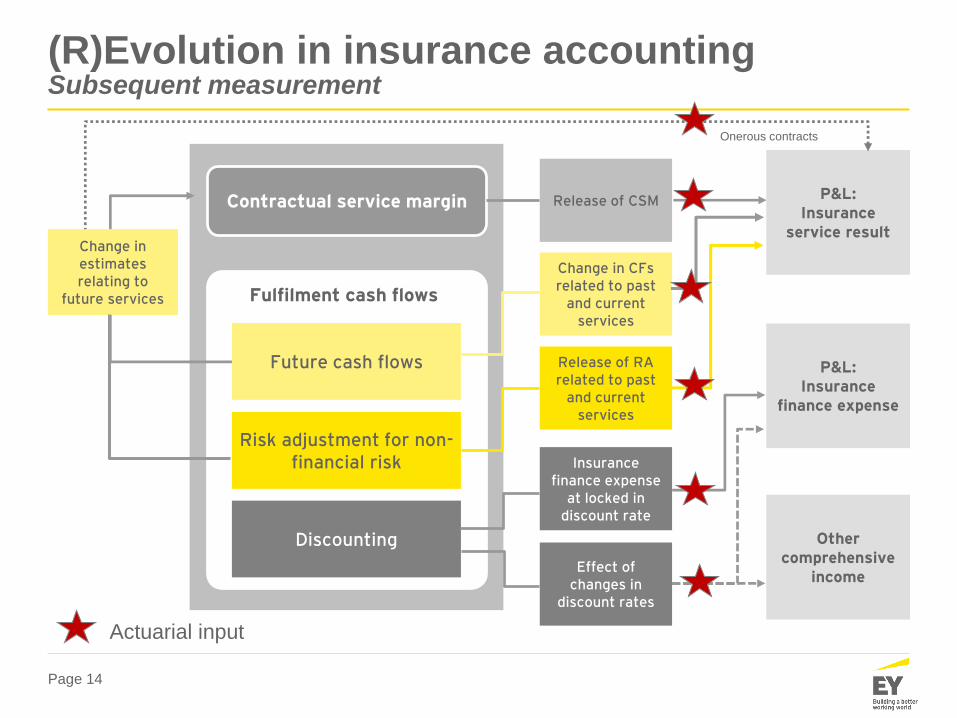
(R)Evolution in insurance accountingSubsequent measurement
Contractual service margin
Future cash flows
Risk adjustment for non-financial risk
Discounting
Fulfilment cash flows
Change in CFs related to past
and current services
Release of RA related to past
and current services
Effect of changes in
discount rates
Release of CSM
Insurance finance expense
at locked in discount rate
P&L:Insurance
service result
P&L:Insurance
finance expense
Other comprehensive
income
Change in estimates relating to
future services
Onerous contracts
Actuarial input
Agenda
1. Quick overview
2. (R)Evolution in insurance accounting
• Actuarial models
• New reporting requirements
• Systems and architecture
3. Practical example comparing IFRS 4 and IFRS 17
4. Summary
Page 16
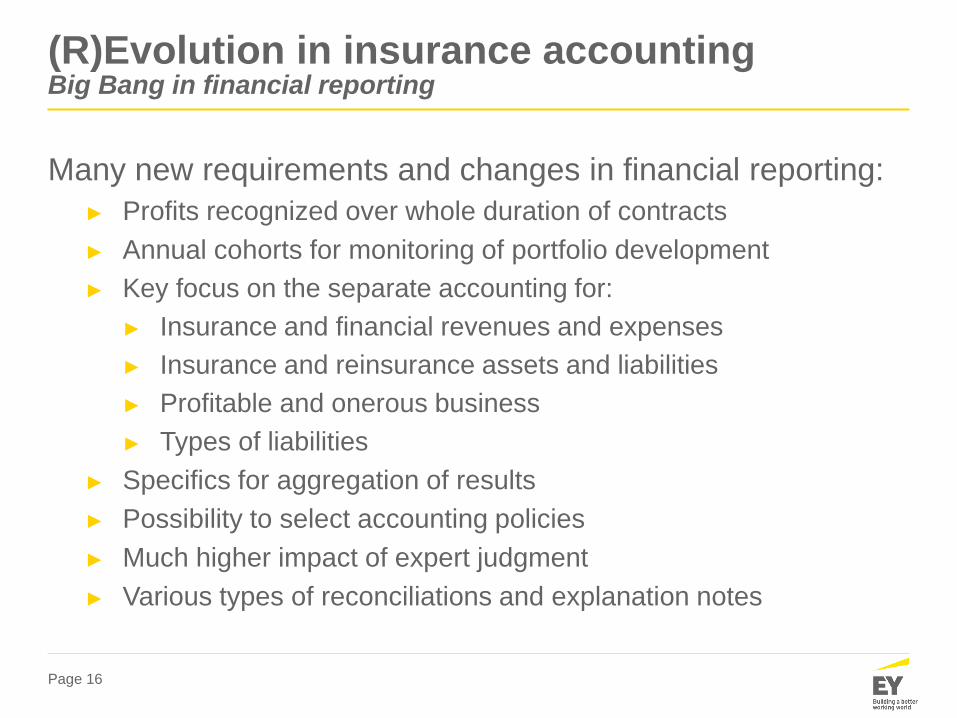
Many new requirements and changes in financial reporting:
► Profits recognized over whole duration of contracts
► Annual cohorts for monitoring of portfolio development
► Key focus on the separate accounting for:
► Insurance and financial revenues and expenses
► Insurance and reinsurance assets and liabilities
► Profitable and onerous business
► Types of liabilities
► Specifics for aggregation of results
► Possibility to select accounting policies
► Much higher impact of expert judgment
► Various types of reconciliations and explanation notes
(R)Evolution in insurance accounting Big Bang in financial reporting
Page 17
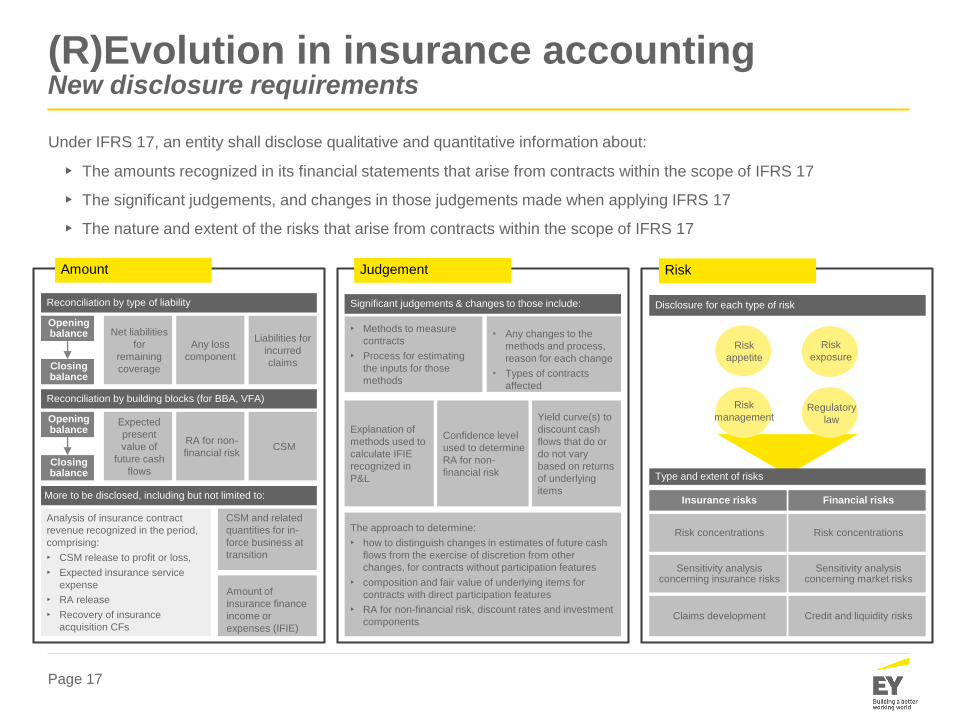
(R)Evolution in insurance accounting New disclosure requirements
Amount
Reconciliation by type of liability
Net liabilities
for
remaining
coverage
Any loss
component
Liabilities for
incurred
claims
Opening balance
Closingbalance
Reconciliation by building blocks (for BBA, VFA)
Expected
present
value of
future cash
flows
RA for non-
financial riskCSM
Opening balance
Closingbalance
More to be disclosed, including but not limited to:
CSM and related
quantities for in-
force business at
transition
Amount of
insurance finance
income or
expenses (IFIE)
Analysis of insurance contract
revenue recognized in the period,
comprising:
• CSM release to profit or loss,
• Expected insurance service
expense
• RA release
• Recovery of insurance
acquisition CFs
Explanation of
methods used to
calculate IFIE
recognized in
P&L
Confidence level
used to determine
RA for non-
financial risk
Yield curve(s) to
discount cash
flows that do or
do not vary
based on returns
of underlying
items
The approach to determine:
• how to distinguish changes in estimates of future cash
flows from the exercise of discretion from other
changes, for contracts without participation features
• composition and fair value of underlying items for
contracts with direct participation features
• RA for non-financial risk, discount rates and investment
components
• Methods to measure
contracts
• Process for estimating
the inputs for those
methods
• Any changes to the
methods and process,
reason for each change
• Types of contracts
affected
Significant judgements & changes to those include:
Judgement
Disclosure for each type of risk
Type and extent of risks
Financial risksInsurance risks
Credit and liquidity risksClaims development
Sensitivity analysis concerning market risks
Sensitivity analysis concerning insurance risks
Risk concentrationsRisk concentrations
Risk
Regulatory
law
Risk
management
Risk
appetite
Risk
exposure
Under IFRS 17, an entity shall disclose qualitative and quantitative information about:
• The amounts recognized in its financial statements that arise from contracts within the scope of IFRS 17
• The significant judgements, and changes in those judgements made when applying IFRS 17
• The nature and extent of the risks that arise from contracts within the scope of IFRS 17
Agenda
1. Quick overview
2. (R)Evolution in insurance accounting
• Actuarial models
• New reporting requirements
• Systems and architecture
3. Practical example comparing IFRS 4 and IFRS 17
4. Summary
Page 19
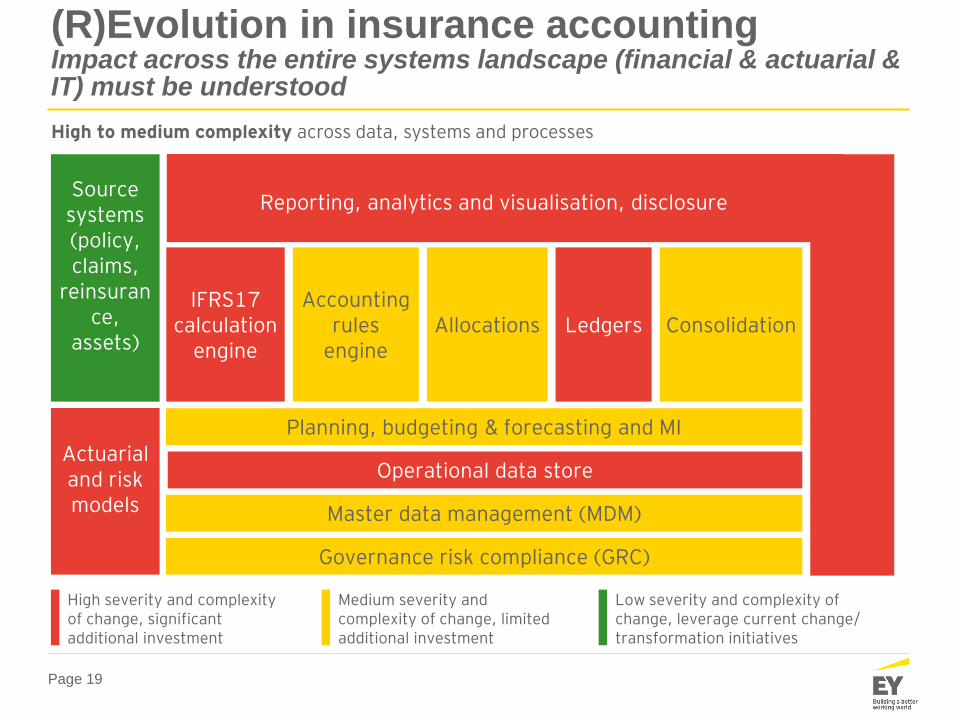
High severity and complexity of change, significant additional investment
Medium severity and complexity of change, limited additional investment
Low severity and complexity of change, leverage current change/ transformation initiatives
Source systems (policy, claims,
reinsurance,
assets)
IFRS17 calculation
engine
Operational data store
Ledgers
Actuarial and risk models
Reporting, analytics and visualisation, disclosure
High to medium complexity across data, systems and processes
(R)Evolution in insurance accountingImpact across the entire systems landscape (financial & actuarial & IT) must be understood
Master data management (MDM)
Governance risk compliance (GRC)
Planning, budgeting & forecasting and MI
Accounting rules
engineAllocations Consolidation
Page 20
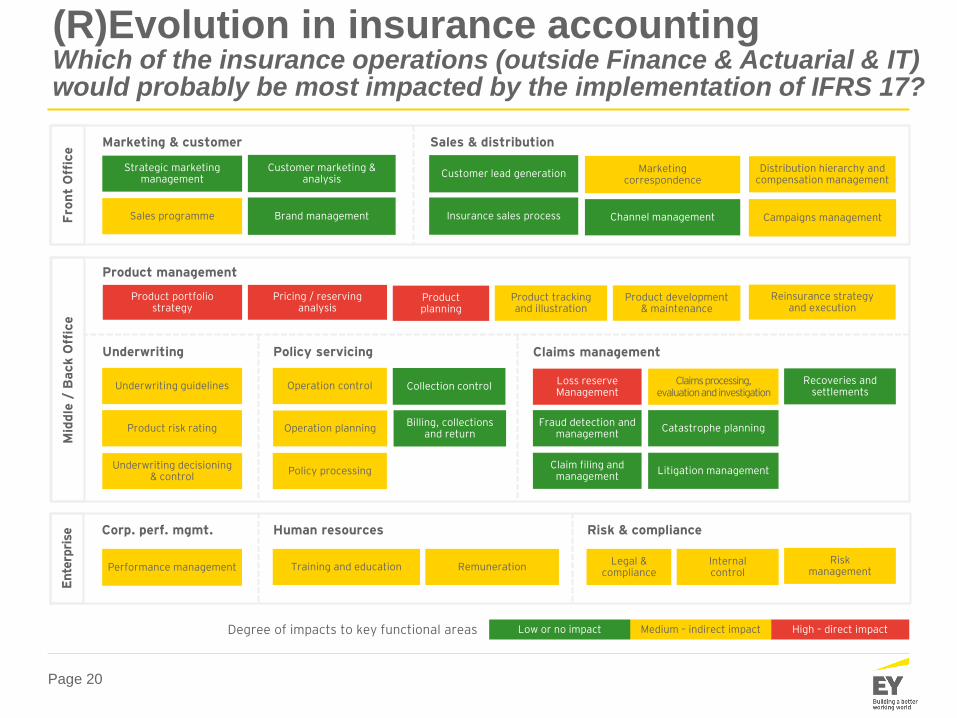
(R)Evolution in insurance accountingWhich of the insurance operations (outside Finance & Actuarial & IT) would probably be most impacted by the implementation of IFRS 17?
High – direct impactMedium – indirect impactLow or no impactDegree of impacts to key functional areas
Fro
nt
Off
ice
Sales programme
Strategic marketing management
Customer marketing & analysis
Marketing & customer Sales & distribution
Brand management Insurance sales process
Distribution hierarchy and compensation management
Customer lead generation Marketing correspondence
Channel management Campaigns management
Mid
dle
/ B
ack O
ffic
e
Product portfolio strategy
Product management
Product planning
Product tracking and illustration
Pricing / reserving analysis
Product development & maintenance
Reinsurance strategy and execution
Underwriting Policy servicing Claims management
Product risk rating
Underwriting decisioning& control
Underwriting guidelines Operation control
Operation planning
Policy processing
Billing, collections and return
Catastrophe planning
Litigation management
Fraud detection and management
Claim filing and management
Loss reserve Management
Claims processing, evaluation and investigation
Recoveries and settlements
Collection control
Ente
rpri
se
Human resources Risk & compliance
Internal control
Risk managementRemunerationTraining and education
Legal & compliance
Performance management
Corp. perf. mgmt.
Page 21
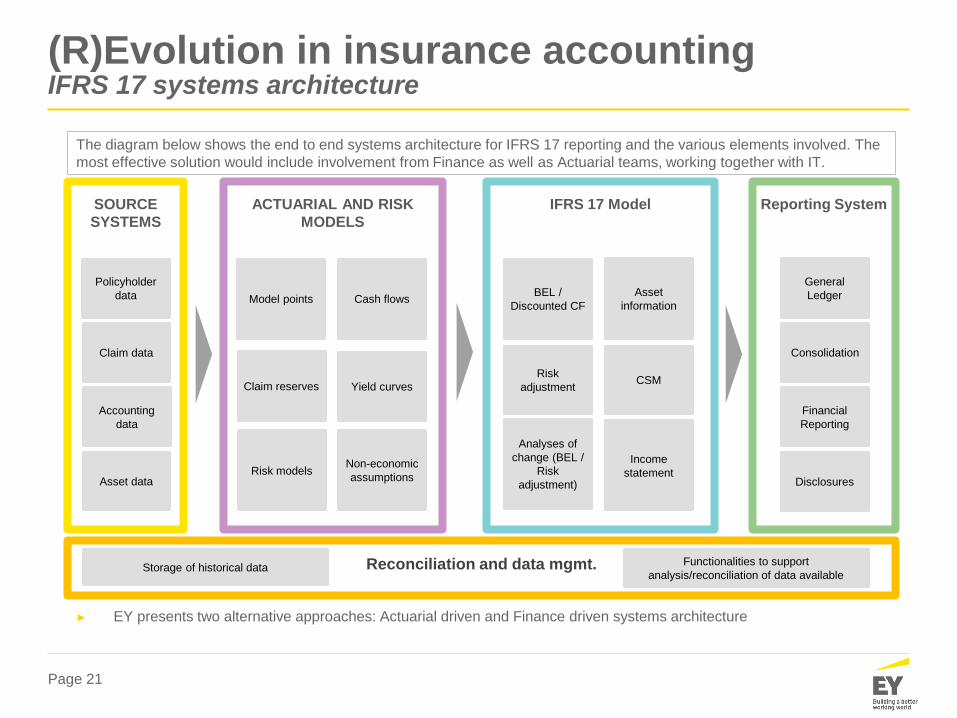
(R)Evolution in insurance accounting IFRS 17 systems architecture
► EY presents two alternative approaches: Actuarial driven and Finance driven systems architecture
SOURCE
SYSTEMS
ACTUARIAL AND RISK
MODELS
IFRS 17 Model Reporting System
Policyholder
data
Claim data
Asset data
Model points
Claim reserves
Asset
information
Yield curves
Cash flowsBEL /
Discounted CF
Risk
adjustmentCSM
Analyses of
change (BEL /
Risk
adjustment)
General
Ledger
Financial
Reporting
Income
statementDisclosures
The diagram below shows the end to end systems architecture for IFRS 17 reporting and the various elements involved. The
most effective solution would include involvement from Finance as well as Actuarial teams, working together with IT.
Accounting
data
Risk modelsNon-economic
assumptions
Consolidation
Storage of historical dataFunctionalities to support
analysis/reconciliation of data availableReconciliation and data mgmt.
Page 22
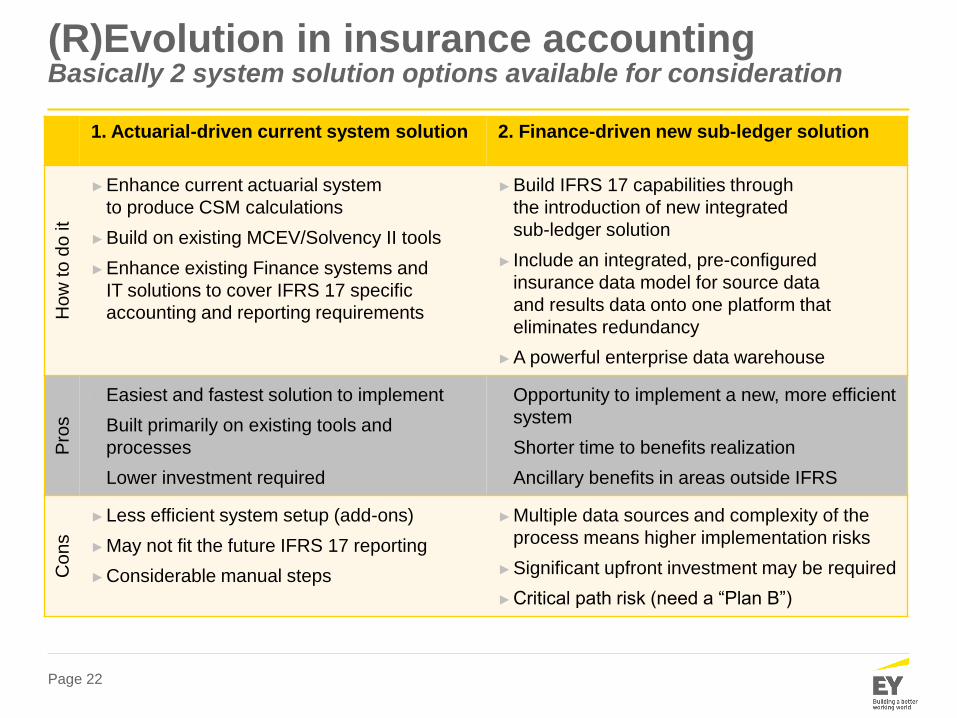
1. Actuarial-driven current system solution 2. Finance-driven new sub-ledger solution
How
to d
o it
►Enhance current actuarial system
to produce CSM calculations
►Build on existing MCEV/Solvency II tools
►Enhance existing Finance systems and
IT solutions to cover IFRS 17 specific
accounting and reporting requirements
►Build IFRS 17 capabilities through
the introduction of new integrated
sub-ledger solution
► Include an integrated, pre-configured
insurance data model for source data
and results data onto one platform that
eliminates redundancy
►A powerful enterprise data warehouse
Pro
s
►Easiest and fastest solution to implement
►Built primarily on existing tools and
processes
►Lower investment required
►Opportunity to implement a new, more efficient
system
►Shorter time to benefits realization
►Ancillary benefits in areas outside IFRS
Cons
►Less efficient system setup (add-ons)
►May not fit the future IFRS 17 reporting
►Considerable manual steps
►Multiple data sources and complexity of the
process means higher implementation risks
►Significant upfront investment may be required
►Critical path risk (need a “Plan B”)
(R)Evolution in insurance accounting Basically 2 system solution options available for consideration
Agenda
1. Quick overview
2. (R)Evolution in insurance accounting
• Actuarial models
• New reporting requirements
• Systems and architecture
3. Practical example comparing IFRS 4 and IFRS 17
4. Summary
Page 24
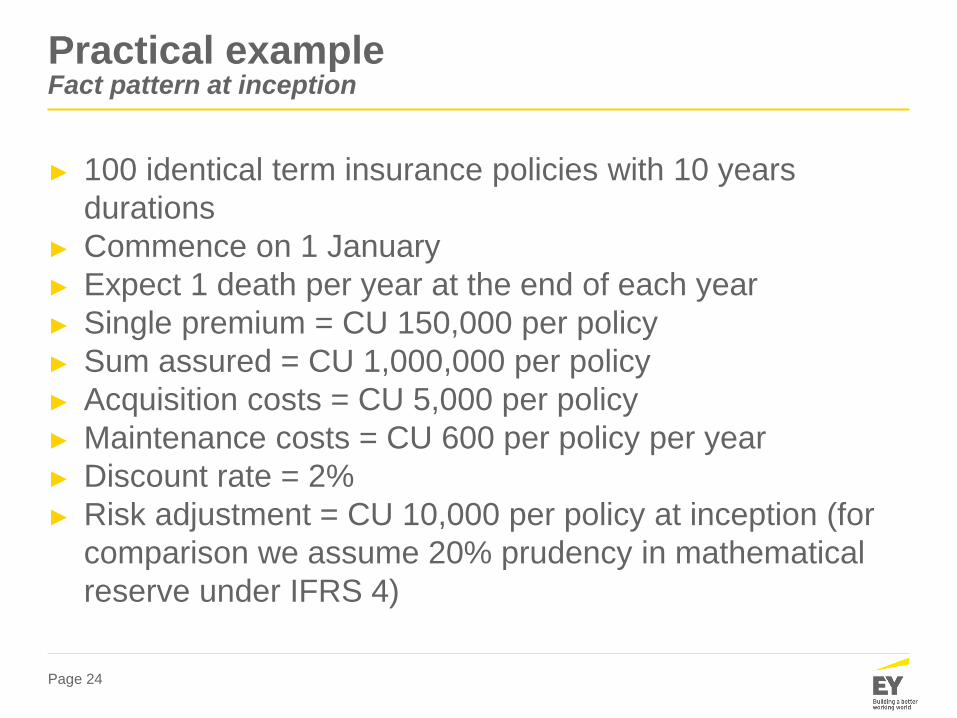
Practical exampleFact pattern at inception
► 100 identical term insurance policies with 10 years
durations
► Commence on 1 January
► Expect 1 death per year at the end of each year
► Single premium = CU 150,000 per policy
► Sum assured = CU 1,000,000 per policy
► Acquisition costs = CU 5,000 per policy
► Maintenance costs = CU 600 per policy per year
► Discount rate = 2%
► Risk adjustment = CU 10,000 per policy at inception (for
comparison we assume 20% prudency in mathematical
reserve under IFRS 4)
Page 25
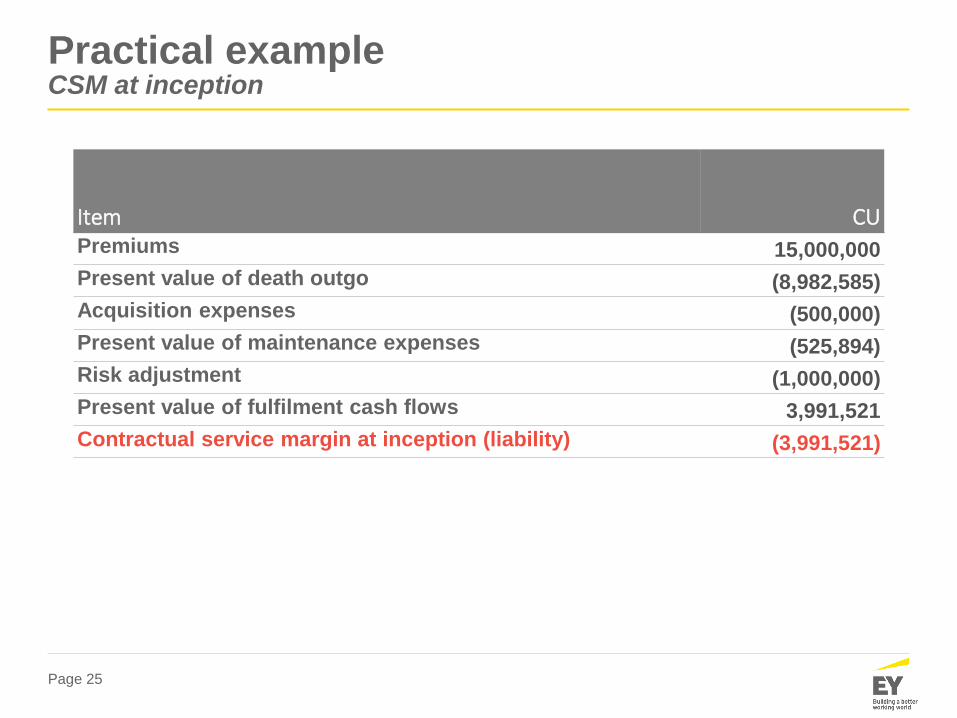
Practical exampleCSM at inception
Item CUPremiums 15,000,000
Present value of death outgo (8,982,585)
Acquisition expenses (500,000)
Present value of maintenance expenses (525,894)
Risk adjustment (1,000,000)
Present value of fulfilment cash flows 3,991,521
Contractual service margin at inception (liability) (3,991,521)
Page 26
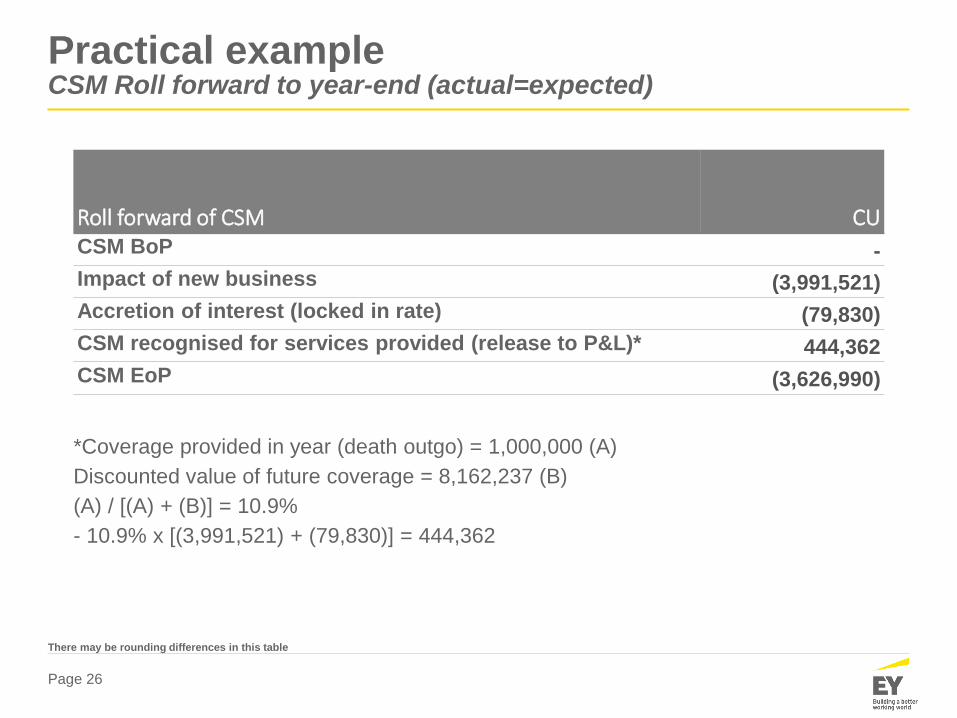
Practical exampleCSM Roll forward to year-end (actual=expected)
Roll forward of CSM CUCSM BoP -
Impact of new business (3,991,521)
Accretion of interest (locked in rate) (79,830)
CSM recognised for services provided (release to P&L)* 444,362
CSM EoP (3,626,990)
*Coverage provided in year (death outgo) = 1,000,000 (A)
Discounted value of future coverage = 8,162,237 (B)
(A) / [(A) + (B)] = 10.9%
- 10.9% x [(3,991,521) + (79,830)] = 444,362
There may be rounding differences in this table
Page 27
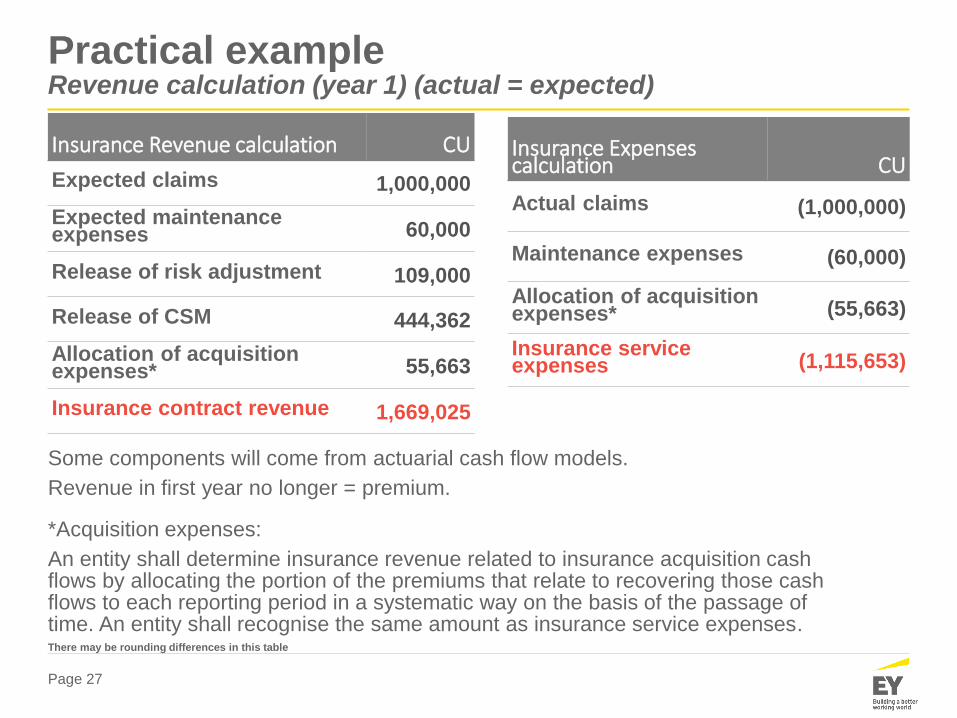
Practical exampleRevenue calculation (year 1) (actual = expected)
Insurance Revenue calculation CU
Expected claims 1,000,000
Expected maintenance expenses 60,000
Release of risk adjustment 109,000
Release of CSM 444,362
Allocation of acquisition expenses* 55,663
Insurance contract revenue 1,669,025
*Acquisition expenses:
An entity shall determine insurance revenue related to insurance acquisition cash flows by allocating the portion of the premiums that relate to recovering those cash flows to each reporting period in a systematic way on the basis of the passage of time. An entity shall recognise the same amount as insurance service expenses.
Some components will come from actuarial cash flow models.
Revenue in first year no longer = premium.
Insurance Expenses calculation CU
Actual claims (1,000,000)
Maintenance expenses (60,000)
Allocation of acquisition expenses* (55,663)
Insurance service expenses (1,115,653)
There may be rounding differences in this table
Page 28
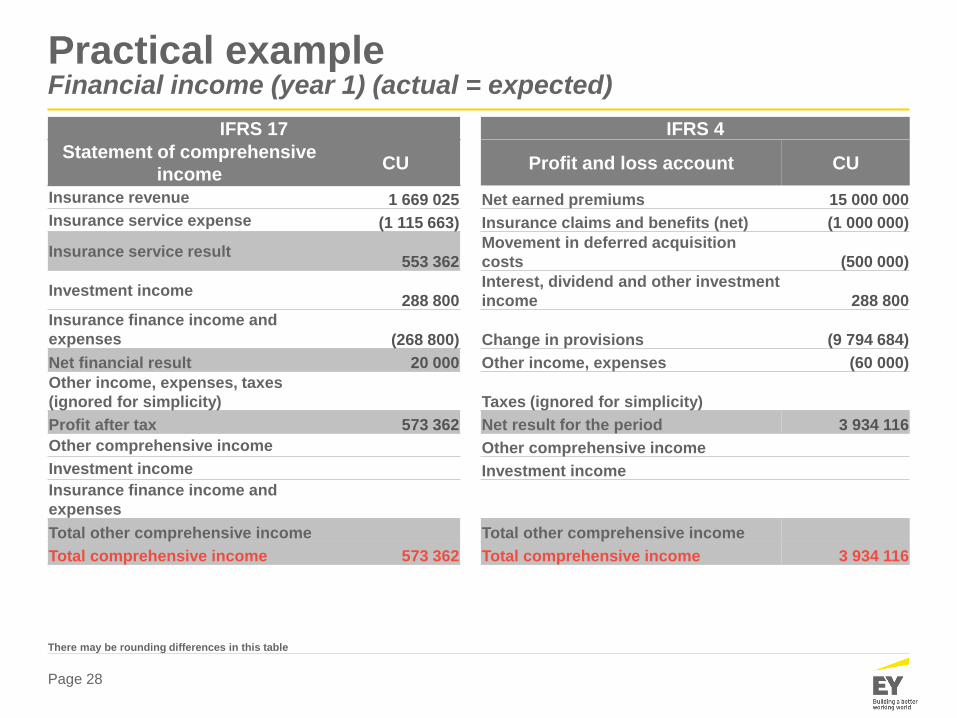
Practical exampleFinancial income (year 1) (actual = expected)
IFRS 17 IFRS 4
Statement of comprehensive
incomeCU Profit and loss account CU
Insurance revenue 1 669 025 Net earned premiums 15 000 000
Insurance service expense (1 115 663) Insurance claims and benefits (net) (1 000 000)
Insurance service result553 362
Movement in deferred acquisition
costs (500 000)
Investment income288 800
Interest, dividend and other investment
income 288 800
Insurance finance income and
expenses (268 800) Change in provisions (9 794 684)
Net financial result 20 000 Other income, expenses (60 000)
Other income, expenses, taxes
(ignored for simplicity) Taxes (ignored for simplicity)
Profit after tax 573 362 Net result for the period 3 934 116
Other comprehensive income Other comprehensive income
Investment income Investment income
Insurance finance income and
expenses
Total other comprehensive income Total other comprehensive income
Total comprehensive income 573 362 Total comprehensive income 3 934 116
There may be rounding differences in this table
Page 29
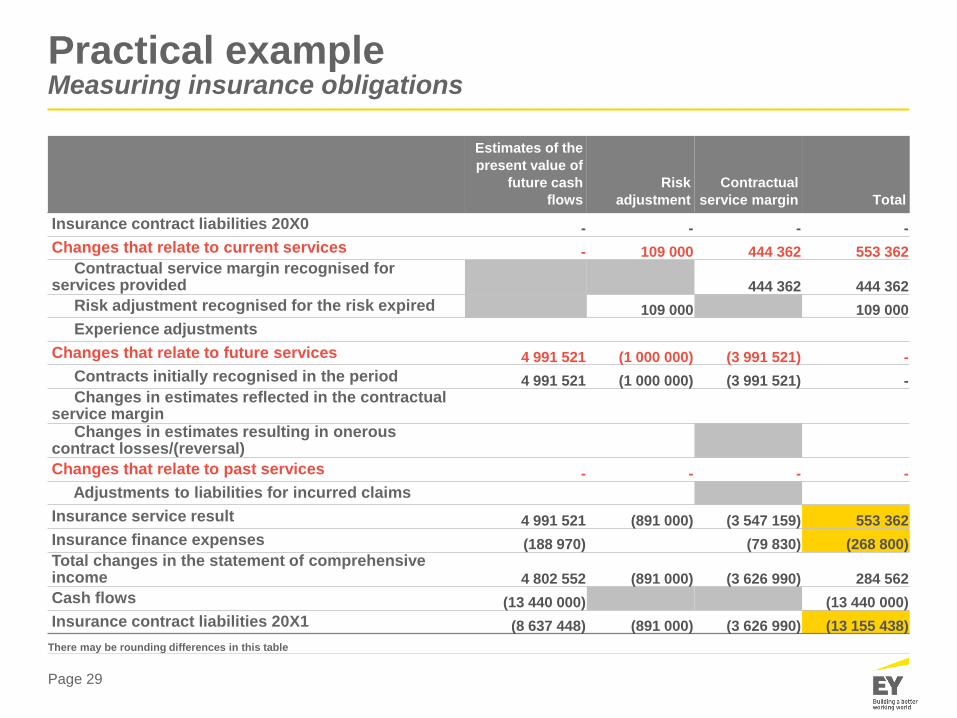
Estimates of the
present value of
future cash
flows
Risk
adjustment
Contractual
service margin Total
Insurance contract liabilities 20X0 - - - -
Changes that relate to current services - 109 000 444 362 553 362 Contractual service margin recognised for
services provided 444 362 444 362
Risk adjustment recognised for the risk expired 109 000 109 000
Experience adjustments
Changes that relate to future services 4 991 521 (1 000 000) (3 991 521) -
Contracts initially recognised in the period 4 991 521 (1 000 000) (3 991 521) -Changes in estimates reflected in the contractual
service marginChanges in estimates resulting in onerous
contract losses/(reversal)
Changes that relate to past services - - - -
Adjustments to liabilities for incurred claims
Insurance service result 4 991 521 (891 000) (3 547 159) 553 362
Insurance finance expenses (188 970) (79 830) (268 800)Total changes in the statement of comprehensive income 4 802 552 (891 000) (3 626 990) 284 562
Cash flows (13 440 000) (13 440 000)
Insurance contract liabilities 20X1 (8 637 448) (891 000) (3 626 990) (13 155 438)
Practical exampleMeasuring insurance obligations
There may be rounding differences in this table
Page 30
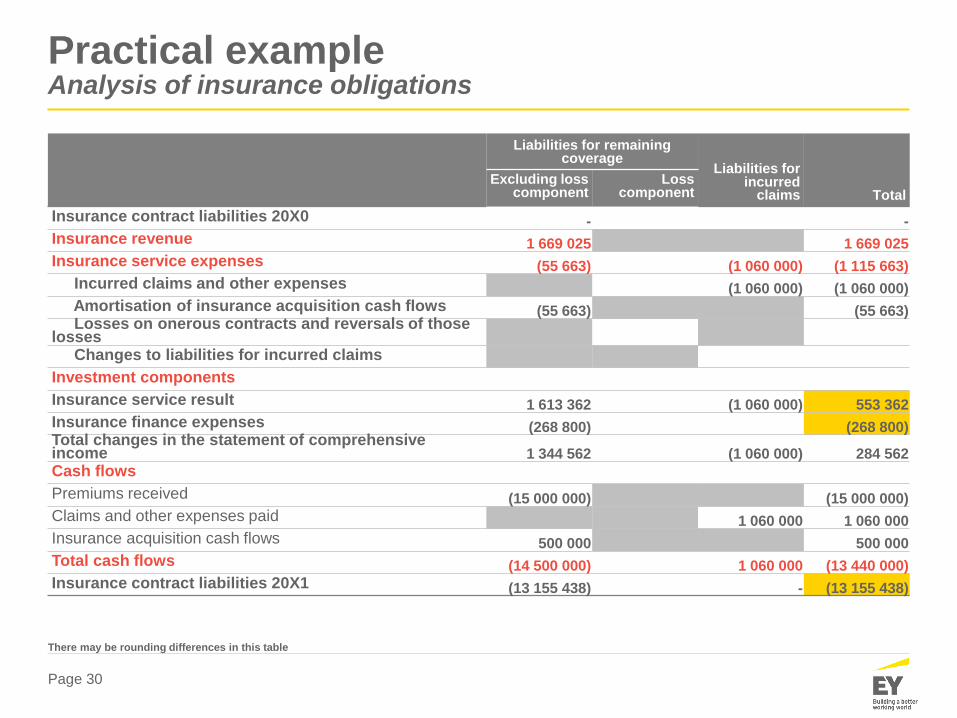
Practical exampleAnalysis of insurance obligations
Liabilities for remaining coverage
Liabilities for incurred
claims TotalExcluding loss
componentLoss
component
Insurance contract liabilities 20X0 - -
Insurance revenue 1 669 025 1 669 025
Insurance service expenses (55 663) (1 060 000) (1 115 663)
Incurred claims and other expenses (1 060 000) (1 060 000)
Amortisation of insurance acquisition cash flows (55 663) (55 663)Losses on onerous contracts and reversals of those
lossesChanges to liabilities for incurred claims
Investment components
Insurance service result 1 613 362 (1 060 000) 553 362
Insurance finance expenses (268 800) (268 800)Total changes in the statement of comprehensive income 1 344 562 (1 060 000) 284 562
Cash flows
Premiums received (15 000 000) (15 000 000)
Claims and other expenses paid 1 060 000 1 060 000
Insurance acquisition cash flows 500 000 500 000
Total cash flows (14 500 000) 1 060 000 (13 440 000)
Insurance contract liabilities 20X1 (13 155 438) - (13 155 438)
There may be rounding differences in this table
Page 31
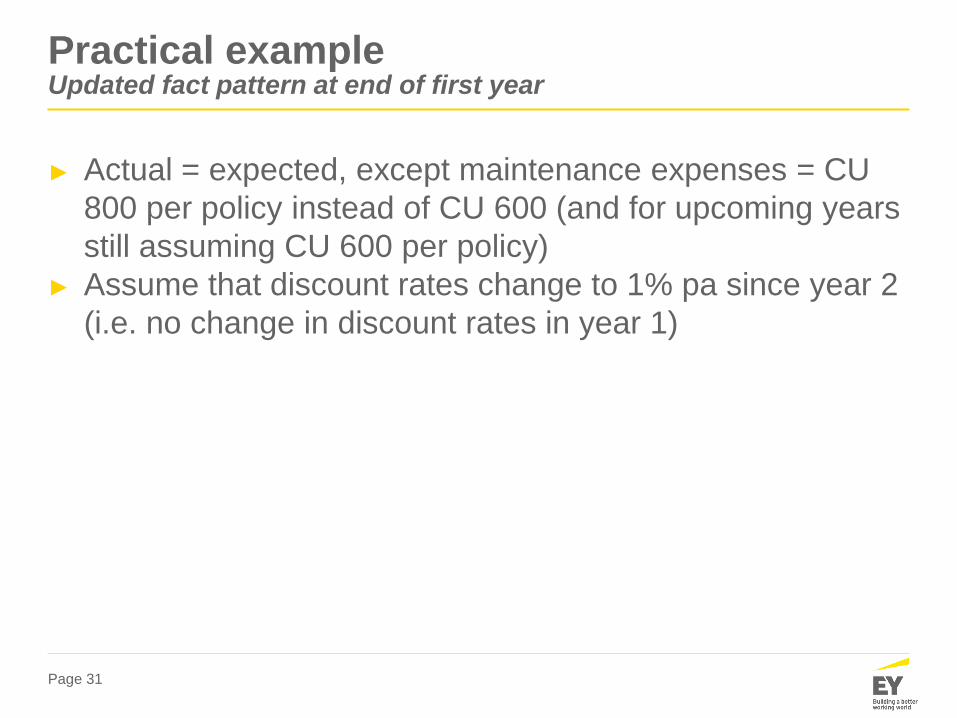
Practical exampleUpdated fact pattern at end of first year
► Actual = expected, except maintenance expenses = CU
800 per policy instead of CU 600 (and for upcoming years
still assuming CU 600 per policy)
► Assume that discount rates change to 1% pa since year 2
(i.e. no change in discount rates in year 1)
Page 32
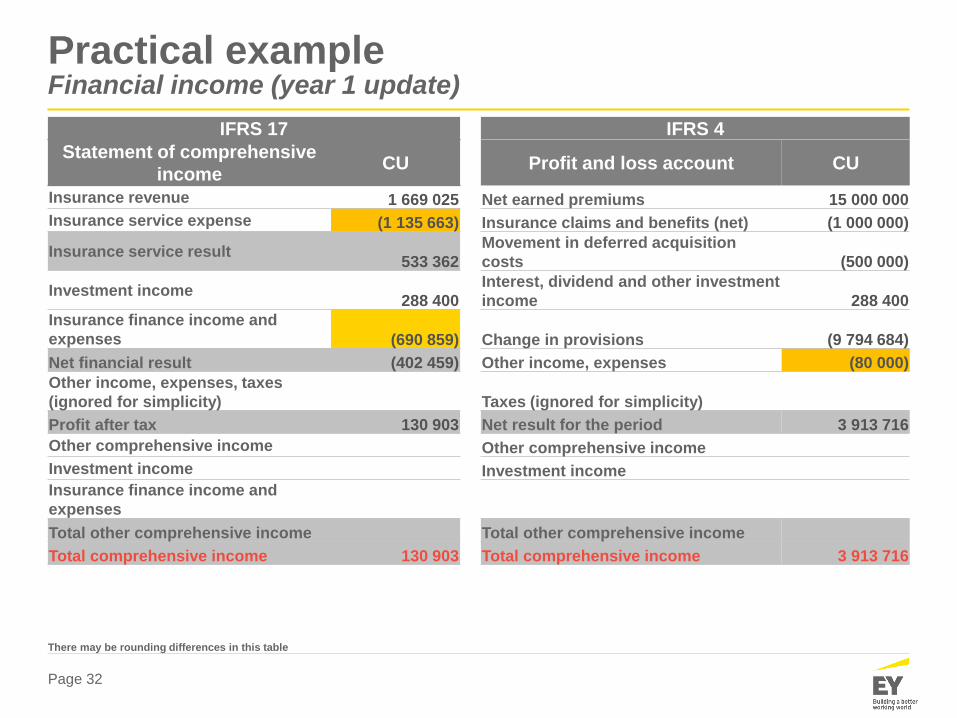
Practical exampleFinancial income (year 1 update)
IFRS 17 IFRS 4
Statement of comprehensive
incomeCU Profit and loss account CU
Insurance revenue 1 669 025 Net earned premiums 15 000 000
Insurance service expense (1 135 663) Insurance claims and benefits (net) (1 000 000)
Insurance service result533 362
Movement in deferred acquisition
costs (500 000)
Investment income288 400
Interest, dividend and other investment
income 288 400
Insurance finance income and
expenses (690 859) Change in provisions (9 794 684)
Net financial result (402 459) Other income, expenses (80 000)
Other income, expenses, taxes
(ignored for simplicity) Taxes (ignored for simplicity)
Profit after tax 130 903 Net result for the period 3 913 716
Other comprehensive income Other comprehensive income
Investment income Investment income
Insurance finance income and
expenses
Total other comprehensive income Total other comprehensive income
Total comprehensive income 130 903 Total comprehensive income 3 913 716
There may be rounding differences in this table
Page 33
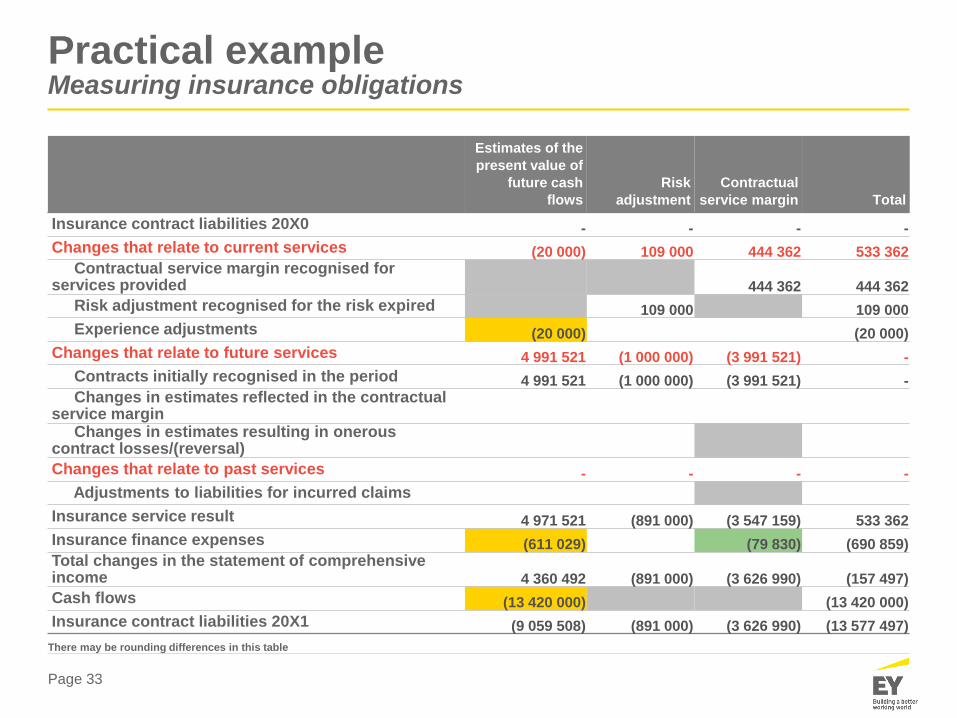
Practical exampleMeasuring insurance obligations
Estimates of the
present value of
future cash
flows
Risk
adjustment
Contractual
service margin Total
Insurance contract liabilities 20X0 - - - -
Changes that relate to current services (20 000) 109 000 444 362 533 362 Contractual service margin recognised for
services provided 444 362 444 362
Risk adjustment recognised for the risk expired 109 000 109 000
Experience adjustments (20 000) (20 000)
Changes that relate to future services 4 991 521 (1 000 000) (3 991 521) -
Contracts initially recognised in the period 4 991 521 (1 000 000) (3 991 521) -Changes in estimates reflected in the contractual
service marginChanges in estimates resulting in onerous
contract losses/(reversal)
Changes that relate to past services - - - -
Adjustments to liabilities for incurred claims
Insurance service result 4 971 521 (891 000) (3 547 159) 533 362
Insurance finance expenses (611 029) (79 830) (690 859)Total changes in the statement of comprehensive income 4 360 492 (891 000) (3 626 990) (157 497)
Cash flows (13 420 000) (13 420 000)
Insurance contract liabilities 20X1 (9 059 508) (891 000) (3 626 990) (13 577 497)
There may be rounding differences in this table
Page 34
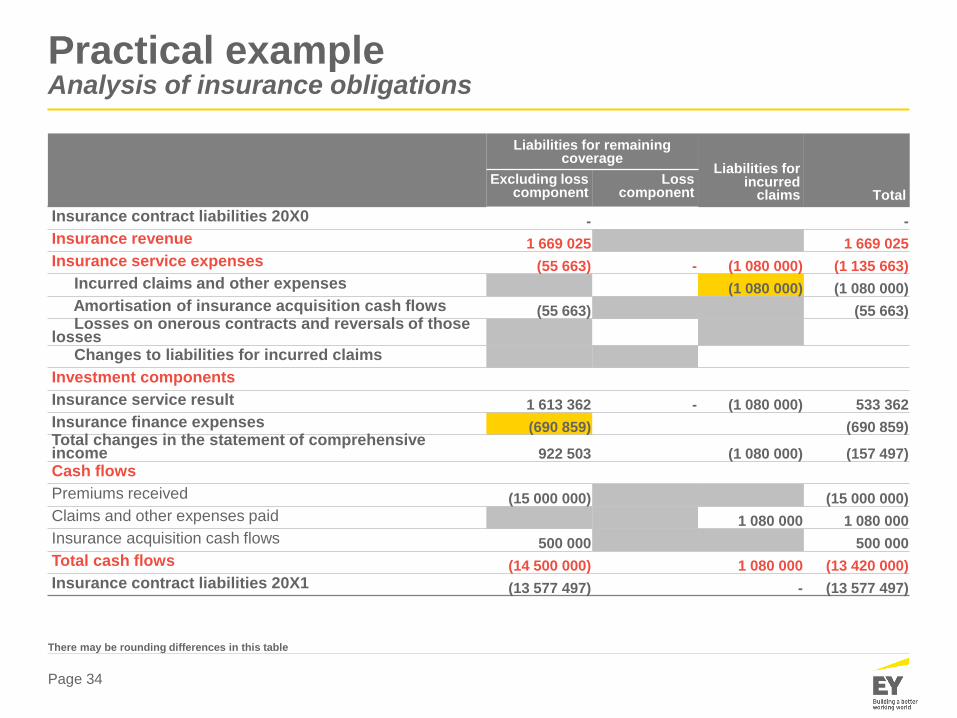
Practical exampleAnalysis of insurance obligations
Liabilities for remaining coverage
Liabilities for incurred
claims TotalExcluding loss
componentLoss
component
Insurance contract liabilities 20X0 - -
Insurance revenue 1 669 025 1 669 025
Insurance service expenses (55 663) - (1 080 000) (1 135 663)
Incurred claims and other expenses (1 080 000) (1 080 000)
Amortisation of insurance acquisition cash flows (55 663) (55 663)Losses on onerous contracts and reversals of those
lossesChanges to liabilities for incurred claims
Investment components
Insurance service result 1 613 362 - (1 080 000) 533 362
Insurance finance expenses (690 859) (690 859)Total changes in the statement of comprehensive income 922 503 (1 080 000) (157 497)
Cash flows
Premiums received (15 000 000) (15 000 000)
Claims and other expenses paid 1 080 000 1 080 000
Insurance acquisition cash flows 500 000 500 000
Total cash flows (14 500 000) 1 080 000 (13 420 000)
Insurance contract liabilities 20X1 (13 577 497) - (13 577 497)
There may be rounding differences in this table
Page 35
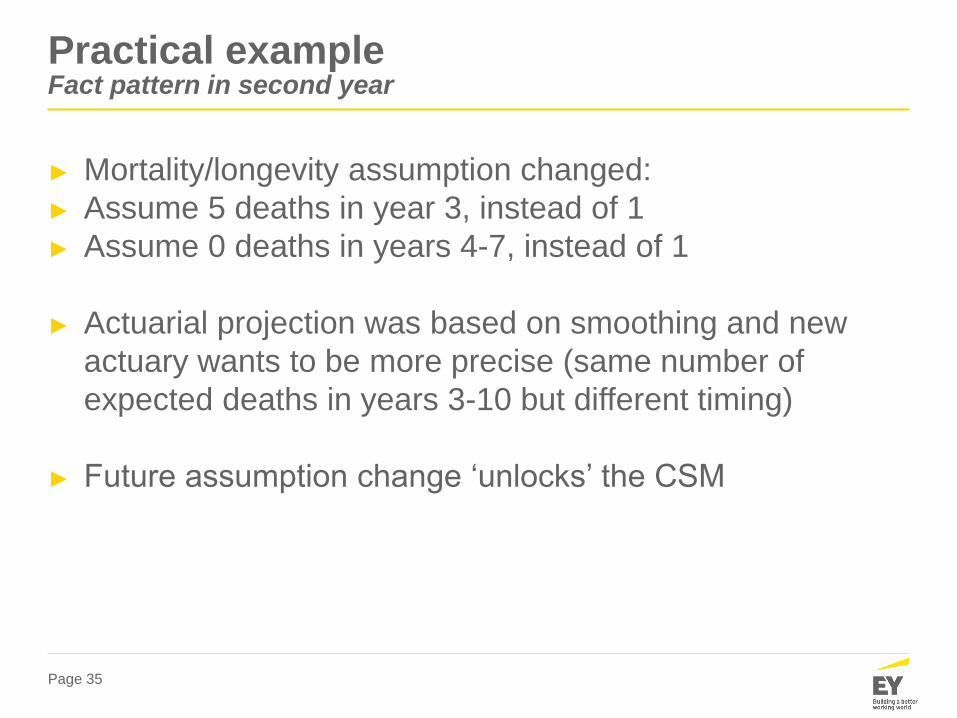
Practical exampleFact pattern in second year
► Mortality/longevity assumption changed:
► Assume 5 deaths in year 3, instead of 1
► Assume 0 deaths in years 4-7, instead of 1
► Actuarial projection was based on smoothing and new
actuary wants to be more precise (same number of
expected deaths in years 3-10 but different timing)
► Future assumption change ‘unlocks’ the CSM
Page 36
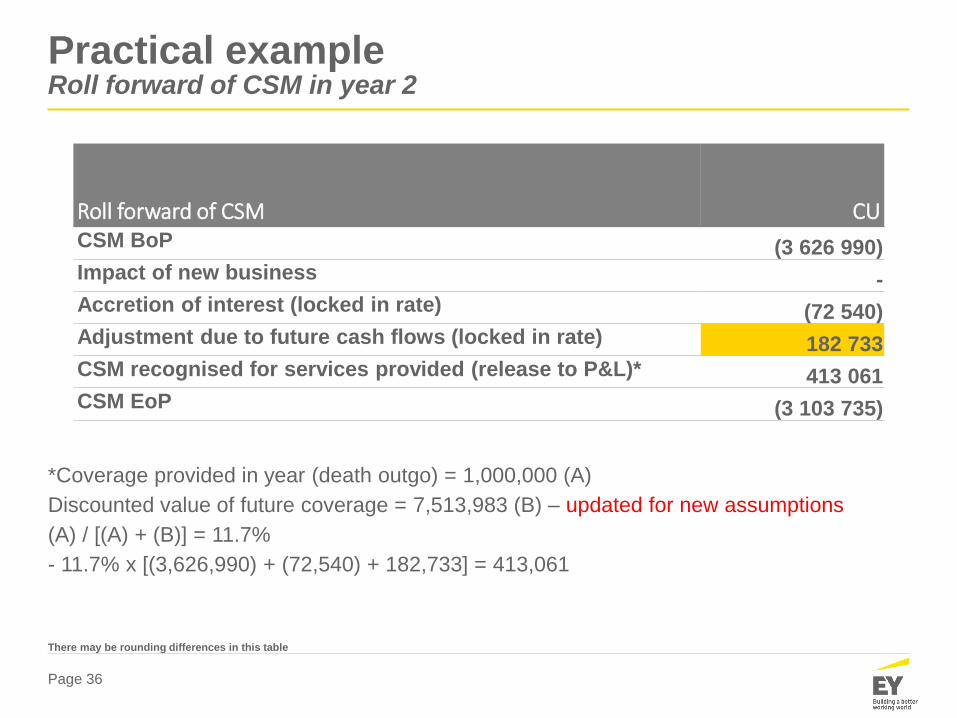
Practical exampleRoll forward of CSM in year 2
Roll forward of CSM CUCSM BoP (3 626 990)
Impact of new business -
Accretion of interest (locked in rate) (72 540)
Adjustment due to future cash flows (locked in rate) 182 733
CSM recognised for services provided (release to P&L)* 413 061
CSM EoP (3 103 735)
*Coverage provided in year (death outgo) = 1,000,000 (A)
Discounted value of future coverage = 7,513,983 (B) – updated for new assumptions
(A) / [(A) + (B)] = 11.7%
- 11.7% x [(3,626,990) + (72,540) + 182,733] = 413,061
There may be rounding differences in this table
Page 37
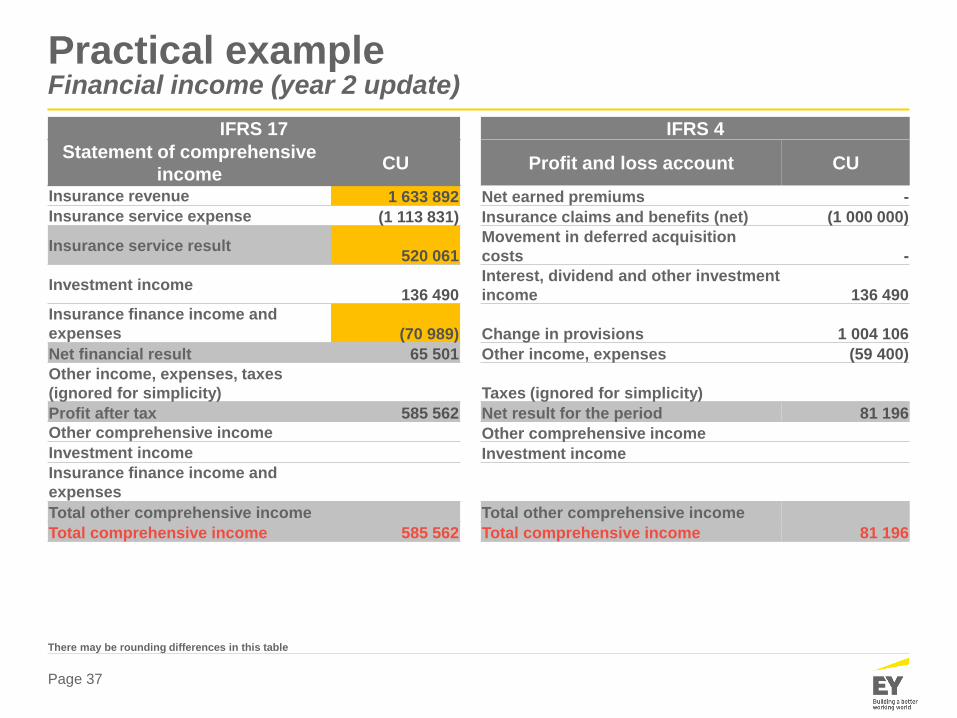
Practical exampleFinancial income (year 2 update)
IFRS 17 IFRS 4
Statement of comprehensive
incomeCU Profit and loss account CU
Insurance revenue 1 633 892 Net earned premiums -
Insurance service expense (1 113 831) Insurance claims and benefits (net) (1 000 000)
Insurance service result520 061
Movement in deferred acquisition
costs -
Investment income136 490
Interest, dividend and other investment
income 136 490
Insurance finance income and
expenses (70 989) Change in provisions 1 004 106
Net financial result 65 501 Other income, expenses (59 400)
Other income, expenses, taxes
(ignored for simplicity) Taxes (ignored for simplicity)
Profit after tax 585 562 Net result for the period 81 196
Other comprehensive income Other comprehensive income
Investment income Investment income
Insurance finance income and
expenses
Total other comprehensive income Total other comprehensive income
Total comprehensive income 585 562 Total comprehensive income 81 196
There may be rounding differences in this table
Page 38
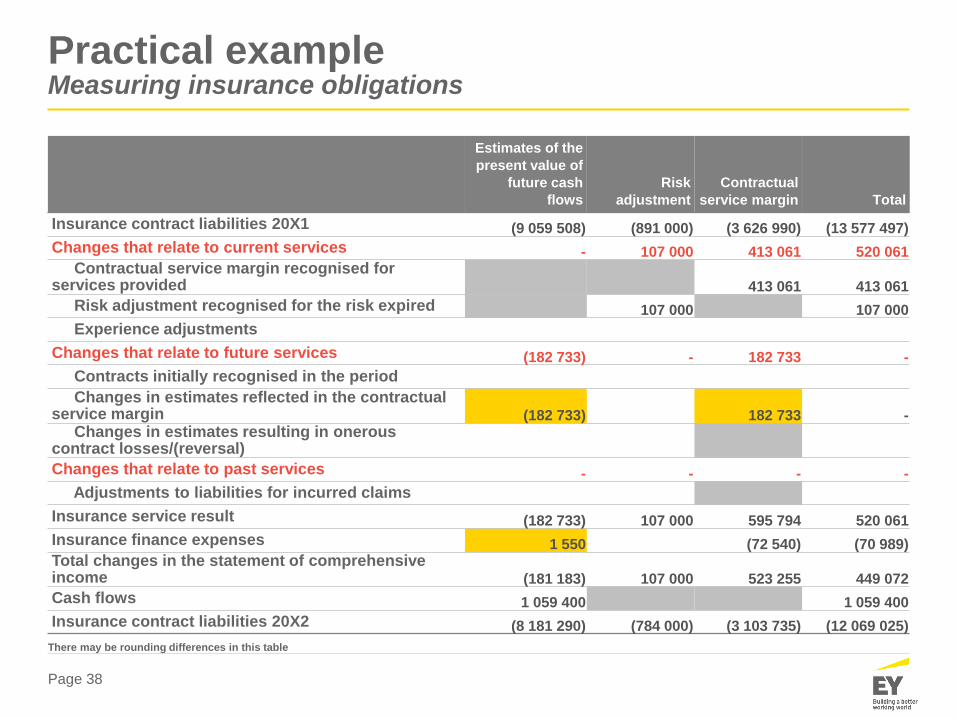
Practical exampleMeasuring insurance obligations
Estimates of the
present value of
future cash
flows
Risk
adjustment
Contractual
service margin Total
Insurance contract liabilities 20X1 (9 059 508) (891 000) (3 626 990) (13 577 497)
Changes that relate to current services - 107 000 413 061 520 061 Contractual service margin recognised for
services provided 413 061 413 061
Risk adjustment recognised for the risk expired 107 000 107 000
Experience adjustments
Changes that relate to future services (182 733) - 182 733 -
Contracts initially recognised in the period
Changes in estimates reflected in the contractual service margin (182 733) 182 733 -
Changes in estimates resulting in onerous contract losses/(reversal)
Changes that relate to past services - - - -
Adjustments to liabilities for incurred claims
Insurance service result (182 733) 107 000 595 794 520 061
Insurance finance expenses 1 550 (72 540) (70 989)Total changes in the statement of comprehensive income (181 183) 107 000 523 255 449 072
Cash flows 1 059 400 1 059 400
Insurance contract liabilities 20X2 (8 181 290) (784 000) (3 103 735) (12 069 025)
There may be rounding differences in this table
Page 39
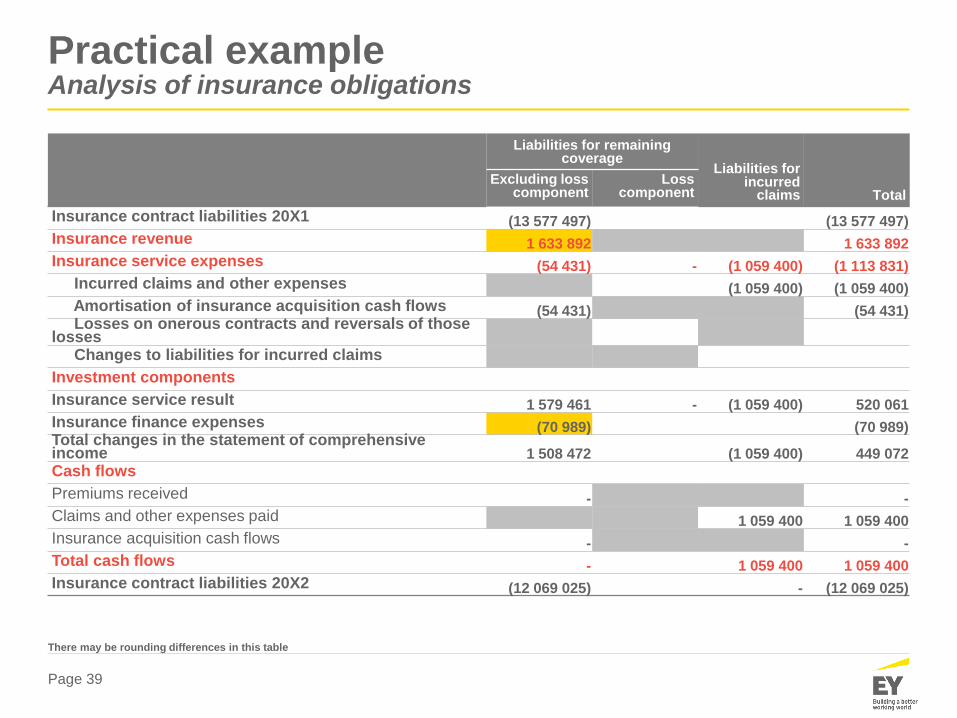
Practical exampleAnalysis of insurance obligations
Liabilities for remaining coverage
Liabilities for incurred
claims TotalExcluding loss
componentLoss
component
Insurance contract liabilities 20X1 (13 577 497) (13 577 497)
Insurance revenue 1 633 892 1 633 892
Insurance service expenses (54 431) - (1 059 400) (1 113 831)
Incurred claims and other expenses (1 059 400) (1 059 400)
Amortisation of insurance acquisition cash flows (54 431) (54 431)Losses on onerous contracts and reversals of those
lossesChanges to liabilities for incurred claims
Investment components
Insurance service result 1 579 461 - (1 059 400) 520 061
Insurance finance expenses (70 989) (70 989)Total changes in the statement of comprehensive income 1 508 472 (1 059 400) 449 072
Cash flows
Premiums received - -
Claims and other expenses paid 1 059 400 1 059 400
Insurance acquisition cash flows - -
Total cash flows - 1 059 400 1 059 400
Insurance contract liabilities 20X2 (12 069 025) - (12 069 025)
There may be rounding differences in this table
Page 40
Practical exampleFact pattern in third year
► Mortality/longevity assumption changed again
► Assume 1 death in years 4 - 7 instead of 0
► Because in year 3 there was 5 deaths, the assumption
about 0 deaths in upcoming 4 years was too aggressive
► Future assumption change ‘unlocks’ the CSM
Page 41
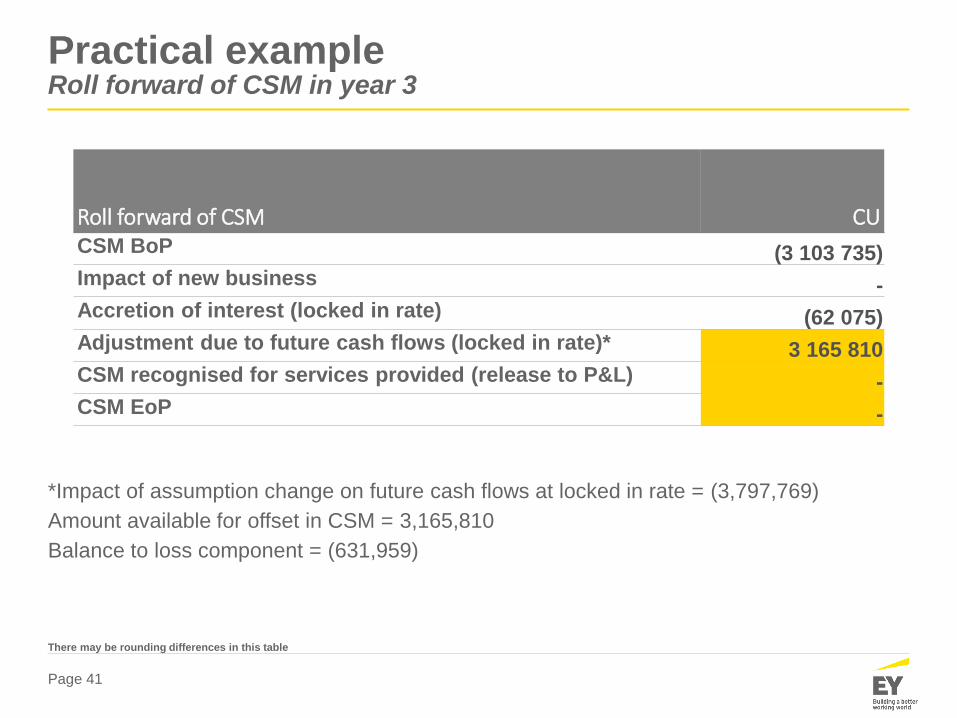
Practical exampleRoll forward of CSM in year 3
Roll forward of CSM CUCSM BoP (3 103 735)
Impact of new business -
Accretion of interest (locked in rate) (62 075)
Adjustment due to future cash flows (locked in rate)* 3 165 810
CSM recognised for services provided (release to P&L) -
CSM EoP -
*Impact of assumption change on future cash flows at locked in rate = (3,797,769)
Amount available for offset in CSM = 3,165,810
Balance to loss component = (631,959)
There may be rounding differences in this table
Page 42
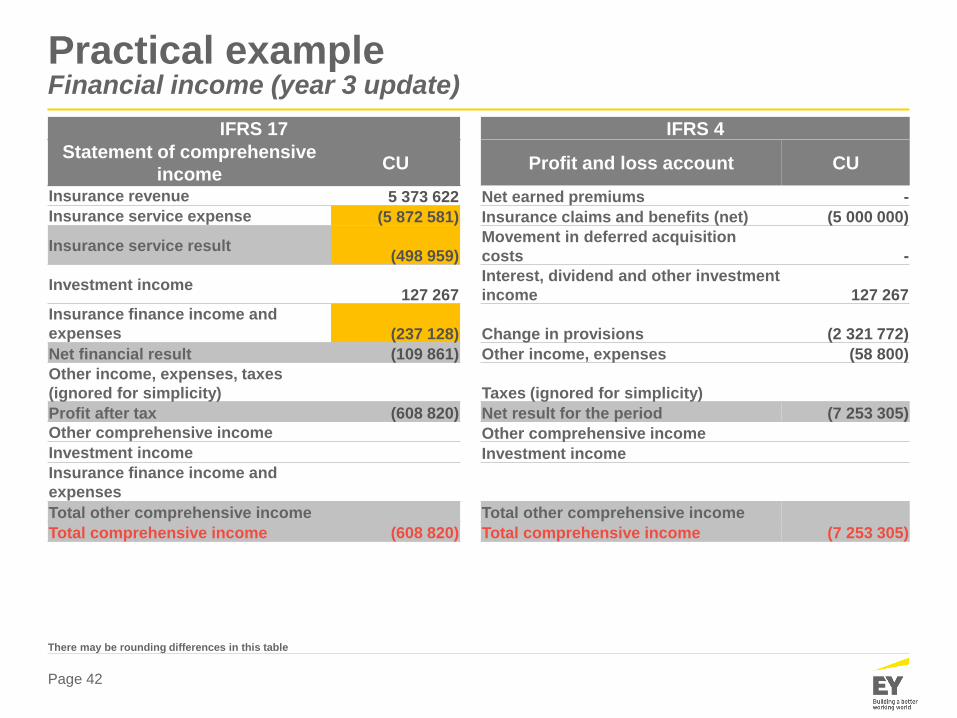
Practical exampleFinancial income (year 3 update)
IFRS 17 IFRS 4
Statement of comprehensive
incomeCU Profit and loss account CU
Insurance revenue 5 373 622 Net earned premiums -
Insurance service expense (5 872 581) Insurance claims and benefits (net) (5 000 000)
Insurance service result(498 959)
Movement in deferred acquisition
costs -
Investment income127 267
Interest, dividend and other investment
income 127 267
Insurance finance income and
expenses (237 128) Change in provisions (2 321 772)
Net financial result (109 861) Other income, expenses (58 800)
Other income, expenses, taxes
(ignored for simplicity) Taxes (ignored for simplicity)
Profit after tax (608 820) Net result for the period (7 253 305)
Other comprehensive income Other comprehensive income
Investment income Investment income
Insurance finance income and
expenses
Total other comprehensive income Total other comprehensive income
Total comprehensive income (608 820) Total comprehensive income (7 253 305)
There may be rounding differences in this table
Page 43
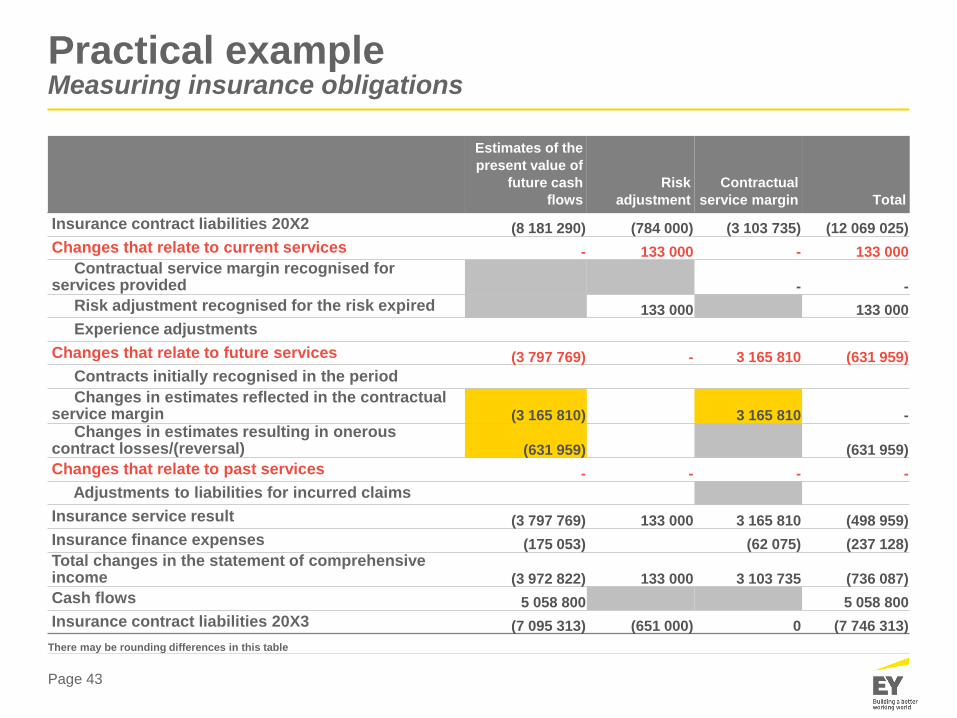
Practical exampleMeasuring insurance obligations
Estimates of the
present value of
future cash
flows
Risk
adjustment
Contractual
service margin Total
Insurance contract liabilities 20X2 (8 181 290) (784 000) (3 103 735) (12 069 025)
Changes that relate to current services - 133 000 - 133 000 Contractual service margin recognised for
services provided - -
Risk adjustment recognised for the risk expired 133 000 133 000
Experience adjustments
Changes that relate to future services (3 797 769) - 3 165 810 (631 959)
Contracts initially recognised in the period
Changes in estimates reflected in the contractual service margin (3 165 810) 3 165 810 -
Changes in estimates resulting in onerous contract losses/(reversal) (631 959) (631 959)
Changes that relate to past services - - - -
Adjustments to liabilities for incurred claims
Insurance service result (3 797 769) 133 000 3 165 810 (498 959)
Insurance finance expenses (175 053) (62 075) (237 128)Total changes in the statement of comprehensive income (3 972 822) 133 000 3 103 735 (736 087)
Cash flows 5 058 800 5 058 800
Insurance contract liabilities 20X3 (7 095 313) (651 000) 0 (7 746 313)
There may be rounding differences in this table
Page 44
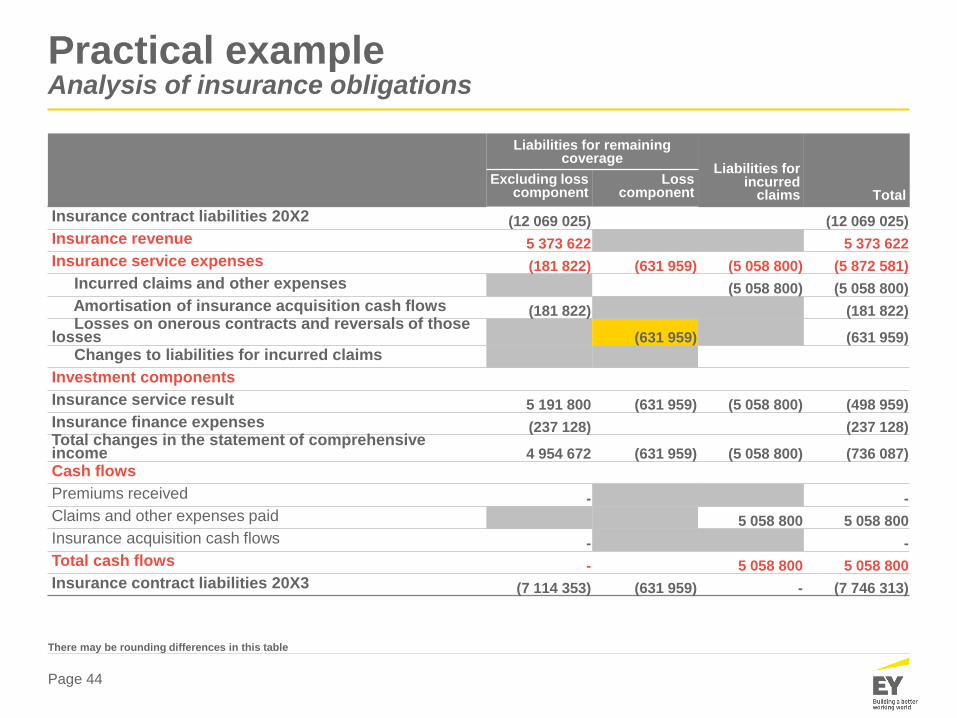
Practical exampleAnalysis of insurance obligations
Liabilities for remaining coverage
Liabilities for incurred
claims TotalExcluding loss
componentLoss
component
Insurance contract liabilities 20X2 (12 069 025) (12 069 025)
Insurance revenue 5 373 622 5 373 622
Insurance service expenses (181 822) (631 959) (5 058 800) (5 872 581)
Incurred claims and other expenses (5 058 800) (5 058 800)
Amortisation of insurance acquisition cash flows (181 822) (181 822)Losses on onerous contracts and reversals of those
losses (631 959) (631 959)
Changes to liabilities for incurred claims
Investment components
Insurance service result 5 191 800 (631 959) (5 058 800) (498 959)
Insurance finance expenses (237 128) (237 128)Total changes in the statement of comprehensive income 4 954 672 (631 959) (5 058 800) (736 087)
Cash flows
Premiums received - -
Claims and other expenses paid 5 058 800 5 058 800
Insurance acquisition cash flows - -
Total cash flows - 5 058 800 5 058 800
Insurance contract liabilities 20X3 (7 114 353) (631 959) - (7 746 313)
There may be rounding differences in this table
Page 45
Practical exampleKey take aways
► Changes in current period directly in P&L (same as now)
► Changes in future financial assumptions immediately in
P&L (before it happens)
► Changes in future operating assumptions impact CSM
and then indirectly P&L (proportionally to relative release
of CSM in current period)
► ….till there is still CSM… when CSM is fully released then
immediate loss in P&L with explicit monitoring in financial
statements
Agenda
1. Quick overview
2. (R)Evolution in insurance accounting
• Actuarial models
• New reporting requirements
• Systems and architecture
3. Practical example comparing IFRS 4 and IFRS 17
4. Summary
Page 47
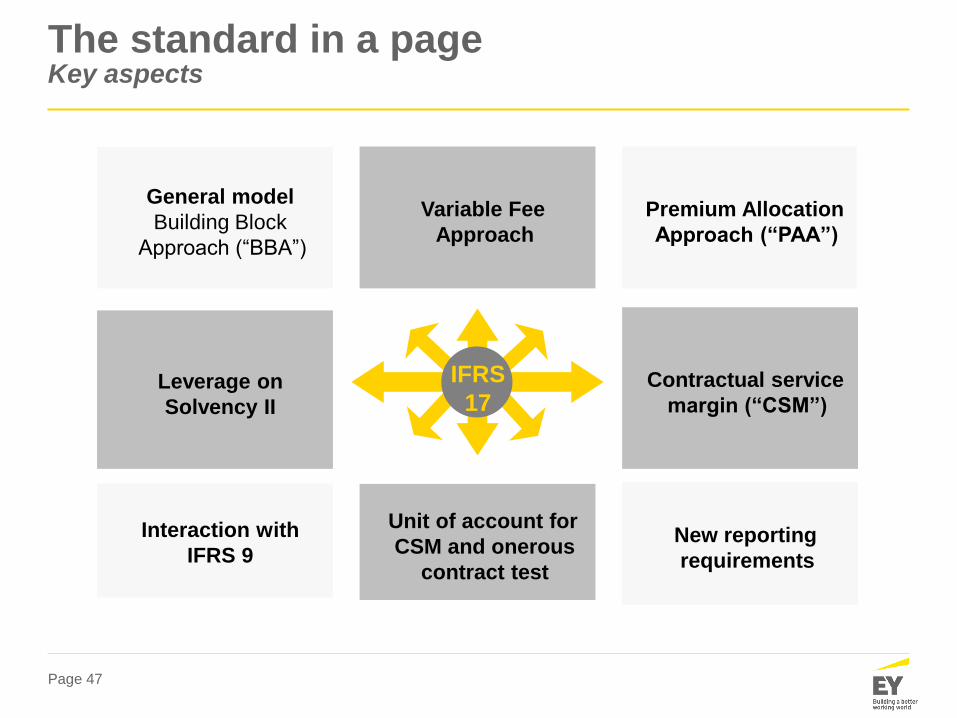
The standard in a pageKey aspects
Variable Fee
Approach
Contractual service
margin (“CSM”)Leverage on
Solvency II
Unit of account for
CSM and onerous
contract test
General model
Building Block
Approach (“BBA”)
Interaction with
IFRS 9New reporting
requirements
Premium Allocation
Approach (“PAA”)
IFRS
17
Page 48
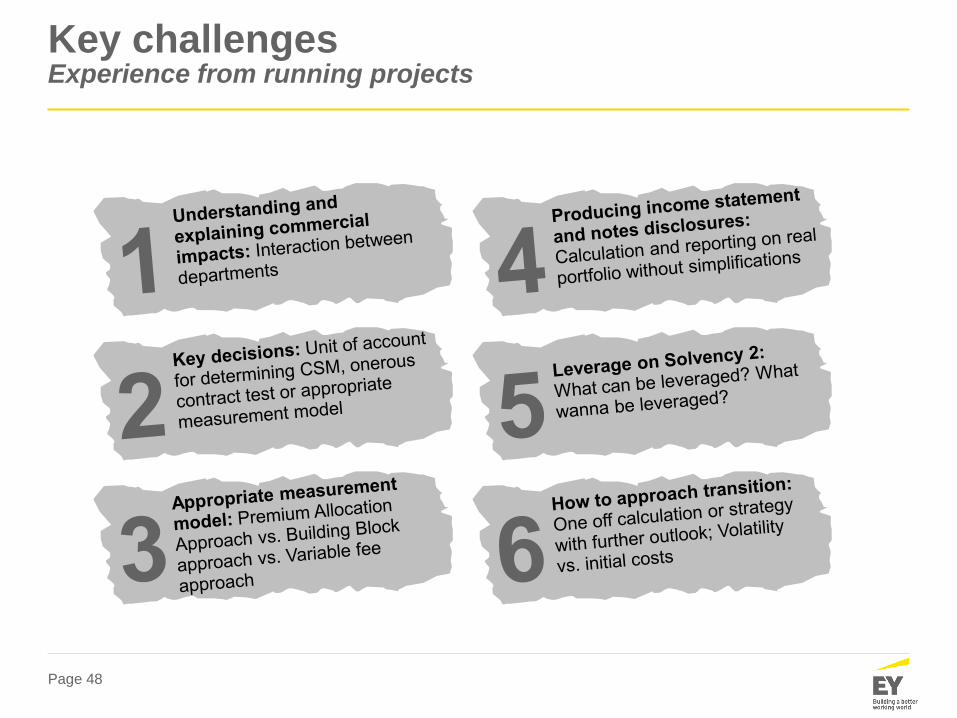
Key challengesExperience from running projects

Page 49
Summary
► It’s there
► Don’t be afraid of it
► Get the strategic decisions
right and build those
finance/actuarial communities
► Start playing early to get the
right balance sheet at outset
► There is potential for more
volatility and complexity –
and there is a balance
between the two
► 2021 seems a long way into
the future, but insurers will
need all the time to prepare
Page 50
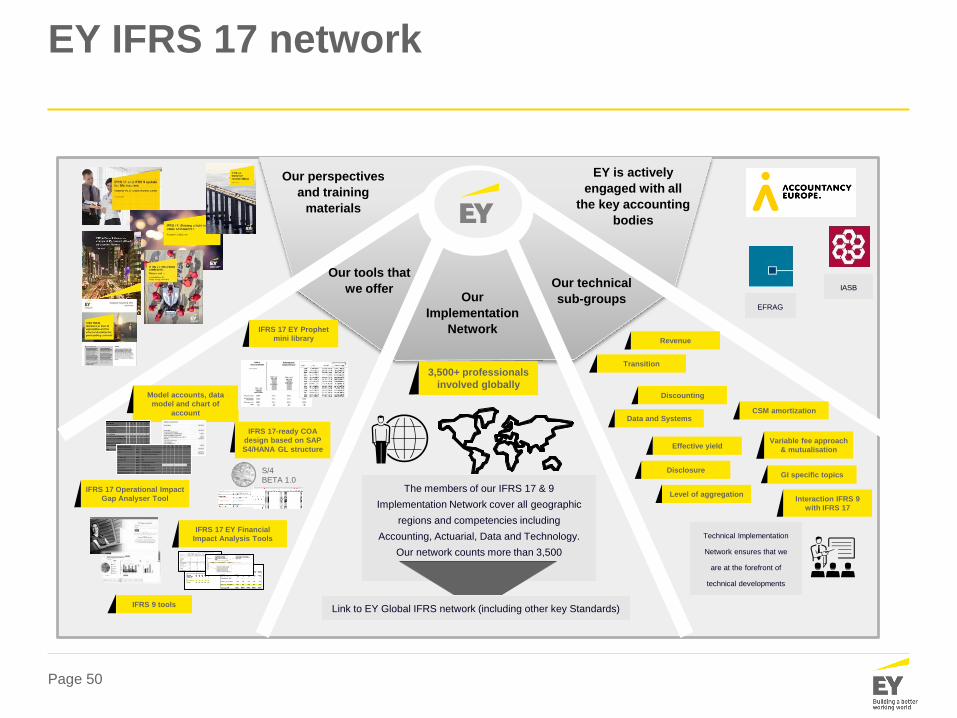
EY IFRS 17 network
Our perspectives
and training
materials
Our tools that
we offerOur
Implementation
Network
Our technical
sub-groups
EY is actively
engaged with all
the key accounting
bodies
Model accounts, data
model and chart of
account
IFRS 17 Operational Impact
Gap Analyser Tool
IFRS 17-ready COA
design based on SAP
S4/HANA GL structure
IFRS 17 EY Prophet
mini library
3,500+ professionals
involved globallyDiscounting
Effective yield
GI specific topics
Transition
Variable fee approach
& mutualisation
CSM amortization
Level of aggregation
Revenue
The members of our IFRS 17 & 9
Implementation Network cover all geographic
regions and competencies including
Accounting, Actuarial, Data and Technology.
Our network counts more than 3,500
professionals
Link to EY Global IFRS network (including other key Standards)
IASB
EFRAG
IFRS 9 tools
Technical Implementation
Network ensures that we
are at the forefront of
technical developments
S/4
BETA 1.0
IFRS 17 EY Financial
Impact Analysis Tools
Data and Systems
Disclosure
Interaction IFRS 9
with IFRS 17

Page 51
Q& A
Final Q&As

Thank you for your attention!