what can you see?. message of the day: there is often more information that can be measured than is...
Post on 22-Dec-2015
218 views
TRANSCRIPT
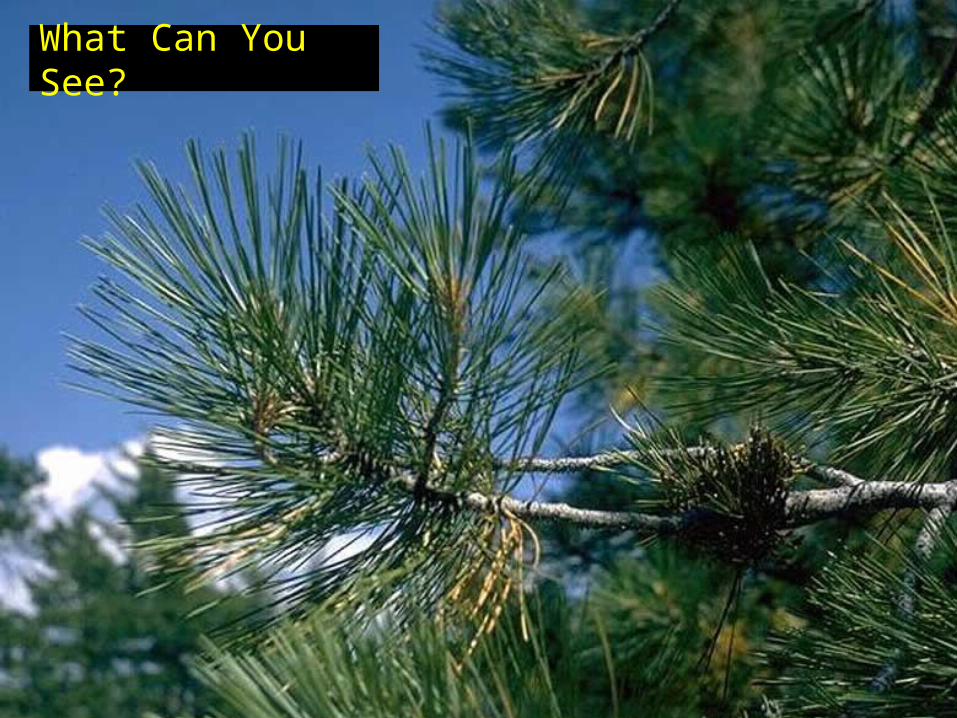
What Can You See?

What Can You See?

Message of the Day: There is often more information that can be measured than is apparent at first glance
What Can You See?

FOR 274: Forest Measurements and Inventory
Lecture 1
Class Overview
• Who We Are
• What We Need
• Why Are We Here
• Course Outline
• Expectations

By the end of this course you should be able to Accurately and Efficiently complete any natural resource measurement field sheet.
Course Goals: Field Sheets, Cruising, and Stand Exams

Before We Begin: Essential Equipment
• Hard Hat
• Loggers Tape
• Compass
• Thinking Cap
In this class you are required to wear your hardhat at all times when we are in a forest.

Essential Equipment: What You Will Need by Sept 1Bullard Wildland Fire Fighters’ Helmet with “ratchet support” 24604
Forestry Suppliers: $43.95 each
Silva Ranger Compass: Must be Azimuth (0-360) model with “Declination Screw” 37036
Forestry Suppliers: $46.95 each
Spencer Loggers Tape: Must be a “Combination” Tape with both Linear Distance and DBH on reverse 39405
Forestry Suppliers (100’/120”): $75.95 each

For Each Section:
Lectures: MWF 10:30 – 11:20 TLC 23
Section 1 Lab:
Lab – Thurs 1:30 - 4:20 CNR 25
Section 2 Lab:
Lab – Fri 1:30 - 4:20 CNR 25
Lecture 1: Course Format and Expectations

Labs will start *outside* and end in CNR 25
- Labs mostly meet at Gold Fire Hydrant beside Old Arboretum
Field Trips at Blodget Tract:
August 26th/27th Species ID Field Trip
October 14th/15th Tree Age Field Trip
November 4th/5th Stand Exam
Meet at Gold Parking Lot beside Power Plant
Lecture 1: Lab Sessions

Lecture 1: A Note on Tutorials
There are weekly assignments. We encourage you to work in groups to solve the questions
The Friday Tutorial is your time to ask questions or make comments about problems or any other aspect of the class

Lecture 1: A Note on Lectures & the Textbook
Lectures are only a Guideline
Course Website:
http://www.cnr.uidaho.edu/for274new/
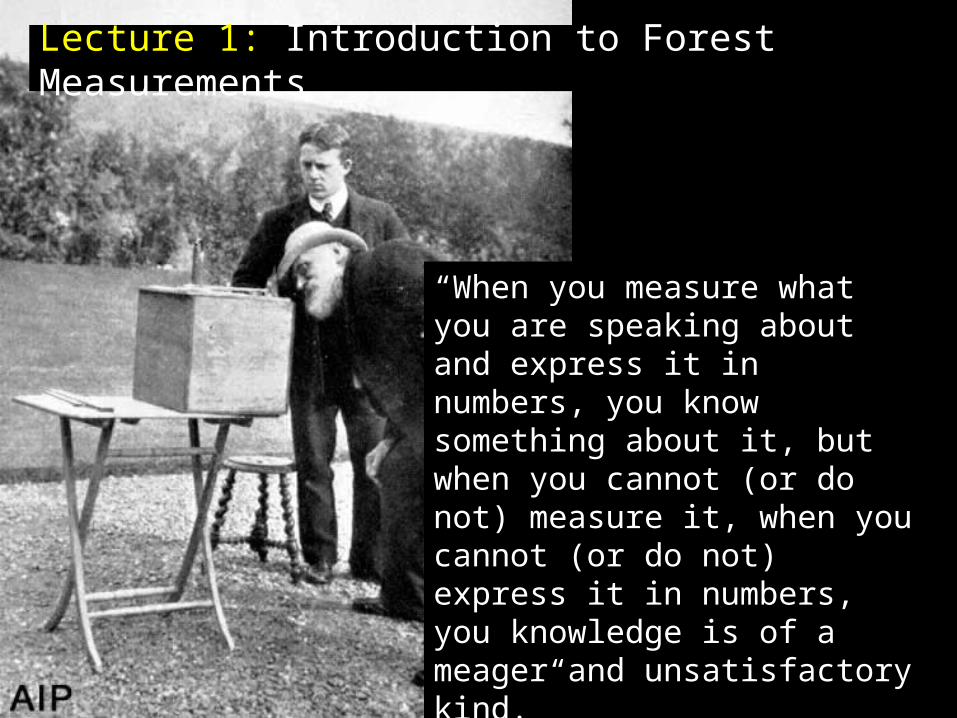
“When you measure what you are speaking about and express it in numbers, you know something about it, but when you cannot (or do not) measure it, when you cannot (or do not) express it in numbers, you knowledge is of a meager and unsatisfactory kind.”
Lord Kelvin
Lecture 1: Introduction to Forest Measurements
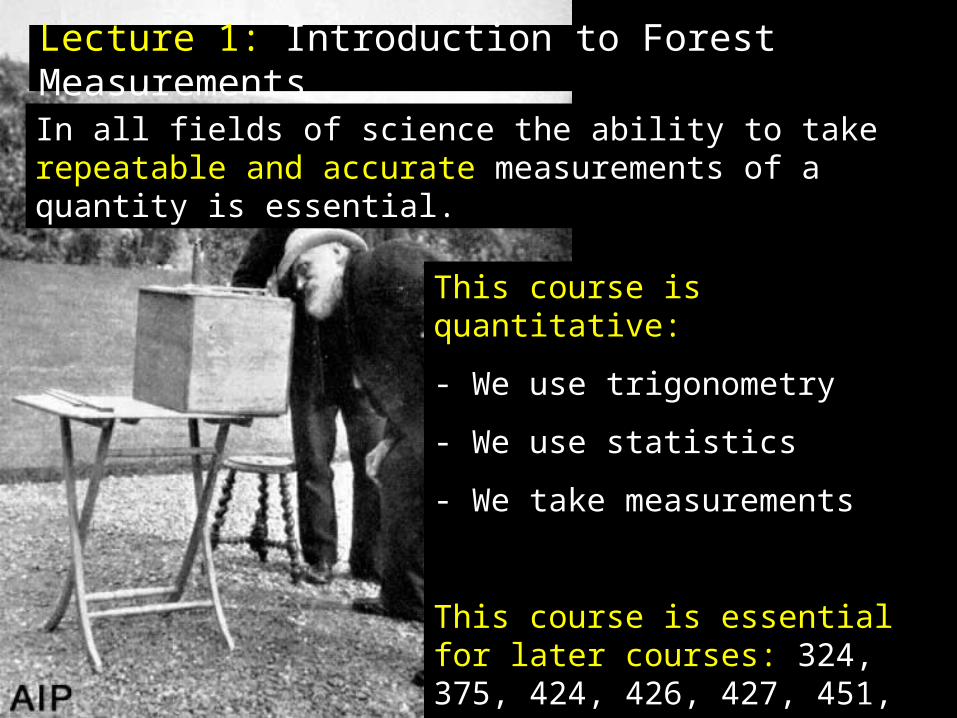
In all fields of science the ability to take repeatable and accurate measurements of a quantity is essential.
Lecture 1: Introduction to Forest Measurements
This course is quantitative:
- We use trigonometry
- We use statistics
- We take measurements
This course is essential for later courses: 324, 375, 424, 426, 427, 451, 435, 474, etc
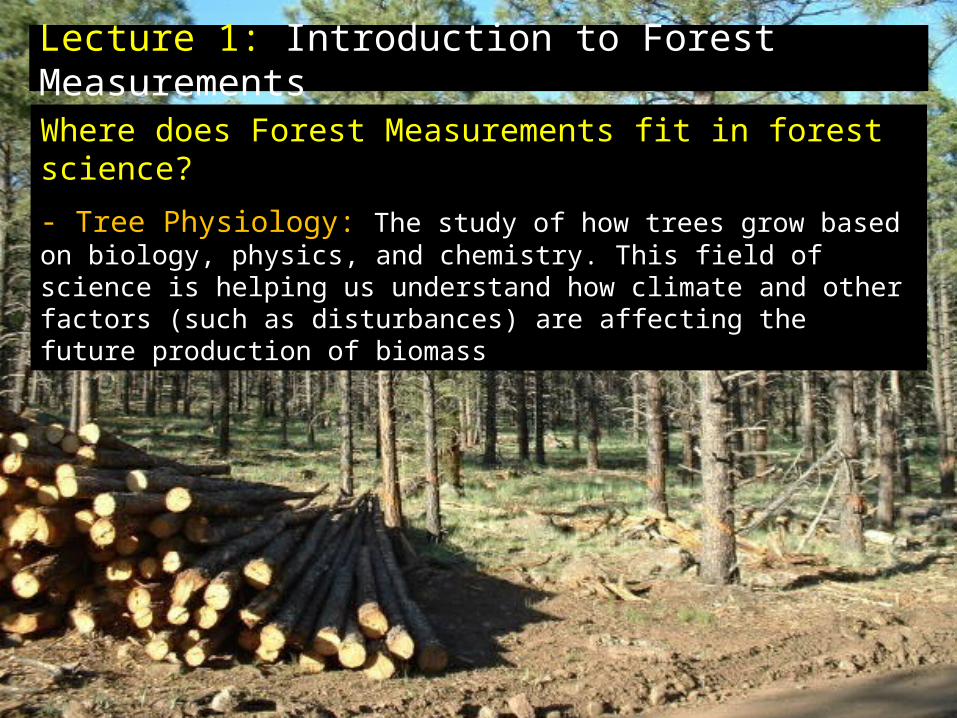
Lecture 1: Introduction to Forest MeasurementsWhere does Forest Measurements fit in forest science?
- Tree Physiology: The study of how trees grow based on biology, physics, and chemistry. This field of science is helping us understand how climate and other factors (such as disturbances) are affecting the future production of biomass
Lecture 1: Introduction to Forest MeasurementsWhere does Forest Measurements fit in forest science?
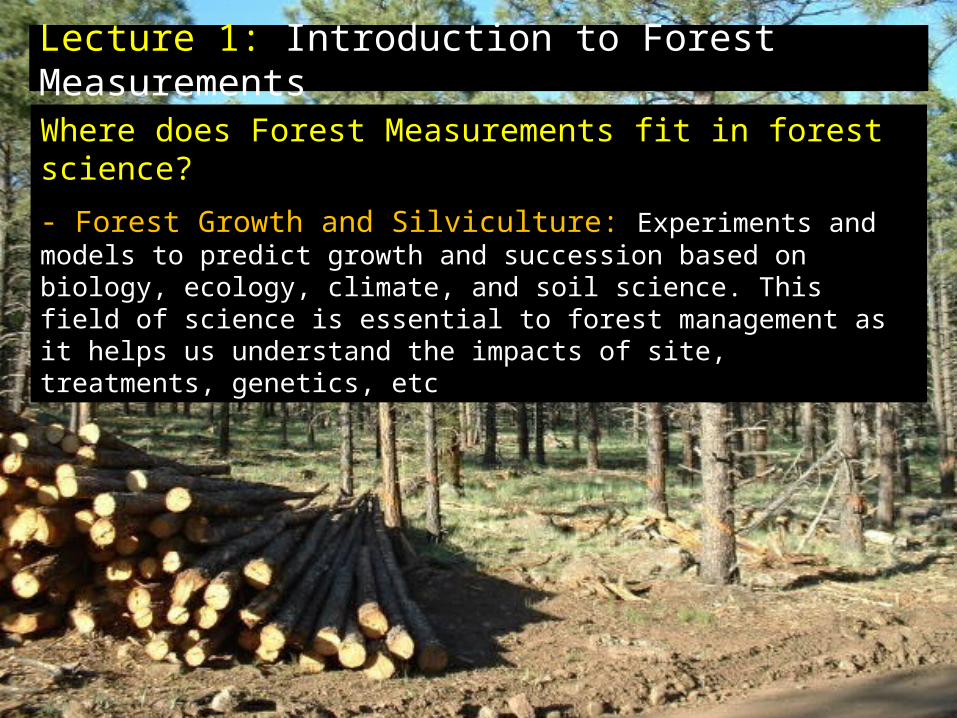
- Forest Growth and Silviculture: Experiments and models to predict growth and succession based on biology, ecology, climate, and soil science. This field of science is essential to forest management as it helps us understand the impacts of site, treatments, genetics, etc

Lecture 1: Introduction to Forest MeasurementsWhere does Forest Measurements fit in forest science?
- Forest Inventory: Management and Research to quantify how much resources is currently present in a forest. These resources could be timber volume, water and water quality, carbon sequestration, wildlife habitats, etc. This area of research often includes the analysis of aerial photography and more recently laser altimetry data.
Forest Measurements is critical to these studies
It provides the instrument know-how and the quantitative understanding of both growth models and the statistics used to analyze these datasets.

“Forest measurements deals with the study of the volume of logs, trees, and stands, and with the study of increment and yield.”
Henry S Graves (1906)
Lecture 1: Introduction to Forest Measurements
Quantifying current and future biomass at multiple scales is essential for the management of wild land areas

Lecture 1: Introduction to Forest Measurements
Managers are faced with many decisions:
What treatments to use, When to thin and when to burn, What is the value of a potential sale, what are the potentials for recreation, wildlife, carbon storage, etc
Information is needed to answer such questions:
This information should be quantitative and have the same meaning in other environments and to other people
Forest measurements provide managers with quantitative data to enable reliable (and defensible) decision making
Husch, Beers, and Kershaw

Ponderosa Pine Logging
Left: Brian Geils (1962)
Different Management Objectives:
Forest Inventory of Merchantable Timber
Lecture 1: Introduction to Forest Measurements
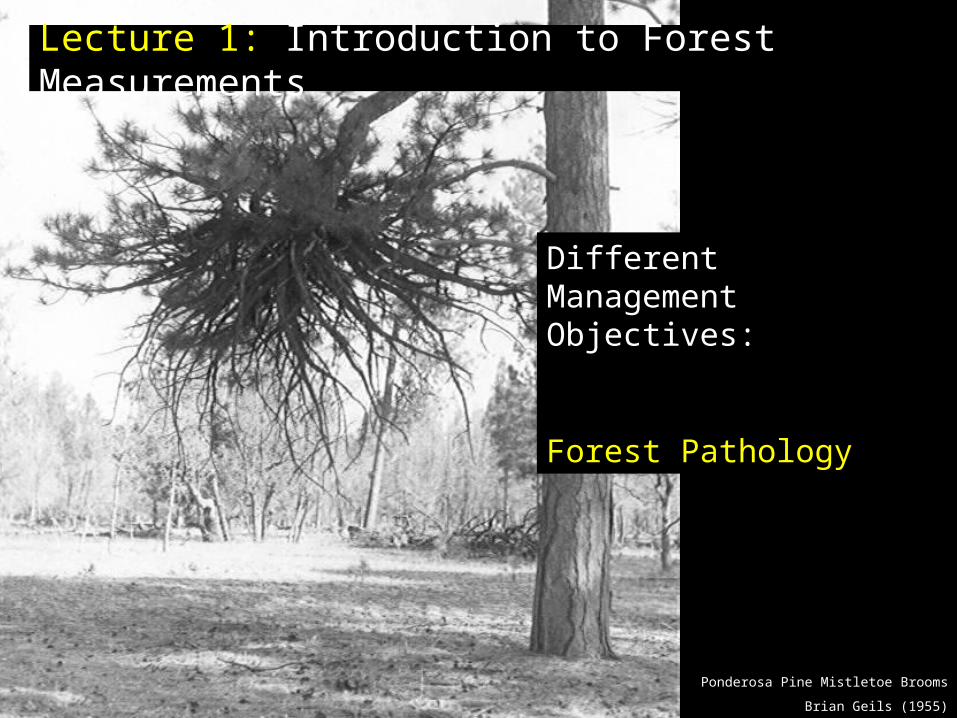
Different Management Objectives:
Forest Pathology
Lecture 1: Introduction to Forest Measurements
Ponderosa Pine Mistletoe Brooms
Brian Geils (1955)
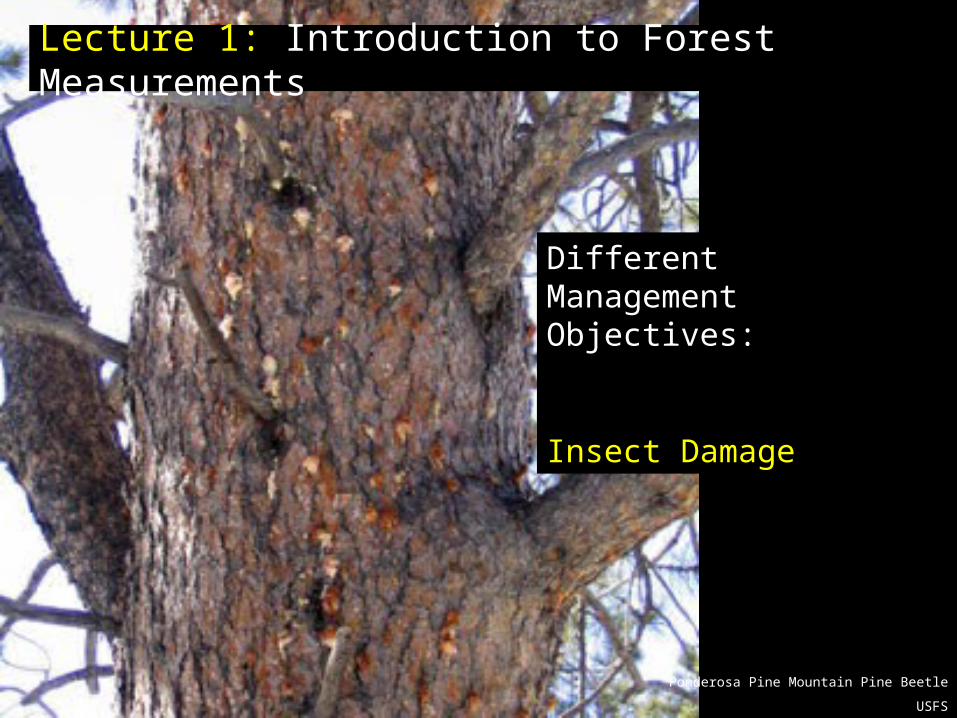
Different Management Objectives:
Insect Damage
Lecture 1: Introduction to Forest Measurements
Ponderosa Pine Mountain Pine Beetle
USFS

Different Management Objectives:
Fires and Fuels
Lecture 1: Introduction to Forest Measurements
Regeneration (Rodeo-Chediski Fire)
USFS – Flagstaff Office
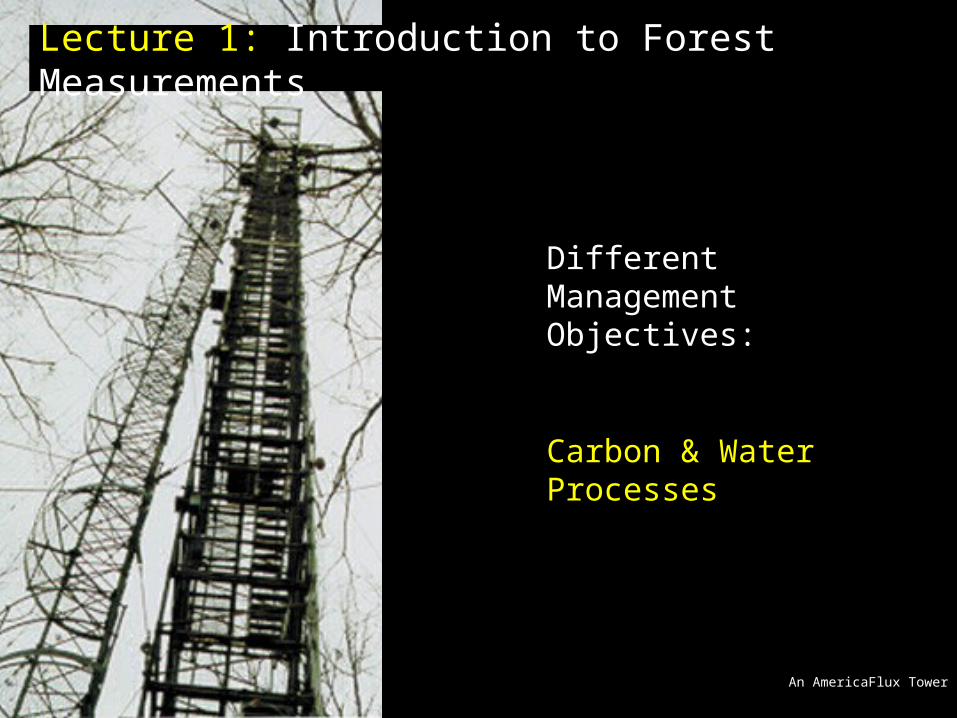
An AmericaFlux Tower
Different Management Objectives:
Carbon & Water Processes
Lecture 1: Introduction to Forest Measurements
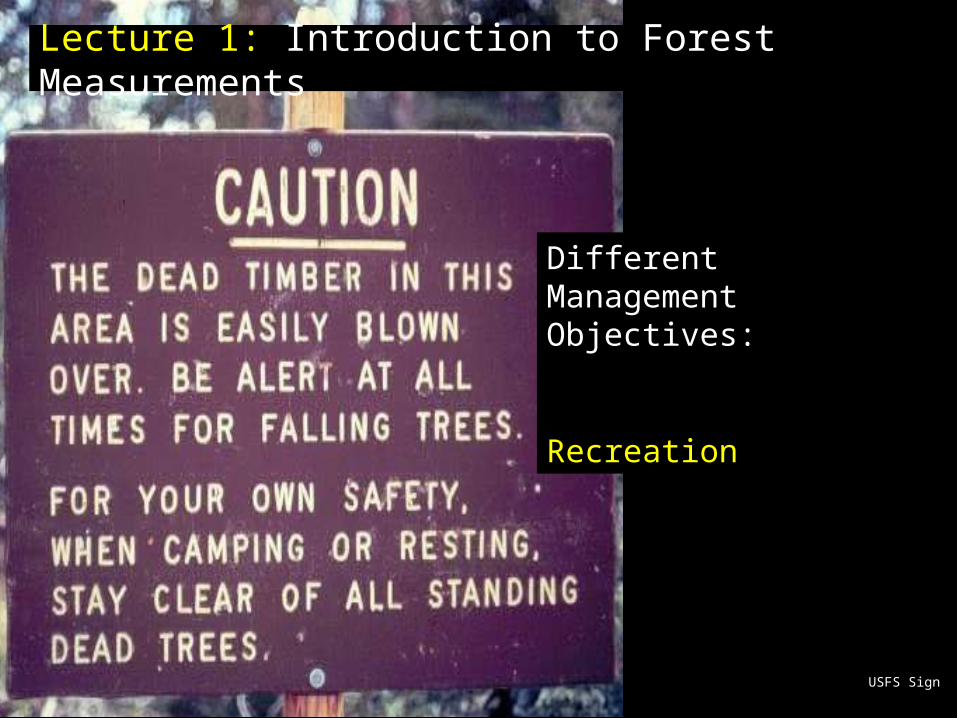
USFS Sign
Different Management Objectives:
Recreation
Lecture 1: Introduction to Forest Measurements

Saw-whet owl by Virgil Scott (1977)
Different Management Objectives:
Wildlife
Lecture 1: Introduction to Forest Measurements

Ponderosa Pine Logging
Left: Brian Geils (1962)
Main Historical Milestones:
•Hennet (1791) developed tree volume relations based on the amount of water displaced by timber
•Paulsen (1795) developed the first growth and yield tables
•Cotta (1804) invented the caliper and constructed the first volume tables
•Bitterlich (1948) developed the angle count concept to estimate basal area per hectare
•Bickford (1963) developed a sampling schema that used aerial photography with stand data
•Nelson (1984) was one of the first researchers to use Lidar to evaluate forest canopy and biomass
•Falkowski (2009) developed methods to map forest successional stage with Lidar
Forest Measurements is Continually Changing

“The continued need for forestry personnel with imagination and inventiveness is clearly apparent”
Avery and Burkhart
“Imagination is more important than knowledge: Knowledge is limited, Imagination encircles the world.”
Albert Einstein
Forest Measurements is Continually Changing