what determines product ramp-up performance? : a review of ... · what determines product ramp-up...
TRANSCRIPT
What determines product ramp-up performance? : areview of characteristics based on a case study at NokiaMobile PhonesCitation for published version (APA):Pufall, A. A., Fransoo, J. C., & Kok, de, A. G. (2007). What determines product ramp-up performance? : a reviewof characteristics based on a case study at Nokia Mobile Phones. (BETA publicatie : working papers; Vol. 228).Eindhoven: Technische Universiteit Eindhoven.
Document status and date:Published: 01/01/2007
Document Version:Publisher’s PDF, also known as Version of Record (includes final page, issue and volume numbers)
Please check the document version of this publication:
• A submitted manuscript is the version of the article upon submission and before peer-review. There can beimportant differences between the submitted version and the official published version of record. Peopleinterested in the research are advised to contact the author for the final version of the publication, or visit theDOI to the publisher's website.• The final author version and the galley proof are versions of the publication after peer review.• The final published version features the final layout of the paper including the volume, issue and pagenumbers.Link to publication
General rightsCopyright and moral rights for the publications made accessible in the public portal are retained by the authors and/or other copyright ownersand it is a condition of accessing publications that users recognise and abide by the legal requirements associated with these rights.
• Users may download and print one copy of any publication from the public portal for the purpose of private study or research. • You may not further distribute the material or use it for any profit-making activity or commercial gain • You may freely distribute the URL identifying the publication in the public portal.
If the publication is distributed under the terms of Article 25fa of the Dutch Copyright Act, indicated by the “Taverne” license above, pleasefollow below link for the End User Agreement:
www.tue.nl/taverne
Take down policyIf you believe that this document breaches copyright please contact us at:
providing details and we will investigate your claim.
Download date: 17. Jan. 2020
What determines product ramp-up performance?
A review of characteristics based on a case study at Nokia Mobile Phones
Andreas Pufall1,2, Jan C. Fransoo2, A. G. (Ton) de Kok2
[email protected]; [email protected]; [email protected]
1 Nokia GmbH
Product Creation Center Ulm
P.O. Box 2907
D-89081 Ulm
Germany
2 Technische Universiteit Eindhoven
Department of Technology Management
P.O. Box 513
NL-5600 MB Eindhoven
Netherlands
2
Abstract We present a conceptual model to explore the essential characteristics that affect product
ramp-up performance in the consumer electronics industry, specifically in the mobile phones
sector. Our findings are based on data analysis within Nokia’s mobile phones business group.
Fast product ramp-ups are particularly critical for companies in which short product lifecycles
prevail and in which development teams are required to work on new development projects
than spending time with ramp-up support. Our model analyzes, extends and structures the
results from other studies into five main characteristics: the product architecture, the product
development process, the logistics system, the manufacturing capability and the external
environment. We discuss the factors that describe and represent these five main
characteristics on a quantitative basis and assess the impact of these characteristics on
ramp-up performance with different measures in the model.
1 Introduction New product development is a challenge because several uncontrollable forces have
emerged over the last decades putting companies that develop and launch new products in
the high-technology sector under enormous pressure. Some of the most relevant forces are
growing global competition, fragmented markets with sophisticated customers, technological
changes and shrinking product life cycles (Gupta et al., 1990; Clark and Fujimoto, 1991;
Pisano, 1995; Mallick and Schroeder, 2005).
Competition on the global market has always been fierce as new players are continuously
entering the market. In the 1990s, only a handful of mobile device suppliers existed.
Nowadays, there are around 100 in China alone. Together with the decreasing brand
preference this is becoming a major problem for the top ten mobile device suppliers in the
world. In addition, these small players are often more reactive to market trends and very
competitive in price.
Fragmented markets and sophisticated customers are the result of individualism and
accumulated experience. This has sensitized customers to choose products for reasons that
are not related to technical performance but to the fulfillment of their needs. As a result,
companies have to leave the „one size fits all “strategy and provide products for different
customer segments in diverse markets.

3
Technology changes might be the major driving force for high-technology companies. This
evolves from the potential impact of new technologies on current business models. New
internet services like VoIP (voice over internet protocol = phone calls via the internet), short
range communication services like WLAN (wireless local area networks) or GPS (global
positioning systems) can impact the value chain of telecommunication companies or enable
other players to gain a stake in it.
Shrinking product lifecycles are another challenge for high-technology industries, because
market windows and product lifecycles are decreasing in length, while technology
investments are rising. Competitor products are also gaining importance. Companies must
therefore shorten their development time (time to market) but also focus on the time it takes
to reach full production volume (time to volume) in order to maintain high profitability. Early
entrants to the market will enjoy higher profit margins and longer product life cycles, and
can thus establish a dominant market position (Smith and Reinertsen, 1998). House and
Price (1991) show that a product that is on budget, but introduced late to the market could
miss one-third of the potential life cycle profit. Being on time but 50% overspent cuts the
profit by only 4%.
With this background the economic success of manufacturing firms depends on their ability
to identify the needs of customers and to quickly create products that will meet these needs
and that can be produced at low cost (Ulrich and Eppinger, 1995). In spite of significant
progress in new product development techniques such as concurrent engineering or design
for manufacturing, the ramp-up phase remains a major challenge and provides a significant
opportunity for gaining competitive advantage in high-technology firms. To be more precise
about the terminology of product ramp-up, Wheelwright and Clark (1992) have created a
useful and comprehensive definition: “In ramp-up the firm starts commercial production at a
relatively low level of volume; as the organization develops confidence in its (and its
suppliers) abilities to execute production consistently and marketing’s abilities to sell the
product, the volume increases. At the conclusion of the ramp-up phase, the production
system has achieved its target levels of volume, cost and quality.”
However, reality shows that the attained levels of volume, cost and quality are falling behind
the planned targets. Studies carried out by Schuh et al. (2005) show that 47% of new
product ramp-ups in the automobile industry were neither technically nor economically
successful. In their studies on fast ramp-up, authors like Kuhn et al. (2002) state that not a
single company claimed to have their production ramp-up under control. Research in the

4
global automobile industry by Clark and Fujimoto (1991) has shown that there are significant
regional differences between the companies. Some companies achieve full-scale production
six months later than others. This conflict between low capacity and high demand, that is
putting a company under pressure from two sides, is referred to as the “nutcracker” effect
(McIvor et al., 1997).
The phenomena that make up the nutcracker effect were basically the trigger for this paper
as the lack of understanding in this area seems to result from the fact that most of the
current improvement activities are phase specific. They cover either product development or
mass-production but ignore the link – the ramp-up phase. However, there are considerable
business benefits if new product ramp-ups successfully overcome the nutcracker effect. In
2006, the mobile phones business unit of Nokia introduced 39 new products and it is likely
that there will be even more product launches in 2007. If the velocity of change in an
external business environment sets the pace for a firm’s internal rate of new product
introductions, it is called a fast clockspeed industry (Fine, 1998). Inspired by fruit flies, Fine
(1998) developed an insightful interpretation of the ways product design, process technology
and supply chains define the evolutionary course of a company. Fruit flies, as a result of their
short lifecycle, must genetically respond to changes in their environment quickly or face
extinction. As a consequence, companies like Nokia, operating in a fast clockspeed
environment have to continuously assess industrial and technological dynamics in order to
exploit current opportunities and anticipate future ones. Clockspeed in the area of product
ramp-ups is therefore a precondition as it supports the opening up of current opportunities
by dynamically positioning products or innovations in the market place. As a result this paper
aims to understand the critical characteristics that are influencing (in a positive or negative
way) the product ramp-up in order to manage them more effectively, to assess the risk level
more thoroughly and to be able to make better decisions in the development phase of the
product. Faster ramp-ups can also free up resources in the development or manufacturing
area and allow them to support new projects or other value adding activities.
2 Literature review The purpose of this section is to establish the legitimacy of our study and to position the
research problem within the existing body of knowledge. The review will compare and
contrast the research problem with the existing theories structured by the industry
environment, the research methodology and the lifecycle phase (product development,
ramp-up, volume production).
5
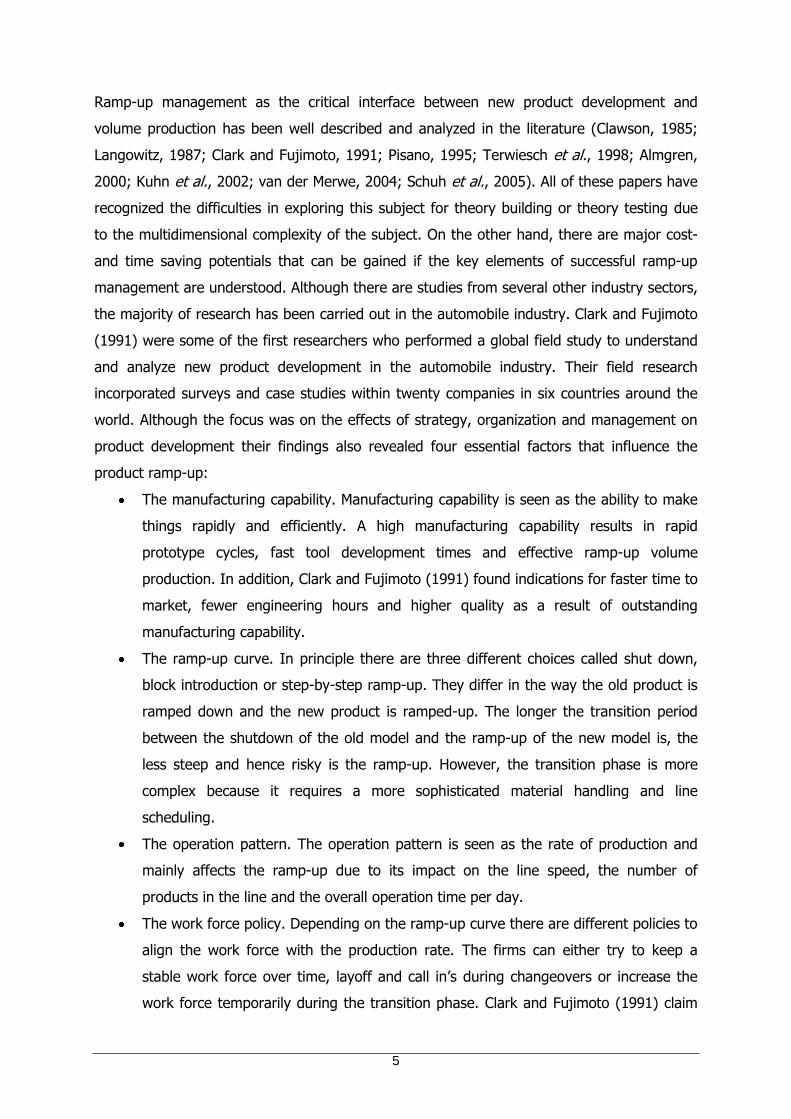
Ramp-up management as the critical interface between new product development and
volume production has been well described and analyzed in the literature (Clawson, 1985;
Langowitz, 1987; Clark and Fujimoto, 1991; Pisano, 1995; Terwiesch et al., 1998; Almgren,
2000; Kuhn et al., 2002; van der Merwe, 2004; Schuh et al., 2005). All of these papers have
recognized the difficulties in exploring this subject for theory building or theory testing due
to the multidimensional complexity of the subject. On the other hand, there are major cost-
and time saving potentials that can be gained if the key elements of successful ramp-up
management are understood. Although there are studies from several other industry sectors,
the majority of research has been carried out in the automobile industry. Clark and Fujimoto
(1991) were some of the first researchers who performed a global field study to understand
and analyze new product development in the automobile industry. Their field research
incorporated surveys and case studies within twenty companies in six countries around the
world. Although the focus was on the effects of strategy, organization and management on
product development their findings also revealed four essential factors that influence the
product ramp-up:
The manufacturing capability. Manufacturing capability is seen as the ability to make
things rapidly and efficiently. A high manufacturing capability results in rapid
prototype cycles, fast tool development times and effective ramp-up volume
production. In addition, Clark and Fujimoto (1991) found indications for faster time to
market, fewer engineering hours and higher quality as a result of outstanding
manufacturing capability.
The ramp-up curve. In principle there are three different choices called shut down,
block introduction or step-by-step ramp-up. They differ in the way the old product is
ramped down and the new product is ramped-up. The longer the transition period
between the shutdown of the old model and the ramp-up of the new model is, the
less steep and hence risky is the ramp-up. However, the transition phase is more
complex because it requires a more sophisticated material handling and line
scheduling.
The operation pattern. The operation pattern is seen as the rate of production and
mainly affects the ramp-up due to its impact on the line speed, the number of
products in the line and the overall operation time per day.
The work force policy. Depending on the ramp-up curve there are different policies to
align the work force with the production rate. The firms can either try to keep a
stable work force over time, layoff and call in’s during changeovers or increase the
work force temporarily during the transition phase. Clark and Fujimoto (1991) claim
6
that the rate of learning and hence performance tends to be higher if the working
conditions and task assignments are stable.
Although the prime purpose of this study was to find the relevant factors that make up
superior product development performance, Clark and Fujimoto (1991) present evidence that
product development performance is closely linked with successful ramp-up management.
This seems to explain why Japanese companies were more successful in timely product
launches than their European or American counterparts during the 1980s. However, the
findings are based on the prevailing concepts in the automobile industry during the 1980s
and can’t be generalized without considering the specific characteristics in other industries
today. The mobile device industry for example is characterized by far shorter development
times and life-cycles, different sales channels and different manufacturing/logistic concepts
that are the result of the size, price and volume differences.
Another large study in the area of ramp-up management was carried out by Kuhn et al.
(2002). The purpose was to perform a situation analysis in order to identify research
demands that yield to quantum leaps in the area of ramp-up management. Kuhn’s study
more directly addressed the area of ramp-up management compared to the study by Clark
and Fujimoto (1991) which was primarily focused on product development performance as a
whole. Using on-site studies, workshops and public discussions in three business lines such
as the automobile, electronics and engineering industry, Kuhn and his team identified the
factors that affect ramp-up performance and classified them into six categories.
These categories are:
Product development– the level of newness compared to existing products
Production processes – the degree of process robustness, flexibility and newness
Organization and personnel – the level of qualification and role clarity
Logistics - seen as the generic term for the availability and quality of parts and
subassemblies
Networks and cooperation – characterized by the information flow and information
transparency
Methods and tools – project management and change management practices
Based on these factors, five action areas for further research have been defined. They
incorporate the development of advanced methods to control the ramp-up complexity,
robust manufacturing systems, change management procedures, improved cooperation
models and holistic knowledge management. Comparable findings were documented by
7
Schuh et al. (2005) in their benchmarking project in the automobile industry. They refer to
the concept of complexity management which is the result of the multitude and dynamics of
interdependent objects and their interaction with different work functions. The objects are in
line with the ones identified by Kuhn et al. (2002) and the work functions are classified by
development, production, logistics and sourcing. However, neither of these two studies
include a more detailed analysis of the complex interactions of the identified factors with
regard to ramp-up performance. Their main ambition was to identify further improvement
potentials disregarding the need to understand the underlying phenomena during the
transition from the development phase to volume production within a certain industry. This
gap is partly filled by Nyhuis and Winkler (2004). Based on the work by Kuhn et al. (2002),
their target is to model the cause and effect relationships to simulate the impact of certain
influencing variables on the target key parameters. Supplemental to these contributions is
the work of Fleischer et al. (2003). They developed a simulation model that generates ramp-
up curves as the result of the interaction between several elementary processes whose
quality capability curves are known. However, there does not appear to be any paper that
verifies the models with industrial data and the focus is limited to time dynamic parameters
that have to be identified by explorative studies.
Similar results but with a more explorative character were found by Almgren (2000). He
analyzed the pilot production and the manufacturing start up process at the Volvo Car
Corporation in a longitudinal case study. He argues that the number and the frequency of
disturbances during the start-up period overload the organization and result in a loss of
production capacity or increased production load. He categorized the existing types of
disturbances in terms of their sources, namely:
Product concept – disturbance arising from the number of engineering changes
Material flow – the quality, status and quantity of materials
Production technology – capacity, availability and performance of equipment
Work organization – the skill level, work performance and attendance
Priority wise, Almgren found that the most common type of disturbance in his study was the
inability of the suppliers to deliver materials of the right status in the right quantity on time.
There is a direct correspondence between Almgren’s categories and the factors identified by
Kuhn et al. (2002) except for some higher level concepts that exhibit the difference of the
focus between the studies. In addition, Almgren identified also some moderating variables
that positively affect the final verification process. Among those factors are the development
of a temporary organization to support the ramp-up process and the principle of full speed.
This principle states that production systems should always be run at full speed in order to
8
advance the rate of learning and to provide the right amount and quality of information for
effective disturbance control.
A study that is more focused on the consumer electronics industry was carried out by
Terwiesch et al. (1999). The research objective was to gain a detailed understanding of the
production ramp-up process in a hard disk drive company. Using a longitudinal case study
approach, their finding revealed several organizational patterns that seem to shorten a
products ramp-up period. First, a soft handover from pilot production to volume production
gradually contributes to better performance. Second, clear organizational responsibilities
together with a high commitment and cross functional interaction fostered a smoother
transition. And finally, the introduction of product platforms allows companies to leverage
previous ramp-up experience for the ramp-up of new products from the same platform.
These findings support and enhance the existing concepts but due to the explorative nature
of the study it does not provide a more detailed analysis of the relationship between product
development and production ramp-up. The study only considers the last three months of the
development phase thus neglecting the aspects of product conceptualization and
development. Another study by Terwiesch and Bohn (1998) analyzed the effect of learning
on ramp-up performance, described as capacity utilization and yield. The results of their
simulation highlight the importance of learning during ramp-up in order to achieve fast time-
to-volume compared with the still dominant paradigm of time-to-market. Not only the level
of learning is important but also the sources of learning (normal experience, experiments,
engineering time). Although the study has made strong simplifications of real world ramp-up
situations it provides useful insights into the effects of “yield first” or “speed first” policies.
A complementary study on the relationships between the product development process and
problems during the initial commercial manufacturing of a new project was carried out by
Langowitz (1987). She developed and tested a conceptual framework to explore the impact
of the development process, the product design and the manufacturing capability on the
initial commercial manufacturing period. This study should be seen as supportive rather than
conclusive for the existing frameworks as it was build on the interview data of 15 projects.
Although the study was performed in the late 80’s when the mobile device industry was still
in its infancy and the business environment at that time was partly different from the one
today the findings seem to be still valid. First, it is important how the development process is
managed - meaning how clear definitions and milestone criteria are defined. Second, an
atmosphere of high communication and cross-functional interaction leads to better results.
And finally, particularly in highly technical ambitious projects emphasis should be placed on
9
manufacturability in the design. Manufacturability is also stressed by Pisano and Wheelwright
(1995) who pursued a case study in the pharmaceutical industry. Their findings confirm the
importance of process development at an early stage of the development cycle as a way to
build a unique and sustainable competitive position. In addition, they found evidence that
manufacturing process innovation results in faster and more productive product launches
and even enhanced product functionalities.
Finally, there is a comprehensive study by van der Merwe (2004). He has developed a
conceptual framework that extends the concept of learning as a driver of ramp-up
performance with the concept of novelty, demonstrating that ramp-up performance is driven
by two kinds of learning activities which are in response to five dimensions of novelty. Those
novelty dimensions are product-, product mix-, process-, supplier- and personnel novelty.
The study provides strong empirical support for the association between different levels of
novelty and ramp-up performance. This framework provides a solid and tested high level
conceptual model, but it does not provide a quantitative relationship between the novelty
dimensions and ramp-up disturbances. In order to achieve the research aim, van der Merwe
used a combination of different case study approaches. First, a preliminary framework was
created on the results of six mini case studies. Second, two main case studies examining a
new platform introduction and a new production line introduction were used develop the
preliminary framework in further detail. Finally, the framework was stabilized by six
additional case studies. Although this study determined the elements of novelty that impact
the manufacturing ramp-up period, certain supplemental factors could not be included in the
model. This is a result of the case study methodology van der Merwe used, because it
prohibited him to get access to sensitive information like as cost or financial data.
As a conclusion of this literature study it can be said that previous studies agree about a
similar set of influential characteristics that affect ramp-up although they examined different
industries and used different research methodologies. The key elements are related to the
product architecture, the manufacturing capability and the human resource setup. Further
elements that seem to matter are the product development process, the material logistics,
the cooperation model and the applied tools.
3 Conceptual model and propositions The purpose of this section is to define and quantify the identified characteristics into more
detail and to elaborate the relationships between these characteristics so that a
comprehensive conceptual model can be generated. First, we propose to regroup the seven

10
identified characteristics that are described in the literature into the following five main
categories that provide the headers for the following sub-sections:
the product architecture
the manufacturing capability
the product development process
the logistics system
the external environment
This grouping aligns the identified characteristics with observations and experience from the
Nokia specific environment. Additionally, we believe that residual elements like the human
resource setup or the usage of tools are either applicable to all of the characteristics or just
sub-items of the main characteristics. The further structure of this section will be as follows:
We begin with the product architecture and introduce measures for product complexity,
newness and maturity. Afterwards we move on to the manufacturing capability characteristic
which we separate into growth and steady state capabilities in order to define appropriate
measures for it. The third characteristic that will be described and defined is the product
development process. We expand this characteristic into process performance and product
concept effectiveness in order to identify suitable measures. Next, we will characterize the
logistic system. Our measures for this characteristic are based on the global structure of the
Nokia logistic system and its interdependency to a logistic friendly product design. Finally, we
will group the characteristics that are not related to any other group - specifically the volume
plan and its forecast error - into the external environment category. Our aim is to select
factors that can be captured quantitatively by using company internal information systems.
This exhibits the strength and quantitative approach of this paper compared to other studies
in this area.
3.1 The product architecture The product architecture comprises all the functional and physical items that are needed to
fulfill the customer requirements. In more detail, the product architecture is the arrangement
of the functional elements of a product into physical blocks (Ulrich and Eppinger, 1995) or,
as defined by the PDMA (2006) the way in which the functional elements are assigned to the
physical chunks of a product and the way in which these physical chunks interact to perform
the overall function of the product. The product architecture normally starts to emerge
during the concept creation phase. It becomes more sophisticated during the development
phase by choosing key design variables, components, technologies and suppliers. The
literature suggests many elements, characteristics, dimensions and factors to describe and
define product architecture in exact terms. As most of the authors use similar dimensions we
11
propose to group the product architecture characteristics into complexity and newness
(Novak and Eppinger, 2001; Kaski, 2002; Tatikonda and Stock, 2003; Swink, 1999; Nyhuis
and Winkler, 2004; Ehrlenspiel, 1995).
Complexity can be defined with an information-based definition (considering the property of
a system depending on the description of the system by an observer) or with a structural-
based definition that describes complexity as a property of the object (Rodriguez-Toro,
2004). The structural-based definition is less subjective and easier to measure, therefore we
will use it with the following elements:
the number of product components
the extend of interaction and interdependence between these components
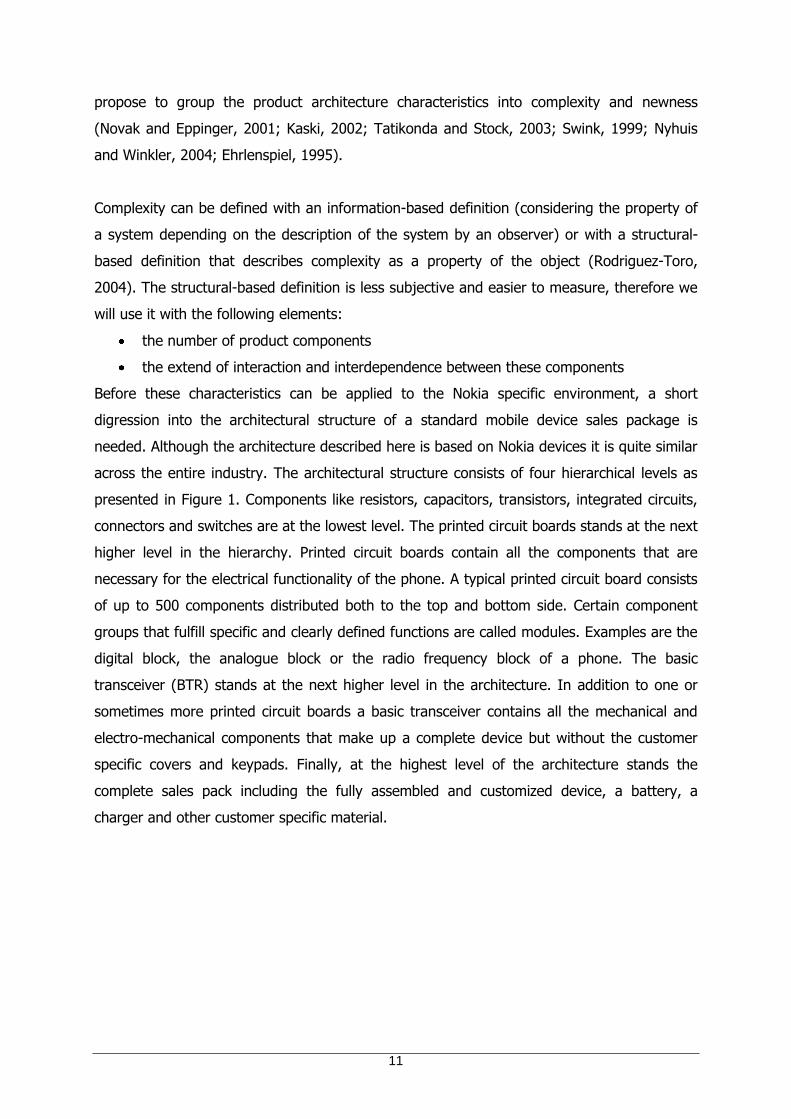
Before these characteristics can be applied to the Nokia specific environment, a short
digression into the architectural structure of a standard mobile device sales package is
needed. Although the architecture described here is based on Nokia devices it is quite similar
across the entire industry. The architectural structure consists of four hierarchical levels as
presented in Figure 1. Components like resistors, capacitors, transistors, integrated circuits,
connectors and switches are at the lowest level. The printed circuit boards stands at the next
higher level in the hierarchy. Printed circuit boards contain all the components that are
necessary for the electrical functionality of the phone. A typical printed circuit board consists
of up to 500 components distributed both to the top and bottom side. Certain component
groups that fulfill specific and clearly defined functions are called modules. Examples are the
digital block, the analogue block or the radio frequency block of a phone. The basic
transceiver (BTR) stands at the next higher level in the architecture. In addition to one or
sometimes more printed circuit boards a basic transceiver contains all the mechanical and
electro-mechanical components that make up a complete device but without the customer
specific covers and keypads. Finally, at the highest level of the architecture stands the
complete sales pack including the fully assembled and customized device, a battery, a
charger and other customer specific material.
12
Sales Package (SP)
(SP = basic transceiver with assembled customer specific covers and needed accessories e.g. charger,
user guide.)
Basic Transceiver (BTR)
(BTR = assembly of modules, mechanical and electromechanical parts)
Printed Circuit Board (PWB)
(PWB = an assembly of components onto a carrier connected via soldering)
Components
(components = resistors, capacitors, integrated circuits, switches, connectors)
Modules = component groups
that fulfill defined functions
Figure 1: The hierarchical structure of a Nokia mobile device sales package
As this type of hierarchy is present in all Nokia mobile device sales packs, we propose to
apply the two categories of complexity that were defined earlier in the following way. First,
complexity is driven by the number of components. This was empirically derived and is well
described in the literature about design for manufacturing (DFM) (Boothroyd and Dewhurst,
1987). Products with a low component count require fewer components to be manufactured,
sourced and assembled and have fewer parts that can fail in manufacturing. Second, we
include the material cost as a measure because the component count alone is not inclusive
enough. Two product designs can be equal in component count and still differ in complexity
as the following example shows. Memories (high capacity vs. low capacity), displays (high
resolution vs. low resolution) or connectors (high pin count vs. low pin count) are parts that
count as one on this level of aggregation but they reveal different complexities on product
level. Such components often require the application of more sophisticated manufacturing
technologies (e.g. memories), materials (e.g. LCDs) or integration testing concepts which is

13
subsequently reflected in price. This leads to the additional measure of the bill of materials
cost next to component count as a representation of product complexity.
The definition about the extent of interactions between these components is more difficult. A
mobile device can contain up to 1000 parts which results in an enormous number of
interactions. Therefore a more pragmatic definition must be used. Based on own experience
we suggest to measure the number of electrical interfaces on the basic transceiver level that
are not soldered. Experience has shown that all electrical components or modules that are
connected via spring contacts, hand soldered wires, connectors or bondings are exposed to
higher failure rates, especially during ramp-up when the knowledge about these interfaces is
still low. We count every connection between two components or modules as one even if
there are more electrical connections involved. This avoids bias towards high pin count
connectors. These connectors consist of hundreds of electrical connections which in most
cases do not fail separately but rather as a whole. In comparison, solder connections
between the components of a module seem to be much more robust and failure rates tend
to depend mainly on component pin count1.
The second main factor of the product architecture - newness - should be seen as the
degree of prior experience with the functional elements of the product or its technology.
Within the literature on management, newness is sometimes also characterized as the
magnitude of technological change (Barnett and Clark, 1996), the percentage of change in
the new product relative to its predecessor product (Griffin, 1997), or the organization’s
experience with the given technology (Abernathy and Clark, 1985). When a new product
involves new functional elements or technologies there are new sets of interactions between
the components that are not yet well understood. The process of identifying and
understanding these new interactions adds uncertainty, risk and effort to the development
team, possibly resulting in difficulties before and during the ramp-up. This is supported by
Abernathy and Clark (1985) who confirm that newer technologies require new knowledge,
skills, organizational procedures, capital equipment and organizational relationships with
vendors. Yoon and Lilien (1995) even claim that newness is one of the most important
factors affecting success or failure of a new product. There are many intermediate forms
between the extreme incremental and radical categories of newness. Different levels of both
forms are commonly found in Nokia projects, therefore we need to measure newness on
1 This is a simplified statement, for a more detailed view refer to Shina (2002).
14
three dimensions (refer to Table 1): functional module newness, technology newness and
software newness.
Functional module newness: functional modules are an aggregation of components,
software, interfaces and test-sequences that constitute a product-function. Examples
are displays, audio components, radio frequency modules or hinge/slide mechanisms.
These modules differ from pure components because they are fulfilling complete sub
functions in a mobile device. To account for the degree of newness of each functional
module we calculate the relative value of the module per basic transceiver. This
normalization is necessary in order to compare the measure between different
products and to quantify the degree of newness per product. Simple low-cost
modules often only require small changes in the hardware layout, the software or the
test procedure – which in turn only presents a low risk for ramp-up performance
compared to highly complex modules that require high integration efforts.
Technology newness: technology refers to the methods and means to produce
components and parts. Examples for new technologies are unique plastic or metal
coverings, special joining methods like gluing or thermo-bonding or the use of
advanced customization technologies like laser engraving. All these technologies
might affect the final verification process of the product or have an impact on the
supply side, forcing suppliers to deliver products with these new technologies.
Software newness: in addition to hardware and technology newness we also need to
cover the dimension of software newness. This can be done by counting the number
of critical software features. Due to the fact that every new feature needs to be
specified, implemented, tested and corrected, it adds a tremendous schedule risk to
some of the development projects. Non solved software bugs as a result of new and
complex features are often the reason for delayed ramp-ups. This is especially critical
if material and production lines are reserved but not in use because production
testing and product delivery is dependent on approved software releases. Critical
software features are always counted and assessed by the software project managers
during the specification phase to estimate the testing effort- and risk.
The impact of complexity and newness on ramp-up performance is also affected by the way
the project team manages the uncertainty. In order to quantify this effect we need to add a
third characteristic – the level of maturity. In this context, maturity is the level of product
completeness compared to the frozen product specification. A more mature product requires
less engineering changes, less debugging / rework and less coordination efforts resulting in
less uncertainty during ramp-up. Based on these facts, we propose to describe product

15
maturity according to the characteristic in Table 1. Data sources for this measure are trial
run results that are performed at a special location called “pre-production line” which is
outside the actual target factory. Two to four trial runs of this type are typically performed in
order to develop the product and the underlying processes. This measure provides us with a
good estimate for product maturity because the complete production setup including the
workforce follows the same procedures irrespective of the product under production. After
the product and the processes have achieved a certain level of maturity on this “pre-
production line”, one or two additional trial runs are performed – this time however, on the
final mass-production line which is temporarily converted for this purpose. The purpose of
these trial runs is to simulate the mass-production environment including the fine tuning of
the manufacturing processes, the operator training and the verification of locally produced
material. However, this measure will be used to estimate the factory readiness and is
described in the chapter about manufacturing capability (steady state capability). Our
proposition is based on the assumption that products with a high maturity, reflected in an
already high yield level before the mass-production simulation, have higher yield levels
during ramp-up and require less problem solving activities. This is reflected in an overall
better ramp-up performance.
Table 1: Product complexity- , newness- and maturity measures
Name Description Data type
PC1.1
PC1.2
The component count on module level and basic transceiver level
(including cover parts and keypad)
Metric,
discrete
PC2.1
PC2.2
The bill of materials cost of the printed circuit board and the basic
transceiver (including cover parts and keypad) [EUR]
Metric,
discrete
PC3 The number of electrical interfaces on the basic transceiver level
that are NOT soldered (e.g. spring contacts, hand soldered wires,
connectors, bondings etc.)
Metric,
discrete
PC4 The material cost of new functional modules [EUR] that are not yet
familiar to the development site
costmaterialBTRtotal
modulesfunctionalnewofcostmaterialnewnessmodule
Metric,
continuous
PC5 The number of new and unfamiliar technologies per product (new
and unfamiliar for the development site)
Metric,
discrete

16
PC6 The number of critical SW features Metric,
discrete
PC7 The difference between the target yield and actual yield during the
last pre-production trial run (outside the final mass production line)
levelyieldtarget
levelyieldtrialproduction-prefinalmaturityproduct
Metric,
continuous
Finally, based on the elements of product complexity, newness and maturity we expect the
following:
Proposition 1a: Lower levels of product complexity and newness are associated with better
ramp-up performance.
Proposition 1b: Higher levels of maturity are associated with better ramp-up performance.
3.2 The manufacturing capability Manufacturing capabilities span a wide range of attributes, so first we need to introduce the
underlying manufacturing process for a mobile device in order to group the relevant
attributes and their measures in a comprehensive but also specific way. Figure 2 shows a
simplified picture of a standard manufacturing line. The starting point is on the upper-right
side with the surface-mount technology part (SMT). Surface-mount technology encompasses
the placement, attachment and soldering of electronic components directly onto a bare
printed circuit board. After processing a printed circuit board, the programming phase adds
test software to the board to perform a basic functional test and to align the radio frequency
part. This is necessary because the radio frequency requirements for a mobile device are
tight and the hardware capabilities are rather low due to the inherent tolerances of the used
components. Before the boards can be assembled into mechanical elements they have to be
separated from the auxiliary-flaps in a milling-machine. The subsequent and most manual
step is the final assembly phase. In this phase the printed circuit boards and other
electromechanical components are assembled into the mechanical covers. In order to avoid
shipments of non-conforming units and to control the assembly process, a final test has to
be performed. Finally, the ready-made basic transceivers are packed and shipped to the
customization centers where the customer specific configuration takes place. This involves
very simple activities like the assembly of customer specific covers and the packaging into
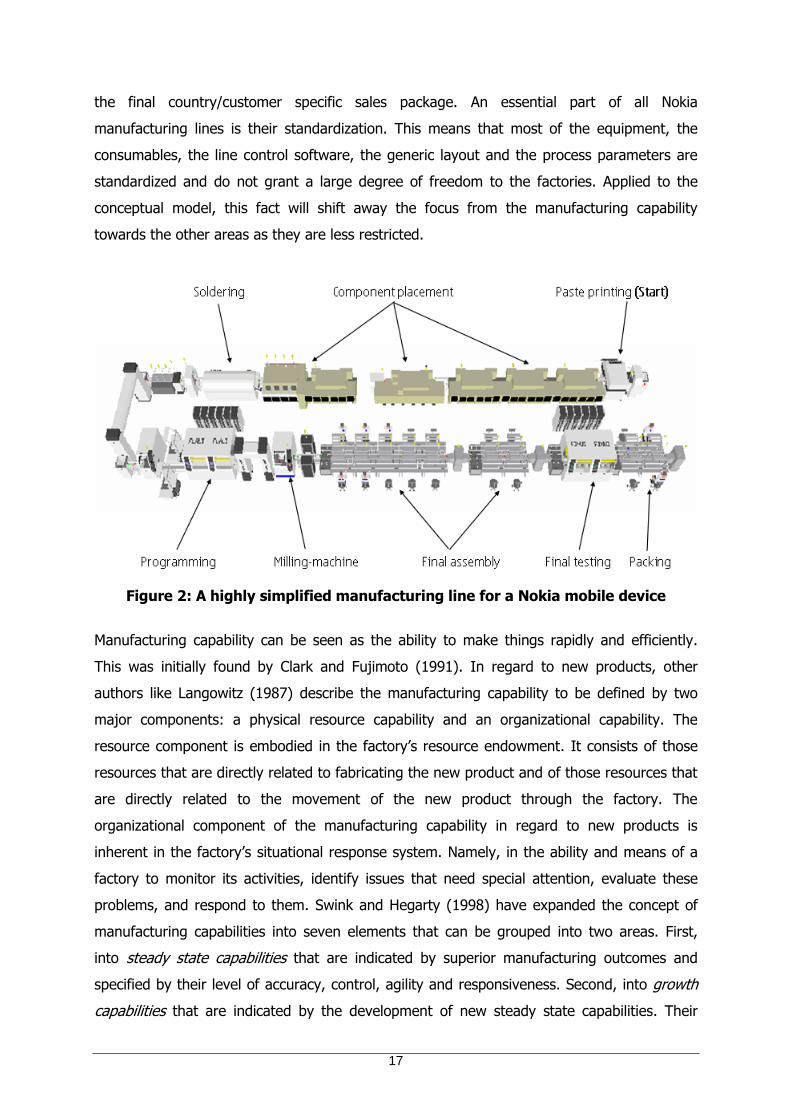
17
the final country/customer specific sales package. An essential part of all Nokia
manufacturing lines is their standardization. This means that most of the equipment, the
consumables, the line control software, the generic layout and the process parameters are
standardized and do not grant a large degree of freedom to the factories. Applied to the
conceptual model, this fact will shift away the focus from the manufacturing capability
towards the other areas as they are less restricted.
Figure 2: A highly simplified manufacturing line for a Nokia mobile device
Manufacturing capability can be seen as the ability to make things rapidly and efficiently.
This was initially found by Clark and Fujimoto (1991). In regard to new products, other
authors like Langowitz (1987) describe the manufacturing capability to be defined by two
major components: a physical resource capability and an organizational capability. The
resource component is embodied in the factory’s resource endowment. It consists of those
resources that are directly related to fabricating the new product and of those resources that
are directly related to the movement of the new product through the factory. The
organizational component of the manufacturing capability in regard to new products is
inherent in the factory’s situational response system. Namely, in the ability and means of a
factory to monitor its activities, identify issues that need special attention, evaluate these
problems, and respond to them. Swink and Hegarty (1998) have expanded the concept of
manufacturing capabilities into seven elements that can be grouped into two areas. First,
into steady state capabilities that are indicated by superior manufacturing outcomes and
specified by their level of accuracy, control, agility and responsiveness. Second, into growth
capabilities that are indicated by the development of new steady state capabilities. Their
18
components include improvement, innovation and integration. Based on this characterization
we propose to group the Nokia specific manufacturing capabilities into growth capabilities
and steady state capabilities.
Growth capabilities are very much characterized by the ability to incorporate new products or
processes into the operation or by how well the performance can be improved by the
existing resources. Not a direct measure but an indicator of this is the number of ramp-ups
of new products that a factory has performed over the last six months. If there have been
many ramp-ups we expect the manufacturing site to own a high level of motivation,
introduction flexibility and knowledge compared to a site with fewer number of ramp-ups.
These assumptions are in line with the work of Hatch and Mowery (1998) that improvement
of manufacturing performance through learning is not an exogenous result of output
expansion but primarily influenced by the systematic allocation of engineering labor to
problem solving activities.
New manufacturing processes could be the reason for yield and output losses as the initial
process understanding is often low and process control is insufficient. Nyhuis and Winkler
(2004) argue that most of the arising problems during ramp-up are the result of immature
production lines. A typical example that illustrates this fact was the introduction of lead free
soldering. Lead free soldering required the factories to implement a new process with tighter
process parameters. Unfortunately this resulted in yield- and output drops because the new
process was not as stable and mature during the ramp-up as the previous one. We measure
production line maturity as the extend to which new processes are introduced into an
existing line as this seems to be the most pragmatic measure for it.
A steady state capability variable is the ability to direct and regulate operating processes. We
believe that a factory inhibits a higher level of knowledge about the current process
capability limits and sources of variation if less changeovers and new setup activities have to
be introduced to a manufacturing line. To measure this phenomenon we add production line
commonality to the conceptual model. High commonality factors expressed as the relative
value of new product specific equipment require less modification activities at the production
line. In these cases verified and smoothly running mass-production lines can be fast and
easily converted, allowing smooth ramp-ups with little disturbances by the manufacturing
line itself.
Maturity was already considered in the last chapter but focused on the product architecture.
The measure applied in this section is intended to reflect the manufacturing maturity as a
result of executed trial runs. The major influential variable for such a trial run (compared to

19
the last trial run on the pre-production line) is the usage of the final mass-production line
and their operators. We believe that this offers us a good representation of the
manufacturing line maturity at that point in time.
Table 2: Growth- and steady state manufacturing capabilities
Name Description Data type
Growth capabilities
MC1 The number of new product ramp-ups during the last 6 months Metric,
discrete
MC2 The number of new manufacturing processes (which are new to the
factory) that have to be introduced
Metric,
discrete
Steady state capabilities
MC3 Line commonality as a measure for mix flexibility between an
existing and a new line configuration as expressed below:
equipmentspecific prod.ofvaluetotal
equipmentspecificprod.newofvalueycommonalitlineprod.
Metric,
continuous
MC4 The yield level during the last trial run (performed on the final mass
production line)
Metric,
continuous
There are other measures within these categories but as already explained, most of the
parameters are standardized and do not significantly differ within the Nokia specific
environment. According to the presented factors we suggest the following proposition.
Proposition 2: Higher levels of growth capabilities and steady state manufacturing
capabilities are associated with higher ramp-up performance.
3.3 The product development process For every new product, Nokia uses a phase driven development process that divides the
whole project lifecycle into smaller phases with clearly defined deliverables (Figure 3). In this
research context, the key milestone is PD3. Production starts at this point in time and the
first sales packages are shipped out to the customers. Later, when production has reached
the planned target capacity and the suppliers have given their commitment to the planned
volumes, PD4 is granted. PD4 marks the sales volume commitment and defines the point in
time at which the ramp-up is finished. After this point, volume production is achieved and
only maintenance and ramp-down activities are performed.

20
Figure 3: The Nokia development process of a mobile device
The phase between PD2 and PD3 is mainly dedicated to the process development and the
fine tuning of the product. During this phase intense manufacturing trials and supplier
verification runs are executed. However, product design has to be completed at PD2, so that
components and mechanic molding tools can be purchased. This step is required at a
minimum of twelve weeks before PD3 because the lead times for certain components are
long. The actual development phase is reduced to the phase between PD1 and PD2. The
time after PD2 can only be used for fine tuning activities that do not require major hardware
changes such as the elimination of software bugs. A fine balance between needed
improvements and potential ramp-up delays is mandatory, because type approval and
molding tool production is started and can not be interrupted without severe consequences.
The time between PD0 and PD1 is mainly used to create the project plans and to freeze the
product specification whereas the time before PD0 is used to define the project scope and to
collect the project team.
The theoretical base on product development proficiency has increased during the last years
as this process has been acknowledged to be important for competitive advantage (Clark &
Fujimoto, 1991; Zirger and Maidique, 1990; Brown and Eisenhard, 1995; Sobek et al., 1998).
Although there is a vast amount of literature about product development, Brown and
Eisenhard (1995) have organized the different research streams along three factors that
contribute to product-development success:
Process performance
Product concept effectiveness
Market situation
This arrangement will provide the structure for the further analysis. The first factor, process
performance is about speed and productivity. It is driven by team composition, supplier
involvement, team organization, team group processes and project leader skills. Most of the

21
upstream activities in Nokia take place around supplier selection, location, involvement and
capability. This is based on the fact that a mobile device is so complex that no single
company alone is likely to master all of the relevant technologies on a competitive level.
Involving sub-suppliers at an early stage can for example have advantages such as shorter
lead times, lower costs, higher quality, shared costs and earlier availability of prototypes
(Fagerström and Jackson, 2002). However, the supplier interaction is strictly specified by the
development process and it can also result in drawbacks if uncertain product specifications
create an unstable product development process. This led to the decision to focus on the
speed variables in the process performance area. We measure development time as a result
of our assumption that shorter development times provide project teams with less time for
improvement and verification activities. This can result in lower product maturity and hence
worse ramp-up performance. A similar result is expected for the time between supplier mass
production simulation and ramp-up start. Supplier mass production simulation means that all
mechanics suppliers perform a one week full production run to proof their mass-production
capability - volume and quality wise. The earlier this can be started the more time is
available to fine tune the molding tools, the metal stamping lines and the decoration
processes. However, this rule can be falsified if there is a negative impact through late
engineering changes because that would collide with the supplier mass production simulation
as a result of their earlier start.
The impact of the team composition and cross functional integration on the success of
development projects is already well described in existing literature (Sobek et al., 1998;
Langowitz, 1987; Almgren, 2000; Terwiesch et al. 1999; Tabrizi and Walleigh, 1997). Most
product development teams are formed at the beginning of the project. They typically
include representatives from all areas as shown in Figure 4. Although the overall structure
and the working mode of the teams is similar between the projects there are many
differences in team behavior that can have a significant impact on the overall team
performance. Voigt and Thiell (2005) point out that an efficient ramp-up team has to be
composed cross functionally, including people with just the right competences and
experience levels. Additionally, it is crucial for the accomplishment of a successful ramp-up
to keep the general work level in balance. An increased work level due to ramp-up activities
might otherwise compromise the motivation of the teams. We therefore hypothesize in our
model that teams with enough experience and a moderate workload will perform most
efficiently. A moderate workload allows team members to support each other and leaves
them enough time for communication within the team. Compared to overstrained colleagues,
they are also more likely to stay motivated. Results from several research papers (refer to

22
Brown and Eisenhardt, 1995) indicate that effective group processes - particularly those
related to communication - increase information and thus are essential for highly effective
development processes. On the other hand, moderate experience reduces the individual level
of uncertainty in new projects, contributes to a certain level of trust and keeps team
members more flexible than their highly experienced counterparts. Van der Merwe (2004)
supports this view, stating that a venture is more likely to be successful if the team members
are experienced with new product development projects. Experimental tactics seem to be
more effective than established and mature strategies, especially in highly uncertain projects
with short iteration cycles (Brown and Eisenhardt, 1995). We defined two measures for team
composition (refer to Table 3) as a result of the previous discussion, the work experience
that these factors differ significantly between Nokia projects and because of the reliability of
the data.
Although other research like the work of Fleischer and Liker (1992) points to the importance
of team integration and manufacturing involvement on product development, these factors
are not explicitly recorded here due to the assumption that these factors do not significantly
differ between the projects. This assumption is based on the obligatory and formal
application of the development process guidelines, the usage of uniform tools and the
homogeneous organizational structure as shown in Figure 4. This structure fosters functional
diversity of project teams so that project team members understand the development
process from a variety of perspectives.
Product Program
Manager
(PPM)
Operations & Logistics
Project Manager
(OLPM)
Materials Project
Manager
(MPM)
Product Development
Manager
(PDM)
Care Project
Manager
(CPM)
Product Manager
(PM)
Documentation
Control
Product Validation
Manager
(PVM)
Product Program
Manager
(PPM)
Operations & Logistics
Project Manager
(OLPM)
Materials Project
Manager
(MPM)
Product Development
Manager
(PDM)
Care Project
Manager
(CPM)
Product Manager
(PM)
Documentation
Control
Product Validation
Manager
(PVM)
Figure 4: The organizational structure of a typical product development team
The second factor, product concept effectiveness, is affected by the customer involvement
and the senior management support but plays only a secondary role in this conceptual model
because these factors do not differ much between the projects. The third factor, market
situation, consists of elements that are judged by the external environment characteristic,
consisting of the market size, market growth and the level of competition.

23
Table 3: Product development process performance- and team composition
measures
Name Description Data type
PDP1 The number of days between the PD0 (project start) and PD3
(ramp-up start) milestones
Metric,
discrete
PDP2 The time between the start of the supplier mass production
simulation and PD3 (ramp-up start)
Metric,
discrete
PDP3.1
PDP3.2
The experience level of the project management team
expressed as the average number of finalized projects per team
and the range between the least and most experienced team
member
Metric,
discrete
PDP4 The workload of the project management team expressed as the
average number of projects in which the team is involved
simultaneously
Metric,
discrete
Based on the mentioned factors we expect the following:
Proposition 4: Higher levels of product development process performance are associated
with higher ramp-up performance.
3.4 The logistics system Logistics is concerned with planning and controlling material flows and related information in
organizations. Simply speaking, the mission of logistics is to get the right materials to the
right place at the right time, while optimizing a given performance measure and satisfying a
given set of constraints. Ghiani et al. (2004) formalize such systems into a set of facilities
linked by transportation services. Facilities are sites where materials are processed. They
include manufacturing and assembly facilities, warehouses; distribution centers (DCs) and
more. Transportation services move materials between facilities using vehicles and
equipment such as trucks, plains, trains etc.. The influence of these elements on effective
new product development and launch is widely recognized. Problems during the early phase
of any ramp-up are often caused by unavailability or insufficient quality of parts, and the fact
that the processes during ramp-up deviate from the processes at volume production (Pfohl
and Gareis, 2000; Baumgarten and Risse, 2001). One of the key differences during Nokia
ramp-ups compared to volume production is the way how material supply and manufacturing
operations are managed. They are fully push driven, based on the materials and

24
manufacturing capability estimations of the product development team. Therefore, inventory
buffer and sales commitments are largely under the control of this team. This is in contrast
with volume production where all demand management, scheduling and forecasting activities
are handled via MRP systems. For the further structuring of the relevant characteristics of a
logistics system we use the terms facilities and design for logistics. Transportation services
do not play an important role in our model. The type of transportation is standardized to
truck for domestic and air freight for international transportation for all projects except some
ultra low cost or premium products which are not part of this study.
This first measure refers to facilities as it reflects the composition of the global logistics
network. If more factories are needed, the supply network and the ramp-up management
tend to be more difficult and more sophisticated. The number of supply networks is closely
linked to the number of factories but due to the dependency on the global supply strategy,
separate measures are needed. This highlights the fact that a major part of the value chain
is not vertically integrated, extending the ramp-up to the supplier network.
Products seem to have a better ramp-up performance if they are logistical-friendly
(Baumgarten and Risse, 2001). Of particular importance during changing market conditions
(e.g. during ramp-ups) is the concept of agility (Lee, 2004). Agility is defined as the quick
response to short-term changes in demand or supply and decisively influenced by form
postponement. Form postponement reduces the risk to manufacture an incorrect product
mix as the customization is delayed until specific customer orders are received. It reduces
the need to stock inventory of component-, module- or basic transceiver variants and
therefore lowers the risk of stock-outs. However, a second important parameter for form
postponement that needs to be considered is the value and number of variable parts. As an
example, a large number of color variants of the plastic covers or keypads leads to higher
demand fluctuations because the individual demands tend to be more diverse than
aggregate ones. Therefore, short replenishment cycles are needed to enable quick responses
on customer preferences which are particularly difficult to predict in the early ramp-up
phase. Additionally, costly variable parts are often the result of higher complexity due to
required design elements. This does not only affect the product complexity as discussed in
one of the previous chapters but also the behavior of the supply chain in general. More
costly parts tend to create more problems in the outgoing inspection area of the suppliers
and the incoming inspection area of the manufacturing facilities. This results in lower yields
at supplier factories, leading to missing parts at the manufacturing line or higher scrap rates
due to non-conforming parts.
25
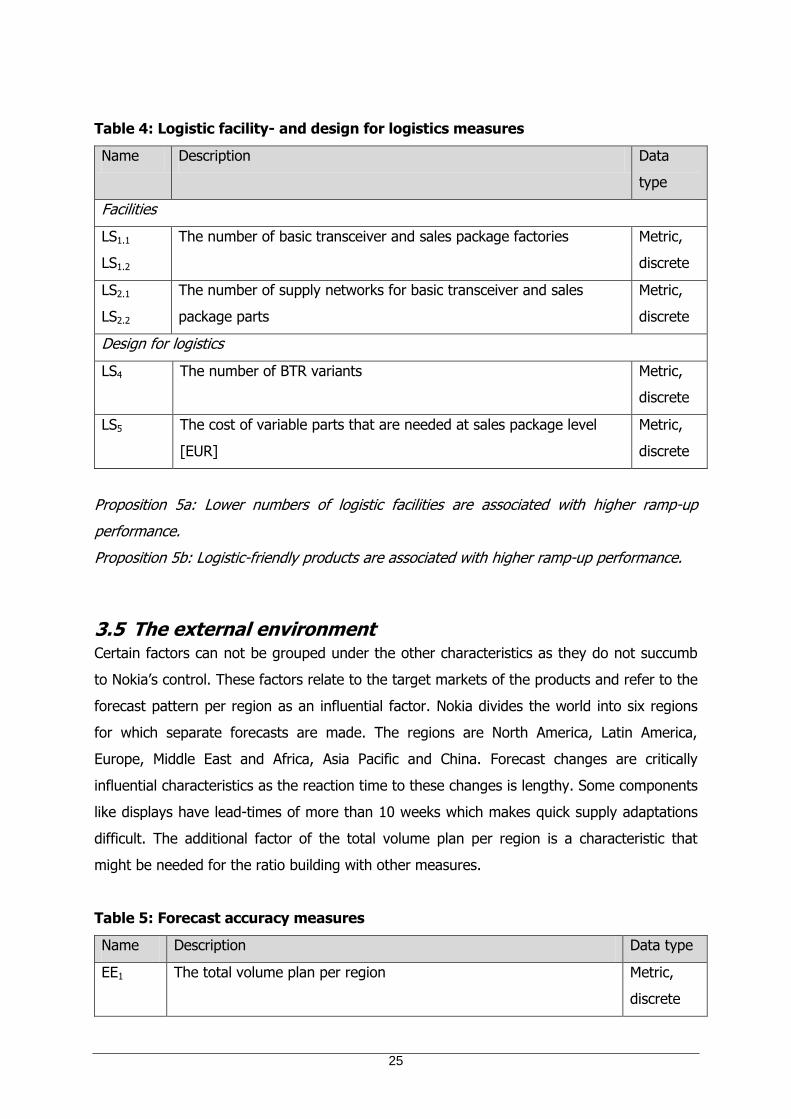
Table 4: Logistic facility- and design for logistics measures
Name Description Data
type
Facilities
LS1.1
LS1.2
The number of basic transceiver and sales package factories Metric,
discrete
LS2.1
LS2.2
The number of supply networks for basic transceiver and sales
package parts
Metric,
discrete
Design for logistics
LS4 The number of BTR variants Metric,
discrete
LS5 The cost of variable parts that are needed at sales package level
[EUR]
Metric,
discrete
Proposition 5a: Lower numbers of logistic facilities are associated with higher ramp-up
performance.
Proposition 5b: Logistic-friendly products are associated with higher ramp-up performance.
3.5 The external environment Certain factors can not be grouped under the other characteristics as they do not succumb
to Nokia’s control. These factors relate to the target markets of the products and refer to the
forecast pattern per region as an influential factor. Nokia divides the world into six regions
for which separate forecasts are made. The regions are North America, Latin America,
Europe, Middle East and Africa, Asia Pacific and China. Forecast changes are critically
influential characteristics as the reaction time to these changes is lengthy. Some components
like displays have lead-times of more than 10 weeks which makes quick supply adaptations
difficult. The additional factor of the total volume plan per region is a characteristic that
might be needed for the ratio building with other measures.
Table 5: Forecast accuracy measures
Name Description Data type
EE1 The total volume plan per region Metric,
discrete
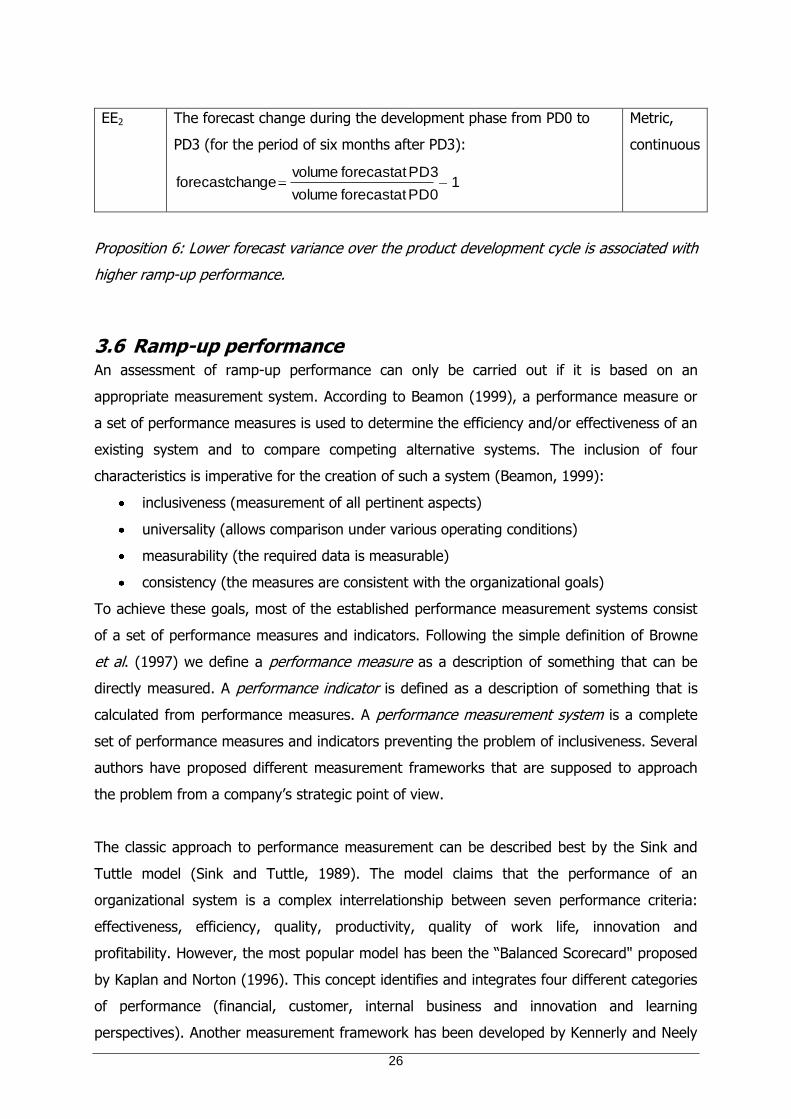
26
EE2 The forecast change during the development phase from PD0 to
PD3 (for the period of six months after PD3):
1PD0 at forecast volume
PD3 at forecast volumechangeforecast
Metric,
continuous
Proposition 6: Lower forecast variance over the product development cycle is associated with
higher ramp-up performance.
3.6 Ramp-up performance An assessment of ramp-up performance can only be carried out if it is based on an
appropriate measurement system. According to Beamon (1999), a performance measure or
a set of performance measures is used to determine the efficiency and/or effectiveness of an
existing system and to compare competing alternative systems. The inclusion of four
characteristics is imperative for the creation of such a system (Beamon, 1999):
inclusiveness (measurement of all pertinent aspects)
universality (allows comparison under various operating conditions)
measurability (the required data is measurable)
consistency (the measures are consistent with the organizational goals)
To achieve these goals, most of the established performance measurement systems consist
of a set of performance measures and indicators. Following the simple definition of Browne
et al. (1997) we define a performance measure as a description of something that can be
directly measured. A performance indicator is defined as a description of something that is
calculated from performance measures. A performance measurement system is a complete
set of performance measures and indicators preventing the problem of inclusiveness. Several
authors have proposed different measurement frameworks that are supposed to approach
the problem from a company’s strategic point of view.
The classic approach to performance measurement can be described best by the Sink and
Tuttle model (Sink and Tuttle, 1989). The model claims that the performance of an
organizational system is a complex interrelationship between seven performance criteria:
effectiveness, efficiency, quality, productivity, quality of work life, innovation and
profitability. However, the most popular model has been the “Balanced Scorecard" proposed
by Kaplan and Norton (1996). This concept identifies and integrates four different categories
of performance (financial, customer, internal business and innovation and learning
perspectives). Another measurement framework has been developed by Kennerly and Neely
27
(2000) as a result of several identified shortcomings of the Balanced Scorecard. One
weakness is that the concept does not include a competitive dimension and a human
resource perspective. Kennerly and Neely (2000) developed a framework stating that the
results of an organization (measured as stakeholder satisfaction) are a function of four
determinants: strategy, processes, capabilities, stakeholder contribution. De Toni and
Tonchia (2001) enhance this list by two additional models that are found frequently in the
literature. The “frustrum” model, that separates traditional cost performance measures
(production cost, productivity) from the non-cost measures (quality, time, flexibility) and the
models that distinguish between internal (cost and non-cost) and external performance
(perceived by the customer). Although this short overview provides a useful classification of
the most common measures on a strategic level we need to narrow them down in order to
explore ramp-up performance on a more operational level. The difficulty is to create a ramp-
up performance measurement system that is consistent with the overall business goals and
does not lead to conflicts between the different functions (as reported e.g. by Shapiro
(1997)). In addition, a major problem of the existing literature on performance measurement
is the fact that it is so diverse. Individual authors had the tendency to focus on different
aspects of performance measurement system design (Neely et al., 1995). As a result, we are
building our measurement system on the work of Slack et al., (2001), De Toni and Tonchia
(2001) and Neely et al. (1995). It will be amended by the work of Brown and Eisenhardt
(1995), Mallick and Schroeder (2005), Terwiesch et al. (1999) and Almgren (2000) to narrow
it down on the specific area of ramp-ups. Additionally, several interviews with managers
within the Mobile Phones business unit were executed to condense the proposed concepts
and to adapt them to the company specific needs. As already mentioned in the beginning of
this chapter ramp-up performance can be determined in terms of effectiveness and
efficiency.
Efficient ramp-ups are characterized by a superior operational performance. In our case,
efficiency is a measure of how economically the firm’s resources are utilized (Slack et al.
(2001). Operational performance is characterized by a high percentage of sold products
under the assumption of a highly effective capacity utilization rate of the manufacturing
system. Both measures are detailed in Table 6 and based on the final verification efficiency
measure proposed by Almgren (2000) and the effective capacity utilization measure
proposed by Terwiesch et al. (1999). The period of time shortly after the ramp-up start is
extremely critical because the sales and promotion activities are already started while many
improvement and configuration activities are still in progress. Especially in projects with a
strong focus on time to market, project teams are striving for accelerated product
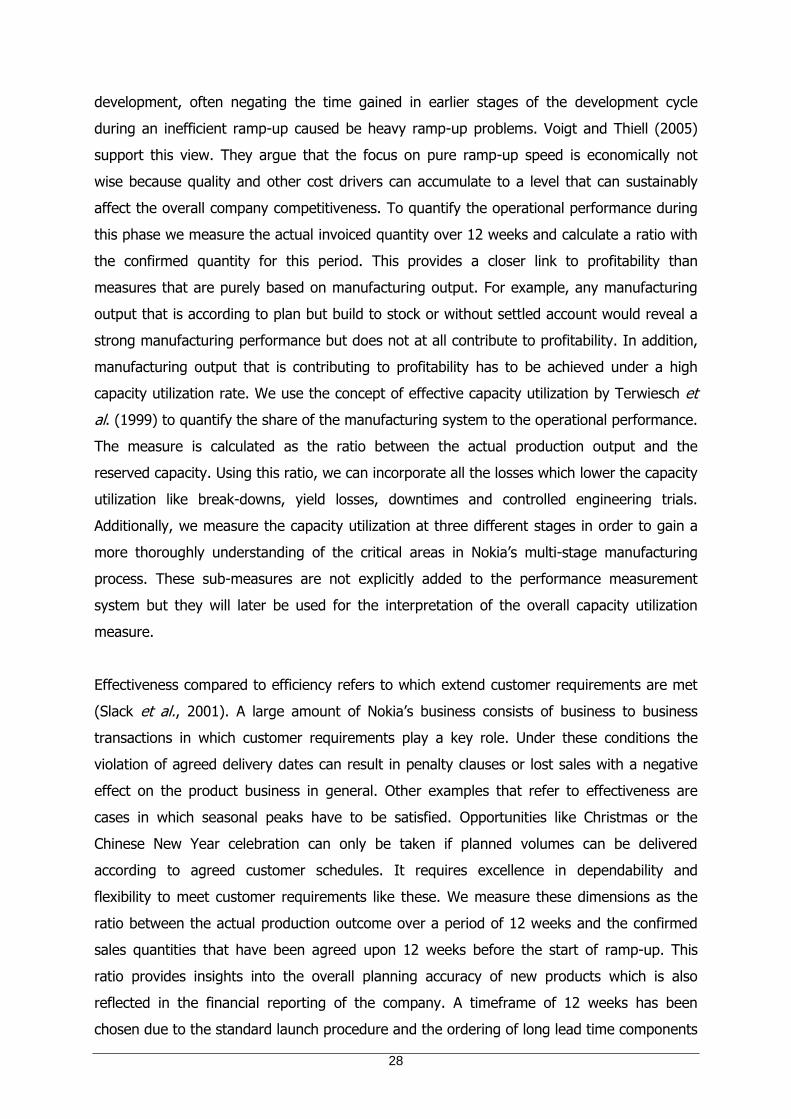
28
development, often negating the time gained in earlier stages of the development cycle
during an inefficient ramp-up caused be heavy ramp-up problems. Voigt and Thiell (2005)
support this view. They argue that the focus on pure ramp-up speed is economically not
wise because quality and other cost drivers can accumulate to a level that can sustainably
affect the overall company competitiveness. To quantify the operational performance during
this phase we measure the actual invoiced quantity over 12 weeks and calculate a ratio with
the confirmed quantity for this period. This provides a closer link to profitability than
measures that are purely based on manufacturing output. For example, any manufacturing
output that is according to plan but build to stock or without settled account would reveal a
strong manufacturing performance but does not at all contribute to profitability. In addition,
manufacturing output that is contributing to profitability has to be achieved under a high
capacity utilization rate. We use the concept of effective capacity utilization by Terwiesch et
al. (1999) to quantify the share of the manufacturing system to the operational performance.
The measure is calculated as the ratio between the actual production output and the
reserved capacity. Using this ratio, we can incorporate all the losses which lower the capacity
utilization like break-downs, yield losses, downtimes and controlled engineering trials.
Additionally, we measure the capacity utilization at three different stages in order to gain a
more thoroughly understanding of the critical areas in Nokia’s multi-stage manufacturing
process. These sub-measures are not explicitly added to the performance measurement
system but they will later be used for the interpretation of the overall capacity utilization
measure.
Effectiveness compared to efficiency refers to which extend customer requirements are met
(Slack et al., 2001). A large amount of Nokia’s business consists of business to business
transactions in which customer requirements play a key role. Under these conditions the
violation of agreed delivery dates can result in penalty clauses or lost sales with a negative
effect on the product business in general. Other examples that refer to effectiveness are
cases in which seasonal peaks have to be satisfied. Opportunities like Christmas or the
Chinese New Year celebration can only be taken if planned volumes can be delivered
according to agreed customer schedules. It requires excellence in dependability and
flexibility to meet customer requirements like these. We measure these dimensions as the
ratio between the actual production outcome over a period of 12 weeks and the confirmed
sales quantities that have been agreed upon 12 weeks before the start of ramp-up. This
ratio provides insights into the overall planning accuracy of new products which is also
reflected in the financial reporting of the company. A timeframe of 12 weeks has been
chosen due to the standard launch procedure and the ordering of long lead time components

29
that has to be initiated three months before the ramp-up at the latest. In an environment
that is characterized by stable volume forecasts this would be sufficient. However, due to
environmental effects triggered by competitor activities, portfolio changes, new technology
introductions and ramp-down decisions for other projects, the volume forecast is highly
unstable. To include this factor in our calculation, the dependability ratio is adjusted by the
change in market demand. For example, a product ramp-up might perform extremely well if
it is measured, based on the previously agreed numbers (e.g. 12 weeks before the ramp-up)
but it might loose a major opportunity if the market demand would double in the meantime.
A potential weakness of this measuring method is the fact that it assumes the ramp-up
speed to be adjusted for maximum profitability. This is practically guaranteed by regular
reviews of the product business case by the Product Program Manager as ramp-ups in fast
clockspeed industries with short lifecycles will always face the dilemma that they have to
balance the rate of asset investments, material risk orders and the available ramp-up speed.
Higher investments in tools, resources and manufacturing equipment or early risk orders for
potential immature material would allow for steeper ramp-ups, but only at the expense of
cost and risk. Although such a strategy could pay off in the beginning and claim premium
prices, there is the drawback of potential obsolete materials or under utilized assets later on.
The last performance measure deals with customer perceived quality and is hence related to
effectiveness and efficiency. Traditionally, quality has been defined in terms of conformance
to specification. Hence, quality-based measures of performance have focused on issues such
as the cost of quality (Neely et al., 1995). With the advent of total quality management the
emphasis has shifted away from “conformance to specification” towards customer
satisfaction or customer perceived quality. This is still seen as one of the most important
performance indicators in the high-technology industry as it refers to the concept of lost
sales and customer retention. However, it is one of the most difficult to measure. There are
many factors that have an impact on customer perceived quality, for example device
reliability, functionality, design, price and service. However, within this study we focus on the
firm’s overall manufacturing and delivery performance. We rather focus on the problems that
can result in providing a perfect order to the customer than on the perception of the
customer towards the new product and service. The dimensions that are related to a perfect
order are multifaceted and include issues like non-damaged shipments, availability of all
items, functionality of all items, correctly picked orders etc. (Bowersox et al., 1999). To
quantify these dimensions over the ramp-up period we use the return rate of the first
delivery batches as a percentage of the total deliveries.

30
There are two measures that are frequently proposed in the literature but however are not
taken into account: pure cost measures and time to market. Although pure cost measures
and time to market are important performance measures there are downfalls in relying on
these measures during new product ramp-ups. In the short term, the impact of cost on the
overall profitability is minor although this clearly changes in the mid- and long term. Any lost
sales and hence lost profits in a fast clockspeed industry will outweigh all the other possible
inefficiencies in the value chain by far. Second, cost data is often only available too late or
based on the wrong activity levels (Möller, 2005) and consequently not relevant for the
decision making or performance evaluation during ramp-up. Finally, each of our selected
performance measures has several internal effects, but all of them are affecting cost.
Concerning time to market there are authors like Clark and Fujimoto (1991) that consider
this as a critical dimension of product development performance. However, we will not
include time to market in our model because of two reasons. First, time to market is often
measured as the time between concept generation and sales start. As such it is more a
measure of product development performance than of ramp-up performance. Second, we
follow Mallick and Schroeder (2005) who argue that time can rather be viewed as a
resource. Thus, we include time to market as a critical variable of the new product
development process and as a depended factor within the product development area (factor
PDP1) into our conceptual model. There is empirical evidence that increased pressure on
time to market during new product development projects may lower development time but
at the expense of other performance measures like effort, quality or ramp-up quantity.
Overall, the selected performance measures are summarized in Table 6 and well in line with
the results of an earlier survey within Nokia that an important characteristic of good
performance measurement systems is simplicity (Joas, 2003).
Table 6: The ramp-up performance measurement framework
Name Description Data type
RUP1 Operational performance, measured as:
up-ramp of start the at
weeks 12 of periode a over
CSVP
invoiced actualseperformancloperationa
Actuals invoiced over a period of 12 weeks = sold quantity over a period of
12 weeks
CSVP at the start of ramp-up = (confirmed sales volume plan) output
quantity confirmed to sales for a period of 12 weeks at the start
Metric,
continuous
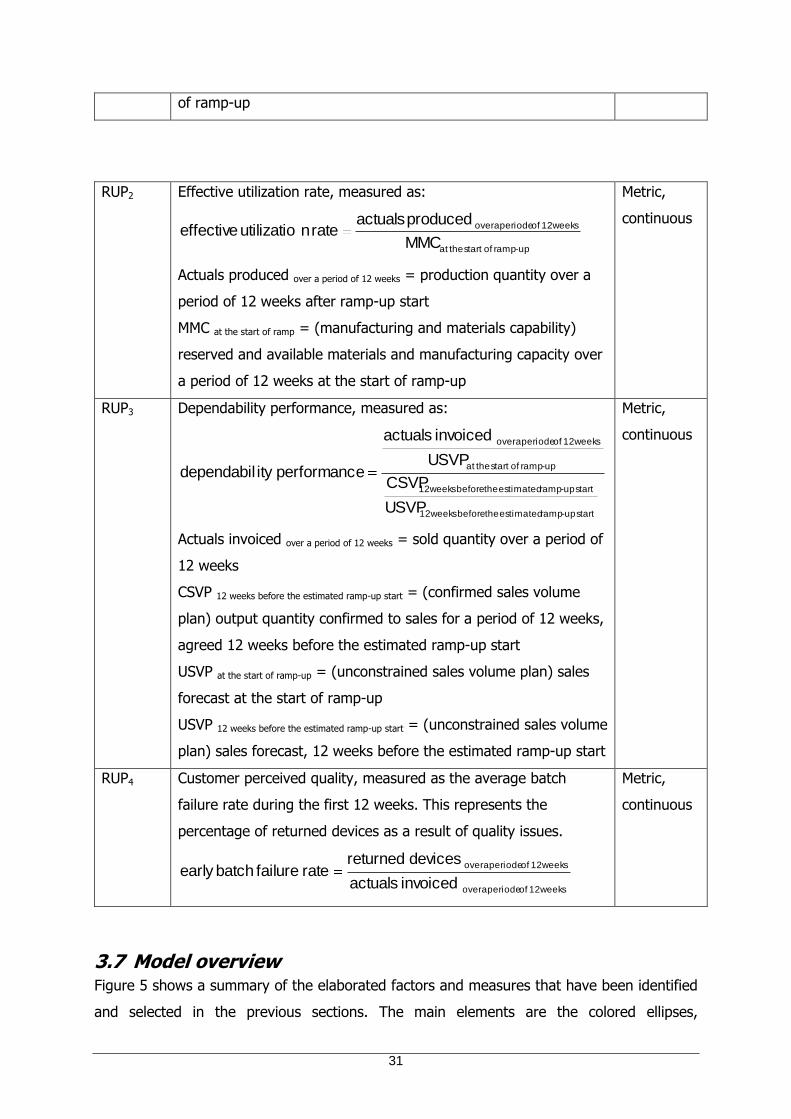
31
of ramp-up
RUP2 Effective utilization rate, measured as:
up-ramp of start the at
weeks 12 of periode a over
MMC
produced actualsrate nutilizatio effective
Actuals produced over a period of 12 weeks = production quantity over a
period of 12 weeks after ramp-up start
MMC at the start of ramp = (manufacturing and materials capability)
reserved and available materials and manufacturing capacity over
a period of 12 weeks at the start of ramp-up
Metric,
continuous
RUP3 Dependability performance, measured as:
start up-ramp estimated the before weeks 12
start up-ramp estimated the before weeks 12
up-ramp of start the at
weeks 12 of periode a over
USVP
CSVP
USVP
invoiced actuals
eperformanc itydependabil
Actuals invoiced over a period of 12 weeks = sold quantity over a period of
12 weeks
CSVP 12 weeks before the estimated ramp-up start = (confirmed sales volume
plan) output quantity confirmed to sales for a period of 12 weeks,
agreed 12 weeks before the estimated ramp-up start
USVP at the start of ramp-up = (unconstrained sales volume plan) sales
forecast at the start of ramp-up
USVP 12 weeks before the estimated ramp-up start = (unconstrained sales volume
plan) sales forecast, 12 weeks before the estimated ramp-up start
Metric,
continuous
RUP4 Customer perceived quality, measured as the average batch
failure rate during the first 12 weeks. This represents the
percentage of returned devices as a result of quality issues.
weeks 12 of periode a over
weeks 12 of periode a over
invoiced actuals
devices returnedrate failure batch early
Metric,
continuous
3.7 Model overview Figure 5 shows a summary of the elaborated factors and measures that have been identified
and selected in the previous sections. The main elements are the colored ellipses,

32
representing the top level factors that affect ramp-up performance. The dependencies
between these factors and the dependent elements of ramp-up performance are indicated
by solid lines. We assume a direct dependency between these five factors and ramp-up
performance because ramp-up performance as such does not reveal any short term
respectiveness in this context. There are certainly mid-term dependencies in the opposite
direction as a reaction to the actual ramp-up performance but the analysis of these
dependencies is out of the scope of this work. Next and connected with every main factor
are the variables or measures that define and quantify every factor. The boxes represent the
earlier defined measures and indicate the names of the variables. Furthermore, there are
some dotted lines that connect the top level factors. These lines are crucial for the statistical
data analysis as they present the dependencies between the factors that might at worst
indicate multicollinearity. As an example, there is a strong bidirectional dependency between
the product architecture and the manufacturing capability. A strong design for manufacturing
culture can affect the product architecture if manufacturing requirements are taken into
account within the product design. On the other hand, the major driving force behind the
manufacturing configuration is the product architecture. Although the manufacturing lines
are standardized to a high degree the product architecture defines the level of product
specific production equipment and the needed manufacturing processes. A similar but only
unidirectional dependency exists between the logistic system and the product development
process. A multiple supply base including several manufacturing plants requires the project
to schedule more trial runs, more mass production simulations and adds more effort to the
team compared with a simpler logistic network. There is also a dependency between the
logistic system and the product architecture. A logistic friendly product architecture requires
a less sophisticated logistic system with lower lead-times and fewer risks. This is the result of
architectural details that enable late- and easy variation, simple customization and short
supply networks. Finally, the overall setup of the logistic network is to a major degree the
result of the global volume forecast. Empirical evidence shows that high volume products,
sold in all regions of the world, require multiple supply chains and multiple manufacturing
locations. There are several driving forces behind these decisions but most of them are
either depending on the expected sales volumes, import taxes, customs duties and
transportation costs, or depending on the needed customer service levels. In general, these
interactions and dependencies have to be considered during the analysis in order to achieve
a high internal validity of the model.
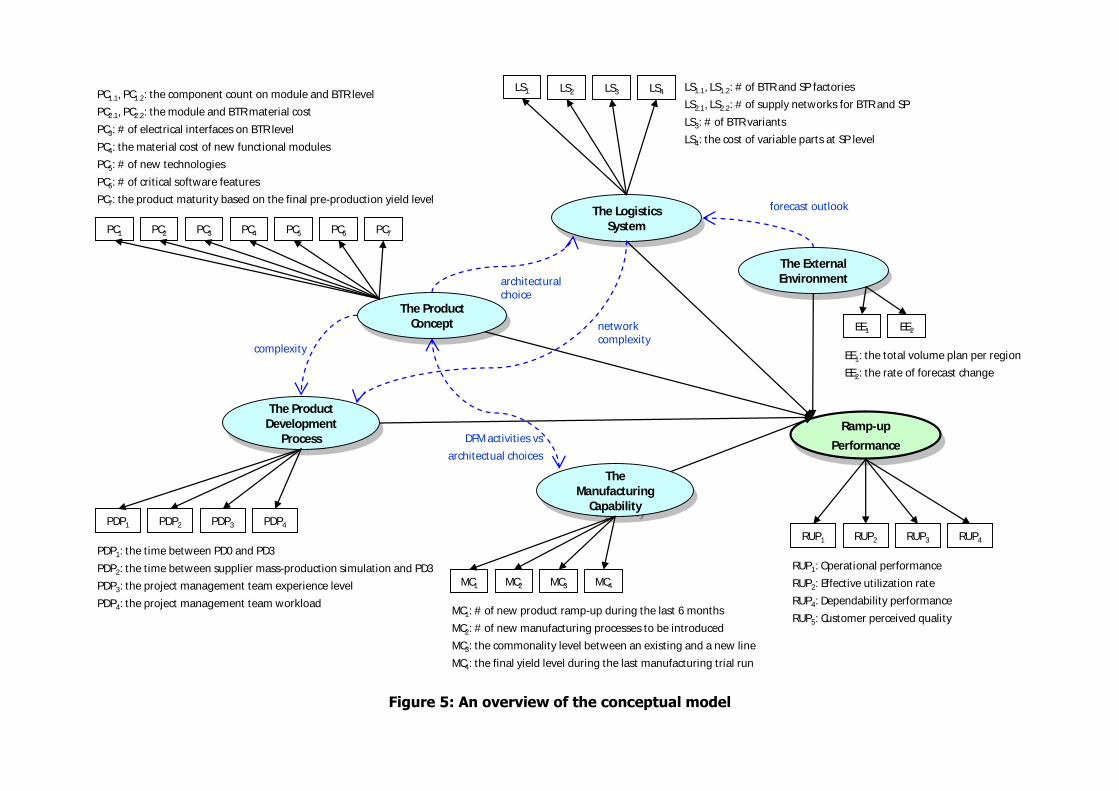
The Product
Development
Process
The Product
Development
ProcessRamp-up
Performance
Ramp-up
Performance
The Product
Concept
The Product
Concept
RUP1 RUP2 RUP3
The Logistics
System
The Logistics
System
The External
Environment
The External
Environment
RUP1: Operational performance
RUP2: Effective utilization rate
RUP4: Dependability performance
RUP5: Customer perceived quality
PC1 PC2 PC3
PC1.1, PC1.2: the component count on module and BTR level
PC2.1, PC2.2: the module and BTR material cost
PC3: # of electrical interfaces on BTR level
PC4: the material cost of new functional modules
PC5: # of new technologies
PC6: # of critical software features
PC7: the product maturity based on the final pre-production yield level
PC4 PC5
LS1.1, LS1.2: # of BTR and SP factories
LS2.1, LS2.2: # of supply networks for BTR and SP
LS3: # of BTR variants
LS4: the cost of variable parts at SP level
LS1 LS2 LS3 LS4
EE1: the total volume plan per region
EE2: the rate of forecast change
EE1 EE2
PDP1 PDP2 PDP3
PDP1: the time between PD0 and PD3
PDP2: the time between supplier mass-production simulation and PD3
PDP3: the project management team experience level
PDP4: the project management team workload
RUP4
PC6 PC7
PDP4
The
Manufacturing
Capability
The
Manufacturing
Capability
MC1 MC2 MC3
MC1: # of new product ramp-up during the last 6 months
MC2: # of new manufacturing processes to be introduced
MC3: the commonality level between an existing and a new line
MC4: the final yield level during the last manufacturing trial run
MC4
DFM activities vs
architectual choices
architectural
choice
forecast outlook
complexity
network
complexity
Figure 5: An overview of the conceptual model
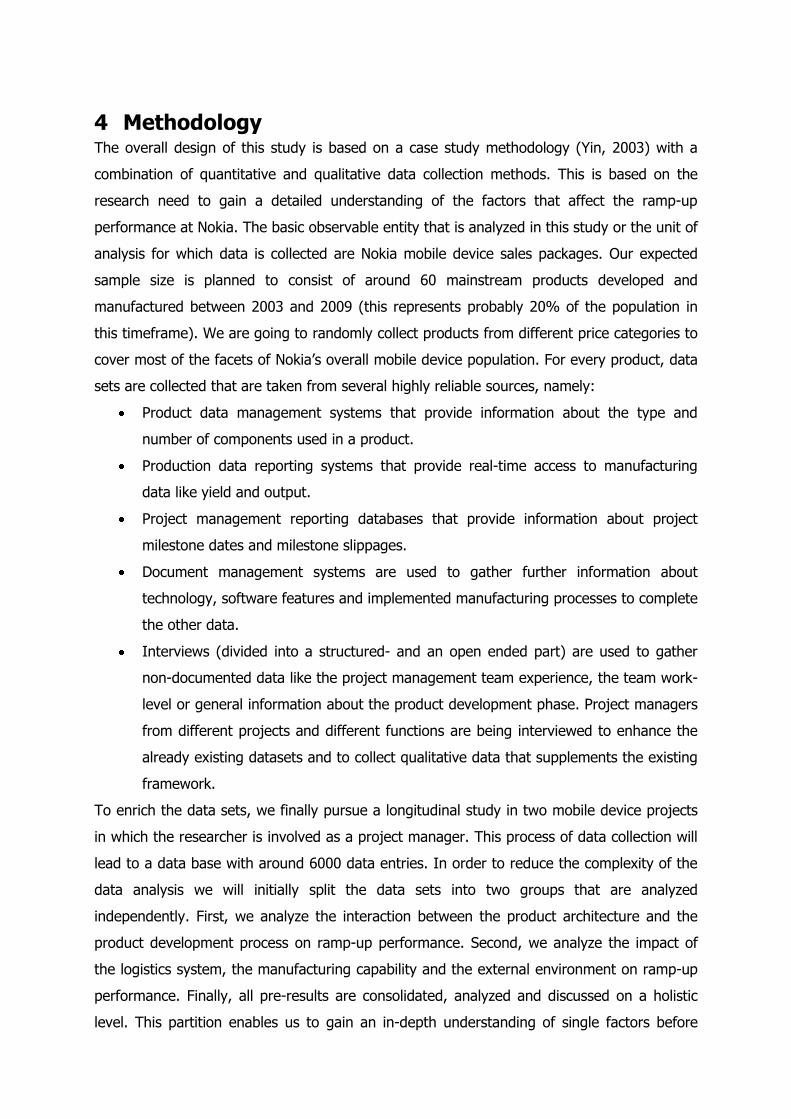
4 Methodology The overall design of this study is based on a case study methodology (Yin, 2003) with a
combination of quantitative and qualitative data collection methods. This is based on the
research need to gain a detailed understanding of the factors that affect the ramp-up
performance at Nokia. The basic observable entity that is analyzed in this study or the unit of
analysis for which data is collected are Nokia mobile device sales packages. Our expected
sample size is planned to consist of around 60 mainstream products developed and
manufactured between 2003 and 2009 (this represents probably 20% of the population in
this timeframe). We are going to randomly collect products from different price categories to
cover most of the facets of Nokia’s overall mobile device population. For every product, data
sets are collected that are taken from several highly reliable sources, namely:
Product data management systems that provide information about the type and
number of components used in a product.
Production data reporting systems that provide real-time access to manufacturing
data like yield and output.
Project management reporting databases that provide information about project
milestone dates and milestone slippages.
Document management systems are used to gather further information about
technology, software features and implemented manufacturing processes to complete
the other data.
Interviews (divided into a structured- and an open ended part) are used to gather
non-documented data like the project management team experience, the team work-
level or general information about the product development phase. Project managers
from different projects and different functions are being interviewed to enhance the
already existing datasets and to collect qualitative data that supplements the existing
framework.
To enrich the data sets, we finally pursue a longitudinal study in two mobile device projects
in which the researcher is involved as a project manager. This process of data collection will
lead to a data base with around 6000 data entries. In order to reduce the complexity of the
data analysis we will initially split the data sets into two groups that are analyzed
independently. First, we analyze the interaction between the product architecture and the
product development process on ramp-up performance. Second, we analyze the impact of
the logistics system, the manufacturing capability and the external environment on ramp-up
performance. Finally, all pre-results are consolidated, analyzed and discussed on a holistic
level. This partition enables us to gain an in-depth understanding of single factors before

35
analyzing combined and interrelated effects on the level of the general model. As we
hypothesize that our model factors are relevant predictors of ramp-up performance, we use
multiple regression analysis as the dominant statistical method (under the assumption that
the relationship is linear or can be linearized). This method will be supported by other
descriptive techniques like data plots, cross classification tables and factor analysis.
5 Conclusion This paper is the first step in exploring the essential characteristics that affect the product
ramp-up performance in Nokia’s mobile phones business group. It draws upon the existing
literature and the experience within Nokia to develop a conceptual model that describes the
relevant factors in a detailed and measurable way. As such it provides the foundation for the
next steps as we believe that research in this area has to be based on a well defined
construct to “secure” the further research that is mainly based on data collection and
statistical analysis. However, the final goal of this study is to find a predictive model that will
not only allow assessing past performance but also stimulate future action.
6 References Abernathy, W. J. and Clark, K. B. (1985) “Innovation: Mapping the Winds of Creative
Destruction”, Research Policy, Vol. 14, pp. 3-22.
Almgren, H. (2000) “Pilot production and manufacturing start-up: the case of Volvo S80”,
International Journal of Production Research, Vol. 38, No. 17, pp. 4577-4588.
Barnett, B. D. and Clark, K. B. (1996) “Technological Newness: An Empirical Study in the
Process Industries”, Journal of Engineering and Technology Management, Vol. 13, pp.
263-282.
Baumgarten, H. and Risse, J. (2001) “Logistikbasiertes Management des
Produktentstehungs-prozesses”, in Hossner, R. (ed.), Jahrbuch der Logistik,
Verlagsgruppe Handelsblatt, Düsseldorf, pp. 150-156 (in German).
Beamon, B. M. (1999) “Measuring Supply Chain Performance”, International Journal of
Operations & Production Management, Vol. 19, No. 3, pp. 275-292.
Boothroyd, G., Dewhurst, P., Knight, W. (1987) Product Design for Manufacture and
Assembly, 2nd edn., Marcel Dekker Inc., New York.
Bowersox, D. J., Closs, D. J., Cooper, M. B. (1999) Supply Chain Logistics Management,
McGraw-Hill, New York.
Brown, J., Devlin, J., Rolstadas, A., Andersen, B. (1997) “Performance Measurement: The
ENAPS Approach”, The International Journal of Business Transformation, Vol. 1, No. 2,
pp. 73-84.
36
Brown, S. L. and Eisenhardt, K. M. (1995) “Product Development: Past Research, Present
Findings and Future Directions”, Academy of Management Review, Vol. 20, No. 2, pp.
343-378.
Clark, K. B. (1989) “Project scope and project performance: the effect of parts strategy and
supplier involvement on product development”, Management Science, Vol. 35, No. 10, pp.
1247-1263.
Clark, K. B. and Fujimoto, T. (1991) Product Development Performance: Strategy,
Organization and Management in the World Auto Industry, Harvard Business School
Press, Boston.
Clawson, R. T. (1985) “Getting Things Done: Controlling the manufacturing start-up”,
Harvard Business Review, May-June, pp. 6-16.
De Toni, A. and Tonchia, S. (2002) “Performance measurement systems”, International
Journal of Operations & Production Management, Vol. 21, No. 1/2, pp.46-70.
Ehrlenspiel, K. (1995) Integrierte Produktentwicklung, Methoden für Prozeßorganisation,
Produkterstellung und Konstruktion, Carl Hanser Verlag, München (in German).
Eisenhardt, K. M. and Tabrizi, B. N. (1995) “Accelerating adaptive processes: product
innovation in the global computer industry”, Administrative Science Quarterly, Vol. 40, pp.
84-110.
Fagerström, B. and Jackson, M. (2002) “Efficient collaboration between main and sub-
suppliers”, Computers in Industry, Vol. 49, pp. 25-35.
Fine, C. (1998) Clockspeed: Winning Industry Control in the Age of Temporary Advantage,
Perseus Books, Massachusetts.
Fleischer, J., Spath, D. and Lanza, G. (2003) “Quality Simulation For Fast Ramp Up”, 36th
CIRP International Seminar on Manufacturing Systems, Saarland University, Germany.
Fleischer, M. and Liker, J. K. (1992) “The hidden professionals: product designs and their
impact on design quality”, IEEE Transactions on Engineering Management, Vol. 39, No. 3,
pp. 254-264.
Gerwin, D. and Barrowman, N. J. (2002) “An Evaluation of Research on Integrated Product
Development”, Management Science, Vol. 48, No. 7, pp. 938-953.
Gevers, J. M. P. (2004) It’s About Time We Align: Meeting Deadlines in Project Teams, PhD
Thesis at the Technical University of Eindhoven, Eindhoven.
Ghiani, G., Laporte, G. and Musmanno, R. (2004) Introduction to Logistics Systems Planning
and Control, John Wiley and Sons Ltd., Chichester, England.
Griffin, A. (1997) “The Effect of Project and Process Characteristics on Product Development
Cycle Time”, Journal of Marketing Research, Vol. 34, pp. 24-35.
37
Griffin, A. and Page, A. L. (1993) “An Interim Report on Measuring Product Development
Success and Failure”, Journal of Product Innovation Management, Vol. 10, pp291-308.
Gupta, A., Pawar, K. S., Smart, P. (2007) “New product development in the pharmaceutical
and telecommunication industries: A comparative study”, International Journal of
Production Economics, 106, pp. 41-60.
Hatch, N. W. and Wowery, D. C. (1998) “Process Innovation and Learning by Doing in
Semiconductor Manufacturing”, Management Science, Vol. 44, No. 11, pp. 1461-1477.
House C. H. and Price, R. L. (1991) “The Return Map: Tracking Product Teams”, Harvard
Business Review, January-February, pp. 92-100.
Joas, A. M. (2003) Measuring downstream logistics performance, Master Thesis at the
Helsinki School of Economics, Helsinki.
Kaplan R. S: and Norton, D. P. (1996) The Balanced Scorecard: Translating Strategy into
Action, Harvard Business School Press, Boston.
Kaski, T. (2002) Product Structure Metrics as an indicator of Demand-Supply-Chain
Efficiency: Case Study in the Cellular Network Industry, PhD Thesis at the Helsinki
University of Technology, Helsinki.
Kuhn, A., Wiendahl, H. P., Eversheim W. and Schuh, G. (2002) Fast Ramp Up - Schneller
Produktionsanlauf von Serienprodukten, Verlag Praxiswissen, Dortmund (in German).
Langowitz, N. S. (1987) “An exploration of production problems in the initial commercial
manufacture of products”, Research Policy, Vol. 17, pp. 43-54.
Lee, H. L. (2004) “The Triple-A Supply Chain”, Harvard Business Review, October, pp. 102-
112.
Mallick, D. N. and Schroeder, R. G. (2005) “An Integrated Framework for Measuring Product
Development Performance in High Technology Industries”, Production and Operations
Management, Vol. 14, No. 2, pp. 142-158.
McIvor, R., Martin, J. D., Matsuo, H., Ng, J. (1997) “Profiting from Process Improvement in
the New Semiconductor Manufacturing Environment”, Technology and Operations Review,
Vol. 1, No. 2.
Van der Merwe, E. (2004) A Conceptual Framework for Ramp-up Manufacturing, PhD Thesis
at the Cambridge University, Cambridge.
Möller, K. (2005) “Anlaufkosten in der Serienfertigung – Management und Controlling im
Rahmen eines Lebenszykluskonzepts, in Wildemann, H. (ed.) Synchronisation von
Produktentwicklung und Produktionsprozess: Produktreife – Produktanläufe –
Produktionsauslauf, TCW Transfer-Centrum, München (in German).
38
Neely, A., Gregory, M., Platts, K. (1995) “Performance management system design, A
literature review and research agenda”, International Journal of Operations & Production
Management, Vol. 15, No. 4, pp. 80-116.
Novak, S. and Eppinger, S. D. (2001) “Sourcing By Design: Product Complexity and the
Supply Chain”, Management Science, Vol. 47, No. 1, pp. 189-204.
Nyhuis, P. and Winkler, H. (2004) “Development of a Controlling System for the Ramp-up of
Production Systems”, International Conference on Competitive Manufacturing, University
of Hanover, Germany.
Pfohl, H. C. and Gareis, K. (2000) “Die Rolle der Logistik in der Anlaufphase”, Zeitschrift für
Betriebswirtschaft, Vol. 70, H. 11, pp. 1189-1214 (in German).
Pisano, G. P. (1995) The Development Factory, Harvard Business School Press, Boston.
Pisano, G. P. and Wheelwright S. C. (1995) “The New Logic of High-Tech R&D”, Harvard
Business Review, September-October, pp. 94-105.
PDMA (2006) NPD glossary, Product Development and Management Association,
http://www.pdma.org/, accessed 12-Mar-07.
Rodriguez-Toro, C., Jared, G. and Swift, K. (2004) “Product-development complexity metrics:
A framework for proactive-DFA implementation”, International Design Conference –
Design 2004, Cranfield University, United Kingdom.
Schuh, G., Kampker, B, Franzkoch, B. (2005) “Anlaufmanagement; Kosten senken –
Anlaufzeit verkürzen – Qualität sichern”, wt Werkstattstechnik online, Jahrgang 95, H. 5,
pp. 405-409.
Shapiro, B. P. (1997) “Can Marketing and Manufacturing coexist?”, Harvard Business Review,
September-October, pp.104-114.
Shina S. G. (2002) Six Sigma for Electronics Design and Manufacturing, McGraw-Hill.
Sink, S. and Tuttle, T. (1989) Planning and Measurement in your Organization of the Future,
Industrial Engineering and Management Press, U.S.
Smith, P. G. and Reinertsen D. G. (1998) Developing products in half the time, New Rules,
New Tools, 2nd edn., John Wiley & Sons, Inc., New York.
Sobek, D. K., Liker, J. K., Ward, A. C. (1998) “Another Look at How Toyota Integrates
Product Development”, Harvard Business Review, July-August, pp. 36-49.
Swink, M. (1999) “Threats to new product manufacturability and the effects of development
team integration processes”, Journal of Operations Management, Vol. 17, pp. 691-709.
Swink, M. and Hegarty, W. H. (1998) “Core manufacturing capabilities and their links to
product differentiation”, International Journal of Operations & Production Management,
Vol. 18, No. 4, pp. 374-396.

39
Tabrizi, B. and Walleigh, R. (1997) “Products: An Inside Look”, Harvard Business Review,
November-December, pp. 117-124.
Tatikonda M. V. and Stock, G. N. (2003) “Product Technology Transfer in the Upstream
Supply Chain”, Journal of Product Innovation Management, Vol. 20, pp. 444-467.
Terwiesch, C. and Bohn, R. E. (1998) "Learning and Process Improvement during Production
Ramp-Up", The Information Storage Industry Centre Report, 98-01.
Terwiesch, C., Chea, K. S. and Bohn, R. E. (1999) "An Exploratory Study of International
Product Transfer and Production Ramp-Up in the Data Storage Industry", The Information
Storage Industry Centre Report, 99-02.
Ulrich, K. T. and Eppinger, S. D. (1995) Product Design and Development, McGraw-Hill, New
York.
Voigt, K. I. and Thiell, M. (2005) “Fast Ramp-up – Handlungs- und Forschungsfeld für
Innovations- und Produktionsmanagement”, in Wildemann, H. (ed.) Synchronisation von
Produktentwicklung und Produktionsprozess: Produktreife – Produktanläufe –
Produktionsauslauf, TCW Transfer-Centrum, München (in German).
Wheelwright, S. C. and Clark, K. B. (1992) Revolutionizing Product Development, The Free
Press, New York.
Yoon, E. and Lilien, G. L. (1985) “New Industrial Product Performance: The Effects of Market
Characteristics and Strategy”, Journal of Product Innovation Management, Vol. 3, pp.
134-144.
Zirger, B. J. and Maidique, M. (1990) “A model of new product development: An empirical
test”, Management Science, Vol. 36, No. 7, pp. 867-884.
7 Additional sources Beamon, B. M. (1998) “Supply chain design and analysis: Models and methods”,
International Journal of Production Economics, 55, pp. 281-294.
Bertrand, J. W. and Fransoo, J. C. (2006) “Modeling and Simulation“, in Karlsson, C. (ed.)
Research in Operations Management, in process.
Bhuiyan, N., Gerwin, D. and Thomson, V. (2004) “Simulation of the New Product
Development Process for Performance Improvement”, Management Science, Vol. 50, No.
12, pp. 1690-1703.
Cargille, B. and Bliss, R. (2001) “How Supply Chain Analysis Enhances Product Design”,
Supply Chain Management Review, September/October, pp. 64-74.
Christopher, M. (1998) Logistics and Supply Chain Management, Strategies for Reducing
Cost and Improving Service, 2nd edn., Prentice-Hall, London.

40
Ceglarek, D., Huang, W., Zhou, S., Ding, Y., Kumar, R. and Zhou, Y. (2004) “Time-Based
Competition in Multistage Manufacturing: Stream-of-Variation Analysis (SOVA)
Methodology Review”, The International Journal of Flexible Manufacturing Systems, Vol.
16, pp. 11-44.
Eisenhardt, K. M. (1989) “Building Theories from Case Study Research”, The Academy of
Management Review, Vol. 14, No. 4, pp. 532-550.
Gunasekaran, A., Patel, C. and McGaughey, R. E. (2004) “A framework for supply chain
performance measurement”, International Journal of Production Economics, Vol. 87, pp.
333-347.
Hair, J. F., Black, W. C., Babin, B. J., Anderson, R. E. and Tatham, R. L. (2006) Multivariate
Data Analysis, 6th edn., Pearson Education Inc., New Jersey.
Häikiö, M. (2002) Nokia, The Inside Story, Edita Publishing, Helsinki.
Handfield, R. B. and Nichols, E. L. (1999) Introduction to Supply Chain Management,
Prentice Hall, New Jersey.
Helms, M. M. (ed.) (2006) Encyclopaedia of Management, 5th edn., Thomson Gale, New
York.
Krishnan, V. and Ulrich, K. T. (2001) “Product Development Decisions: A Review of the
Literature”, Management Science, Vol. 47, No. 1, pp. 1-21.
Lambert, M. and Pohlen, T. L. (2001) “Supply Chain Metrics” The International Journal of
Logistics Management, Vol. 12, No. 1, pp. 1-19.
Langowitz N. S. (1989) “Managing New Product Design and Factory Fit”, Business Horizons,
May-June, pp. 76-79.
Lea, B. and Fredendall, L. D. (2002) “The impact of management accounting, product
structure, product mix algorithm, and planning horizon on manufacturing performance”,
International Journal of Production Economics, Vol. 79, pp. 279-299.
Lee, H. L. (2004) “The Triple-A Supply Chain” Harvard Business Review, October 2004, pp.
102-112.
Preißer, A., Engel, S., Herwig, U. and Neeb, C. (1998) Promotionsratgeber, 3rd edn.,
Oldenburg Verlag, München (in German).
Sarkis, J. (2003) “Quantitative models for performance measurement systems - alternate
considerations”, International Journal of Production Economics, 86, pp. 81-90.
Slack, N., Chambers, S. and Johnston, R. (2001) Operations Management, 3rd edn., Pearson
Education Limited, Harlow.
Susmann, G. I. and Dean, J. W. (1992) “Development of a model for predicting design for
manufacturability effectiveness”, in Susmann, G., I. (eds.) Integrating Design and

41
Manufacturing for Competitive Advantage, Oxford University Press, New York, pp. 207-
228.
Voss, C., Tsikriktsis, N. and Frohlich, M. (2002) “Case research in operations management”,
International Journal of Operations & Production Management, Vol. 22, No. 2, pp. 195-
219.
Yin, R. K. (2003) Case Study Research, 3rd edn., Sage Publications, London.