what do consumers really think about advertising chasing
TRANSCRIPT
What do consumers really think about
advertising chasing them online?A quantitative study about consumers’ perception of behavioural marketing
Therese Gremlin
Vlada Rusakova
Business and Economics, master's level
2019
Luleå University of Technology
Department of Business Administration, Technology and Social Sciences

Acknowledgements This thesis is the result of 18 weeks of hard work and is the last part of our education to become
“civilekonomer”, specialising in marketing. First of all, we would like to thank the opportunity
of having our internship at the communication agency Vinter for giving us an insight and
interest in digital marketing. This was the basis for the choice of the topic for our study.
Furthermore, we would like to express our appreciation to the business program for providing
us with the right resources and knowledge to be able to make this thesis. Without the constant
practice in report writing in almost all the courses and the acquired knowledge of SPSS and
data analysis, we would not be able to execute this thesis properly.
We would also like to thank all the participants that took part in the experiments and offered
their free time to help us out. Without these people, we would not be able to get data needed to
research this topic. Last but not least, we would like to express a huge appreciation and
gratefulness to our supervisor Kerry Chipp. She has helped us during the entire time working
on this study and given us a lot of support and feedback throughout these 18 weeks. Her
expertise and insights were invaluable during this entire process and we could not have
completed it without her.
__________________________ ________________________
Therese Gremlin Vlada Rusakova

Abstract
Behavioral marketing is something that has received lots of attention due to growing awareness
around artificial intelligence (AI) and companies using this technology for marketing purposes.
However, the data collection practices have been receiving lots of critique for a while now and
therefore it is more important than ever to gain an insight of how the consumers perceive
behavioral online marketing. From this standpoint two research questions have been developed:
How do consumers’ attitudes towards behavioral marketing, affect their purchase intention?
and How does exposure to behavioral marketing affects purchase intention?
In order to answer these research questions, the experimental vignette methodology was used
to study digital natives, namely individuals between 18 and 30 years old. The experiment
provided the basis for the study combined with the questionnaire the participants were asked to
complete after the experiment. The experiment process consisted of two purchase scenarios that
had to be performed online: a purchase of a low degree behavioral marketing product (city bike)
and a purchase of a high degree marketing product (sneakers).
One of the most important findings of this research regarding consumers’ attitude’s impact on
purchase intention was the fact that trust has a bigger impact on the high involvement products
compared to the low involvement product. When it came to exposure to behavioral marketing,
the test objects that were exposed to behavioral ads had a higher likelihood to purchase a
sponsored item. Therefore, there is a positive relationship between how much behavioral
marketing a company use and the likelihood of a user purchasing a sponsored item. One of the
most important practical implications that can be derived from this study is that businesses need
to prioritize building a strong brand image prior to utilizing behavioral marketing.
Key terms: AI, big data, mass customization, micro targeting, behavioral marketing, purchase
intention and brand trust.

Sammanfattning Beteendemässig marknadsföring är något som fått större uppmärksamhet i och med betydelsen
som artificiell intelligens (AI) har fått samt något som företag använder sig av i
marknadsföringssyfte. Däremot har insamling av data länge kritiserats och frågan om hur
kunder faktiskt uppfattar annonser online har blivit mer och mer relevant. Utifrån detta
resonemang har dessa forskningsfrågor tagits fram: Hur påverkar konsumenternas attityd
gentemot beteendemässig marknadsföring deras köpavsikt? samt Hur påverkar exponeringen
av beteendemässig marknadsföring gentemot konsumenter deras köpavsikt?
För att kunna uppnå detta syfte har experimentell vignettes metodik använts för att studera
millenniegenerationen, alltså personer i åldrarna 18-30. Ett experiment gjorde grunden till
studien, tillsammans med ett frågeformulär som de var ombedda att göra efter experimentet.
Experimentet bestod av två olika köp som deltagarna skulle göra online; en produkt med låg
grad av beteendemässig marknadsföring (cykel) och en produkt med hög grad av
beteendemässig marknadsföring (skor).
Det viktigaste som kunde tas från denna undersökning när attityder undersöktes var att
förtroende gentemot ett företag eller varumärke hade en stark påverkan på köpavsikten.
Däremot är inverkan för förtroende starkare vid köpa av en produkt med hög grad av
beteendemässig marknadsföring jämfört med en produkt med låg grad av beteendemässig
marknadsföring. När det gäller exponeringen av beteendemässig marknadsföringen var den
största upptäckten att de deltagare som hade blivit utsatta för annonser till en högre grad hade
en större chans att köpa en produkt som var annonserad. Alltså, ju mer företag använder sig av
beteendemässig marknadsföring som är av relevans för konsumenten, desto mer sannolikt är
det att de köper just deras produkt. Den största praktiska implikationen som kunde utläsas var
att innan beteendemässig marknadsföring kan bli optimalt för företag måste de prioritera att
bygga ett starkt varumärke.

Table of Contents 1. Introduction 1
1.1 Background 1 1.2 Problem discussion 2 1.3 Purpose 2 1.4 Delimitation 3
2. Literature Review 4 2.1 Technology Acceptance Model 4 2.2 Conscious aversion vs unconscious adoption 6 2.3 Behavioral Marketing 7 2.4 Theoretical Framework 9
2.3.1 Perceived Usefulness 10 2.3.2 Perceived Ease of Use 11 2.3.3 Attitude Towards Use 11 2.3.4 Purchase intention 14
3. Methodology 15 3.1 Research Purpose 15 3.2 Research Approach 15 3.3 Data Collection - Experimental Vignette Methodology 16
3.4.1 Planning 17 3.4.2 Implementation 19 3.4.3 Reporting Results 23
3.5 The Quality of the Study 23 3.5.1 Validity 24 3.5.2 Reliability 24
3.6 Ethical Considerations 25 4. Empirical Data 26
4.1 The Participants 26 4.2 Regression Analysis for Low Degree Behavioral Marketing Product 26 4.3 Regression analysis for the high degree behavioural marketing product 29 4.4 Comparison between experimental group and control group 32
5. Analysis 35 5.1 Perceived Usefulness 35
5.1.1 Relevance of the ads 35 5.1.2 Degree of personalization 35
5.2 Perceived Ease of Use 36 5.2.1 Click through 36
5.3 Attitude Towards Use 36 5.3.1 Privacy concerns 36 5.3.2 Ad avoidance 37 5.3.3 Brand trust 37
5.4 Purchase intention 37 6. Conclusions 40
6.1 Main Findings 40 6.2 Practical Implications 41 6.3 Theoretical Implications 42 6.4 Limitations and Further Research 43
Appendix A – The experiment 48 Appendix B - questionnaire 49 Appendix C - the regressions 52

1
1. Introduction
This section will include the background to the subject. It will also discuss the research
discussion and the purpose of the study. This will end with research questions and delimitations
of the study.
1.1 Background
Online advertising has been present in our everyday life for a while now. Each coming year it
becomes more prevalent and constantly provides businesses with new tools to use in order to
reach their business goals (Macaulay & Mercer, 2018). Companies are constantly seeking
opportunities to make their operations more efficient and cost-effective and therefore invest in
development of new technologies that might potentially lead to higher revenues (ibid). That is
why giant corporations such as Amazon, Google and Facebook invest a large percentage of
their revenue streams in R&D (ibid).
According to Xu et al. (2016) artificial Intelligence (AI) that is a part of Big Data has received
a lot of attention and there is a reason behind it. Both technologies are used in multiple industries
for different purposes and are no longer a luxury that is exclusively available to large
businesses. Today even small firms are able to exploit these possibilities as they progress (ibid).
However, this study will only focus on AI and Big Data used for marketing
purposes. According to Wirth (2018) data collection for advertising purposes is not a new
concept and there are many organizations that track users digital history to sell this information
to online advertisers. Companies are capturing data during each step of consumers’ digital
journey (Barbu, 2014). The author continue stating that this data is later on being used for
micro-targeting and behavioural marketing.
It is however important to differentiate targeted and non-targeted advertisement. According to
Wirth (2018) non-targeted ads can be seen by anyone while targeted ads are specifically aimed
to reach a certain user based on their browsing history. In order to design targeted approach
there is a need for segmentation (ibid). According to Newman (2016) Big Data and AI algorithm
that is able to crunch that data, enables micro-targeting. The author moreover states that micro-
targeting is relatively new although it has its roots in loyalty forms that customers used to fill
out to tell businesses more about themselves. Nowadays there is no need to go through such
process considering the tremendous development of the technologies (ibid).

2
Newman further states that behavioural marketing is performed by an AI algorithm that is able
to automatically produce personalized and micro-targeting advertising. This type of advertising
strategy comes from mass customization from the beginning and is mainly built around users’
behaviours and actions instead of just demographics, which makes it a highly effective
approach (ibid). According to Newman (2016) behavioural marketing is a slightly older
approach that has been used since the 20th century. It is advertising based on customers’
behaviour and enables markers to more or less know how their customers will react to their
advertising since they use algorithms that show those ads to their “perfect” customer (Zarouali,
2017).
1.2 Problem discussion
Since behavioural advertising is relatively new and consumers have mixed feelings towards it,
the aim of this research is to help companies to understand if the attitudes that customers have
towards behavioural marketing can affect the purchase intention. There is also a need to
understand whether customers can adapt to behavioural marketing as they would adapt to any
other technology. Therefore technology acceptance model (TAM) is used as the base for the
framework to measure and evaluate how consumers perceive behavioural marketing.
1.3 Purpose
The purpose with this thesis is to collect knowledge about and the perception that customers
feel about data collection and behavioural marketing. The report wants to lead to more
understanding of this in the context that it may affect the customers and their purchase intention,
as well as their trust to the company. The aim is to see if there are any relationships between
different variables. Thus, if it for example is a connection between people who click on
advertised ads and the degree of trust a customer feel to the specific company.
The research questions that have been developed based on this reasoning are as followed:
RQ1: How do consumers’ attitudes towards behavioural marketing, affect their purchase
intention?
RQ2: How does exposure to behavioural marketing affects purchase intention?
3
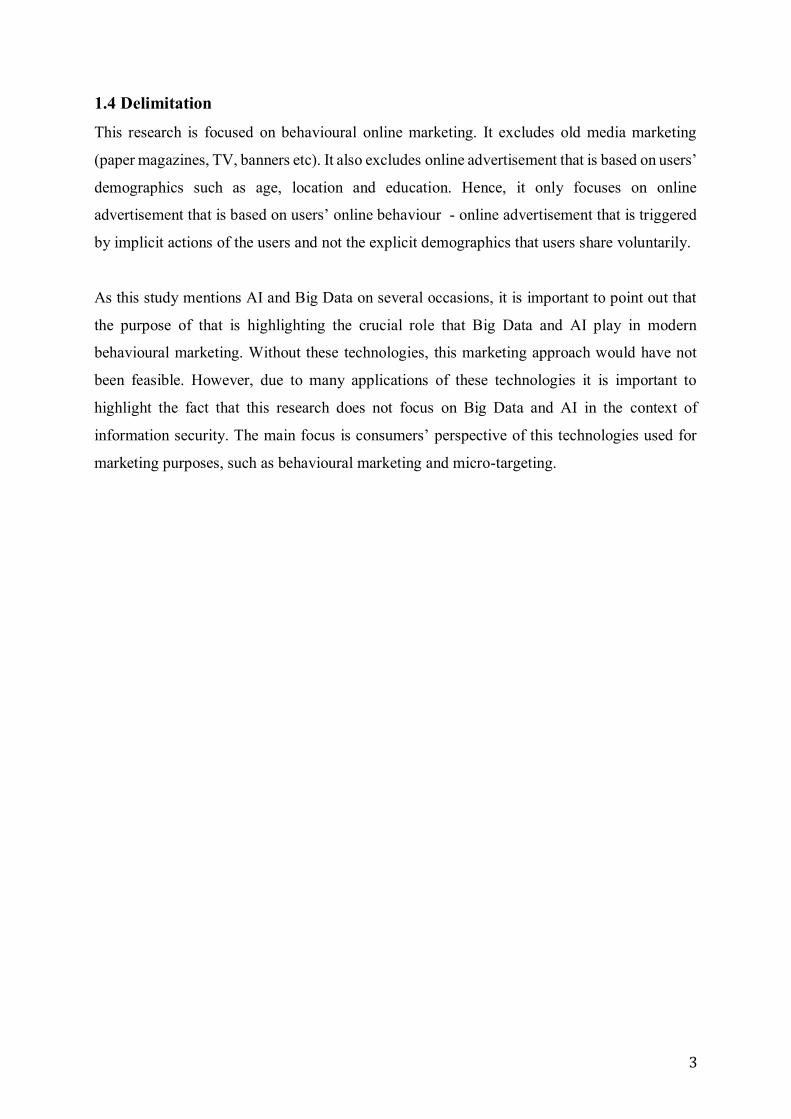
1.4 Delimitation
This research is focused on behavioural online marketing. It excludes old media marketing
(paper magazines, TV, banners etc). It also excludes online advertisement that is based on users’
demographics such as age, location and education. Hence, it only focuses on online
advertisement that is based on users’ online behaviour - online advertisement that is triggered
by implicit actions of the users and not the explicit demographics that users share voluntarily.
As this study mentions AI and Big Data on several occasions, it is important to point out that
the purpose of that is highlighting the crucial role that Big Data and AI play in modern
behavioural marketing. Without these technologies, this marketing approach would have not
been feasible. However, due to many applications of these technologies it is important to
highlight the fact that this research does not focus on Big Data and AI in the context of
information security. The main focus is consumers’ perspective of this technologies used for
marketing purposes, such as behavioural marketing and micro-targeting.
4
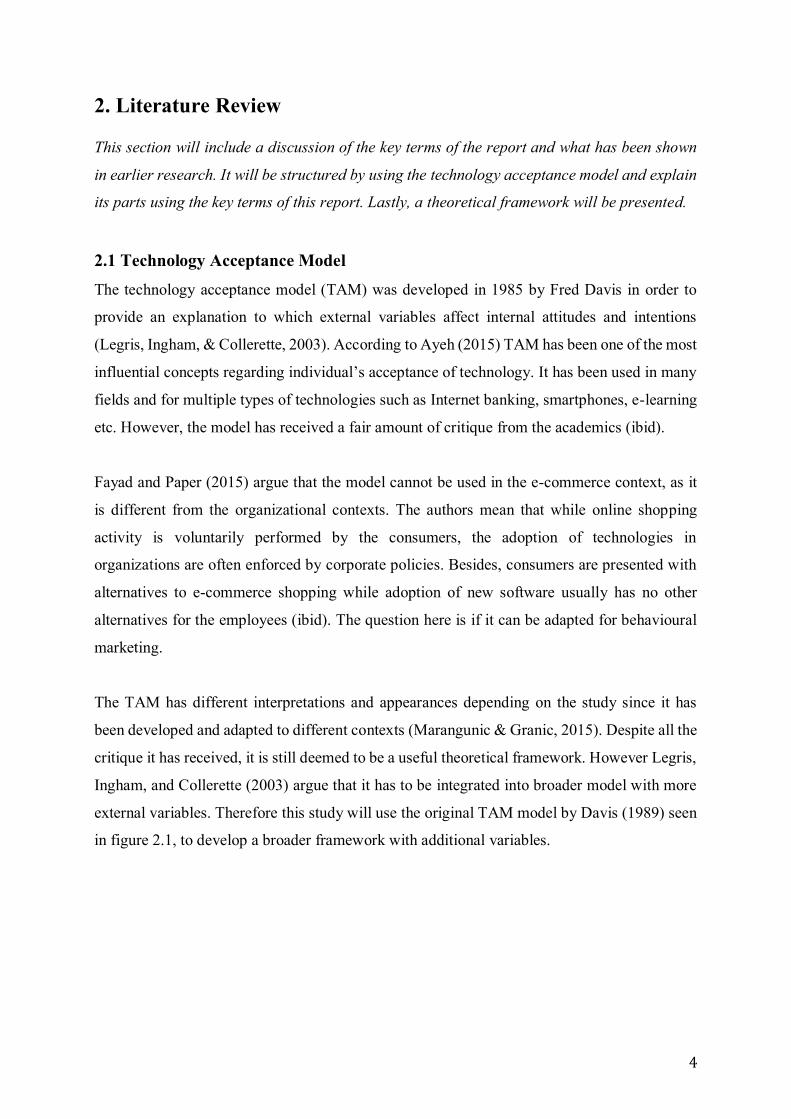
2. Literature Review
This section will include a discussion of the key terms of the report and what has been shown
in earlier research. It will be structured by using the technology acceptance model and explain
its parts using the key terms of this report. Lastly, a theoretical framework will be presented.
2.1 Technology Acceptance Model
The technology acceptance model (TAM) was developed in 1985 by Fred Davis in order to
provide an explanation to which external variables affect internal attitudes and intentions
(Legris, Ingham, & Collerette, 2003). According to Ayeh (2015) TAM has been one of the most
influential concepts regarding individual’s acceptance of technology. It has been used in many
fields and for multiple types of technologies such as Internet banking, smartphones, e-learning
etc. However, the model has received a fair amount of critique from the academics (ibid).
Fayad and Paper (2015) argue that the model cannot be used in the e-commerce context, as it
is different from the organizational contexts. The authors mean that while online shopping
activity is voluntarily performed by the consumers, the adoption of technologies in
organizations are often enforced by corporate policies. Besides, consumers are presented with
alternatives to e-commerce shopping while adoption of new software usually has no other
alternatives for the employees (ibid). The question here is if it can be adapted for behavioural
marketing.
The TAM has different interpretations and appearances depending on the study since it has
been developed and adapted to different contexts (Marangunic & Granic, 2015). Despite all the
critique it has received, it is still deemed to be a useful theoretical framework. However Legris,
Ingham, and Collerette (2003) argue that it has to be integrated into broader model with more
external variables. Therefore this study will use the original TAM model by Davis (1989) seen
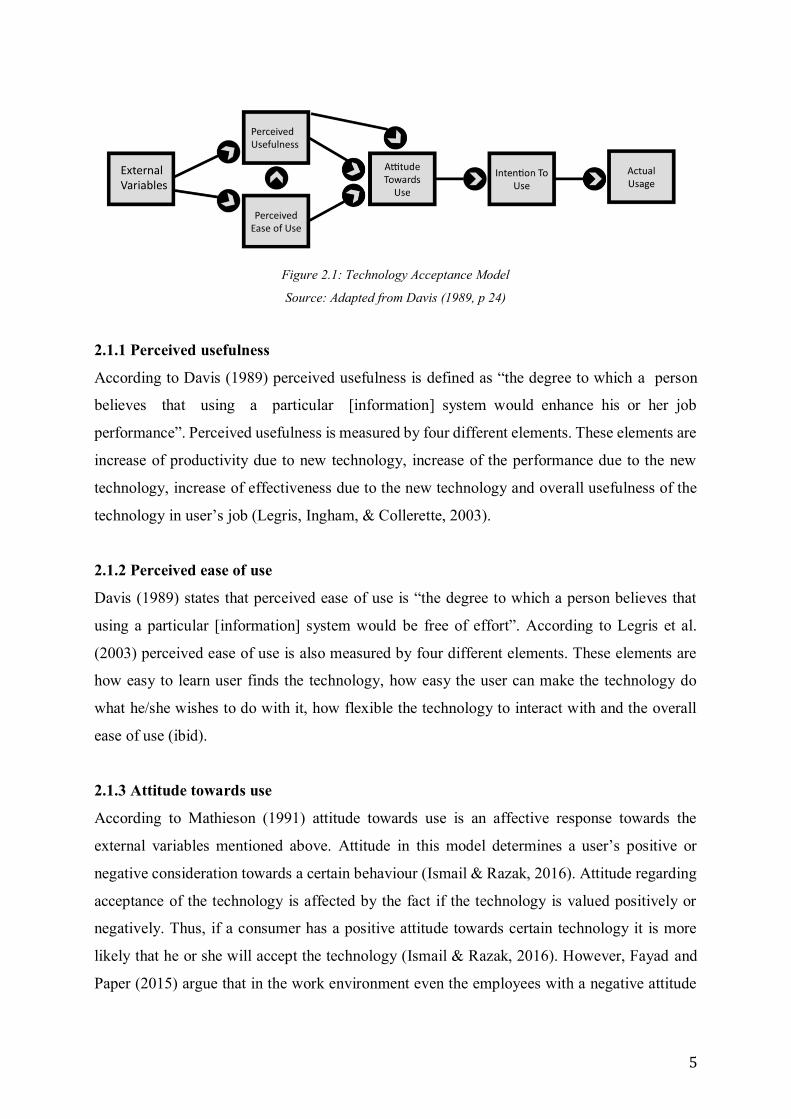
in figure 2.1, to develop a broader framework with additional variables.
5
Figure 2.1: Technology Acceptance Model
Source: Adapted from Davis (1989, p 24)
2.1.1 Perceived usefulness
According to Davis (1989) perceived usefulness is defined as “the degree to which a person
believes that using a particular [information] system would enhance his or her job
performance”. Perceived usefulness is measured by four different elements. These elements are
increase of productivity due to new technology, increase of the performance due to the new
technology, increase of effectiveness due to the new technology and overall usefulness of the
technology in user’s job (Legris, Ingham, & Collerette, 2003).
2.1.2 Perceived ease of use
Davis (1989) states that perceived ease of use is “the degree to which a person believes that
using a particular [information] system would be free of effort”. According to Legris et al.
(2003) perceived ease of use is also measured by four different elements. These elements are
how easy to learn user finds the technology, how easy the user can make the technology do
what he/she wishes to do with it, how flexible the technology to interact with and the overall
ease of use (ibid).
2.1.3 Attitude towards use
According to Mathieson (1991) attitude towards use is an affective response towards the
external variables mentioned above. Attitude in this model determines a user’s positive or
negative consideration towards a certain behaviour (Ismail & Razak, 2016). Attitude regarding
acceptance of the technology is affected by the fact if the technology is valued positively or
negatively. Thus, if a consumer has a positive attitude towards certain technology it is more
likely that he or she will accept the technology (Ismail & Razak, 2016). However, Fayad and
Paper (2015) argue that in the work environment even the employees with a negative attitude
6
towards the technology will still adopt it because they perceive it as beneficial for their
performance. Hence attitude dimension is not applicable in every context (ibid).
2.1.4 Intention to use
Intention to use is influenced by attitude towards use (Muk, 2015). According to Davis (1989)
intention to use it user’s determination to use the new technology. Fayad & Paper (2015) claim
that intention to use is usually measured for both voluntary and mandatory use, which does not
give an accurate understanding of technology adoption. However, Muk (2015) argues that there
is another external variable that influences intention to use, which is social influence and what
other people think about the technology and how they perceive it.
2.1.5 Actual usage
Actual usage is resulted by intention to use (Davis, 1989). According to Legris et al. (2003) this
is the final destination for the user. If all the previous dimensions had a positive effect on the
user’s perception of technology, he or she will end up accepting and adopting the new
technology (ibid).
2.2 Conscious aversion vs unconscious adoption The contrast between conscious and unconscious is significant in the behavioural marketing
context. Therefore we want to test whether the TAM model will be applicable for consumers’
adoption of behavioral marketing. Although many studies have shown that consumers often
experience conscious aversion towards behavioural advertisement, the unconscious might just
be the contrary (Newman, 2016). According to Machouche et al. (2017) studies have shown
that ads have an unconscious effect on consumers’ behaviour. This is due to the exposure to
ads that supports building an implicit positive attitude towards advertising brands. This happens
on the unconscious level and triggers positive feelings towards brands even when the user does
not recall being showed any kind of advertising stimuli (Machouche, Gharbi, & Elfidha, 2017).
The author continues by explaining that an important matter with unconscious processes is the
fact that an individual sees an advertisement while he or she is doing something different.
Therefore advertisement is not being perceived by conscious and the ad is placed by the
unconscious and processed in a similar way as the rest of the information being consumed. As
a result, users will have “open guards” towards advertisement, as it is not being perceived as
such (Machouche, Gharbi, & Elfidha, 2017). What differentiates behavioural marketing from
7
other forms of marketing and, what makes it so effective, is the fact that it relies on individual’s
behaviour, actions and intentions. Those factors are often implicit and not explicitly expressed
by a consumer (Newman, 2016).
2.3 Behavioral Marketing AI solutions enable behavioural advertising. This marketing approach is definitely effective
and commonly seen from a positive point of view (Newman, 2016). Most of the literature
focuses on business’ narrative without taking consumers’ perception in the long run into
consideration. According to Boerman et al. (2017) there are a very low percentage of consumers
that are aware of behavioural advertising and many of those who might know often have their
misconceptions about how it works. Most empirical studies show that although some users do
appreciate tailored ads the majority of consumers prefer companies not to do it (Boerman,
Kruikemeier, & Zuiderveen Borgesius, 2017).
Behavioural marketing has its roots in behaviourism. One of the forms of behaviourism is
classical conditioning. This happens when a certain reaction in human behaviour is stimulated
by reward and can be trained to be repeated. Advertising that is based on consumers’ behaviour
is obviously very effective. Today marketers do not have to guess on how their leads will react
to certain ads because algorithm shows those ads to their “perfect” customer (Zarouali, 2017).
Boerman et al. (2017) further states that AI and Big Data changes the landscape of behavioural
marketing, making it to something new and highly effective. However, he continues saying that
there are a few definitions of behavioural advertising although all of them have two things in
common. First one includes collecting and monitoring consumers’ digital track and second is
generating of individually targeted ads. Behavioural marketing is a data-driven technology
based approach that is able to generate highly targeted ads based on users’ browsing behaviours.
Data that is used for this purpose are often collected through cookies, search history, social
media use etc. (Boerman, Kruikemeier, & Zuiderveen Borgesius, 2017).
According to Xu et al. (2016) Big Data has been a buzzword for a while now and there is a
reason why. This data is classified as enormous in its volumes, unstructured and very complex,
by product generated by users online activity. It comes from mobile apps, social media and
other Internet based sources. Facebook operates 500 terabytes of data daily, which only is from
one social platform, there are many more. Big Data gives behavioural marketing new
8
perspective. While smaller sets of data were not that effective for behavioural marketing, Big
Data measured in terabytes gives marketers detailed 360 degrees view of each potential
customer (Xu, Ramirez, & Frankwick, 2016).
When being under constant monitoring and surveillance especially after “data breaches” such
as Cambridge Analytica, consumers are more aware of what companies are doing with their
data and this might have an impact on their trust towards companies and brands (Newman,
2016). The younger generation has a quite different relationship towards advertising especially
when it comes to their online presence. According to research done by the Internet foundation
in Sweden more than 50 percent of younger people in Sweden use AdBlocker (Davidsson &
Thoresson, 2017). According to Newman (2016) one of the reasons behind this is the growing
suspicion towards how consumers’ digital trace is being used.
According to Wirth (2018), AI is what makes sense of Big Data in behavioural marketing.
Being able to analyse large volumes of unstructured and complex data, AI can with the help of
algorithm use these insights to adjust advertising towards each individual behaviour. This
algorithm works better than human experts and can predict users’ future actions based on their
previous behaviour. Leveraging on predictive models and machine learning AI is an extremely
powerful addition to behavioural marketing often even seen as the game changer (ibid).
According to Wirth (2018) an AI solution should be capable of learning, knowledge
representation, reasoning and prediction or planning. It is possible for companies to create
hybrid AI solutions as long as they know how to use what is available. They do not need costly
technology since they are able to use cloud services. In the marketing world, these AI solutions
are already replacing human expertise in some forms, especially in online targeting. Thus,
Wirth means that it is time to embrace AI and continue using it in marketing. (Wirth, 2018)
On the other hand, Schmeiser (2017) means that modern advertising technologies tailor ads to
viewers by either inferring interests from the page the visitor is currently viewing (search
results, special interest content) or, in the case of behavioural advertising, by tracking
consumers across sites and building a profile of interests. This allows third parties access to a
large portion of a consumer’s browsing history, and therefore the positive of this is that
customers get tailored ads that match their interests (ibid). Nevertheless, the amount of literature
on consumers’ perspective is scarce (Boerman, Kruikemeier, & Zuiderveen Borgesius, 2017).

9
At the same time studies have shown, according to Machouche et al. (2017), that ads have an
unconscious effect on consumers’ behaviour. People are exposed to the advertising while they
are doing something different and is therefore not seen to be conscious (Ibid).
2.4 Theoretical Framework For this study TAM will be considered from a slightly different perspective. Given its
usefulness on measuring consumers’ readiness to accept a certain technology (Mathieson,
1991), it was interesting to find out whether this model is applicable for unconscious technology
acceptance. Regarding all of this information above, this chapter will now describe how all of
these key terms go together. In order to explain this closer TAM is used. Behavioural ads allow
brands to target the unconscious implicit behaviours and are proven effective even for the
individuals that express conscious aversion towards behavioural ads (Machouche, Gharbi, &
Elfidha, 2017). Therefore the unconscious technology adoption model (UTAM) was developed
in order to study consumers’ unconscious adoption of behavioural advertising.
Figure 2.2: Unconscious Technology Acceptance Model (UTAM)
Figure 2.2 illustrates the technology acceptance model from unconscious perspective, that from
now on is called UTAM. It showcases user’s unconscious journey through acceptance of
behavioural advertising. The journey starts with external variables, which are listed under the
categories “Perceived Usefulness” and “Perceived Ease of Use”.
Since this model will measure unconscious technology acceptance it is important to establish
which external factors are relevant here. Micro-targeting has undoubtedly huge benefits for

10
businesses since it can drastically increase their ROI (Wirth, 2018). But there are also benefits
for the consumers, which might not be as explicit. These benefits can be further analysed
through the scope of TAM. To understand how consumers’ technology acceptance is impacted
by perceived usefulness and perceived ease of use, these were broken down into further
elements.
2.3.1 Perceived Usefulness
In this study perceived usefulness can be defined as how enhancing users find targeted
behavioural ads when it comes to making a decision about a purchase. This way the model
might be able to predict and measure users’ acceptance of the technology (Ayeh, 2015).
Perceived usefulness can be broken down into the following components: the degree of
relevance of the ads is to users’ need and the degree of personalization (Zarouali, 2017). For
the degree of personalization, this report will consider mass customization and micro targeting.
For the degree of relevance to the need this report will focus on behavioural marketing and
retargeting.
According to Newman (2016) behavioural marketing is certainly not a new approach and has
been around since the beginning of the 20th century. Already, at that time scientists and
business professionals started to realize the connection between human behaviour and ways it
can be stimulated by advertisement. In 1934 one of the first documented practices of
behavioural marketing took place when it was noted that during political elections, politicians’
slogans were much more welcomed when voters just had received a free meal (Newman, 2016).
Mass customization is also a concept that has become relevant, because of the new technology.
According to Tien (2011) mass customization (MC) is “meeting the needs of a segmented
customer market, with each segment being a single individual”. However, customization is
defined by the same author as “meeting the needs of a customer market that is partitioned into
an appropriate number of segments, each with similar needs”. MC enables customers to design
products online with different features according to their preferences and many companies in
different industries has invested a lot in order to offer customization to their customers.
Especially, since it has become possible to use MC toolkit online, where customers are able to
try customizing before buying (Tien, 2011).

11
According to Zarouali (2017) micro-targeting was born as a result of mass-customization. As
mass customization allows companies to adjust their products towards each individual
customer, micro-targeting enables creation of highly personalized message, assess how this
message will be received and deliver precisely to the right individual hence the high degree of
personalization (ibid). Tene and Polonetsky (2012) however state that it is important to
differentiate targeted and non-targeted advertisements. While non-targeted ads can be seen by
anyone, targeted ads are specifically aimed to reach a certain user based on their browsing
history. In order to design targeted approach there is a need for segmentation (Tene &
Polonetsky, 2012). Big Data and AI algorithm that is able to crunch that data enables micro-
targeting (Newman, 2016). Micro-targeting is relatively new although it has its roots in loyalty
forms that customers used to fill out to tell businesses more about themselves. Nowadays there
is no need to go through such process considering the tremendous development of the
technologies (ibid).
2.3.2 Perceived Ease of Use
Perceived ease of use can be further explained, as there is no need for consumers to do their
research online about the products they are planning to purchase (Zarouali, 2017). In the UTAM
perceived ease of use is measured by how likely the consumer will click on the ad. The
probability of clicking on ads is highly dependent on the ads’ position therefore if the ads are
conveniently located the probability that a user will click on them will highly increase
(Richardson, Dominowska, & Ragno, 2007).
Users often experience “ad blindness” which means that they do not notice whether there are
ads or not and they often perceive it as organic results (McDonald & Cranor, 2009). According
to Liu et al. (2015) click through rate is a commonly used definition in digital marketing, which
is an indicator of marketing effect. Internet users click on ads mainly either because they have
actively searched for a certain product or without actively exploring. The higher the likelihood
of a user clicking on the ad, the easier it is to use the technology (Liu, Yuan, Liu & Li, 2015).
2.3.3 Attitude Towards Use
Attitude towards use in UTAM is explained and measured by users’ privacy concerns, ad
avoidance and trust towards brands. Customers with high degree of ad avoidance are skilled at

12
utilizing ad avoidance techniques and hence will take longer time to accept micro-targeting
unconsciously (Johnson, 2013).
Boerman et al. (2017) explain that in general, there are a very low percentage of consumers that
are aware of behavioural advertising and many of those who might know often have their
misconceptions about how it works. Internet users are not always fully aware of marketing
tactics utilized by brands. Many consumers find it irritating or alarming when they start noticing
highly targeted behavioural advertising (Boerman, Kruikemeier, & Zuiderveen Borgesius,
2017). This does not come as a surprise since it will take a consumer around 201 hours a year
to read through all the privacy agreements to each website. Most empirical studies show that
although some users do appreciate tailored ads the majority of consumers prefer companies not
to do it (Boerman, Kruikemeier, & Zuiderveen Borgesius, 2017).
According to Boerman et al. (2017) behavioural marketing may be seen as a category of
personalized advertising, which is altered to each individual human being. Nevertheless,
behavioural marketing as it used to be could be tailored advertising based on all different kinds
of data. As an example of how it was executed initially with customer loyalty cards (Boerman,
Kruikemeier, & Zuiderveen Borgesius, 2017). Yu et al. (2019) explained that behavioural
marketing goes beyond personalization based of customer’s data and mainly utilizes
behavioural patterns of users. Hence, privacy concerns that impact consumers’ attitude towards
behavioral marketing adoption (Yu, Zhang, Lin & Wu, 2019).
According to Boerman et al. (2017) it has been shown that some ads are more accepted by
customers, while others are avoided and disliked. The biggest problem customers seem to have
of behavioural marketing online is that their privacy is being disrupted. The authors further
explain that a study has found that people that think that privacy is a problem are less likely to
trust companies to take good care of their information online. Furthermore, people that feel that
privacy is not a problem and more willing to share information are more positive to online
behavioural marketing (ibid). However, Yu et al. (2019) states that it has also been shown that
people often say that they are concerned with the privacy but have no problem giving out
personal information if they get a small benefit from it. Boerman et al. (2017) further explains
that customers also seem to like getting relevant ads that actually can give them something.
Thus, personalization is positive for some customers. When it comes to ads and their interest
from customers, research has found that the ads that consider the motives that customers have
13
of being online increase the attention, memory and attitudes towards the ad. In turn, this affects
the clicks and purchases (Boerman, Kruikemeier, & Zuiderveen Borgesius, 2017). According to Newman (2016) there are two main theories that try to explain consumers’ attitude
towards micro-targeting and behavioural marketing. The first one is called social presence
theory and the second one is social exchange theory (ibid). Johnson (2013) explains that the
social presence theory claims that knowing how their data is being used to make consumers
feel as if someone is watching them when they are browsing the web. The social exchange
theory explains that consumers’ perception of things depends on the balance between cost and
reward. Thus, when the customer perceives that a product adds value when a certain amount of
their data is being used, it will most likely lead to positive attitude towards micro-targeted ads
(Johnson, 2013).
If the advertised product does not seem to add any value while exploiting behavioural data, this
leads to a negative attitude towards such advertisement (Boerman, Kruikemeier, & Zuiderveen
Borgesius, 2017). Johnson (2013) further states that if consumers’ attitude towards micro-
targeting can be explained by social exchange theory, if the advertised product has high value
for the user, micro-targeting perceived as useful. On the other side, if the product doesn’t add
value to customers, micro-targeting is perceived as very invasive and awakes privacy concerns
(Johnson, 2013).
Trust is another variable that affects consumers’ attitude added to our framework UTAM.
According to Chaudhuri and Holdbrook (2002) brand trust is defined as “the willingness of the
average consumer to rely on the ability of the brand to perform its stated function”. Trust
involves a company’s willingness to act in the best interests of the customers. It is therefore
important for companies to think about reliability, safety and honesty. Brand trust leads to brand
loyalty or commitment since, trust creates exchange relationships that are highly valued
(Chaudhuri & Holbrook, 2001). Ha (2014) explain that brand trust is very important in order to
increase customer loyalty. Familiarity of a brand generates a higher degree of trust, as long as
it is positive. Trust is one of the most important components in the relationship between the
company and customer (ibid).
According to Kwon and Lennon (2007) there are perceived risks in purchasing products online.
The perceived risk has been shown to negatively affect the response to online companies. Thus,
14
if the perceived risks by customers are lower, the higher acceptance on online purchase and
intention to purchase customer has. Researchers have found that brand knowledge, brand name
and brand familiarity influence the perceived risk that customers feel when shopping online. It
is also influenced by the performance of the company, such as website design (Kwon & Lennon,
2007).
2.3.4 Purchase intention
In UTAM, the purchase intention is the last dimension of the model. Since it is not possible to
measure the actual usage we have decided to delimit the model to four-step model instead of
the original five-step model. Purchase intention appears when the consumer has developed an
actual willingness to act toward an object or brand and it is therefore part of the decision making
process (Hutter, Hautz, Dennhardt, & Füller, 2013). According to Wang et al. (2012) the
customer decision making process and marketing communication has changed. People can now
talk to each other online and have more access to information about the different products and
this will affect their purchase decision. Peer communication affects attitudes towards the brand,
which increased the purchase intention (ibid). When customers make a purchase decision they
therefore rely more than ever on social media and their network (Hutter, Hautz, Dennhardt, &
Füller, 2013).

15
3. Methodology
This section will include the method that has been used in order to fulfil the purpose of the
report. It will also discuss the research approach as well as the quantitative survey and how it
is built. It also includes a discussion on the past literature that has been made on the subject
and the sample of the study.
3.1 Research Purpose
According to Saunders et al. (2009) there are three types of research purpose; exploratory,
descriptive and explanatory. A study of exploratory nature is used to clarify an understanding
of a problem and is often made by interviews, focus groups or a search of the literature. A
descriptive study, on the other hand, aims to research a specific type of people, events or
situations and is often an extension of an exploratory research. Lastly, an explanatory research,
aims to find relationships between different variables (Saunders, Lewis, & Thornhill, 2009).
This study consists of an explanatory research purpose, were a causal study was used.
According to Gregory and Muntermann (2011) a causal study is designed to test whether there
is any dependency between variables. Through manipulation of interdependent variables it is
possible to not only see whether these variables are related or not but also detect and predict
how independent variables could affect the dependent variables (ibid). As opposite to
descriptive design, causal study allows manipulating those variables in order to study the effect
it has and compare it to non-manipulating scenarios, e.g. browsing with cookies versus
browsing in incognito mode (ibid).
3.2 Research Approach There are different approaches when conducting a study; deductive, inductive or abductive.
According to Saunders et al. (2009) the deductive approach is to test theory, where the study is
built on previous studies and tested to a specific situation or phenomena. The authors continue
with an inductive approach that is to gather new theory, where the study is built on observations,
which is generalized (ibid). According to Gregory and Muntermann (2011) the study can also
be characterized as abduction which, they further explain as a method that “...consists of making
a ‘surprising’ observation or experience that is perceived to be incompatible with our present
understanding and knowledge which triggers one to create a guess…”.
16
All of these approaches are to some extent used in any type of theorizing. Gregory and
Muntermann (2011) explain these different types of approaches in an interesting and
educational way. They explain that in the beginning of a theory researchers often use abduction,
where the researcher makes a surprising observation to create hypotheses that can solve the
digression. The second step is constructing a theory, which refers to the deductive approach.
This approach is to elaborate a theory by for example using hypothesis to find relationships
between abstract concepts and also use existing theories when possible. Lastly, there is
justifying the theory, which refers to the inductive approach. This approach is not as creative
since the creative part has already been done (ibid). This study is made through a deductive
approach, where relationships between different variables are tested.
3.3 Data Collection - Experimental Vignette Methodology
According to Saunders et al. (2009) there is both secondary and primary data. However, this
study consist of primary data. Primary data is data that the researchers have been collecting and
are therefore new data (ibid). This study consists of an experiment and a questionnaire, which
is a quantitative study. According to Aguinis and Bradley (2014) the aim with doing an
experiment is to study causal links. For instance, if a variable changes, an experiment examines
whether this will affect another dependent variable or not. The same authors continue
explaining that a classic experiment consists of two groups; experimental group and control
group. For the experimental group, the researchers plan a manipulation to study the effect of it.
For the control group no manipulation is made. In both groups the dependent variable is
measured before and after the manipulation of the independent variable (Aguinis & Bradley,
2014). According to Saunders et al. (2009) a comparison can be made by doing this. If the two
groups get exactly the same results and outcomes, the manipulation did not achieve any result
and had no impact on the participants (ibid).
In order to answer the research questions of this study an experimental vignette methodology
was used. According to Atzmuller and Steiner (2010) vignette methodology is a “carefully
constructed description of a person, object or situation, representing a systematic combination
of characteristics”. One of the distinctive features of this methodology is the fact that the result
is not limited to be written only but allows researchers to use different media formats such as
images, video etc. (ibid). When conducting an experiment using an experimental vignette
methodology Aguinis and Bradley (2014) continues presenting three different steps that should
be followed; Planning, Implementation and Reporting of Results.
17
3.4.1 Planning
According to Aguinis and Bradley (2014) the first part of planning is to decide if EVM fits the
research being made. This method, as mentioned before, is used when the participants are
exposed to scenarios were the researchers want a natural environment in order to get close to
the exact same result as in the reality (ibid). The EVM was suitable for this research since this
research aim was to examine how digital natives react to behavioural marketing online and their
perception on it, as well as what can affect consumers to click on these ads.
The second part is to decide the type of EMV. According to Aguinis and Bradley (2014) there
are two types of EVM; paper people studies and policy capturing and conjoint analysis. A paper
people study refers to a vignette methodology that comes in written form, asking the
participants to for example make a decision or express behavioural preferences. The other type,
policy capturing and conjoint analysis, is when the participants are given scenarios that has
manipulated variables. The aim with this method is to see if the manipulations affect the
decision, without the participants’ knowledge (Aguinis & Bradley, 2014). The type of EMV
used in this research was paper people study, where the participants were presented with two
different tasks, buying two different products. The experimental sheet with the instructions,
given to the participants is presented in appendix 1. After the experiment was done, the
participants had to complete a follow up questionnaire, which aimed to capture covariates of
whether they noticed the ads, or not and how it impacted their purchasing decisions.
Moreover, two different types of product to ask the participants to purchase had to be found by
the researchers. Through empirical testing, the authors of the study were able to identify a low
and a high degree products targeted for behavioural marketing. The test was conducted through
searching for multiple products online with the intention to purchase. During the entire process
all the ads were carefully observed and noted down. The goal with this test was to analyse
which products heavily use retargeting and which ones barely do it. After performing a number
of searches that imitated the planned experiment, the best alternatives were identified. Sneakers
were determined as a high degree behavioural marketing product while a bicycle were identified
as low. By high degree behavioural marketing product, this study implies products that
intensely rely on retargeting and behavioural micro-targeting, e.g., shortly after visiting a
certain website or searching after a certain product, consumers receive an overwhelming
amount of ads, banners and sponsored posts on social media. As it was close to impossible to
select a product that does not use behavioural marketing at all, the low degree behavioural

18
marketing product had also shown a certain amount of behavioural retargeting ads, but not as
much.
The third part of the planning stage is to choose the research design, which according to
Aguinis and Bradley (2014) can be; between-person, within-person and mixed research design.
The authors continue to explain between-person design, where every participant takes part in
one single vignette. Within-person design is that every participant takes part in the exact same
vignettes. The mixed design is that the participants are divided into groups, where the
participants in the same group gets the same vignettes. However, the groups have different
vignettes (ibid). This study had a within-person design where all the participants had the same
task but a manipulation in the form of triggering ads were made for the experimental group.
Figure 3.1: The divide of the groups and the products that the participants were asked to purchase.
For this study, the participants were divided into two groups that is shown in the figure above:
experimental group and control group. As the aim of this report was to study consumers’
perception of behavioural marketing, the experimental group was exposed to behavioural
advertisement through manipulation. The control group was not exposed to manipulation hence
has not received behavioural ads. For the experiment, the participants of the study were exposed
to realistic scenarios that are specifically constructed to assess their intention to purchase.
According to Tsalis et al. (2017) private browsing mode or incognito mode is designed to
protect users’ data generated while surfing the web, which is not stored afterwards. Contrary to
normal browsing mode, when all the data in the form of cookies and cache is stored for

19
authorization purposes, which aim to create a more user friendly browsing experience (ibid).
As behavioural ads are in need of users’ cookies in order to be triggered, private mode was
chosen for the control group, while the experimental group searched with their already stored
cookies and the manipulation.
Next part is to choose the level of immersion, which according to Aguinis and Bradley (2014)
can be described as the realism of the EVM. This has been done as well as possible, considering
the limitations of the study. The participants have been able to choose their own location when
doing the experiment, in order to make the surroundings as realistic as possible and increasing
the external validity. However, they were instead asked to screen record what they did.
Moreover, the task that they were asked to do was realistic, thus buying two products online.
This is something that is further explained in the validity and reliability section of the report.
The fifth part of the planning process is to specify the number and levels of the manipulated
factors. According to Aguinis and Bradley (2014) there are two different approaches that can
be used for this part; attribute-driven design and actual derived cases. The attribute-driven
design refers to different tasks that all have been manipulated, thus the manipulated factors is
easier to assess. The authors continue describing the actual derived cases approach, which
creates a more realistic result where a generalization can be made of the targeted population.
The factors are depicted in figure 3.1 above.
The last part of the planning process is to choose the number of vignettes. According to
Aguinis and Bradley (2014) it is important to have the right amount of vignettes for the research.
This study consists of two groups going two different tasks, see figure 3.1 above. The tasks for
the experimental group will be manipulated, while the same tasks for the control group will not
be manipulated. Thus, the study consists of two vignettes depicted in rows in figure 3.1 above.
3.4.2 Implementation
According to Aguinis and Bradley (2014), the first part of implementation is to decide the
sample and number of participants. According to Saunders et al. (2009) having a sample of the
targeted population enables researchers to gather less data. Normally it is not possible to
research a whole population and therefore it is important to research an appropriate sample of
the population (ibid).
20
Sample and Number of Participants
Saunders et al. (2009) continue explaining that there are two types of sampling methods;
probability or representative sampling as well as non-probability or judgmental sampling.
Probability sampling is when the probability of one person being chosen is known and usually
equal for all. This method is often used when doing a survey or experimental research. Non-
probability sampling is the opposite, when the probability that one person to be chosen is not
known. With this method it is impossible to make statistical conclusions on the characteristics
of the population. However, generalizations can still be made, but not on statistical grounds
(ibid). Since this study will be a quantitative study based on an experiment and questionnaire,
but has a limited timeframe a non-probability sampling and random assignment to test groups
were determined the most appropriate.
Furthermore Saunders et al. (2009) continues explaining the purposive sampling that is that the
researchers select cases that fit the research in order to answer the research questions in the best
way. This is often used when the sample size is very small and the selection should depend on
the research questions. There are five types of purposive sampling; extreme case sampling,
heterogeneous sampling, homogeneous sampling, critical case sampling and typical case
sampling (ibid). The extreme case sampling, also referred to as deviant sampling, is as it sounds
unusual or special cases that is researched in order to better understand the more typical cases.
Heterogeneous sampling, also referred to as maximum variation sampling, is a sample where
the respondents are not alike. This can create a lot of different answers but when any pattern
occurs this is of high interest. The opposite of this is homogeneous sampling where the
sampling consists of a particular sub-group. In this type of sample the respondents are very
similar and the researchers can study this sub-group in-depth. Critical case sampling is when
researchers collect critical cases and create understanding of each case in order to find logical
generalisations about them. Lastly, there is typical case sampling that is used to provide an
illustrative profile of what is typical (Saunders, Lewis, & Thornhill, 2009).
This study will consist of a homogeneous sampling since the sub-group millennials are the
interest. By having a homogeneous sampling this minimize the influence of external variables
and thereby increase the internal validity. This group was chosen in this context partly since
they use social media the most and partly since they are shopping online in a wider extent. It
has also been shown that more than half in the ages 16 to 25 and 40 percent in the ages 26 to
35 use AdBlockers (Davidsson, 2017). This is clearly particularly prominent among millennials
21
as they are known as digital natives, according to the report it also indicates that the attitude
towards targeted ads and ads in general have changed for this group of people. Since there are
differences in what people think of when discussing digital natives, this study refers to people
born before year 2001 and after 1989. Thus, people that are between the ages 18 to 30.
It was also important to select the sample size of the research. According to Saunders et al.
(2009) if the sample size is larger it is less likely that an error in generalization of the population
arise. This depends on the amount of time and money that is invested in collecting, checking
and analysing the data (Saunders, Lewis, & Thornhill, 2009). In our case, the study consists of
30 people in the experimental group and 30 in the control group. Thus, 60 participants in total.
Location of the Experiment
The next step, according to Aguinis and Bradley (2014), is for the researcher to select a setting
and time that is of favour for the experiment. In this study it was important that the experiment
was as realistic as possible. Therefore, the decision was made to ask the participants to screen
record, while they did the experiment were they felt comfortable. In this way the experiment
got as realistic as possible since they normally do not have a person behind their backs looking
when they purchase a product.
Data Analysis
The last part of implementing the EVM is to choose the method for analysing the data.
According to Saunders et al. (2009) quantitative data need to be processed and analysed, since
it in its own form does not say that much for most people. Therefore, graphs, charts and statistics
helps to explain, explore and present relationships and trends in the collected data. Quantitative
data can be both categorical and numerical, where categorical data refers to data that cannot be
measured numerically (Saunders, Lewis, & Thornhill, 2009). Multiple regression was used to
test the model.
The first step of data analysis is to clean the data in order to be able to use SPSS correctly.
Answers were therefore given numerical codes. For the experiment three steps of the process
were identified. These steps were found to be the most common through purchasing activity
among the participants of the experiment. Once all the screen recordings had been viewed, the
actions that took place repeatedly were ordered to identify the three steps that the study will
analyse. These steps are; search initiation, browsing and purchase.

22
In the first step, search initiation, the authors searched if the participants clicked on sponsored
ads, organic results and if they looked for a specific company or brand. These different variables
were given a 1 (Yes) or a 0 (No). Moreover, in the second step of the experiment, browsing,
the authors looked if the participants continued directly to purchase the product, if they stayed
on the website but looked at other products or if they bounced back to search. These variables
were given 1 (purchase), 2 (stay) and 3 (bounce back). For the last step of the process, purchase,
it was interesting to see if the participants actually bought a product that had been a sponsored
ad or not. This step was given 1 for yes they purchased a sponsored ad product and 0 for no.
For the post-test questionnaire there were dichotomous questions (yes or no), multiple-choice
questions and nominal scale questions. The coding for the dichotomous questions was simply
a 1 for a “Yes” and 0 for a “No”. For the nominal scale question there were a range between 1
and 6 in order to not have a middle alternative and therefore forced the participants to take a
stand. 1 stands for “Non”, “Not likely at all”, “Not satisfied at all”, “Not at all” and “Never”
and 6 stands for “Very likely”, “Very satisfied”, “Very much”, “Very often”, “Very conscious”
and “A lot”.
According to Sanders et al. (2009) a regression analysis is made to see if there are any
relationship between an independent and dependent variable. The same author continues
discussing that it enables the researchers to assess the strength of the relationship. A regression
analysis is when researchers test the relationship between one dependent variable and an
independent variable, while a multiple regression analysis has one independent variable and
two or more dependent variables (Saunders, Lewis, & Thornhill, 2009). According to the same
author, the different coefficient that is the result of the regression has different meanings and is
described in the table below.

23
Table 3.2: Meaning of the coefficients
Source: Saunders, Lewis, and Thornhill (2009, p. 461-465)
This study consists of both multiple regression analysis and regression analysis. The multiple
regression analysis is used in order to see the relationships within the UTAM-model in the
theoretical framework. The other regression analysis is used to test other relationships that are
of interest for the study.
3.4.3 Reporting Results
According to Aguinis and Bradley (2014) the last step of the EVM is to discuss the transparency
of the presentation of the results and methodology. This is important in order to give all the
needed information that future research can need in order to develop their study (ibid). In order
to make this study as transparent as possible all the regressions that has been made is attached
in the appendix. The description that was given to the participants on what they were asked to
do in the experiment is also attached in the appendix, as well as the questionnaire.
3.5 The Quality of the Study
According to Rust and Cooil (1994) it is important to know the reliability and validity of a study
in order to measure the quality of the research. By taking the reliability and validity into
consideration before conducting a research it avoids misconceptions for the participants
(Saunders, Lewis, & Thornhill, 2009).

24
3.5.1 Validity
According to Saunders et al. (2009) validity is if the study researched what was meant to be
researched. There are both internal and external validity. Internal validity is, according to the
same author, that the questionnaires measure what was intended to be measured. The internal
validity of this study increased since the authors looked at already done the research, and
discussed this in the literature review before conducting the questionnaire and experiment, as
well as theoretical framework. The questionnaire and experiment was also tested by an outsider
in order to see if the questions and experiments could be answered correctly and interpreted
correctly. This was later discussed and modified before conducting the research. An experiment
for the researchers was also made, when finding a low- and high degree behavioural marketing
product, which was mentioned before. This also increased the validity of the research.
The external validity refers to generalisations of the study according to Saunders et al. (2009).
This study does not focus on any type of industry or company. Therefore this study is able to
be generalised and the suggested implementations for companies can be used regardless of
industry. However, the study focuses on millenials and can therefore not be generalized to all
populations.
According to Aguinis and Bradley (2014) external validity is also increased by putting the
participants in their natural settings. The same authors discuss that external validity is achieved
through providing the participants with tasks that are adjusted and manipulated. Vignette
methodology allows researchers to observe and record the data from the experiment in different
forms than just written. This creates a more realistic and lifelike scenario for the experiment
and therefore increases external validity according to Aguinis and Bradley (2014). External
validity of the study is achieved through placing the participants into their realistic environment,
which was their home, or whichever place they found comfortable. To increase the realism of
the experiment, the tasks that were provided to the participants were lifelike. This has a positive
effect on external validity of the study according to Aguinis & Bradley (2014).
3.5.2 Reliability
In order for a study to be valid, it must be reliable. According to Saunders et al. (2009)
“reliability refers to the extent to which your data collection techniques or analysis procedures
will yield consistent findings”. Thus, if the findings can be generalized. This study was not
25
connected to a specific organisation or industry and can therefore be generalized and
implemented by all businesses. However, the study focused on millennials and therefore not
appropriate to generalize between different populations. Different age groups will behave
differently online and therefore the result will probably not be the same for other populations.
According to Saunders et al. (2009) there are different threats to the reliability of a research;
participant error, participant bias, observer error and observer bias. Participant error is how the
result will be affected depending on what time or day the participants participate in the research.
This can be avoided by choosing a more neutral time. Participant bias is when the participants
say what they think the researchers want to hear. Observer error is for example when different
people conducting interviews, which makes it possible for asking questions in different ways
and therefore get different results. This can be avoided by structuring the research. Lastly, there
is observer bias, which is when researchers interpreters the results differently (ibid).
The biggest participant error that could be found for this study was that the participants could
have a higher purchase intention in the beginning of the month and a lower in the end of the
month, since the salary comes at the beginning of every month. In order to avoid this the
decision to send out the experiments in the middle of the month was made. By doing this, it
gave the participants the most natural time doing the experiment. Participant bias was also
avoided since the participants did not know exactly what was researched. The participants only
got a document that had a description on what they were supposed to do. This was done in
steps, making it easier for the participants not to misinterpret what they were supposed to do.
This document was also written by the same person, which meant that the observer error also
was avoided. Lastly, observer bias was avoided, discussing the result and interpreted together.
3.6 Ethical Considerations
This report does not contain plagiarism, duplicate submissions or figure manipulations, which
according to Navalta, Stone and Lyons (2019), are the most common examples of unethical
practices in research methodology. It is especially important to follow sound research practices
when conducting research evolving human test objects. This study has therefore followed the
sound research practices where authorship was respected and references to all the secondary
data was provided using APA reference system. The report a strictly complies to non-
discriminatory and objectivity principles. The authors of the study do not have any financial
interests involved with the study whatsoever and have conducted the research independently
from any organization besides Luleå University of Technology.

26
4. Empirical Data
This chapter consists of an explanation of the participants of the study and the empirical data
of the experiment and follow up survey. A regression analysis has been made and the result of
it will be presented and discussed in this chapter.
4.1 The Participants The study consists of 59 experiments. 31 of the participants were in the control group and 28
were in the experimental group. 61 percent of the participants are males and 39 percent are
females. In figure 4.1 below, the distribution of gender in each group is shown. It is clearly
shown in the figure that the experimental group consisted of more females than males and the
control group consisted of more males than females.
Table 4.1: the distribution of gender in the control- (incognito) and experimental group (search engine).
There is a logical explanation to the gender distribution among the participants. The participants
in the control group were recruited for the experiment through the company Game:In, which is
an e-sport centre located in Luleå. By helping us with our research, the participants received a
reward in terms of free gaming time in exchange for participating in the experiment. This has
resulted in more males participating since they are Game:In’s overall target group. For the
experimental group, the majority of the participants were friends and colleges in the target age
as the authors. Since the authors happen to have more female friends and colleges thus females
were more likely to participate in the experiment and therefore the majority of the experimental
group’s participants were females. This is something that has to be taken into consideration
when analysing the results in regard to gender distribution among the test objects.
4.2 Regression Analysis for Low Degree Behavioral Marketing Product The empirical data is presented through the scope of the theoretical model below (UTAM) in
order to test the model and analyze the links between the model construct. In this chapter, the
data is presented for the low degree behavioral marketing product.

27
Figure 2.2: Unconscious Technology Acceptance Model (UTAM)
One way analysis of variation (Anova) was used to determine whether the fact that the
participants clicked on the ads in the beginning of the experiment can predict the likelihood of
them purchasing an advertised item. Only the results with P-value (statistical significance)
below 0,05 were considered. In the figures below, the regression tables for the purchase of the
bike are shown.
The model summary gives a measurement of the force of the independent variables explanation.
R Square that is seen in table 4.1 below is 21.1 percent. The higher the value, the better
explanatory power. This means that 21.1 percent of the variation in the dependent variable is
explained by the independent variable. The adjusted R square is also of relevance since we have
more than one dependent variable. In the figure below, this number is a bit lower - 15,6 percent.
This value is used since R Square can overestimate the explanatory variance. This means that
15,6 percent of the variation in the dependent variable is explained by the independent variable.
This supports the link between click on ads and purchase intention in the model.
Table 4.2: The model summary of the low degree behavioural marketing product.
In table 4.3 below, there are two different variables that are of interest. The first one is the B,
which is the independent variables’ coefficient (unstandardized coefficient). This coefficient
shows what affect one step up in the independent variable has on the dependent variables. Thus,
if the independent variables (perceived usefulness of interesting ads, perceived usefulness of
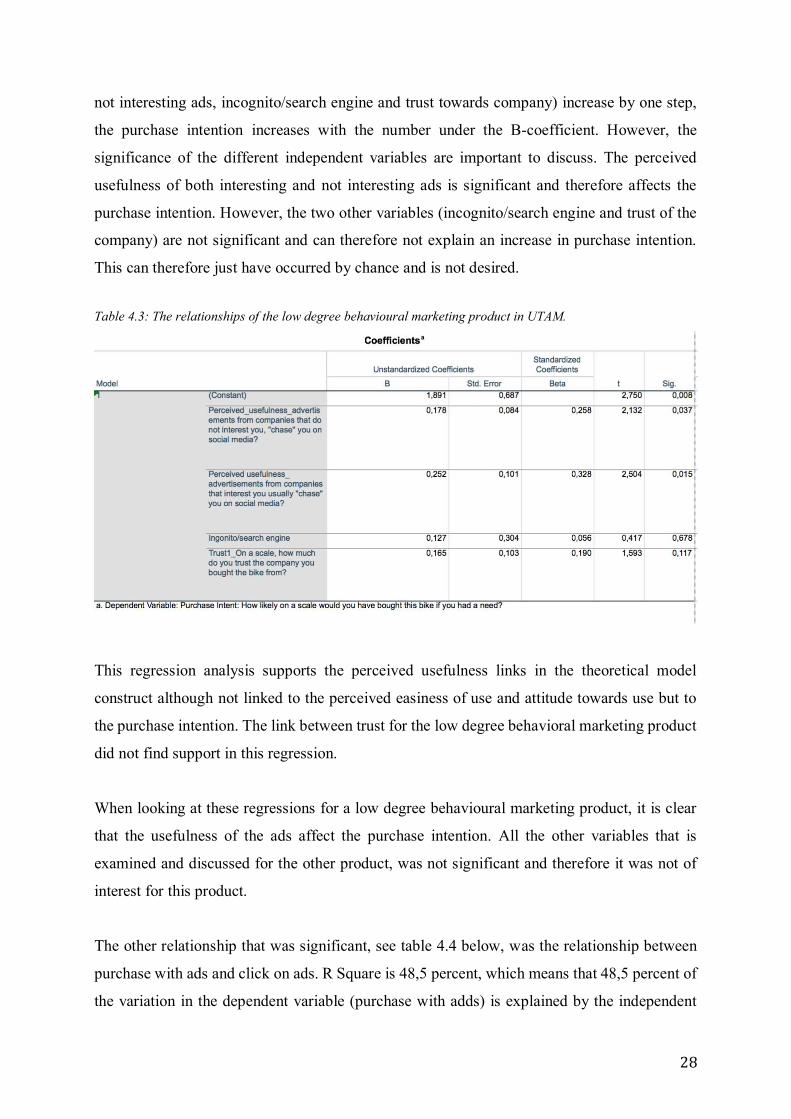
28
not interesting ads, incognito/search engine and trust towards company) increase by one step,
the purchase intention increases with the number under the B-coefficient. However, the
significance of the different independent variables are important to discuss. The perceived
usefulness of both interesting and not interesting ads is significant and therefore affects the
purchase intention. However, the two other variables (incognito/search engine and trust of the
company) are not significant and can therefore not explain an increase in purchase intention.
This can therefore just have occurred by chance and is not desired.
Table 4.3: The relationships of the low degree behavioural marketing product in UTAM.
This regression analysis supports the perceived usefulness links in the theoretical model
construct although not linked to the perceived easiness of use and attitude towards use but to
the purchase intention. The link between trust for the low degree behavioral marketing product
did not find support in this regression.
When looking at these regressions for a low degree behavioural marketing product, it is clear
that the usefulness of the ads affect the purchase intention. All the other variables that is
examined and discussed for the other product, was not significant and therefore it was not of
interest for this product.
The other relationship that was significant, see table 4.4 below, was the relationship between
purchase with ads and click on ads. R Square is 48,5 percent, which means that 48,5 percent of
the variation in the dependent variable (purchase with adds) is explained by the independent
29
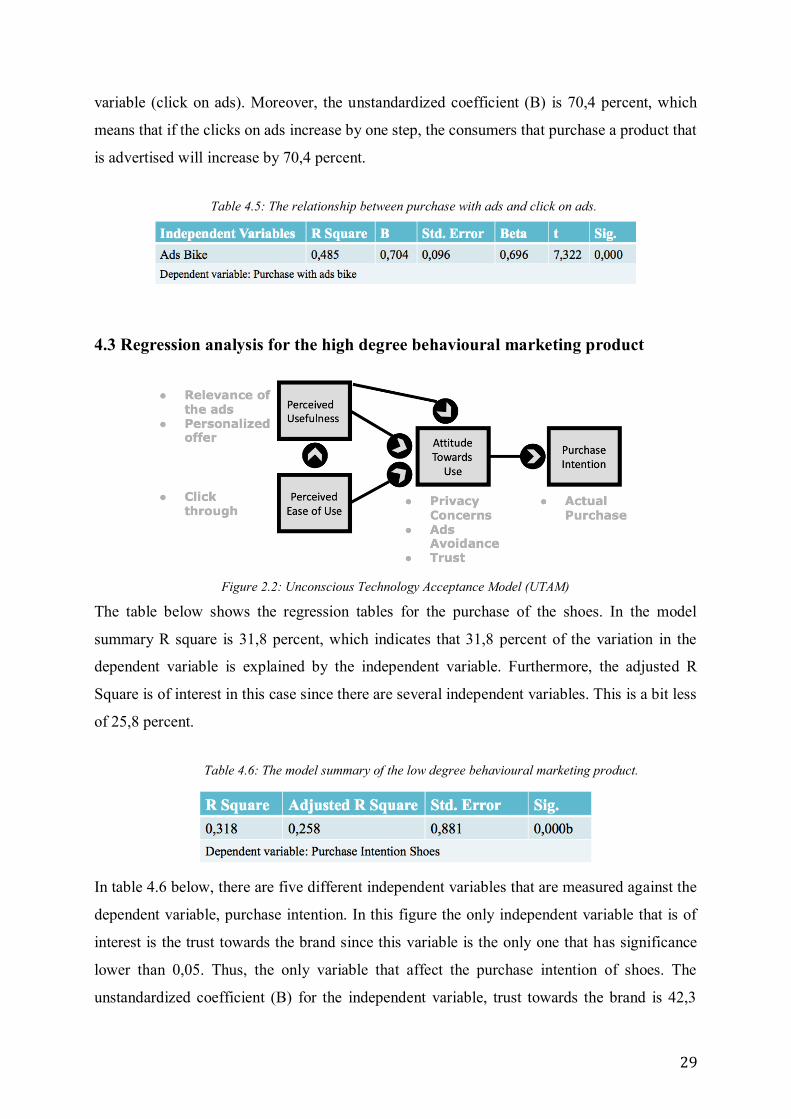
variable (click on ads). Moreover, the unstandardized coefficient (B) is 70,4 percent, which
means that if the clicks on ads increase by one step, the consumers that purchase a product that
is advertised will increase by 70,4 percent.
Table 4.5: The relationship between purchase with ads and click on ads.
4.3 Regression analysis for the high degree behavioural marketing product
Figure 2.2: Unconscious Technology Acceptance Model (UTAM)
The table below shows the regression tables for the purchase of the shoes. In the model
summary R square is 31,8 percent, which indicates that 31,8 percent of the variation in the
dependent variable is explained by the independent variable. Furthermore, the adjusted R
Square is of interest in this case since there are several independent variables. This is a bit less
of 25,8 percent.
Table 4.6: The model summary of the low degree behavioural marketing product.
In table 4.6 below, there are five different independent variables that are measured against the
dependent variable, purchase intention. In this figure the only independent variable that is of
interest is the trust towards the brand since this variable is the only one that has significance
lower than 0,05. Thus, the only variable that affect the purchase intention of shoes. The
unstandardized coefficient (B) for the independent variable, trust towards the brand is 42,3

30
percent. Thus, if the trust towards the brand increases by one step, the purchase intention for a
high behavioural marketing product increases with 42,3 percent. This supports the link between
trust (the attitude dimension) and purchase intention in the theoretical model (UTAM).
Table 4.7: The relationships of the high degree behavioural marketing product in UTAM.
The connection to purchasing a product that has been advertised
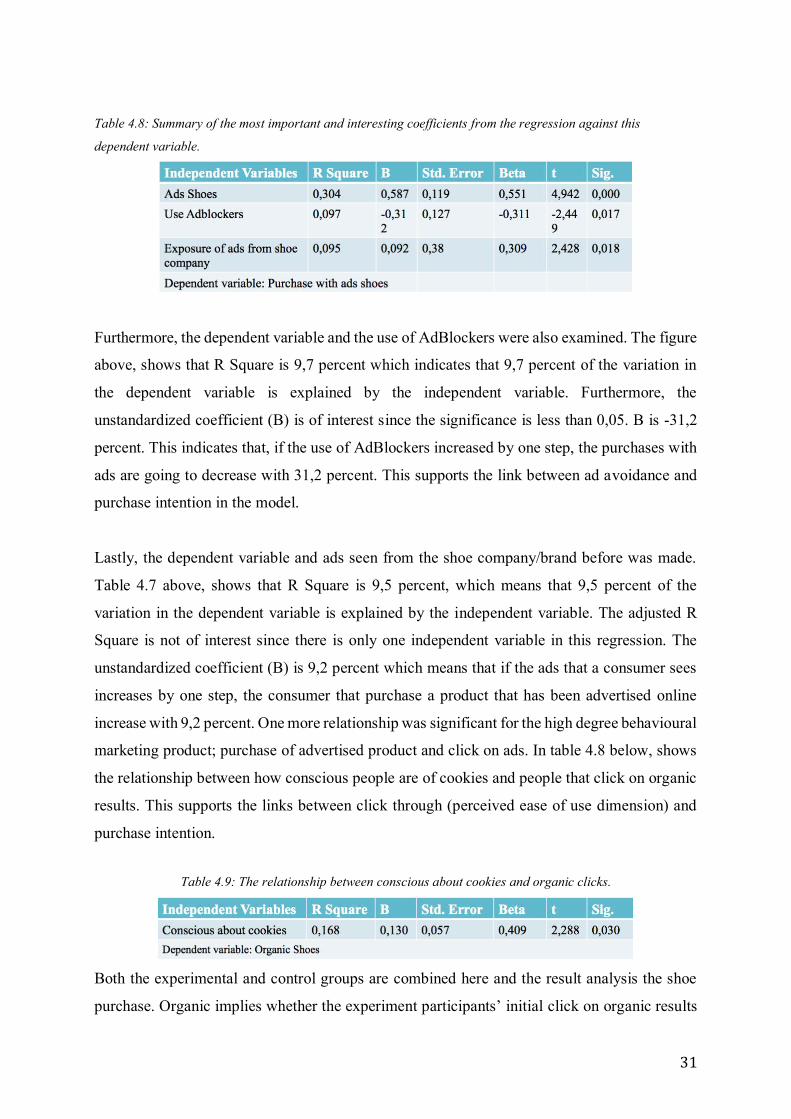
A regression analysis was made with the dependent variable, purchase with ads shoes, and three
different independent variables: click on ads, use of Ad Blockers and the exposure to ads from
the shoe company. The variables that is discussed now are all significant and therefore of
interest. The first variable that is examined against the dependent variable, purchase with ads,
is clicking on ads. The R Square of this variable, see table 4.7, is 30,4 percent which means that
30,4 percent of the variation in the dependent variable, purchase with ads, is explained by the
independent variable, click on ads. Thus, if a person click on an ad it is more likely that they
will buy from a company that is advertising online. The B-coefficient is 58,7 percent, which
indicates that if the click on ads increase by one step the purchase of advertised products will
increase with 58,7 percent. This means that for the high degree behavioral marketing product
click through, ad avoidance and relevance of the ads found support in the regression analysis.
31
Table 4.8: Summary of the most important and interesting coefficients from the regression against this
dependent variable.
Furthermore, the dependent variable and the use of AdBlockers were also examined. The figure
above, shows that R Square is 9,7 percent which indicates that 9,7 percent of the variation in
the dependent variable is explained by the independent variable. Furthermore, the
unstandardized coefficient (B) is of interest since the significance is less than 0,05. B is -31,2
percent. This indicates that, if the use of AdBlockers increased by one step, the purchases with
ads are going to decrease with 31,2 percent. This supports the link between ad avoidance and
purchase intention in the model.
Lastly, the dependent variable and ads seen from the shoe company/brand before was made.
Table 4.7 above, shows that R Square is 9,5 percent, which means that 9,5 percent of the
variation in the dependent variable is explained by the independent variable. The adjusted R
Square is not of interest since there is only one independent variable in this regression. The
unstandardized coefficient (B) is 9,2 percent which means that if the ads that a consumer sees
increases by one step, the consumer that purchase a product that has been advertised online
increase with 9,2 percent. One more relationship was significant for the high degree behavioural
marketing product; purchase of advertised product and click on ads. In table 4.8 below, shows
the relationship between how conscious people are of cookies and people that click on organic
results. This supports the links between click through (perceived ease of use dimension) and
purchase intention.
Table 4.9: The relationship between conscious about cookies and organic clicks.
Both the experimental and control groups are combined here and the result analysis the shoe
purchase. Organic implies whether the experiment participants’ initial click on organic results

32
or not. This model is statistically significant with P-value 0,03. The B value shows that for
every unit consumer consciousness increase, clicks on organic ads will increase with 13 percent.
The variations in the dependent variable explained by 16,8 percent due to constant variable.
However, the same test did not show statistically significant result for the bike purchase.
4.4 Comparison between experimental group and control group The experiment consisted of two different groups; the experimental group and control group.
Therefore it is interesting to compare these groups’ behaviour and perception. The experimental
group had a manipulation the day before, where they were asked to perform a number of
searchers of bikes and shoes. This part of the empirical data is therefore to see if the
manipulation worked.
Both the experimental- and control group had a significant result between the independent
variable, ads shoes, and dependent variable, purchase with ads shoes. In table 4.9 below, the
difference in the result is shown. R Square is 34,3 percent for the experimental group and 27
percent for the control group. This means that 34,3 percent (experimental group) and 27 percent
(control group) of the variation in the dependent variable (purchase with ads) is explained by
the independent variable (click on ads). The unstandardized coefficient (B) is 62,6 percent for
the experimental group and 55 percent for the control group. Thus, not a large difference from
the different groups.
Table 4.10: Comparison between the experimental- and control group when looking at clicks on ads and
purchase product that has been advertised - high behavioural marketing product.
Furthermore, the same variables for the low degree behavioural marketing product did also
have significant results, see table 4.10 below. There is a bigger change between the different
groups, when looking at the low degree behavioural marketing product. R Square is 64,1
percent for the experimental group and 37,5 percent for the control group. This means that 64,1
percent (experimental group) and 37,5 percent (control group) of the variation in the dependent
variable (purchase with ads) is explained by the independent variable (click on ads). The
unstandardized coefficient (B) is 83,3 percent for the experimental group and 61,2 percent for
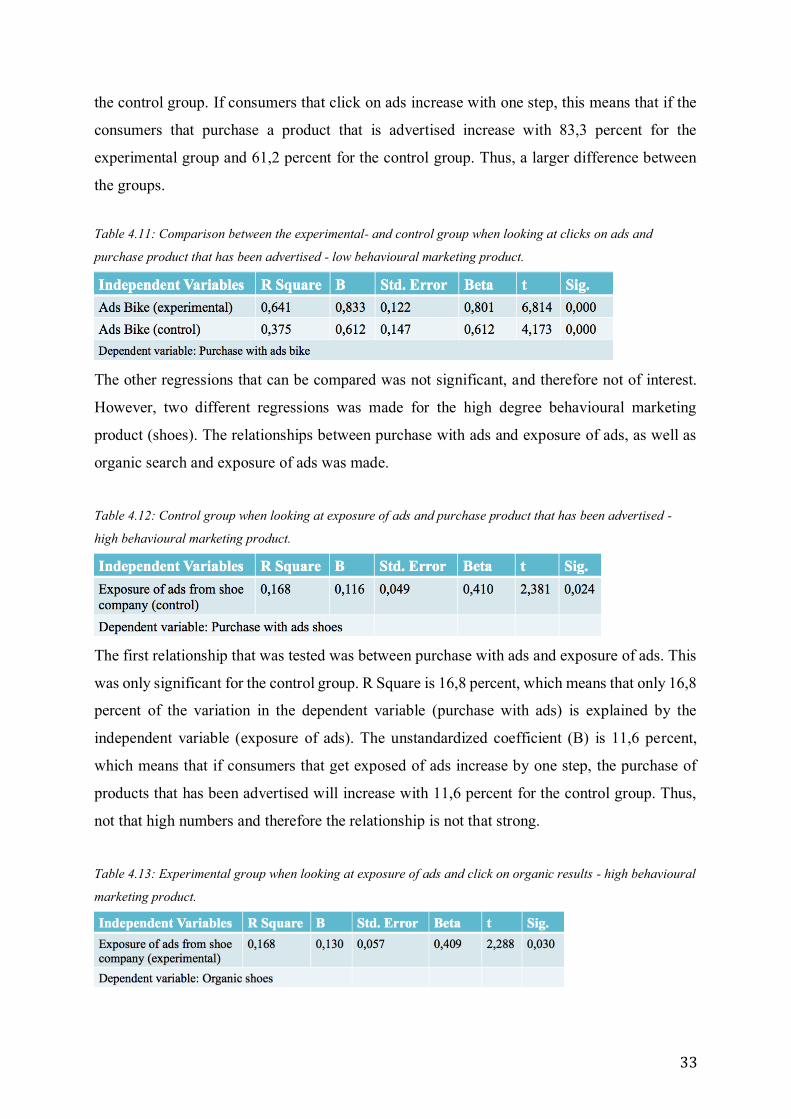
33
the control group. If consumers that click on ads increase with one step, this means that if the
consumers that purchase a product that is advertised increase with 83,3 percent for the
experimental group and 61,2 percent for the control group. Thus, a larger difference between
the groups.
Table 4.11: Comparison between the experimental- and control group when looking at clicks on ads and
purchase product that has been advertised - low behavioural marketing product.
The other regressions that can be compared was not significant, and therefore not of interest.
However, two different regressions was made for the high degree behavioural marketing
product (shoes). The relationships between purchase with ads and exposure of ads, as well as
organic search and exposure of ads was made.
Table 4.12: Control group when looking at exposure of ads and purchase product that has been advertised -
high behavioural marketing product.
The first relationship that was tested was between purchase with ads and exposure of ads. This
was only significant for the control group. R Square is 16,8 percent, which means that only 16,8
percent of the variation in the dependent variable (purchase with ads) is explained by the
independent variable (exposure of ads). The unstandardized coefficient (B) is 11,6 percent,
which means that if consumers that get exposed of ads increase by one step, the purchase of
products that has been advertised will increase with 11,6 percent for the control group. Thus,
not that high numbers and therefore the relationship is not that strong.
Table 4.13: Experimental group when looking at exposure of ads and click on organic results - high behavioural
marketing product.
34
Moreover, the relationship between exposure of ads and organic clicks was also tested. This
regression resulted in the exact same R Square as the relationship tested between exposure of
ads and purchase with ads. This means that only 16,8 percent of the variation in the dependent
variable (organic clicks) is explained by the independent variable (exposure of ads). The
unstandardized coefficient (B) is 13 percent, thus a little higher than the relationship before.
This means that if consumers that get exposed of ads increase by one step, the consumers
clicking on organic result will increase with 13 percent. Since the numbers here are not that
high, the relationship is not that strong. Thus, if the independent variable (exposure of ads)
increase by one step, the dependent variables, purchase with ads and organic clicks, will
increase by 11,6 percent versus 13 percent.

35
5. Analysis
This chapter consists of an analysis of the empirical data. A comparison of the theoretical
framework (UTAM) will be discussed and investigated. In this section of the report the previous
literature will be taken into consideration when analysing the results of this study.
5.1 Perceived Usefulness According to Legris et al. (2003), perceived usefulness characterizes to which degree a user
finds a certain technology enhancing their performance. Perceived usefulness in UTAM is
measured by two different variables; Relevance of the ads and Degree of Personalization. These
two variables will be discussed connected to this study below.
5.1.1 Relevance of the ads
The relevance of the ads was tested by both questionnaire and the experiment. During the
experiment, the degree of relevance of the ads was determined by whether the participants
purchased the item suggested in the ads or not. This is explained by the fact that if an
advertisement is considered relevant, the likelihood for the participants to purchase the
advertised item will increase and vice versa.
The regression analysis showed a statistically significant relationship between ad relevance and
purchase decision with B = 0,252 which means that with each unit of increased ad relevance,
there will be an increase by 0,252 units of purchase intention. According to Boerman et al.
(2017) customers appreciate relevant ads and it has been proven that the higher degree the ad
relevance, the higher is the purchase intention, which aligns well with the results of this
experiment.
5.1.2 Degree of personalization
This was measured by whether test object are exposed to the ads by the brands they are
interested in and by the brands they have no interest in. We also found a statistically significant
relationship between initial click on ads and purchase with ads. The likelihood of purchasing
sponsored items increases if the initial click by user was on sponsored ads. This is most likely
due to the fact that users that initially click on ads follow through and purchase the item that
they clicked on. This can also be explained by the relevance of the ads. If the relevance degree
of the ads is high, the user will not bounce back to search and go further to purchase. According
to Boerman (2017), personalization and relevance of the ads increases attention from the
customers, which in its turn has a positive effect on clicks and purchases. Therefore, the result

36
from the regression analysis is aligned with previous studies. 30,4 percent of variation was
explained by independent variable (click on ads) with B = 0,58 which means that with each
increased unit of click on ads the likelihood on purchase with ads will increase with 0,58 units.
5.2 Perceived Ease of Use Perceived ease of use was measured by how easy the consumer finds to learn and adopt the
technology. Perceived ease of use can be further explained by the fact that there is no need for
consumers to do their research online about the products and go through all the organic results.
Perceived ease of use is explained below as it was measured by click on ads.
5.2.1 Click through
Since the placement of the ads is usually very convenient and easily accessible, the users often
find it easier to click on ads than on organic results (Liu, Yuan, Liu & Li, 2015). The regression
analysis showed a statistically significant result in the relationship between click on ads and
purchase with ads with B = 0,704. This means that with each increased unit of click on ads, the
likelihood of purchased sponsored item increases by 70,4 percent.
5.3 Attitude Towards Use Attitude towards use consist of three variables: privacy concerns, ad avoidance and trust.
5.3.1 Privacy concerns
Privacy concerns were measured by awareness of cookies and data collection. The regression
analysis showed a statistically significant relationship between awareness of cookies and the
likelihood to click on organic results. With an R square of 0,168 which explains 16,8 percent
of the variation and B = 0,13 which indicates 13 percent increase in the likelihood to select
organic results with each unit increase of cookies’ awareness. This relationship was surprisingly
weak as the literature suggests that there is a strong correlation between awareness of cookies
and data collection and ad avoidance. Perhaps, it is due to the fact that users often struggle with
the “ad blindness” which affects how the react to the online advertisement. The relationship
might be so weak because although users are being more aware of the data collection than
before they are still not fully aware of each time they are exposed to behavioral marketing.
According to Zarouali, the users that are aware of cookies are more averse towards retargeting.
This misalignment between the literature and the experiment result might be due to low R
square which only explains 16,8 percent of variation in dependent variables.

37
5.3.2 Ad avoidance
Ad avoidance was measured by the fact whether the participants use AdBlockers. The
regression analysis showed that there is a statistically significant relationship between usage of
AdBlockers and purchase with ads with B = -0,321. This means that with one unit increase of
AdBlocker usage, the likelihood to purchase sponsored product decreases by 32,1 percent.
According to a research done by the Internet foundation in Sweden more than 50 percent of
younger people in Sweden use AdBlocker (Davidsson & Thoresson, 2017). However, there is
no literature found that analysis the relationship between AdBlocks usage and aversion to ads
that should be further analysed in future research.
5.3.3 Brand trust
The Anova test has showed that 15,6 percent of variation in dependent variables can be
explained by trust when it comes to the city bike purchase. The fact that this number is relatively
low might depend on a few factors. First of all, a bike is a quite expensive purchase which
means that consumers are not exposed to bicycle brands as much as other relatively cheap items.
According to Ha (2014), familiarity with brands generates a higher degree of trust. Since a bike
is not a frequent purchased, the participants might have been less familiar with brand names
hence the low impact of trust on the purchasing decision. The trust played a much bigger role
with a high degree behavioural marketing product.
One of the variables that have statistically significant relationship with purchase intention for
high degree behavioural marketing product (sneakers) was trust. The regression analysis
showed that one unit increase in trust will result in 42,3 percent increase in purchase intention.
This was previously explained by Chaudhuri and Holbrook (2001) when their study showed
that brand trust leads to brand loyalty and commitment. Since sneakers’ brands are more visible
and consumers are more exposed to these brands compared to bicycle brands, brands have
stronger brand image and customer loyalty. Therefore, the participants have a higher degree of
trust towards shown brands and this trust has higher impact on their purchase decision
compared to bikes.
5.4 Purchase intention For the low degree marketing product (bike), it has been shown to be statistically significant
for both ads that interested the participants and ads that did not interest them. This means that
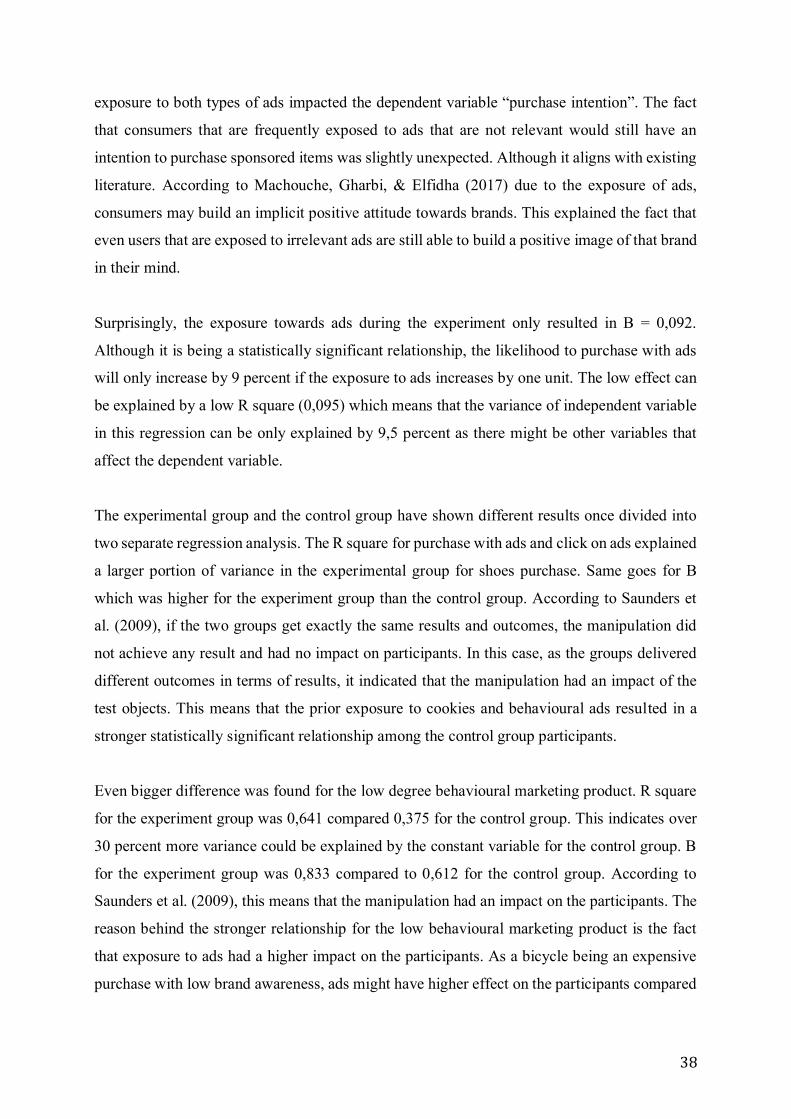
38
exposure to both types of ads impacted the dependent variable “purchase intention”. The fact
that consumers that are frequently exposed to ads that are not relevant would still have an
intention to purchase sponsored items was slightly unexpected. Although it aligns with existing
literature. According to Machouche, Gharbi, & Elfidha (2017) due to the exposure of ads,
consumers may build an implicit positive attitude towards brands. This explained the fact that
even users that are exposed to irrelevant ads are still able to build a positive image of that brand
in their mind.
Surprisingly, the exposure towards ads during the experiment only resulted in B = 0,092.
Although it is being a statistically significant relationship, the likelihood to purchase with ads
will only increase by 9 percent if the exposure to ads increases by one unit. The low effect can
be explained by a low R square (0,095) which means that the variance of independent variable
in this regression can be only explained by 9,5 percent as there might be other variables that
affect the dependent variable.
The experimental group and the control group have shown different results once divided into
two separate regression analysis. The R square for purchase with ads and click on ads explained
a larger portion of variance in the experimental group for shoes purchase. Same goes for B
which was higher for the experiment group than the control group. According to Saunders et
al. (2009), if the two groups get exactly the same results and outcomes, the manipulation did
not achieve any result and had no impact on participants. In this case, as the groups delivered
different outcomes in terms of results, it indicated that the manipulation had an impact of the
test objects. This means that the prior exposure to cookies and behavioural ads resulted in a
stronger statistically significant relationship among the control group participants.
Even bigger difference was found for the low degree behavioural marketing product. R square
for the experiment group was 0,641 compared 0,375 for the control group. This indicates over
30 percent more variance could be explained by the constant variable for the control group. B
for the experiment group was 0,833 compared to 0,612 for the control group. According to
Saunders et al. (2009), this means that the manipulation had an impact on the participants. The
reason behind the stronger relationship for the low behavioural marketing product is the fact
that exposure to ads had a higher impact on the participants. As a bicycle being an expensive
purchase with low brand awareness, ads might have higher effect on the participants compared
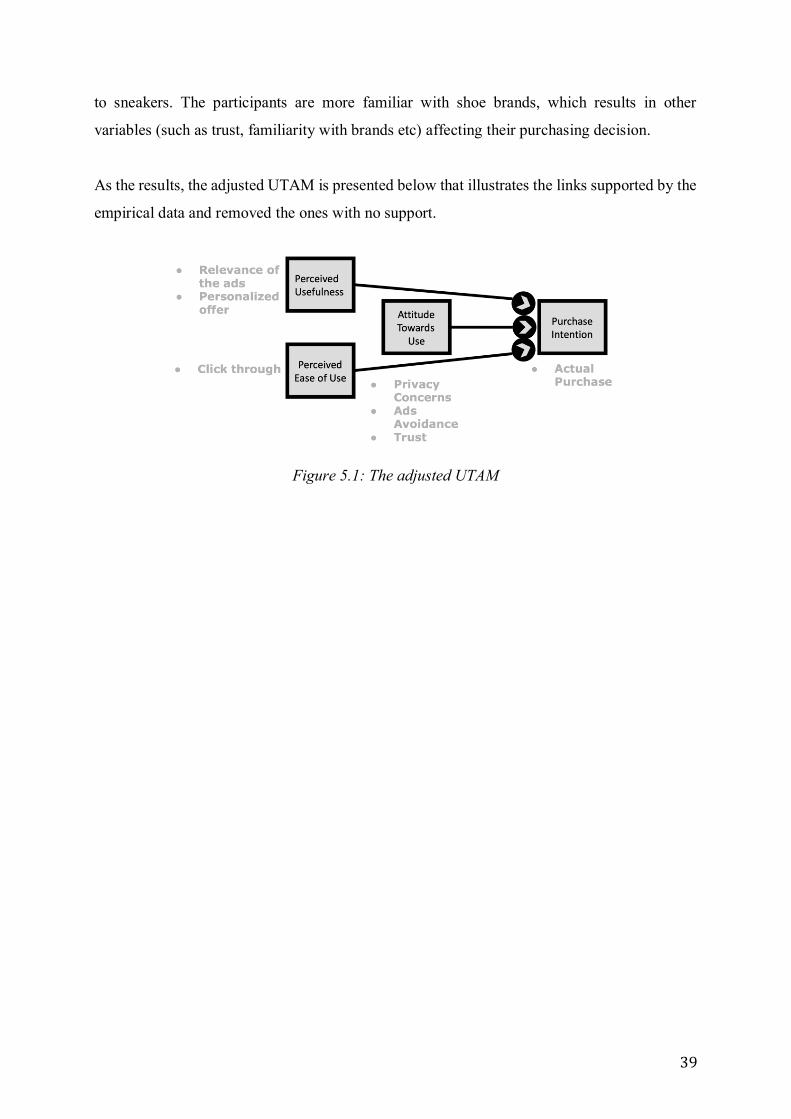
39
to sneakers. The participants are more familiar with shoe brands, which results in other
variables (such as trust, familiarity with brands etc) affecting their purchasing decision.
As the results, the adjusted UTAM is presented below that illustrates the links supported by the
empirical data and removed the ones with no support.
Figure 5.1: The adjusted UTAM

40
6. Conclusions
In this chapter the practical and theoretical implications are being discussed, as well as the
main findings of the study. The limitations will be presented and discussed. It will also discuss
further research that can be made, that the study did not conclude.
6.1 Main Findings
RQ1: How do consumers’ attitudes towards behavioural marketing, affect their purchase
intention?
One of the main findings of this study is the fact that trust has a strong impact on purchase
intention. However, there is a different degree of how trust impacts low- and high degree
behavioural marketing products. The regression analysis showed that there is a stronger
relationship between trust and purchasing decision for shoes. For the high degree behavioural
marketing product, trust showed to be a strong variable. Since these products have an already
strong presence on the market, consumers are often overwhelmed with ads by these brands and
have a high level of familiarity with them. Sneakers are commonly purchased items and
consumers usually have bigger knowledge about these products. Behavioural ads showed to
have less effect on the purchasing decision for the high degree behavioural marketing product.
Therefore, the conclusion was made that the consumers prefer trusted brands and are more
tolerant towards behavioural ads by these brands.
Figure 5.1: Adjusted theoretical framework (UTAM)
Privacy concerns have shown to be one of the variables impacting consumers purchasing
intention. The participants that are aware of data collection and the usage of cookies are more

41
likely to choose organic results instead of sponsored ones. Users that admitted that they use
AdBlockers have also shown to be more likely to click on organic results than sponsored.
Relevance of the ads has an impact on purchase decision as well. When the ads were perceived
as relevant, users stayed on the website and purchased sponsored products that they are initially
clicked on. Besides, there is a relationship between initial click on ads and purchase with ads.
This means that the likelihood of purchasing sponsored items increases as the relevance of the
ad increases for the user.
RQ2: How does exposure to behavioural marketing affects purchase intention?
Exposure to behavioural marketing has a positive effect on purchase intention. Through the
experiment we found that there is a strong relationship between initial click on ads and purchase
with ads. Besides, this relationship was stronger for the experiment group than the control
group. As the experiment group was exposed to the ads during a longer time and received more
behavioural ads it indicates that exposure to behavioural ads leads to higher likelihood of
consumers clicking on sponsored posts and stronger intention to purchase the advertised
product. This relationship was especially strong for the low degree behavioural ad product
(bike). This is an interesting discovery as it gives an empirical evidence to the fact the users
that are more exposed to behavioural marketing are more likely to purchase advertised products.
6.2 Practical Implications As the result of this study there is a few things that should be noted and taken into consideration
by brands and marketers. First of all, trust towards brands is very valuable for the consumers
and it has a strong impact on the purchase intention. Especially when it comes to the
oversaturated market and commonly sought after products such as sneakers. Moreover, the
majority of the participants selected items from the brands they have purchased from before.
This leads to the conclusion that strong brand image and brand equity weigh far heavier for a
consumer then highly advertised but less trustworthy brands. Brands that do not yet have a
strong presence on the market need to focus their efforts and resources on building a strong
brand image before spending their resources on intensive online advertisement. Ads might be
able to drive traffic but the quality of traffic would not be as good and they will experience very
low conversion rate. Building a strong brand presence beforehand combined with cautious ad

42
strategy is recommended in order to attract high quality traffic with low cost per acquisition
and high conversion rate.
Ad relevance plays a big role in purchase intention as well. This reveals and highlights the fact
that companies need to do a proper keyword research before starting to bid on high traffic
keywords. A large portion of the customers already knows what to search for and rarely search
for simple generic keywords. Brands can achieve more qualitative traffic and therefore higher
conversion rates if they serve the consumers that are searching for specific long tail keywords,
as they are more involved in the process and more likely to convert.
Businesses need to take into account the fact of growing awareness of cookies and data
collection among the consumers. Consumers that are aware of cookies and use AdBlockers are
more likely to click on organic results. This can be addressed by ranking higher in organic
results by working on SEO and working with native advertising. As awareness about data
collection and its use is growing, brands will need to put in more effort into their search engine
optimization to make sure they satisfy even the customers who only click on organic results
and use AdBlockers.
6.3 Theoretical Implications This study has partially filled the gap regarding consumers’ perception of behavioural
marketing. As there was discovered a lack of literature in regard of consumer’s point of view,
our study has analysed what variables impact perception of behavioural marketing and what
role it plays in purchasing intention. Ad aversion (AdBlocker usage) has proven to be one of
the variables that affect the likelihood of the user purchasing advertised products. This study
has also analysed the difference between conscious and unconscious behaviour and with the
help of vignette methodology was able to identify differences between implicit and explicit
behaviour regarding behavioural marketing.
43
Figure x. Adjusted theoretical framework (UTAM)
6.4 Limitations and Further Research The study had a limited time, which impacted the data collection and therefore the result. If
there was more time, the study would collect more participants and a different sample would
be chosen. Another limitation of this study is that it was not possible to see what the participants
in the experimental group were doing in between initial search and screen recording hence its
hard to say whether they have seen any ads on the suggested items or not. Also, different
browsing history leads to different experience online. It is safe to assume that the participants
that often search for a certain item will more likely be exposed to behavioural ads for this item.
This can therefore give a varying result in the study.
Further research is an exciting subject since behavioural marketing most likely will develop
and change because of the growing of AI. Other researchers could look at mobile behavioural
marketing for instance. This could be interesting since people more and more are using their
phones to purchase new products and also normally do not have adblockers on their phones.
Another path for new research is to examine another population than millenials, maybe how
even younger people behave online and their perceptions in order for companies to be ahead of
themselves. It could also be interesting to have other products and see if it gives the same
results. The products that were used in this research were both a high- and low degree
behavioural marketing product. However, the high degree behavioural marketing product
(shoes) is something that consumers tend to purchase more than the low degree behavioural
marketing product (city bike). Further research could therefore look into products that are more
of the same but still use behavioural marketing more or less.

44
Reference list
Aguinis, H., & Bradley, K. J. (2014). Best practice recommendations for designing and implementing experimental
vignette methodology studies. Organizational Research Methods, 17(4), 351-371.
Atzmüller, C., & Steiner, P. M. (2010). Experimental vignette studies in survey research. Methodology.
Ayeh, J. K. (2015). Travellers’ acceptance of consumer-generated media: An integrated model of technology
acceptance and source credibility theories. Computers in Human Behavior, 48, 173-180.
Barbu, O. (2014). Advertising, microtargeting and social media. Procedia-Social and Behavioral Sciences, 163,
44-49.
Boerman, S. C., Kruikemeier, S., & Zuiderveen Borgesius, F. J. (2017). Online behavioral advertising: A literature
review and research agenda. Journal of Advertising, 46(3), 363-376.
Chaudhuri, A., & Holbrook, M. B. (2001). The chain of effects from brand trust and brand affect to brand
performance: the role of brand loyalty. Journal of marketing, 65(2), 81-93.
Chaudhuri, A., & Holbrook, M. B. (2002). Product-class effects on brand commitment and brand outcomes: The
role of brand trust and brand affect. Journal of Brand Management, 10(1), 33-58.
Davidsson, P. &. (2017). Svenskarna och internet. Undersökning om svenskarnas internetvanor.
Davis, F. D. (1989). Perceived usefulness, perceived ease of use, and user acceptance of information technology.
MIS quarterly, 319-340.
Fayad, R., &Paper, D. (2015). The technology acceptance model e-commerce extension: a conceptual framework.
Procedia Economics and Finance, 26, 1000-1006.
Franke, N. & Hader, C. (2014). Mass or only “niche customization”? Why we should interpret configuration
toolkits as learning instrumets. Journal of Production Innovation Management, 31(6), 1214-1234.
Gregory, R., & Muntermann, J. (2011). Theorizing in design science research: inductive versus deductive
approaches.
Ha, H. Y. (2004). Factors influencing consumer perceptions of brand trust online. Journal of product & brand
management, 13(5), 329-342.

45
Hutter, K., Hautz, J., Dennhardt, S., & Füller, J. (2013). The impact of user interactions in social media on brand
awareness and purchase intention: the case of MINI on Facebook. Journal of Product & Brand Management,
22(5/6), 342-351.
Ismail, M., Razak, R. C., Yaacob, M. R., Zakaria, M. N., Amiruddin, N. H., & Luqman, A. (2016). Predictive
Modelling of Mobile Marketing Usage among Generation Y: A Preliminary Survey. International Journal of
Interactive Mobile Technologies, 10(2).
Johnson, J. P. (2013). Targeted advertising and advertising avoidance. The RAND Journal of Economics, 44(1),
128-144.
Kwon, W. S., & Lennon, S. J. (2009). What induces online loyalty? Online versus offline brand images. Journal
of Business Research, 62(5), 557-564.
Legris, P., Ingham, J., & Collerette, P. (2003). Why do people use information technology? A critical review of
the technology acceptance model. Information & management, 40(3), 191-204.
Liu, Y., Yuan, P., Liu, W., & Li, X. (2015). What drives click-through rates of tourism product advertisements on
group buying websites?. Procedia Computer Science, 55, 221-230.
Machouche, H., Gharbi, A., & Elfidha, C. (2017). Implicit effects of online advertising on consumer cognitive
processes. Academy of Marketing Studies Journal.
Marangunić, N., & Granić, A. (2015). Technology acceptance model: a literature review from 1986 to 2013.
Universal Access in the Information Society, 14(1), 81-95.
Mathieson, K. (1991). Predicting User Intentions: Comparing the Technology Acceptance Model with the
Theory of Planned Behavior. Information Systems Research, 2(3), 173-191. doi:10.1287/isre.2.3.173
McDonald, A., & Cranor, L. F. (n.d.). An Empirical Study of How People Perceive Online Behavioral
Advertising. Retrieved 2009.
Muk, A., & Chung, C. (2015). Applying the technology acceptance model in a two-country study of SMS
advertising. Journal of Business Research, 68(1), 1-6.
Navalta, J. W., Stone, W. J., & Lyons, S. (2019). Ethical Issues Relating to Scientific Discovery in Exercise
Science. International Journal of Exercise Science, 12(1), 1.
Newman, B. I. (2016). Reinforcing lessons for business from the marketing revolution in US presidential
politics: a strategic triad. Psychology & Marketing, 33(10), 781-795.
46
Richardson, M., Dominowska, E., & Ragno, R. (2007). Predicting clicks. Proceedings of the 16th International
Conference on World Wide Web - WWW 07. doi:10.1145/1242572.1242643
Rust, R. T., & Cooil, B. (1994). Reliability measures for qualitative data: Theory and implications. Journal of
Marketing Research, 31(1), 1-14.
Saunders, M., Lewis, P., & Thornhill, A. (2009). Research methods for business students (5 uppl.). Harlow:
Pearson education limited.
Schmeiser, S. (2018). Online advertising networks and consumer perceptions of privacy. Applied Economics
Letters, 25(11), 776-780.
Schnurr, B. & Scholl-Grissemann, U. (2015). Beauty or function? How different mass customization toolkits
affect customers’ process enjoyment. Journal of Customer Behaviour, 14(5), 335-343.
Taherdoost, H. (2018). A review of technology acceptance and adoption models and theories. Procedia
manufacturing, 22, 960-967.
Tene, O., & Polonetsky, J. (2012). Big data for all: Privacy and user control in the age of analytics. Nw. J. Tech.
& Intell. Prop., 11, xxvii.
Tien, J. M. (2011). Manufacturing and services: From mass production to mass customization. Journal of
Systems Science and Systems Engineering, 20(2), 129-154.
Tsalis, N., Mylonas, A., Nisioti, A., Gritzalis, D., & Katos, V. (2017). Exploring the protection of private
browsing in desktop browsers. Computers & Security, 67, 181-197.
Wang, X., Yu, C., & Wei, Y. (2012). Social media peer communication and impacts on purchase intentions: A
consumer socialization framework. Journal of interactive marketing, 26(4), 198-208.
Wirth, N. (2018). Hello marketing, what can artificial intelligence help you with?. International Journal of
Market Research, 60(5), 435-438.
Xu, Z., Frankwick, G. L., & Ramirez, E. (2016). Effects of big data analytics and traditional marketing analytics
on new product success: A knowledge fusion perspective. Journal of Business Research, 69(5), 1562-1566.
Yu, C., Zhang, Z., Lin, C., & Wu, Y. J. (2019). Can data-driven precision marketing promote user ad clicks?
Evidence from advertising in WeChat moments. Industrial Marketing Management.

47
Zarouali, B., Ponnet, K., Walrave, M., & Poels, K. (2017). “Do you like cookies?” Adolescents' skeptical
processing of retargeted Facebook-ads and the moderating role of privacy concern and a textual debriefing.
Computers in Human Behavior, 69, 157-165.

48
Appendix A – The experiment
Thank you so much for helping us with our thesis. You will now get two tasks where we will ask you
to screen record your computer while you do the experiment. If you do not know how to do this, you
can use the information below. Before you start with this we want you to search for two different
products that we will then ask you to buy. The products are a city bike and a pair of sneakers for the
summer. You do this the day before you start with the actual experiment and go into the top 5 pages that
come up when you search on these. Then you can come back when you have time the day after and
make the experiment according to the points below.
On PC: If you have VLC you can use it. Then open VLC and press the media. Then choose convert /
save. Change to the Capture tab in the window that appears. Change the capture mode to Desktop in the
scroll bar at the top. Set the desired number of images per second further down (eg 25 frames / sec).
Click Convert / Save. Select the type of movie you want at Profile. Enter in the field at the bottom where
to save the movie. Click Start. Now you play everything you make and save in your chosen movie file.
To stop recording, open the VLC window and click on the regular stop button.
On MAC: open quicktime, right click on the icon and now select screen recording. Press record and do
the task we explain below. When you are finished with the recording press archive and save so you can
then send an email with the film to us.
Now that you record what you do on your computer, you have two different products to buy.
1. Open Crome / firefox / explore / safari on your computer, preferably the one you use the most.
2. You then have 10 minutes to search for a city bike that you could imagine to buy. Imagine that
you have a need for a bike and use the time to find a bike that suits your needs. You should
come so far in these 10 minutes that the only thing left is to fill in the card details. Thus, put the
product in the shopping cart. After you have done this, you are done with half the experiment.
3. You should now search for a pair of sneakers for the summer for a maximum of 10 minutes that
you could actually imagine buying and using. Just as you did before, you should make the
purchase as far as you can and assume that you have a need to buy a pair of sneakers.
4. After doing this you can stop filming the screen and save the file with your name (first and last
name) on your computer. You send the file with the recorded material to thegre-
[email protected] or [email protected]
5. The last step is to fill out a short questionnaire on what you have just done. This takes no more
than 2 minutes and must be filled in to use what you just did. This questionnaire can be found
on this link: https://forms.gle/Bw8fHp8pQ5L325zV9

49
Appendix B - questionnaire
How likely on a scale would you have bought this bike if you had a need?
1=Not likely at all → 6=Very likely
Have you purchased from this bicycle company before?
Yes or No
If you have bought something from the company before, how satisfied were you with the
previous purchases?
1=Not satisfied at all → 6=Very satisfied
On a scale, how much do you trust the company you bought the bike from?
1=Not at all → 6=Very much
On a scale, how many ads have you seen from the bicycle company before?
1=Non → 6=A lot
Have you seen ads from the bike company in the last 24 hours?
Yes or No
If so, on which platforms have you seen ads?
Facebook, Messenger, Instagram, Snapchat or other
How likely on a scale would you have bought these shoes if you needed to buy shoes?
1=Not likely at all → 6=Very likely
Have you purchased something from this company before?
Yes or No
If Yes, how satisfied were you with the previous purchases from the company?
1=Not satisfied at all → 6=Very satisfied

50
Have you purchased something from the same brand before?
Yes or No
If Yes, how satisfied were you with the previous purchases from the same brand?
1=Not satisfied at all → 6=Very satisfied
To what extent do you trust the company you bought the shoes from?
1=Not at all → 6=Very much
To what extent do you trust the brand the shoes has?
1=Not at all → 6=Very much
How much have you seen ads from the shoe company / brand before?
1=Not at all → 6=Very much
Have you seen ads from the shoe company / brand in the last 24 hours?
Yes or No
If so, on which platforms have you seen ads?
Facebook, Messenger, Instagram, Snapchat or other
How conscious would you say you are about cookies and what they are used for?
1=Not at all → 6=Very conscious
To what extent would you say you trust social media with your personal data?
1=Not at all → 6=Very much
To what extent would you say that you trust business pages, like the pages were you have
bought the bike and shoes, with your personal data?
1=Not at all → 6=Very much
How often do advertisements from companies that do not interest you, "chase" you on social
media?
51
1=Never → 6=Very often
How often do advertisements from companies that interest you usually "chase" you on social
media?
1=Never → 6=Very often
On a scale, how often would you say you click on ads coming up on social media?
1=Never → 6=Very often
Do you use adblockers?
Yes, No or I don’t know
Where do you live?
Luleå, Stockholm, Copenhagen or other
Gender?
Female, Male, prefer not to say or other
How old are you?
under 18, between 18-20, between 21-23, between 24-26, between 27-29 and 30+
What's your name?
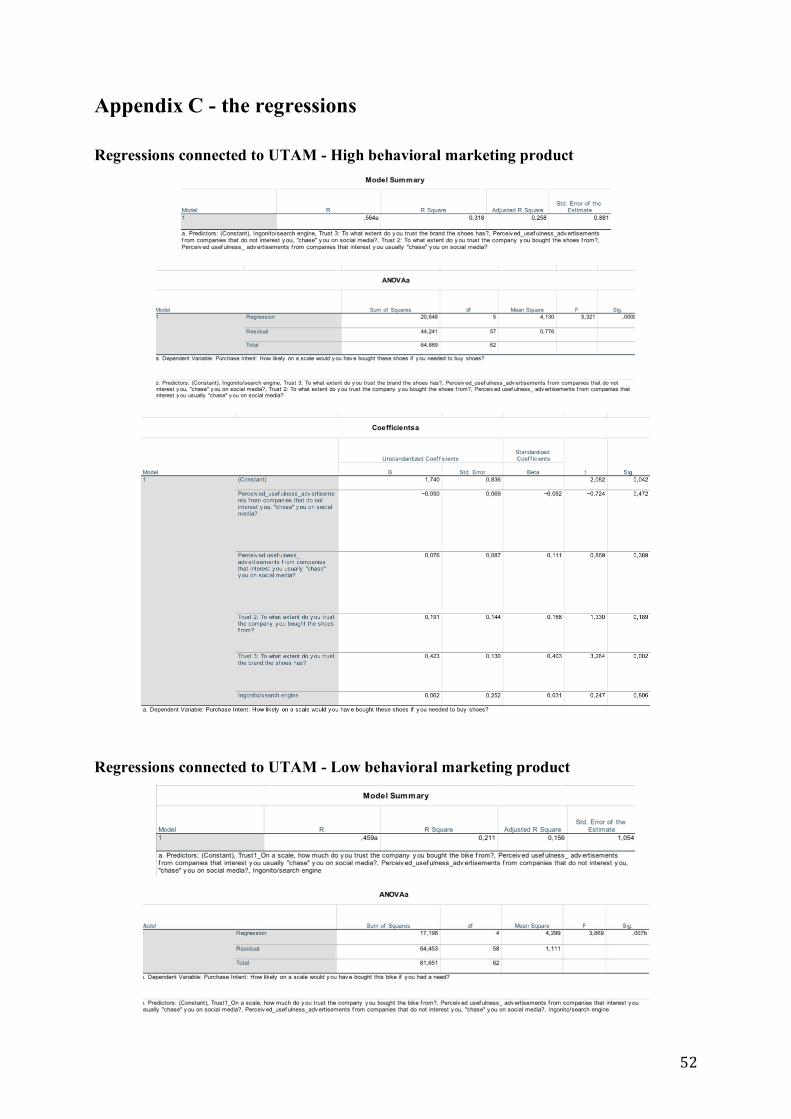
52
Appendix C - the regressions
Regressions connected to UTAM - High behavioral marketing product
Regressions connected to UTAM - Low behavioral marketing product

53
The regressions of the whole sample (59 participants)