what do i do with my dibels data? aligning student needs and instruction source: tracy cormane:...
TRANSCRIPT
What Do I Do With My DIBELS Data?
Aligning Student Needs and Instruction
source: http://www.flickr.com/photos/katemonkey/122489910/
Tracy Cormane: [email protected] Christiansen: [email protected]
Data CollectionJust collecting good information never helped anyone...You have to do something with the information.
source: http://www.flickr.com/photos/katemonkey/122489910/

DIBELSDynamic Indicators of Basic Early Literacy Skills (DIBELS) are a set of procedures and measures for assessing the acquisition of early literacy skills from Kindergarten through sixth grade.
DIBELS were designed for use in identifying children experiencing difficulty in acquisition of basic early literacy skills in order to provide support early and prevent the occurrence of later reading difficulties.
source: http://www.flickr.com/photos/katemonkey/122489910/
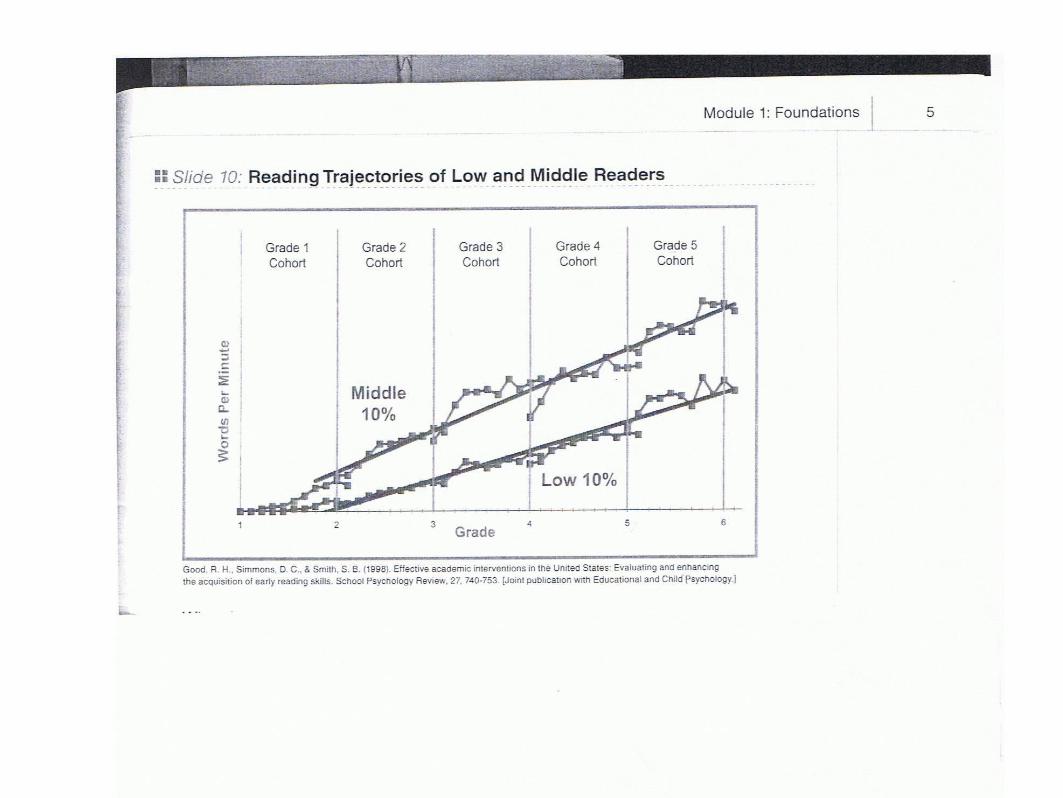
In Short:If used correctly, DIBELS can be like a thermometer - check for vitals to see if we need to dig deeper to identify specific skill gaps.
DIBELS is an indicator of possible future reading struggles.
Can see by the middle of first grade who your struggling reader will be IF no intervention is made.
source: http://www.flickr.com/photos/katemonkey/122489910/


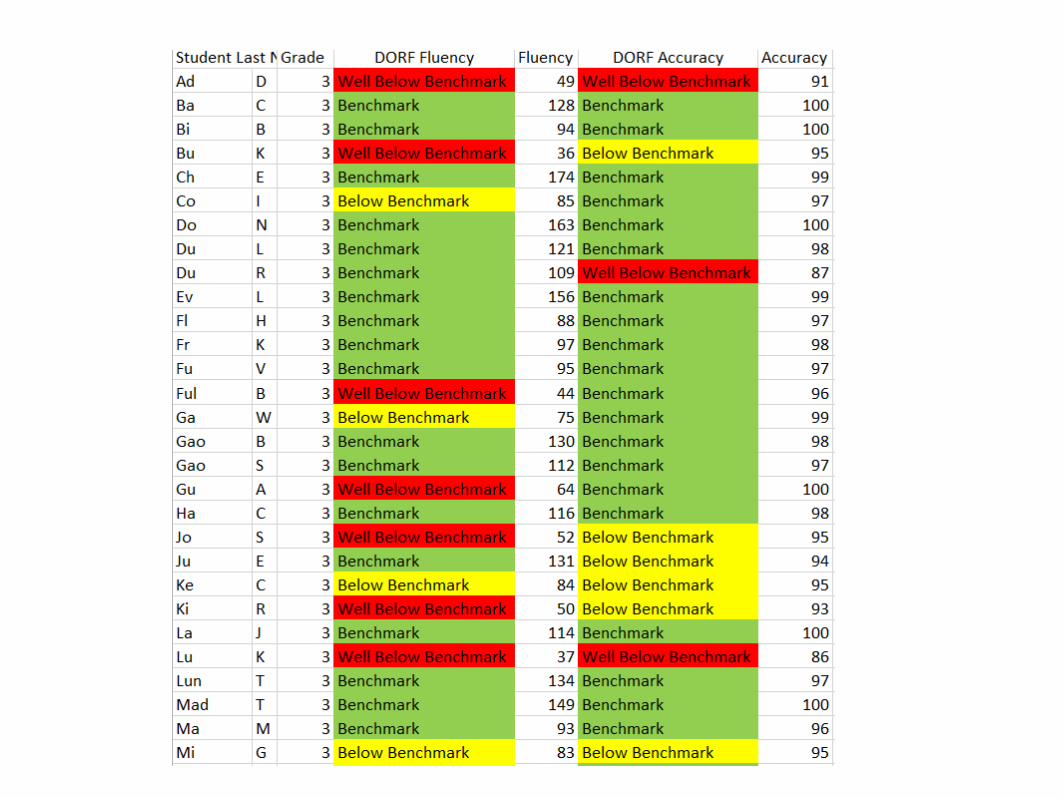
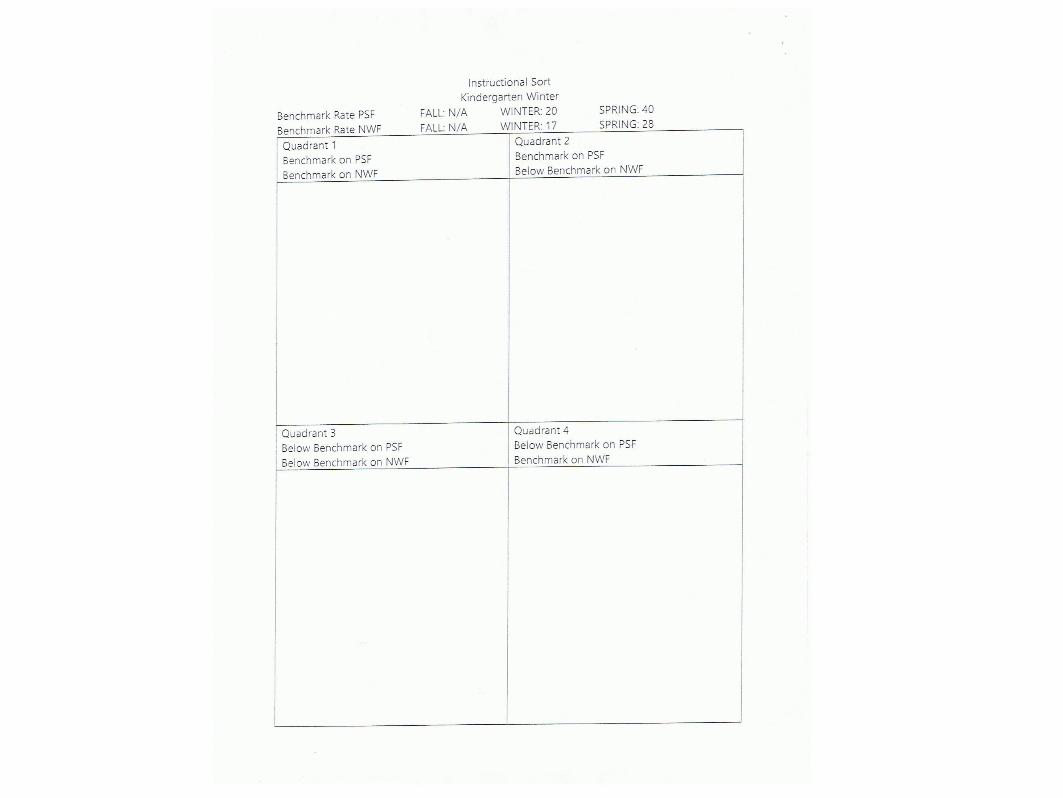
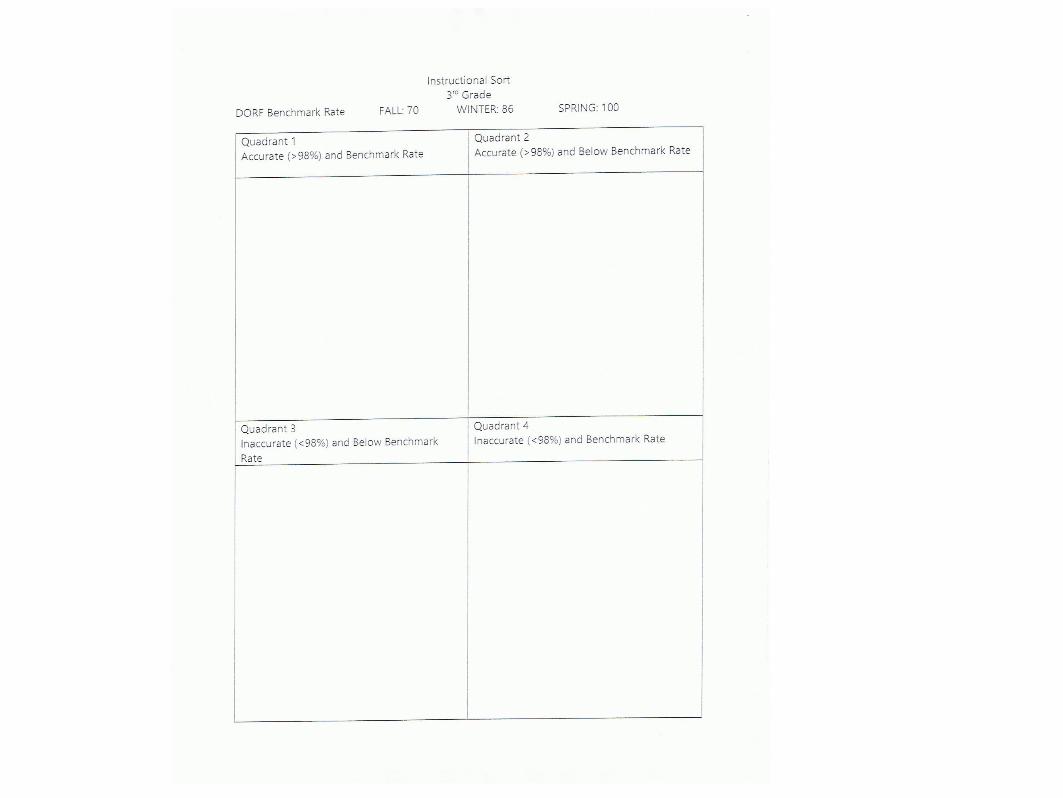
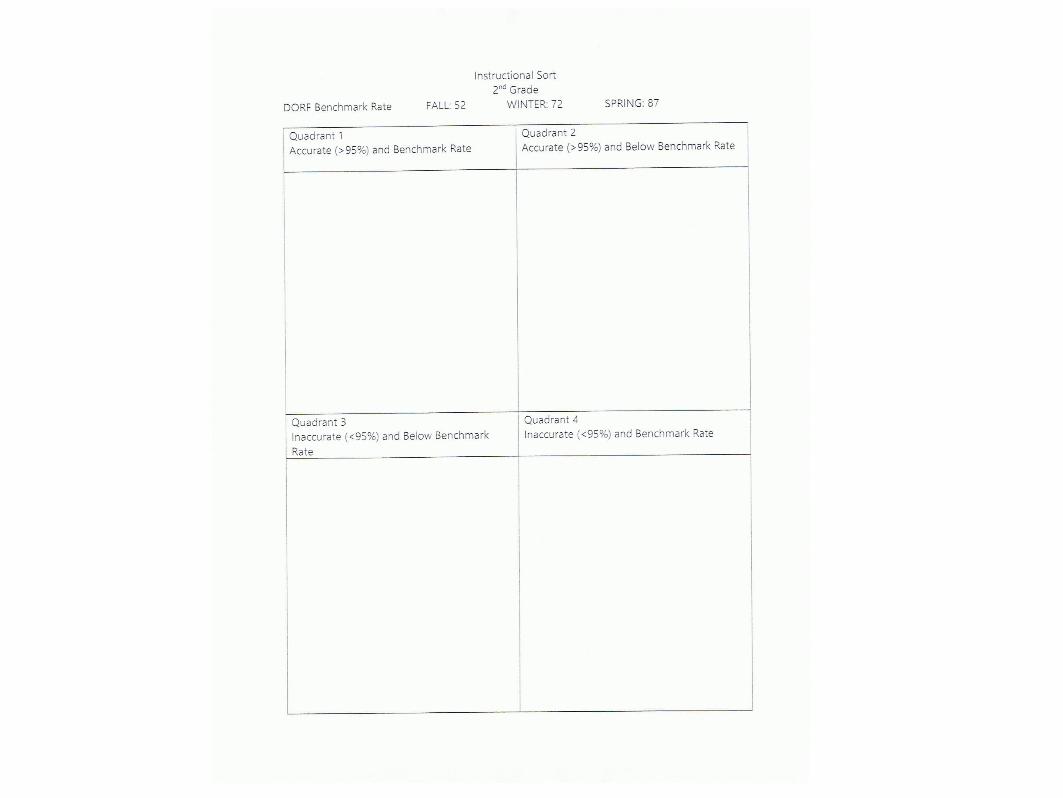
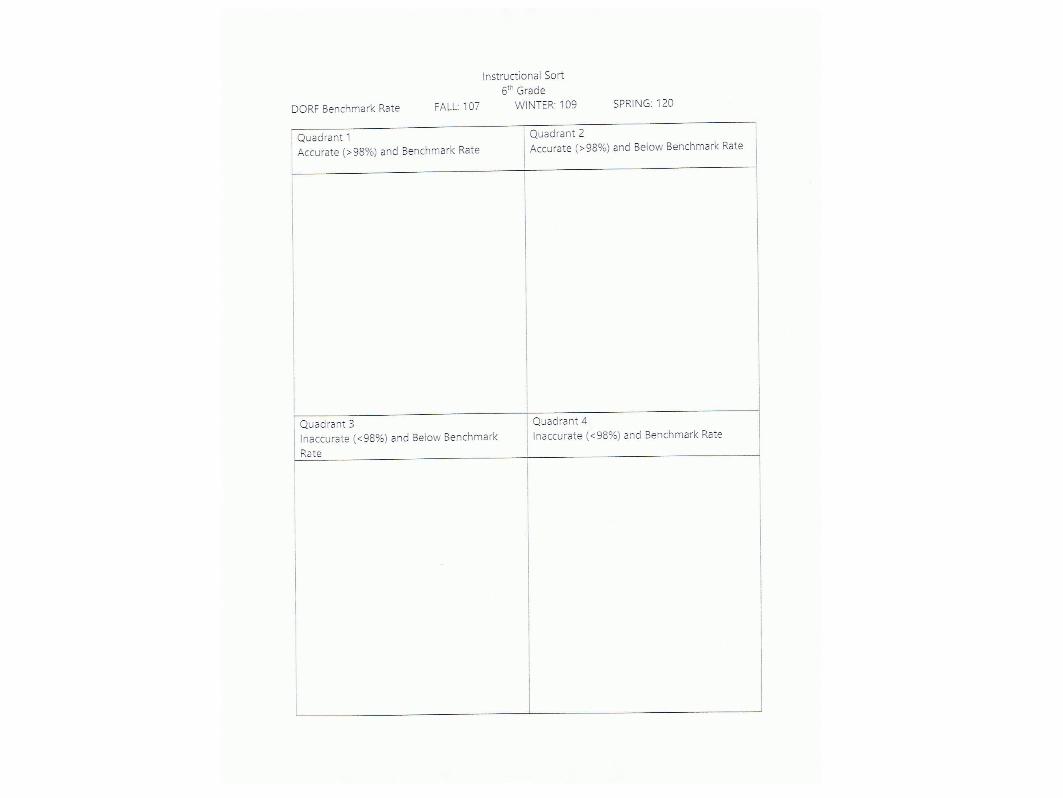
Benchmark Data
Using your benchmark data, sort students into quadrants - Grade 1 Winter to Grade 6 (See individual Benchmarks)

Teaching Focus for each Quadrant

Grade K Fall Diagnostic Flow Chart

Grade K Winter Diagnostic Flow Chart

Grade 1 Fall Diagnostic Flow Chart

Grade 1 Winter & Grade 2 Diagnostic Flow Chart

Grade 3-6 Diagnostic Flow Chart

Why should I progress monitor?
Provide meaningful and important instructional goals
Evaluate progress towards those goalsModify instruction as needed for students to make adequate progress
Identify students who are not making adequate progress (timely)

How often should I progress monitor?

Progress Monitoring

Graphing Data and Setting Appropriate Goals
Using Expected Rates of Progress based on Instructional Level
Step 1: plot baseline dataStep 2: draw intervention lineStep 3: determine and plot appropriate end goalStep 4: draw the goal (or aim) lineStep 5: collect and plot data (weekly, monthly, or
quarterly)Step 6: when four consecutive scores fall below the
goal line (if measuring weekly), make an instructional change

Instructional Change

Set Ambitious Goals

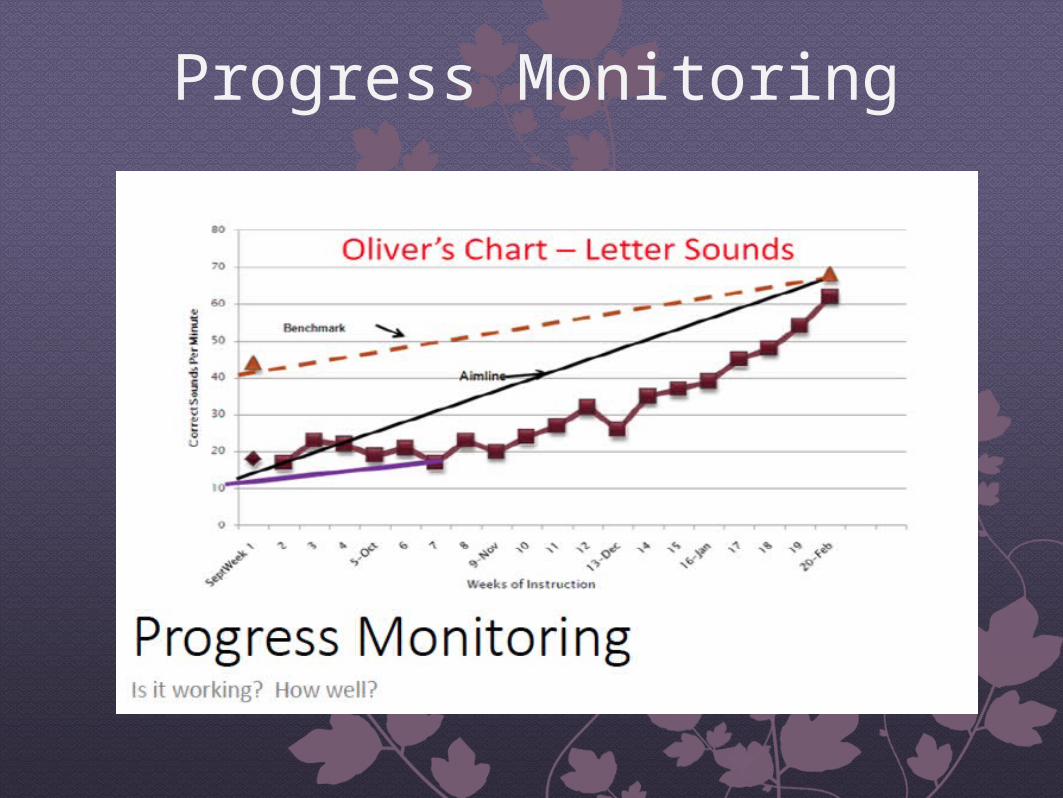
Using Expected Rates of Progress for Oliver
Step 1: Plot DORF baseline dataStep 2: Draw line where intervention startsStep 3: Determine & plot long range goal
Example:2nd grade ambitious goal 2 words/weekBaseline median score is 12 wc/mNumber of weeks to monitor = 19 weeksCalculate goal increase 19 x 2 = 38Add goal to baseline 12 + 38 = 60Mark goal on graph
Progress Monitoring

Using Expected Rates of Progress cont.
Step 4: Draw the goal (aim line)Step 5: Collect and plot dataStep 6: If 4 consecutive scores fall below the baseline
Make an Instructional Change

If Positive Progress you could...
Continue intervention with current goal or...Continue intervention with goal increased or...Fade intervention to determine if student has acquired
functional independence
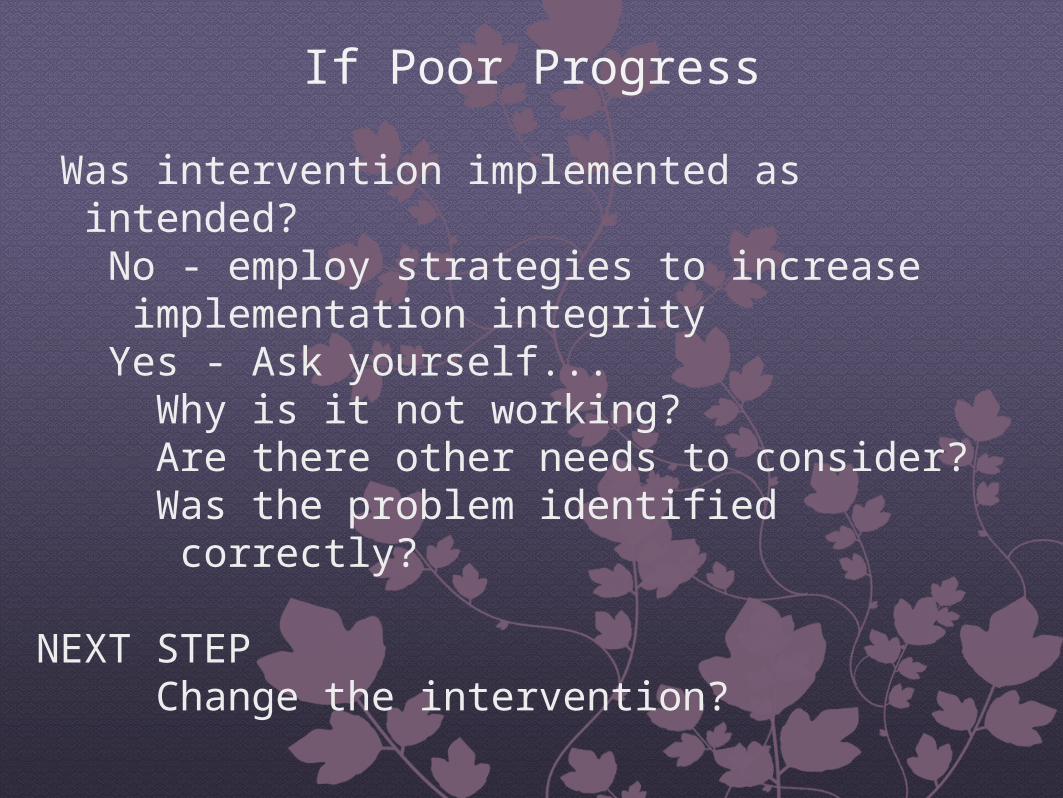
If Poor Progress
Was intervention implemented as intended?No - employ strategies to increase implementation
integrityYes - Ask yourself...
Why is it not working?Are there other needs to consider?Was the problem identified correctly?
NEXT STEP Change the intervention?

When should I use out of grade materials?

Out of Grade Materials
Second grader: Dibels Fluency was 20 wp/m in the winter
He falls between 10th & 25th percentileYou want to progress monitor in the 25th to 50th
percentile because benchmark is 40th percentile.Therefore, you need to move to first grade reading
passages.Progress monitor in grade one until he gets to approx.
53 wp/m on first grade end-of-year text (close to 50th percentile).
Then advance back to second grade text for progress monitoring.

Next Steps
Looking at Dibels Data, place students in correct quadrants
Identify Quadrant needs (See Quadrant Instructional Sort - Grades 1 (Winter) & 2-5)
Set appropriate, ambitious goalStart graphPlan for Progress MonitoringGive a Core Phonics Survey to Quadrant 3 - Plan
instruction based on student needs

Next Steps Grades 4-5
Give DAZE Test List students who did not meet benchmarkGive DIBELS or Core Phonics Survey to those
studentsFollow steps on previous slides


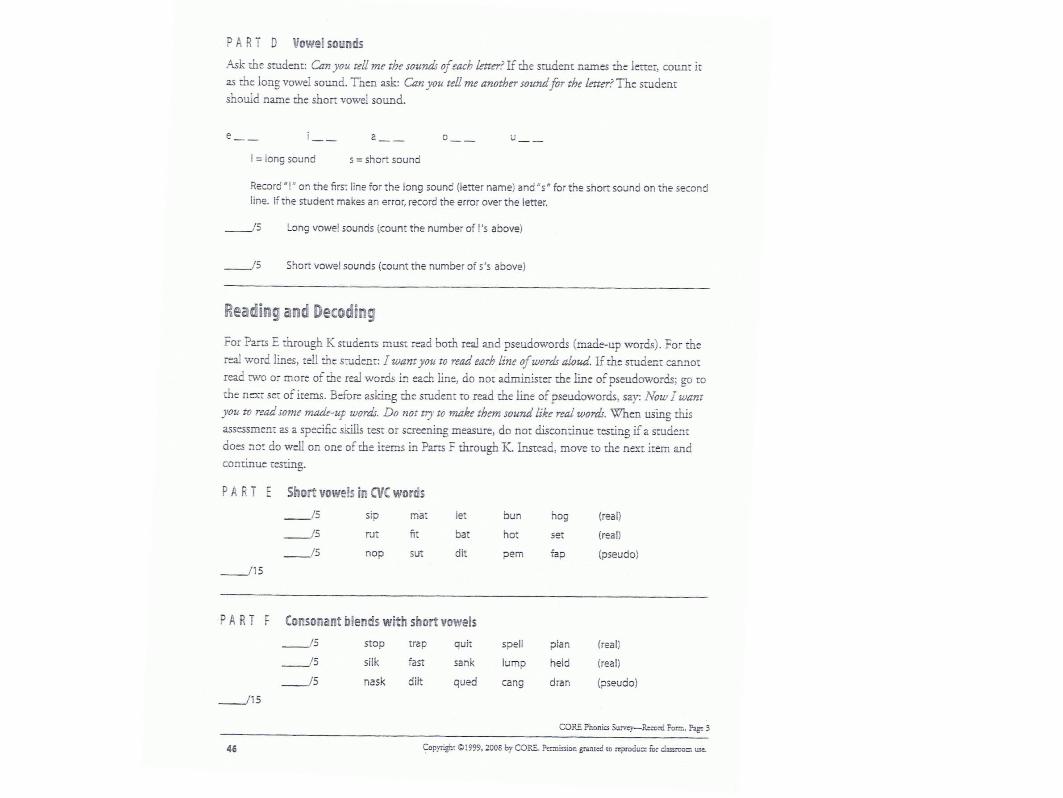
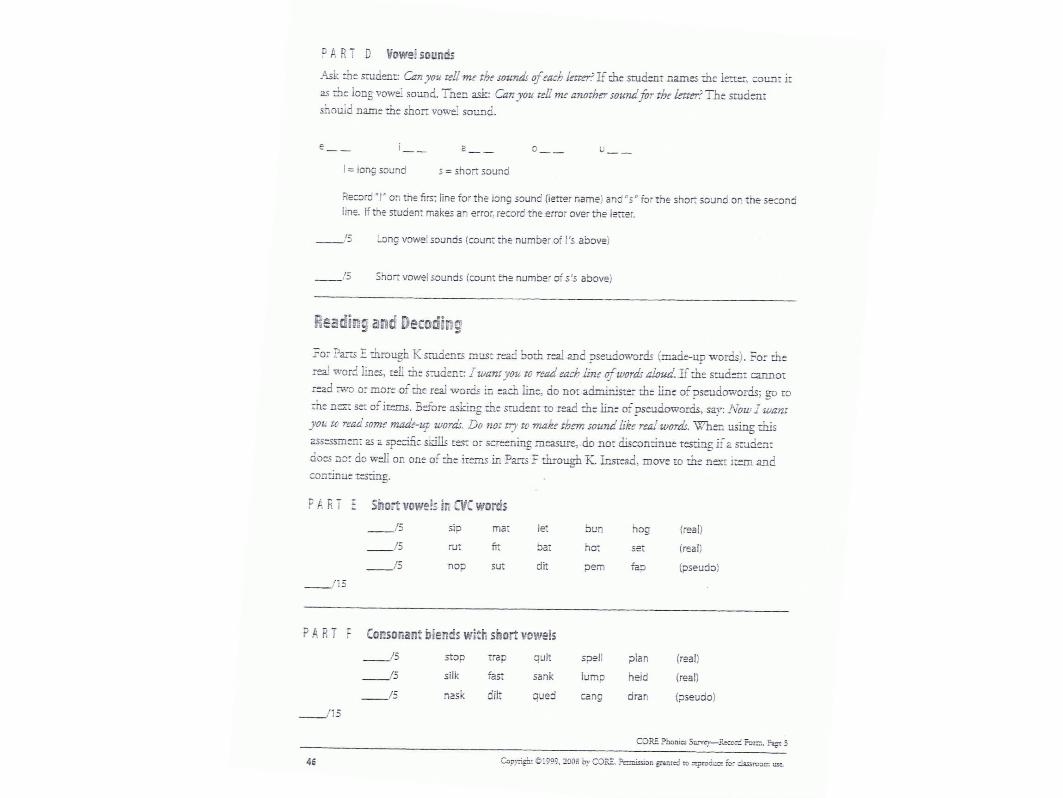
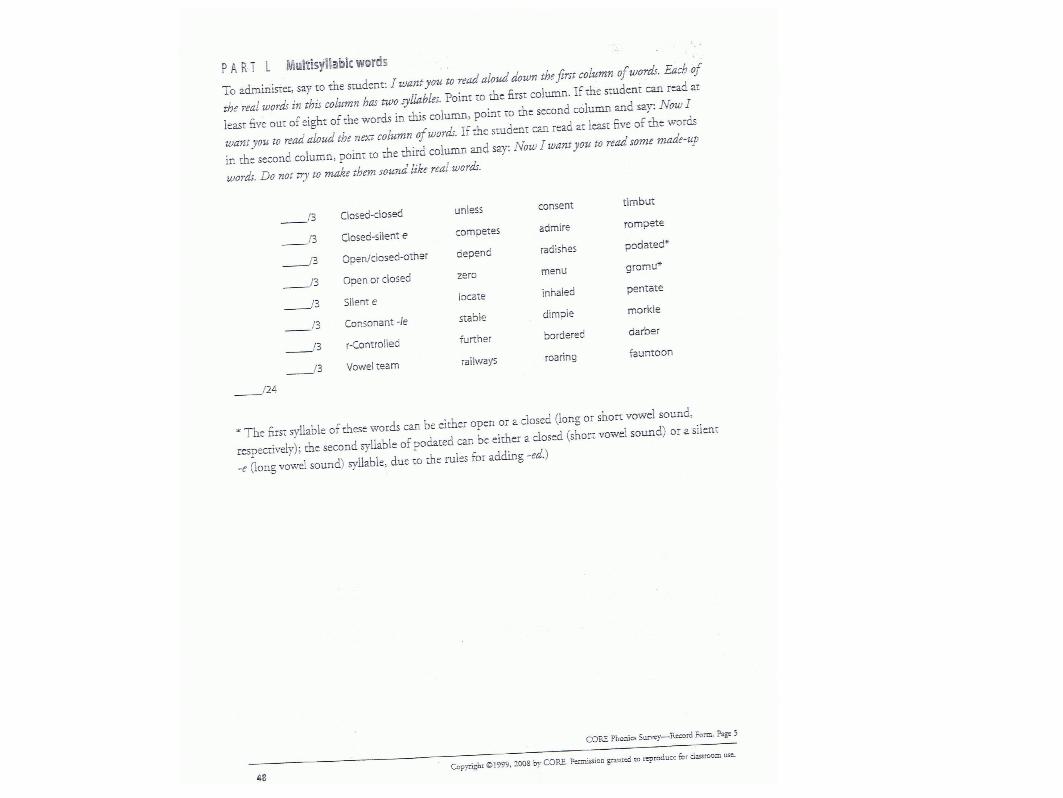
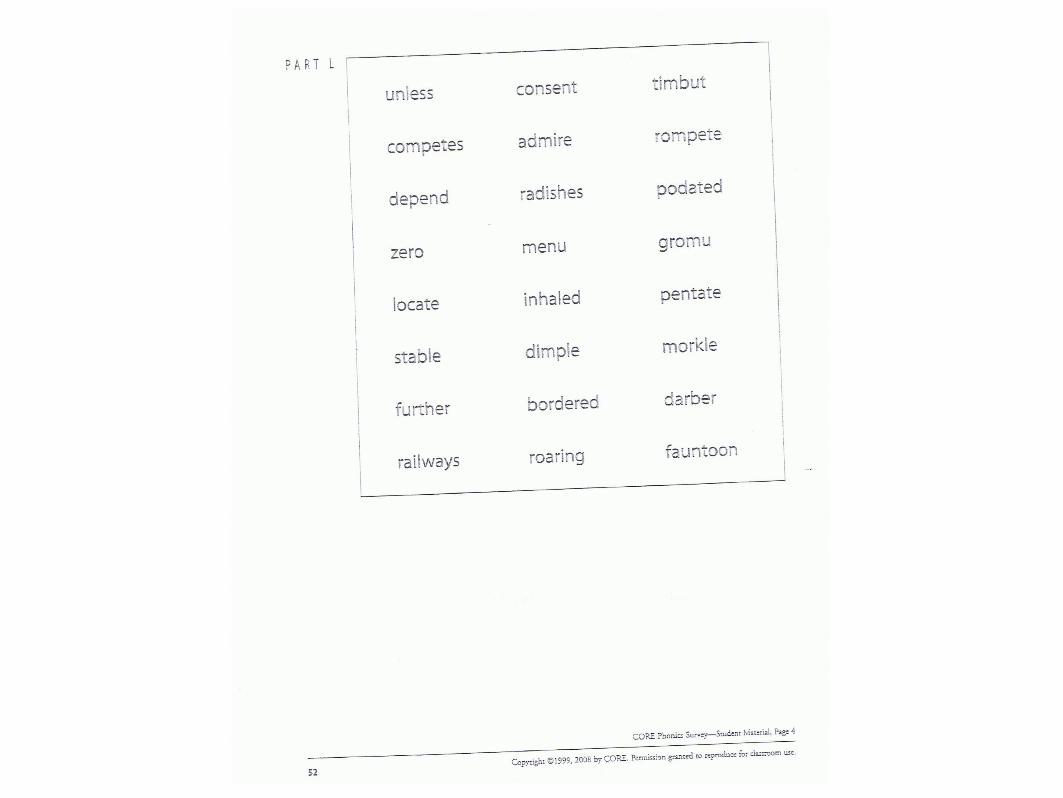
Core Phonics Survey
http://www.nsbsd.org/cms/lib01/AK01001879/Centricity/Domain/41/CORE%20Phonics%20Survey.pdf
http://www.nsbsd.org/Page/1014 (you may need to search “nsbsd and core phonics survey” for more specific assessments - diagnostic assessments