what do unions do in mexico? - economics · what do unions do in mexico? david fairris department...
TRANSCRIPT
July 2005
What Do Unions Do in Mexico?
David Fairris Department of Economics University of California
Riverside, CA 92521 [email protected]
Abstract This paper utilizes household and establishment survey data from Mexico to explore the impact of unions on wages, wage inequality, fringe benefits, turnover, job training, productivity, and profits. Mexican unions have a significant effect on these outcome measures for workers and firms. Unions raise wages, decrease wage inequality, increase both the value of fringe benefits per worker and the ratio of fringe benefits to total compensation, increase job training, and raise productivity per worker. Contrary to the broader literature on union effects, unionized establishments in Mexico experience greater worker turnover and witness no significant reduction in profit rates. I thank Ted Levine and participants at the Latin American Studies Association Meetings and the Eastern Economic Association Meetings for helpful comments. Thanks are also due to Erik Jonnason and Albert Pasaoa for excellent research assistance and to UC-Mexus for financial support.

1. Introduction
In their widely cited book, What Do Unions Do?, Richard Freeman and James
Medoff (1984) argued that, in addition to behaving as a “monopoly” and raising wages
above those of similarly situated nonunion workers, unions affect a host of other worker
and firm outcomes based on their “voice” in collective bargaining. This voice view of
unions held that union goals were broader than just wages, that labor markets contained
impediments to labor mobility (which made voice a good substitute for exits), and that
there was slack and inefficiency in managerial performance (which allowed voice to
enhance firm efficiency).
The real power of the book lay in its empirical findings. Freeman and Medoff
marshaled persuasive evidence to support their position that union voice effects are
quantitatively and statistically significant. They found that unions raise wages, consistent
with the earlier work of H. Gregg Lewis (1963), but that unions also decrease overall
wage inequality, raise fringe benefits and productivity, and lower turnover and profits.
Since the book’s publication, the empirical analysis has undergone further refinement and
testing. We now possess a body of empirical evidence supporting many of the
propositions put forth by Freeman and Medoff and for a variety of developed economies,
such as the UK, Japan, and Australia, in addition to the US.
However, what unions do in developing country contexts remains largely unexplored
terrain. There is only the single contribution of Guy Standing on Malaysia (1992) that
attempts to test various aspects of the voice view of unions in a developing country.1 The
1 The analysis of wage impacts is somewhat more common in developing country contexts. For example, Butcher and Rouse (2001) estimate the union relative wage effect, and Schultz and Mwabu (1998), the

absence of empirical work on union voice effects in developing countries is unfortunate.
Unions in developing countries are often as pervasive and politically powerful as those in
developed economies, and their impact on economic efficiency, growth and distribution
is arguably a more pressing matter than in developed-country contexts. Moreover, the
evidence to date on union wage impacts in developing countries suggests magnitudes that
are generally larger than those found for developed economies. Standing’s analysis found
that unions lower the quit rate, raise the level of productivity, stimulate product and
process innovations, increase firm-sponsored worker training, and enhance the likelihood
that a worker is enrolled in a pension plan.
The absence of a well-developed literature on union voice effects in developing
country contexts is, in part, explained by the lack of high-quality micro-survey data on
households and establishments. However, data gathering of this sort has now reached a
level in both quality and quantity in many developing countries, Mexico among them,
that there is nothing currently preventing an extension of Freeman and Medoff’s analysis
to a number of developing economies.
This paper utilizes recent household and establishment surveys in Mexico to explore
the monopoly and voice effects of unions on workers and firms in this developing
country. After a brief review of the institutions of collective bargaining in Mexico, I turn
to a discussion of the two data sets employed in this analysis and the basic empirical
approach to be followed in estimating union effects. The results section opens with an
analysis of union density in Mexico, and the impact of unions on wages and wage
union impact on wage inequality in South Africa. Teal (1996) estimates the union impact on average wages across firms in Ghana. Panagides and Patrinos (1994) utilize 1989 household survey data to estimate the union relative wage effect in Mexico.

inequality. I then turn to an analysis of the union impact on fringe benefits, job training,
turnover, productivity, and profits. The results reveal a labor movement in Mexico that is
a significant portion of the formal sector labor force, but which has declined precipitously
in the past two decades. Unions in Mexico raise wages, lower wage inequality, increase
fringe benefits (both per worker and in relation to overall compensation), raise job
training, and increase productivity. Unionized establishments in Mexico experience
greater worker turnover and suffer no loss in profits.
2. The Institutions of Collective Bargaining in Mexico
Research on the labor movement in Mexico is typically devoted to an analysis of the
political power held by unions. A great deal is known about the history of the alliance
between Mexican unions and the Institutional Revolutionary Party (PRI), for example,
about the power this alliance granted labor, but also the ways in which it prevented
independent, democratic unions from forming (Middlebrook 1995). The recent struggle
to form independent unions, current efforts to change labor law, the decline in labor’s
influence in determining the minimum wage, the difficulty of organizing in the
maquiladoras, cross-border cooperation between unions, and the evolution of both the
structure and leadership of specific unions are all well-researched areas.
We know much less about the economic impact of unions. Recent research has shed
light on the effect of unions on overall wages and benefits levels through national or
regional commissions or legislation – such as in setting minimum wages or influencing
social security legislation – and the specifics of particular bargaining outcomes in select

industries – such as the telephone workers’ recent contract, which charts out a “flexible”
model for labor-management relations. However, very little is known about the economic
accomplishments of unions through the process of collective bargaining. In part, this is
because many Mexican researchers believe union effects at this level are minimal.
Documenting the impact of collective bargaining on wages and benefits, and productivity
and profits, is important. The results will not only tell us “what unions do” through
collective bargaining in Mexico, but also what we might expect to see in the future if
unions evolve into independent entities that look more to themselves, as opposed to the
state, to accomplish their economic goals.
A union in Mexico may be started by workers without a formal representation
election. In the private sector, a group of twenty workers (in the firm, occupation, or
industry) may start a union. Once registered with the Conciliation and Arbitration Boards
(or the Ministry of Labor and Social Welfare, depending on jurisdiction), the union
possesses legal standing and may engage in collective bargaining with the employer(s).
There is no need to prove majority support among workers, as in the US for example.
But, like in the US case, once a collective bargaining agreement is signed, the language
applies to all workers in the relevant firm(s).2
It is well known that some Mexican unions register with the Conciliation and
Arbitration Boards when in fact there are no supporting workers in the plant(s); these are
the so-called “ghost unions” or “sindicatos fantasmas.” These unions typically exist to
write “protection contracts” with employers, which prevent other unions from forming in
2 Actually, in the US, this extension of the contract is granted to workers in the relevant collective bargaining unit, as determined by the National Labor Relations Board. In Mexico, barring any other existing union in the enterprises, the collective bargaining agreement covers every worker.
the plant(s), but do little to represent workers’ interests. These types of contracts have
been growing in recent decades.
Once formed, however, active unions bargain with employers in much the same way
as unions in the US. They do this sometimes through industry-wide structures3 and
sometimes not, and write collective bargaining agreements that, with varying degrees of
exactness, attach wages to jobs, utilize seniority as a criterion for promotion and layoff,
regulate training provision, dictate benefits, and contain a procedure for adjudicating
grievances, much like in the US.4 New contracts are voted on by the membership. Thus,
with regard to what is accomplished in the process of real collective bargaining, we might
expect economic outcomes that are qualitatively similar to, albeit perhaps quantitatively
distinct from, those found for unions in the US. Is this what we observe?
3. Data and Empirical Methodology
I utilize two data sources in this paper, both gathered by the Instituto Nacional de
Estadística, Geografia e Informática (INEGI). The first, the Encuesta Nacional de
Ingresos y Gastos de los Hogares (ENIGH), is a national household survey that began in
1984 and continued in 1989, 1992, and every two years thereafter. Each survey is a
stratified sample based on city size, with a similar sampling distribution across the survey
years, and weights that render the sample representative of the national experience. I
utilize information on working individuals from the surveyed households. The data
3 Formal industry-wide union bargaining is less common in Mexico, but there are government provisions (referred to as “contratos ley”) in seven industries – including textiles, rubber, and sugar – which establish bargaining outcomes for all workers in the industry.

contain good information on certain labor market characteristics of workers. Most
importantly for my analysis, however, these are the only micro-level worker surveys in
Mexico that contain information on union status.
The worker samples utilized in this analysis are wage earners who are sixteen years of
age or older and who work at least twenty hours per week. The earnings variable is the
hourly wage, and is computed based on reported earnings during the month prior to the
survey and reported hours of work. To insure an accurate measure of the wage, workers
who are self-employed or working without pay are excluded from the analysis. Reported
earnings for the self-employed are likely to include returns on owned capital, which
would bias upward the measured wage. Because information is available on union status
only for the primary job of a respondent, those workers who hold more than one job are
excluded. Finally, “informal sector workers” – those in agriculture, forestry, and fishing,
and those who engage in domestic service or who are sellers of goods or services without
a fixed or stable establishment – are also excluded. Table 1 gives the definitions for the
full set of variables used in the analysis.
The second data source, the Encuesta Nacional de Empleo, Salarios y Tecnología y
Capacitación en el Sector Manufacturero (ENESTYC), is a survey of manufacturing
firms, both foreign and domestic, operating in Mexico. I make use of surveys conducted
in 1992 and 1999. The surveys contain information on union status of the establishment
as well as measures of turnover, productivity, training, the value of fringe benefits, and
profits. Important control variables – such as establishment size, occupational
4 This observation is based on published union studies, my own interviews with union leaders and company representatives, and a perusal of specific bargaining agreements, including those of the petroleum workers, the electrical workers, and workers at the Mexican Institute for Social Security.

distribution, age, and the share of capital that is foreign owned – are plentifully provided
in the data.
The surveys are a stratified sample of manufacturing establishments based on
industry classification and establishment size. Weights are provided in the data, and used
in the analysis below, to render the descriptive statistics and statistical results
representative of the national experience in Mexican manufacturing. Publicly-owned
enterprises, which are a small and declining segment of the manufacturing sector over
this period, are excluded. Table 2 gives the definitions for the full set of variables used in
the analysis.
Tables 3 and 4 present the means and standard errors for the variables used in the
analysis. Of course, comparisons of means may fail to accurately unearth true
substantive structural differences across the two populations, and precisely because the
two populations are different along a variety of other relevant dimensions. So, for
example, Table 4 reveals that the value of fringe benefits per worker is much larger in the
union sector than in the nonunion sector. But, so, too, is firm size for example, and larger
firms are more likely to offer fringe benefits to their workforce than are smaller firms. Is
the larger fringe package in unionized establishments a reflection of something unions
do, or just a reflection of the fact that unions are more prominent in large firms and large
firms are more likely to offer fringe benefits?
To address this concern, I explore the union impact on variables of interest holding
other intervening factors constant in the analysis. A multiple regression framework is
used in which the variable of interest (e.g., the fringe benefits share of labor costs or
productivity) is regressed on a host of control variables (e.g., firm size, the occupational

structure of the plant, the age of the plant) and a union indicator variable.5 The union
impact is reported as a percentage of the nonunion mean. The effect is the estimated
percentage difference (increase or decrease) in the variable of interest that the average
nonunion worker or firm would experience if that worker or firm were to become
unionized. The nonunion means appear in Tables 3 and 4, and so the estimated union
coefficients themselves can be derived in a straightforward manner by interested readers.
In the discussion that follows, I also indicate the robustness of the estimates by
indicating to what extent the results change when different samples from the surveys or
different specifications of the regression equations are used. So, for example, the
establishment regression results presented in the paper have been run with a larger set of
detailed industry controls, with the exclusion of firms containing 5 or fewer workers (i.e.,
the informal sector), and with union density measures for the industry or the municipio (a
political description analogous to the county) added to the list of control variables. The
findings of these analyses are reported when they are substantively different from those
reported in the paper or when they lead to substantively different interpretations of the
results. (The union density measure at the industry level is almost universally important;
the municipio union density is rarely important.) Finally, in the 1999 establishment
survey, establishments were asked not just whether a union was present in the
establishment, but also what percentage of the plant workforce were union members. I
have re-estimated the 1999 results using this establishment union density measure in
5 The analysis of wage and wage inequality effects is conducted using two structurally separate equations, one for the union sector and another for the nonunion sector. Regressions are run using the natural log of wages as the dependent variable.

place of the union dummy. Interestingly, in no case were the sign or statistical
significance of the results substantively altered.
4. Results
Union Density
I begin with a discussion of union density in Mexico – the percentage of the
workforce unionized – and how it has changed in recent years, using the ENIGH data.
Figure 1 illustrates union density over the period 1984 to 2000. For the “formal sector”
labor force, we see that union density went from just over 30 percent in 1984 to under 20
percent in 2000. If “informal sector” workers are included in these calculations, the
numbers are 26 percent and 17 percent respectively.6 The biggest and steadiest decline
was a nine percentage-point decline from 1984 to 1994, with an approximate leveling-off
thereafter.
Union densities by major industry categories reveal a general decline across all
sectors (Fairris and Levine 2004a). The mining, electricity, water and gas pipeline
industry, the industry with the largest union density at the beginning of the period at 62
percent, experienced a rather significant decline in density early in the period, between
1984 and 1994, and a less-steep drop again between 1998 and 2000, arriving at 47
percent union density by the end of the decade. Over the entire period, union density
declined 10 percentage points in manufacturing, 8 percentage points in the service sector,
and 5 percentage points in the commercial sector. The construction sector, after a
6 The true “informal sector” is a large percentage of the labor force in Mexico – some estimates put it at 40 percent or more – but many of these workers are properly classified as self employed. Focussing, as we do here, on wage and salary workers, inclusion of the “informal sector” does not change the numbers by very much.

substantial increase to 9 percent union density by 1989, then dropped 7 percentage points
over the 1990s. There was little change in the ranking of union densities by industry
sector.
A similar result holds for union densities by occupation (Fairris and Levine 2004a).
Education workers (i.e., teachers at all levels of instruction), who are far and away the
most highly unionized occupation in Mexico, experienced an 8 percentage point decline
in union density between 1984 and 2000. Technicians, in second place in the rankings of
highly unionized occupations, witnessed a 21 percentage point decline. Again, the
general trend among the occupational densities was a period of steep decline in the 1980s
and early to mid 1990s, with a tendency to level off or even recover slightly thereafter,
and then sometimes a slight drop again from 1998 to 2000. An interesting exception is
the case of professionals, who saw a steady rise in union density from 1984 to 1994, and
a steady decline thereafter.
What accounts for the general decline in union density? On the one hand, rates of
unionization may change due to changes in the industrial, occupational, or geographical
composition of jobs in the economy, or to changes in the education, age, and gender
composition of workers in the labor force. We can think of these as “compositional”
factors. Alternatively, the decline may be the result of systemic “institutional” factors,
such as changing support for unions by government actors or a changing desire for, or
resistance to, unions by workers or employers.
The evidence on declining union densities by industry and occupation suggest that
compositional factors such as changing industry and occupational mix are not likely to
account for the overall decline in the percent of the labor force organized in Mexico.

Union density declined in nearly every single category, and typically by a large amount.
This suggests that a change in the institutional climate for organizing and retaining union
members is an important factor in declining union density.
Fairris and Levine (2004b) decompose the changing union density over this period
into “institutional” and “compositional” forces following the statistical technique found
in Farber’s (1987) analysis of the decline in union density in the US. Based on this
analysis, they find that less than one-fourth (24 %) of the decline in union density is due
to changes in job and labor force compositional characteristics, while over three-fourths
(76 %) is due to structural and institutional changes in the ability of unions to organize
and retain members.
Union Effects on Wages
One of the primary goals of collective bargaining is to set wages. By how much do
unions bid up wages above what similar workers earn in the nonunion sector, and how
has this changed over time in Mexico?
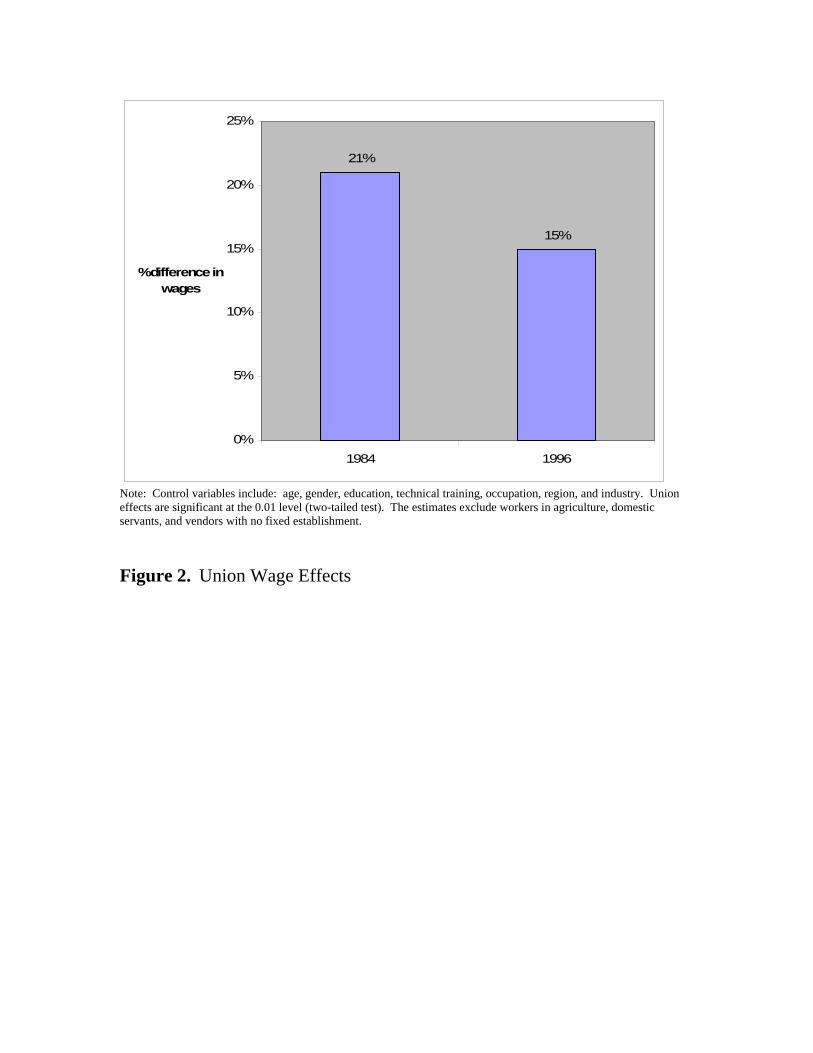
Figure 2 gives the percentage difference in the conditional mean wage (not in log
form) for union workers in 1984 and 1996 based on the regression analysis. This
represents the predicted percentage gain in wages earned by the average nonunion worker
upon leaving the nonunion sector and joining the union sector. In 1984, unions bid up
wages by 21%, whereas in 1996 the union relative wage effect had fallen to 15%. Unions
appear to have lost some bargaining power over wages during this period, arguably
related to the rather significant decline in union density. However, despite the decline in

union density, Mexican unions continue to have a statistically significant and
quantitatively sizeable impact on wages.
Union Effects on Wage Inequality
Historically, unions have strived to take wages out of competition. Within the plant,
this means eliminating pay differences across workers based on arbitrary characteristics
such as ethnicity or gender. Across plants, the goal amounts to equalizing the average
wage bill of similar plants in an industry. Taking wages out of competition is both
normatively just, in that it fosters equal pay for equal work, and strategically wise, in that
it reduces the power of employers to put workers into competition with one another in an
effort to reduce wages. Another common goal of unions is to level the pay structure
across worker skills by raising wages more for low-skill workers than for high-skill
workers. This, too, is viewed as normatively fair and strategically wise by unions in that
it fosters solidarity through distributive justice.
Figure 3 gives the percentage difference in the conditional variance of log wages in
1984 and 1996 for union workers. This represents the predicted change in wage
dispersion in the nonunion sector were it to become unionized. Unions appear to exert a
powerful influence on wage dispersion in Mexico. Workers in the nonunion sector would
experience over a 40% reduction in wage inequality were they to be union members in
1984, and a 35% reduction in 1996. The impact of unions on overall wage inequality in
Mexico, even when including the “informal sector” labor force, is negative and
statistically significant (Fairris 2003).
The modest decline in the ability of unions to reduce wage inequality over the period
is interesting, especially in light of the fact that wage dispersion grew fairly dramatically
during these years. Between 1984 and 1996 the variance of log wages in the overall
economy rose from 0.555 to 0.663, or by roughly 19%. Fairris (2003) estimates that, had
the unions’ ability to reduce wage dispersion remained unchanged over this period, wage
inequality in the formal sector in 1996 would have been lower by roughly 11%.
Declining union density accounts for some this effect: fewer unionized workers means
fewer workers who are affected by the dispersion-reducing ability of unions. But the
declining bargaining power of unions plays a powerful role as well.
Union Effects on Fringe Benefits
Unions increase wages through collective bargaining. Do they also bid up fringe
benefits, another important feature of the compensation package for workers? Collective
bargaining agreements in Mexico commonly contain language stipulating the extent of
fringe benefits, including private health services (such as dental and vision care),
transportation expenses, private pension benefits, educational expenses for workers’
dependent children, the “aguinaldo” or Christmas bonus, child care, subsidized loans,
payment of real estate fees, and more.7
We might expect unions to positively influence the value of fringe benefits because of
their effect on wages. As wages increase, workers’ demand for fringe benefits will also
rise if the latter are normal goods or if wages are taxed progressively whereas fringe
benefits are not. Thus, in exploring the effect of collective bargaining on fringes, it is
7 The analysis that follows excludes consideration of the government-mandated seguridad social payment, which is not subject to collective bargaining.

important to know whether unions affect fringe benefits absent their effect on wages.
Figure 4 shows the percentage difference in the conditional value of fringe benefits per
worker for unionized establishments, controlling for a host of fringe benefits
determinants including wage per worker. The difference represents the expected change
in benefits per worker for the average nonunion establishment if it were to become
unionized.
The results suggest that unionized establishments offer a 142% increase (more than
double the amount) in fringe benefits per worker than similar nonunion establishments in
1992, but a substantially smaller increase in 1999. The quantitative significance of these
effects is reduced when more detailed industry controls are added to the analysis (by
roughly two-thirds in the 1992 results, for example) and when informal sector firms (i.e.,
firms with five or fewer workers) are excluded.8 In neither case, however, is the statistical
significance level greatly affected. These results offer strong evidence of a union voice
effect on fringe benefits in Mexico.
The impact of unions on benefits does not emanate solely from plant-level
bargaining; union density in the industry matters as well. If the density of unionization in
the industry (measured as the percentage of establishments unionized) is entered into this
analysis of fringe benefits determination, its impact is positive, quantitatively large, and
statistically significant. However, the union status variable remains largely unchanged in
quantitative significance and strongly statistically significant despite this change in
specification.
8 Unionized establishments are indeed more prevalent, as a percentage, among formal as compared to informal sector firms using this size criterion. However, it is interesting to note that unionized establishments represent 2% of firms with five or fewer workers.

Union Effects on the Fringe Benefits Ratio
Do unionized firms offer compensation packages in which the proportion of fringe
benefits in total compensation is higher, ceteris paribus, than in nonunion firms?
Nonunion firms adjust the components of a given compensation package to accord with
the preferences of those workers who are on the margin of quitting or entering the firm.
These workers are typically young and less concerned with benefits or retirement
packages. In unionized establishments, the components of the compensation package are
formulated through collective bargaining, where the preferences of infra-marginal
workers play a bigger role. They are typically older and more concerned with health and
retirement benefits. Therefore, we might expect fringes to be a larger fraction of total
compensation in unionized settings, where preferences are conveyed through a
democratic “voice” mechanism rather than through market forces.
The impact of unions on the ratio of benefits to total compensation is given in Figure
5. Unionized establishments possess a benefits ratio that is nearly double that of nonunion
establishments in 1992, but, again, this effect is somewhat reduced in the 1999 results.
These results are robust to the exclusion of “informal sector” firms and to the inclusion of
more detailed industry controls. The inclusion of union densities at the industry level
leaves the estimated impact of plant-level unionization largely unchanged, while the
industry union density effect is itself large and statistically significant. Thus, the results
suggest that while unions bid up both wages and fringe benefits, and thus total
compensation, they also tilt the mix of compensation components towards fringes. This is

suggestive evidence that the process by which workers’ preferences are conveyed is
different in union versus nonunion settings.
Union Effects on Training
Collective bargaining agreements in Mexico commonly address issues of job
training.9 In addition, the Mexican Constitution contains language regarding the amount
of annual training firms are required to offer workers, and unions may play a role in
enforcing this constitutional right in a way that nonunion workers cannot. Figures 6 and 7
offer estimates of the union impact on several different measures of job training – the
average and total hours of job training and the share of the workforce trained. In every
case, unionized firms are found to offer more job training to their workers than similar
nonunion firms. In the 1992 survey, average hours of training are almost seven times
greater in union environments, and the difference in the share of the workforce receiving
training is on the order of 300%. In 1999, the difference in the share trained is slightly
lower, at 250%. All estimated effects are strongly statistically significant.10
The 1999 data do not contain information on average hours of training, but rather
total hours of job training during the year. According to the descriptive statistics in
Tables 4 and 5, hours of training have risen over the period. Thirty-three percent of the
workforce, or 36 workers on average, received training in unionized establishments in
1992, and these workers received on average 19 hours of training, for a total of roughly
9 Rather than stipulating specific hours of training, contracts typically require that companies provide “sufficient training” to workers or that a commission, composed equally of union and company representatives, be set up to regulate job training. 10 Evidence on the union impact on training in developed country contexts is mixed. However, Barron, Berger, and Black (1997) find some evidence for a positive effect in the US, and Booth (1991) and Green (1993) find similar evidence for the UK.

700 hours of training. In 1999, that number had risen to 1300. This seems like a rather
large increase, but in a period of rapid technological and organizational change (73% of
unionized establishments in 1999 reported having acquired new machinery in the
previous three years), it is perhaps plausible, and especially so given that the share of the
workforce receiving training also rose over the period (from 33% to 46%). The impact of
unions on the total hours of training in 1999 is quantitatively significant, although only
marginally statistically significant.
Unionized firms offer far more hours of training to those workers who receive
training and train a larger percentage of their workforces annually than nonunion firms.
These results are robust to a number of changes in the basic specification of the training
regressions. If “informal sector” firms are excluded from the analyses, the statistical
significance and even quantitative impact are not substantively diminished. (Indeed, in
the case of the 1999 total hours of training regression, the estimated union effect
increases by almost 100 hours and becomes statistically significant at the 10% level.) We
might be concerned that, within broad industrial categories, heavily unionized sectors
train workers more not because of unionization per se but because union status proxies
for some feature of production that is correlated with training and yet omitted in the
regression analysis. However, even when extremely detailed (298) industry controls are
added to the various regression equations, the results are not substantively altered. And
finally, the plant-level union effect remains similarly strong and statistically significant
when an industry-level union density measure is introduced into the equation. Moreover,
in every case this latter measure is both quantitatively powerful and statistically
significant.

Unions Effects on Turnover
One of the more robust findings in the literature on union effects is that unionized
workers have lower turnover rates than their comparable nonunion counterparts. One
reason for this is that unions bid up wages and benefits, and so discourage worker quits.
But, the literature has established that quits are lower in unionized environments even
after controlling for differences in compensation. The lower residual quit rate is
presumably due to the “voice” workers are granted by virtue of unionization, which
allows them to express concerns and have influence over a wide array of work life issues
beyond wages and fringe benefits.
Figure 8 gives the estimated union impact on the worker quit rate for 1992 and on the
overall rate of labor turnover in 1999. In both cases, the results are unexpected – unions
positively affect both quits and turnover. A nonunion firm that undergoes unionization is
predicted to experience a near trebling of its worker quit rate in 1992. According to the
results of the 1999 analysis, the overall turnover rate is also predicted to rise with
unionization, although in this instance the effect is not statistically significantly different
from zero. These results are robust to the various specification changes invoked in
previous analyses, such as eliminating the informal sector and controlling for more
detailed industry categories. They are also robust to adding controls for overall
compensation per worker.
What explanation might be offered for this peculiar finding? The most obvious
statistical explanation is that some intervening variable – which is correlated with both
unionization and quits – is missing from the analysis and therefore contaminating the

results. Working conditions are a potential candidate in this regard. Workers who are
unhappy with their conditions of employment are both more likely to quit and more likely
to form unions, all else constant. Even if unions, once formed, improve the compensation
package and make some inroads improving the other conditions of employment,
unionized firms may still be disproportionately drawn from the population of firms with
bad working conditions.
In the absence of adequate controls for these other conditions of employment, one is
left with limited options. As was already mentioned, adding more detailed industry
controls, which might capture some of these omitted effects, leaves the estimated union
impact on quits and turnover largely unchanged. Another option is to instrument the
union variable, and thereby purge it of its correlation with these omitted variables. As it
happens, union density in the local municipio appears to serve as a good instrument in
that it is highly correlated with union status but statistically insignificant in explaining
residual variation in quits or turnover. Instrumenting the union dummy variable in this
way reduces the positive effect on quits and turnover in most specifications, eliminates
the statistical significance in some specifications, and in a limited number of
specifications even renders the effect negative, but never statistically significantly so.
If, on average, unionized firms in Mexico do indeed experience higher rates of quits
and labor turnover than comparable nonunion firms, is there significant variation across
firms in regards to this result? To explore this, I interacted the union dummy variable in
this analysis with a variety of different control variables. One result stands out. Unionized
firms with a large share of foreign ownership, a large share of imported materials, and
who sell primarily to the international market – i.e., a quintessential description of the

maquiladora sector – experience significantly lower turnover than do other union firms.
This result is most pronounced in the 1992 data. For example, in a simple interactive
specification which includes the union dummy, its interaction with the %FDI variable,
and the other control variables, the estimated coefficient on the union dummy variable is
10 (and statistically significant at the .01 level), while the estimated interactive effect is
-0.2 (and statistically significant at the .01 level).11 Unionized foreign firms not only
experience lower quits than their domestic union counterparts, they also experience lower
quits than their nonunion foreign counterparts. According to this analysis, a fully foreign-
owned firm that becomes unionized is predicted to witness a 10-percentage point
reduction in the quit rate (10 – 0.2*100).
Thus, when we isolate a sector of the Mexican economy in which foreign firms are
dominant, and compare quit rates across comparable union and nonunion firms therein,
the negative effect of unions on quit rates, commonly observed in the literature, emerges
in Mexico as well. Further research is required on this issue, but these results suggest that
the positive union effect on turnover in Mexico is unique to domestic firms.
Union Effects on Productivity
Unions might affect productivity in a variety of ways, both positive and negative.
When unions raise workers’ wages, firms have an incentive to augment the capital
intensity of production, thereby raising labor productivity. We have seen that unionized
firms offer more job training to workers, which raises the skill level and productivity of
the workforce. Also, unions grant workers a voice in production, and thereby a means for
11 In the 1999 data, the union-%FDI interactive is negative but very small, and statistically significant only at the 20% level.

altering production methods that are both a source of discontent for workers and
unproductive as well. On the other hand, union work rules that elevate staffing levels,
and union promotion and layoff policies which are typically based on seniority rather
than merit, may hinder labor productivity.
Figure 9 gives the results of the union productivity analysis.12 Unionized
establishments are roughly 30% more productive than similar nonunion establishments in
1992 and 11% more productive in 1999. In each case, the estimated effect is strongly
statistically significant. The estimates fall, although not precipitously and never below
statistical significance at the 5% level, with a number of alterations. For example, the
union impact on total-factor productivity, found by regressing the residual of a simple
log-in-log production function on the host of other control variables and union status, is
21% in 1992 and remains unchanged at 11% in 1999. If more detailed industry controls
are added, thereby forcing a more refined comparison of within industry differences
between union and nonunion establishments, the estimate for 1992 falls to 25%, whereas
the 1999 estimate rises to 12%. If “informal sector” firms are removed from the sample,
the estimated union impact falls to 15% in the 1992 results, but rises to 17% in the 1999
results.
There is insufficient information in the surveys to adequately explore the various
causes of this positive union effect on productivity. Survey information does allow us,
however, to test the worker training explanation. If both measures of job training are
added to the right-hand side of the labor productivity regressions, the estimated union
12 This analysis was conducted using log values for value of product, value of capital, and value of material inputs per labor hour.

impact falls to 24% in 1992 but is largely unchanged in 1999. Thus, while superior
training may account for some of the positive productivity effect of unions, other factors
appear to be of greater importance. Future research should investigate more carefully the
factors accounting for the impact of unions on productivity. The results presented here
offer suggestive evidence that there exists a statistically significant and quantitatively
sizeable difference between union and nonunion establishments with regard to labor
productivity, and that unionized establishments are superior.13
Union Effects on Profits
Since unions raise wages and benefits, they might be expected to decrease the profit
rate of establishments in which they exist. However, unions also increase productivity,
which should have a positive impact on profits. How do these competing forces play out
in the determination of the profit rate? The data pose several challenges for the researcher
wishing to explore this issue. The surveys contain good measures of the value of output,
materials costs, and net assets in the survey year. They do not, however, offer reliable
estimates of annual labor costs.
First, not all expenses associated with labor are captured in the surveys; only wage
and benefits costs are measured with accuracy and consistency across the two survey
periods. More problematic is the absence of an annual measure of even these expenses
associated with labor. The surveys offer a reasonable estimate of wage and benefits costs
for the month of March in the year of the survey. Thus, to arrive at an annual measure of
13 Some caution is warranted here. In using the value of production per worker to capture productivity, this supposed productivity effect might be merely a price effect instead of an output effect. Unionized firms face higher wages, and may pass those added production costs onto consumers in the form of higher prices.

labor costs for each establishment, I compute wage and benefits expenses per worker in
March, multiply this by 12, and then multiply by the average number of workers
employed in the establishment during the survey year.
This approach turned out to be particularly problematic for establishments with five
or fewer workers, as the mean rate of return on investment for this group, using the above
approach, is negative in both survey years. I therefore chose to focus on formal sector
firms only, where the descriptive statistics are more plausible. The results appear in
Figure 10. According to these estimates, unions exert a quantitatively sizeable negative
impact on profits. In 1992, the difference amounts to a 19% reduction in the rate of return
on investment, whereas in 1999 the effect is much larger, at 140%. In neither case,
however, is the result statistically different from zero. This lack of a statistically
significant effect is robust to the various re-specifications conducted in previous analyses.
Simultaneity bias is a major specification concern with these results. Unions are
likely to organize in establishments and industries with high profit rates. Even if unions
lower profits, because they organize in high profit sectors, we might not able to establish
this negative impact on profits in OLS regressions. In an effort to address this concern, I
instrumented the union variable using union density in both the industry and municipio
(neither of which, curiously, has a significant impact on profits), but found the results to
be largely unchanged. While clearly the most tentative findings offered in the paper, the
results presented here nonetheless suggest that there is no statistically significant
relationship between unionization and the profit rate.

Union Effects Over Time
Unions have a powerful impact on labor market and firm outcomes in Mexico. Using
data from two surveys over two time periods to estimate each union effect serves as a
robustness check on any single finding. However, the intertemporal nature of the data
also allows us to discern trends. The union effects are almost universally declining over
this period.
Further research is required to adequately explain these observed trends. One likely
factor is declining union density. But, the industrial relations literature in Mexico also
points to certain institutional changes that may have compromised the ability of unions to
influence firm and labor market outcomes. Among these are: the flexibilization of
production (Zapata 1998); the break up of bargaining structures in the newly-privatized
industries (De la Garza, 1990); and the concerted efforts of political authorities to
maintain lower wages and benefits in the foreign assembly plants of the north (Shaiken
and Herzenberg, 1987).
6. Conclusion
This paper offers an assessment of the monopoly and voice effects of unions in a
developing country context. Unions in Mexico are found to have a significant impact on
firm and labor market outcomes. Through collective bargaining, unions raise wages and
fringe benefits for workers, and distribute the gains from productive activity more equally
among the workforce. Unions also encourage firms to offer more job training and
enhance firm productivity.

Mexican unions do not appear, on average, to significantly lower profit rates or to
reduce worker quits. These results run counter to findings in the larger literature on union
effects in developed country contexts. Further analysis suggests that the higher quit rate
in unionized establishments in Mexico may have less to do with Mexican unions and
more to do with Mexican firms. Unionized foreign firms in Mexico possess lower quit
rates than similar nonunion foreign firms.
Finally, the results of this paper suggest that Mexican unions have lost some of their
ability to influence worker and firm outcomes over the last two decades. The union wage
and benefits effects, the impact on wage inequality, and the ability of unions to influence
job training and productivity have all declined over the 1980s and 1990s.

References
Barron, John M, Mark C. Berger, and Dan A. Black. On-the-Job Training. Kalamazoo,
MI: Upjohn Institute for Employment Research. Booth, Alison L. “Job-Related Formal Training: Who Receives It and and What Is It
Worth?” Oxford Bulletin of Economics and Statistics 53(August): 281-94. Butcher, Kristin, and Cecilia Rouse. 2001. “Wage Effects of Unions and Industrial
Councils in South Africa.” Industrial and Labor Relations Review 54(2): 349-74. De la Garza, Enrique. 1990. “Reconversion industrial y cambios en el patron de
relaciones laborales en México.” In Anguiano, A., editor, La modernizacion de Mexico. Mexico City: Universidad Autonoma de Mexico, Xochimilco.
Fairris, David and Edward Levine.2004a. Declining Union Density in Mexico: 1984-
2000, Monthly Labor Review (September): 3-10. Fairris, David and Edward Levine.2004b. La disminución del poder sindical en México,
El Trimestre Económico 51(4): 1-30. Fairris, David. 2003. Unions and Wage Inequality in Mexico, Industrial and Labor
Relations Review 56(3): 481-97. Farber, Henry S. 1987. “The Recent Decline of Unionization in the United States,”
Science, 238(4829): 915-920. Freeman, Richard B. and James L. Medoff. (1984). What Do Unions Do? New York:
Basic Books. Green, Francis. “The Impact of Trade Union Membership on Training in Britain.”
Applied Economics 25(August): 1033-43. Lewis, H. Gregg. 1963. Unionism and Relative Wages in the United States. Chicago:
University of Chicago Press. Middlebrook, Kevin J. 1995. The Paradox of Revolution: Labor, The State, and
Authoritarianism in Mexico. Baltimore: The Johns Hopkins University Press. Panigides, Alexis, and Harry Anthony Patrinos. 1994. “Union/Non-union Wage
Differentials in the Developing World: A Case Study of Mexico.” Policy Research Working Paper 1269. World Bank: Washington, D.C.
Shaiken, Harley, and Stephen Herzenberg. 1987. Automation and Global Production in
Mexico, the United States, and Canada. La Jolla: Center for U.S.-Mexican Studies, University of California, San Diego.

Standing, Guy. 1992. “Do Unions Impede or Accelerate Structural Adjustment?
Industrial versus Company Unions in an Industrializing Labour Market.” Cambridge Journal of Economics 16(3): 327-54.
Teal. Francis. 1996. “The Size and Sources of Economic Rents in a Developing Country
Manufacturing Labour Market.” The Economic Journal 106: 963-976. Zapata, Francisco, compilador. 1998. Flexibles Y Productivos? Estudios sobre
flexibilidad laboral en México. Mexico City: El Colegio de México

Table 1. Variable Definitions: Household Surveys
Ln Wage Natural log of worker’s hourly wage Age Age Age2 Age squared Male Equals 1 if male; 0 if female Primaria1 Equals 1 if attended primaria, but did not complete; 0 otherwise Primaria2 Equals 1 if completed primaria and nothing more; 0 otherwise Secundaria1 Equals 1 if attended secundaria, but did not complete; 0 otherwise Secundaria2 Equals 1 if completed secundaria and nothing more; 0 otherwise Preparatoria1 Equals 1 if attended preparatoria, but did not complete; 0 otherwise Preparatoria2 Equals 1 if completed preparatoria and nothing more; 0 otherwise Superior1 Equals 1 if attended superior, but did not complete; 0 otherwise Superior2 Equals 1 if completed superior and nothing more; 0 otherwise Postgrado Equals 1 if attended postgrado; 0 otherwise Technical1 Equals 1 if completed a technical or commercial training program
which required no formal education; 0 otherwise
Technical2 Equals 1 if completed a technical or commercial training program which required completion of primaria; 0 otherwise
Technical3 Equals 1 if completed a technical or commercial training program which required completion of secundaria; 0 otherwise
Technical4 Equals 1 if completed a technical or commercial training program which required completion of preparatoria; 0 otherwise
South Equals 1 if lives in the south of Mexico; 0 otherwise Union Equals 1 if is affiliated with a union; 0 otherwise Occupation 13 categorical variables indicating occupation Industry 19 categorical variables indicating industry

Table 2. Variable Definitions: Establishment Surveys Benefits per worker Value of fringe benefits per worker per month Benefits as share of total compensation
Value of fringe benefits relative to total compensation
Average hours of training
Average hours of training received by trained employees in the survey year. (This is a weighted average of the average hours of training for specific occupations. None of the training measures include part-time, “por hora,” or contract workers.)
Total hours of training Total worker-hours of training for the establishment workforce in the survey year.
% Workforce trained Percentage of the establishment workforce receiving training from co-workers, instructors, or external agents.
Turnover Quits as a percentage of the workforce (1992 survey); overall job loss as a percentage of the workforce (1999 survey).
Labor productivity Value of annual production divided by total labor hours. Return on investment The value of production net of material and labor costs divided by net assets. Union Equals 1 if workers in the establishment are affiliated with a union; 0 otherwise. Wage per worker Monthly salary per worker. % FDI Percentage of capital of the establishment that originates from
foreign sources. % Domestic sales Percentage of sales destined for the domestic market. % Imported materials Percentage of annual expenditures on prime materials paid to
foreign sources. Workforce size The number of employees on March 31 of the year following the survey year.
(Excludes subcontracted workers and temporary – “por hora” – workers.) Years in operation Number of years the business has been in operation. % Male Percentage of workforce that is male. % Job rotation Percentage of production workers that have temporarily rotated
between jobs during the survey year. New machinery Equals 1 if the establishment introduced new machinery in the previous two
years. (The comparison year is three years previous for the 1992 survey.) % Part time Percentage of workforce composed of part-time workers. Subsidiary Equals 1 if the establishment is a subsidiary of a larger organization; 0
otherwise Employment growth Percentage growth in employment between survey year and
previous year. (The comparison year is two years previous for the 1992 survey.)
% Directive workers Percentage of workforce composed of directive workers. % Professional workers Percentage of workforce composed of professional workers. % Specialized workers Percentage of workforce composed of specialized workers.
Industry 52 industry categorical variables

Table 3. Descriptive Statistics: Household Surveys
Note: Wage values are not comparable across years due to changes in the cost of living and conversion to the “new peso” in 1994.
1984 1996 Union Nonunion Union Nonunion
Variable Mean (Std. Error)
Mean (Std. Error)
Mean (Std. Error)
Mean (Std. Error)
Ln Wage 5.38 (0.50)
4.95 (0.69)
2.37 (0.68)
1.89 (0.79)
Age 34.69 (11.21)
31.21 (11.86)
35.66 (10.52)
31.273 (11.05)
Age2 1329.2 (872.93)
1114.7 (920.97)
1382.2 (819.25)
1100.1 (839.44)
Male 0.63 (0.483)
0.734 (0.442)
0.574 (0.495)
0.695 (0.46)
Primaria1 0.148 (0.355)
0.208 (0.406)
0.069 (0.253)
0.117 (0.321)
Primaria2 0.261 (0.439)
0.263 (0.44)
0.164 (0.37)
0.194 (0.395)
Secundaria1 0.066 (0.248)
0.067 (0.251)
0.032 (0.177)
0.055 (0.227)
Secundaria2 0.216 (0.412)
0.21 (0.407)
0.25 (0.433)
0.295 (0.456)
Preparatoria1 0.036 (0.187)
0.035 (0.183)
0.052 (0.222)
0.056 (0.23)
Preparatoria2 0.116 (0.321)
0.051 (0.22)
0.160 (0.367)
0.102 (0.302)
Superior1 0.046 (0.209)
0.047 (0.212)
0.097 (0.296)
0.063 (0.243)
Superior2 0.097 (0.296)
0.062 (0.24)
0.153 (0.36)
0.081 (0.273)
Postgrado 0.001 (0.03)
0.005 (0.067)
0.016 (0.124)
0.007 (0.084)
Technical1 0.01 (0.1)
0.012 (0.11)
0.007 (0.083)
0.01 (0.101)
Technical2 0.069 (0.253)
0.055 (0.228)
0.037 (0.19)
0.024 (0.153)
Technical3 0.128 (0.334)
0.075 (0.264)
0.171 (0.376)
0.128 (0.334)
Technical4 0.004 (0.065)
0.003 (0.053)
0.026 (0.16)
0.013 (0.114)
South 0.175 (0.38)
0.186 (0.389)
0.088 (0.283)
0.071 (0.256)
Observations 934 2099 2041 7396

Table 4. Descriptive Statistics: Establishment Surveys
1992 1999
Note: Descriptive statistics for all dependent variables are from regression samples. Monetary values are not comparable across years due to changes in the cost of living and conversion to the “new peso” in 1994. The 1992 values are in 10,000 “old pesos.”
Union Nonunion Union Nonunion
Variable Mean (Std. Error)
Mean (Std. Error)
Mean (Std. Error)
Mean (Std. Error)
Benefits per worker 184.62 (28.97)
46.12 (6.04)
79.64 (16.12)
280.84 (19.20)
Benefits as share of total compensation
10.49 (0.67)
3.89 (0.50)
14.73 (0.60)
11.31 (0.44)
Average hours of training
18.92 (1.62)
2.00 (0.25) -- --
Total hours of training -- -- 1300.27 (111.61)
35.28 (2.72)
% Workers trained 33.09 (2.81)
5.38 (0.77)
45.87 (3.53)
7.23 (0.66)
Turnover 18.39 (2.00)
4.91 (1.22)
20.38 (2.57)
8.63 (2.90)
Labor productivity 49.90 (8.44)
11.94 (0.86)
142.40 (49.18)
45.97 (8.36)
Return on investment 1.78 (0.51)
2.27 (1.09)
7.66 (0.98)
6.81 (2.33)
Union 1.00 (0.00)
0.00 (0.00)
1.00 (0.00)
0.00 (0.00)
Wage per worker 1275.04 (59.49)
994.49 (73.38)
586.46 (120.65)
1844.40 (73.99)
% FDI 5.90 (0.57)
0.65 (0.17)
6.53 (0.60)
0.39 (0.06)
% Domestic sales 87.41 (1.61)
88.33 (1.91)
90.10 (0.84)
98.70 (0.21)
% Imported materials 12.84 (1.13)
5.18 (1.05)
9.88 (0.93)
0.97 (0.11)
Workforce size 109.14 (7.68)
7.34 (0.42)
109.94 (7.29)
6.62 (0.23)
Years in operation 16.01 (0.81)
12.33 (0.69)
15.62 (0.78)
9.95 (0.36)
% Male 72.33 (2.36)
73.31 (2.33)
68.0 (2.05)
74.49 (1.06)
% Job rotation 18.70 (1.93)
6.91 (1.27) -- --
New machinery 0.60 (0.04)
0.27 (0.03)
0.73 (0.03)
0.39 (0.01)
% Part time 0.39 (0.15)
0.94 (0.33)
0.73 (0.30)
0.68 (0.17)
Subsidiary 0.12 (0.01)
0.03 (0.01)
0.24 (0.03)
0.05 (0.01)
Employment growth 11.29 (3.29)
6.56 (1.87)
10.63 (1.52)
4.10 (0.72)
% Directive workers 6.41 (1.10)
29.98 (2.49)
7.01 (1.37)
25.97 (1.30)
% Professional workers
21.72 (1.17)
7.59 (0.96)
24.79 (2.67)
16.93 (1.12)
% Specialized workers 21.74 (1.49)
18.31 (2.09)
24.65 (2.29)
26.05 (1.40)
Observations 3514 1302 4394 3035

0%
5%
10%
15%
20%
25%
30%
35%
1984 1989 1992 1994 1996 1998 2000
% of labor force unionized
Note: Excludes agricultural workers, domestic servants, and vendors with no fixed establishment. Figure 1. Union Density
21%
15%
0%
5%
10%
15%
20%
25%
1984 1996
% difference in wages
Note: Control variables include: age, gender, education, technical training, occupation, region, and industry. Union effects are significant at the 0.01 level (two-tailed test). The estimates exclude workers in agriculture, domestic servants, and vendors with no fixed establishment. Figure 2. Union Wage Effects

-41%
-36%
-50%
-40%
-30%
-20%
-10%
0%
10%
1984 1996
% difference in variance of log
wage
Note: Control variables include: age, gender, education, technical training, occupation, region, and industry. Union effects are significant at the 0.01 level (two-tailed test). The estimates exclude workers in agriculture, domestic servants, and vendors with no fixed establishment. Figure 3. Union Effects on Wage Inequality

142%
26%
0%
20%
40%
60%
80%
100%
120%
140%
160%
1992 1999
% difference in benefits per
worker
Note: Mexican manufacturing sector. Control variables include: Wage per worker, % FDI, % domestic sales, % imported materials, workforce size, years in operation, % male employees, job rotation (1992 only), new machinery, part time, subsidiary, employment growth, occupation, and industry. Union coefficients are significant at the 0.01 level (two-tail test). Sample size is 4,428 (1992) and 5,721 (1999).
Figure 4. Union Effects on Fringe Benefits Per Worker

94%
35%
0%
10%
20%
30%
40%
50%
60%
70%
80%
90%
100%
1992 1999
% difference in benefits as share
of total compensation
Note: Mexico manufacturing sector. Control variables include: % FDI, % domestic sales, % imported materials, workforce size, years in operation, % male employees, job rotation (1992 only), new machinery, part time, subsidiary, employment growth, occupation, and industry. Union coefficients are significant at the 0.01 level (two-tailed test). Sample size is 4,428 (1992) and 5,722 (1999). Figure 5. Union Effects on Benefits Ratio

590%
529%
0%
100%
200%
300%
400%
500%
600%
700%
1992 1999
% difference in hours of training
Note: Mexican manufacturing sector. Control variables include: % FDI, % domestic sales, % imported materials, workforce size, years in operation, % male employees, turnover, job rotation (1992 only), new machinery, part time, subsidiary, employment growth, occupation, and industry. Union coefficient for 1992 is significant at 0.01 level (two-tailed test); 1999 coefficient is significant at 0.20 level (two-tailed test). Sample sizes are 4,516 (1992) and 5,733 (1999). The 1992 results are for average hours of training, whereas the 1999 results are for total hours of training. Figure 6. Union Effects on Hours of Training

304%
257%
0%
50%
100%
150%
200%
250%
300%
350%
1992 1999
% difference in share of
workforce trained
Note: Mexican manufacturing sector. Control variables include: % FDI, % domestic sales, % imported materials, workforce size, years in operation, share of male employees, turnover, job rotation (1992 only), new machinery, % part time, subsidiary, employment growth, occupation, and industry. Union coefficients are significant at the 0.01 level (two-tailed test). Sample sizes are 4,516 (1992) and 5,733 (1999). Figure 7. Union Effects on Share of Workforce Trained

190%
66%
0%
20%
40%
60%
80%
100%
120%
140%
160%
180%
200%
1992 1999
% difference in labor turnover
Note: Mexican manufacturing sector. Control variables include: % FDI, % domestic sales, % imported materials, workforce size, years in operation, % male employees, job rotation (1992 only), new machinery, % part time, subsidiary, employment growth, occupation, and industry. Union coefficient is significant at the 0.01 level (two-tailed test) in 1992; the 1999 coefficient is statistically insignificant. Sample sizes are 4,516 (1992) and 5,733 (1999). Turnover for 1992 is defined as the quit rate. Figure 8. Union Effects on Labor Turnover

30%
11%
0%
5%
10%
15%
20%
25%
30%
35%
1991 1998
% difference in labor productivity
Note: Mexican manufacturing sector. Control variables include: the log of the value of fixed capital and material inputs per labor hour, % FDI, % domestic sales, % imported materials, workforce size, years in operation, % male employees, job rotation (1992 only), new machinery, % part time, subsidiary, employment growth, occupation, and industry. Union coefficients are significant at the 0.01 level (two-tailed test). Sample sizes are 4,522 (1992) and 5,627 (1999). Figure 9. Union Effects on Labor Productivity

-19%
-140%-150%
-130%
-110%
-90%
-70%
-50%
-30%
-10%
10%
1992 1999
% difference in return on
investment
Note: Mexican manufacturing sector; establishments with greater than five workers. Control variables include: % FDI, % domestic sales, % imported materials, workforce size, years in operation, share of male employees, job rotation (1992 only), new machinery, % part time, subsidiary, employment growth, occupation, and industry. 1992 and 1999 coefficients are statistically insignificant. Sample sizes are 4,195 (1992) and 4,780 (1999). Figure 10. Union Effects on Profits