what do we do? yeast orf-gfp fusion library 4156 strains synthetic promoters library 200 strains...
TRANSCRIPT

What do we do?
x
y
z
g (1 … 4’156)
t (0 … 8h)
Yeast ORF-GFP fusion library 4156 strainsSynthetic promoters library 200 strains
Cycling through the chamber array to aquire brightfield and fluorescence images1.5s. / chamber 20 min / 1152 strains
5D dataTemporal resolution Dynamic changesSpatial resolution LocalizationGenomic resolution 70% of yeast genome
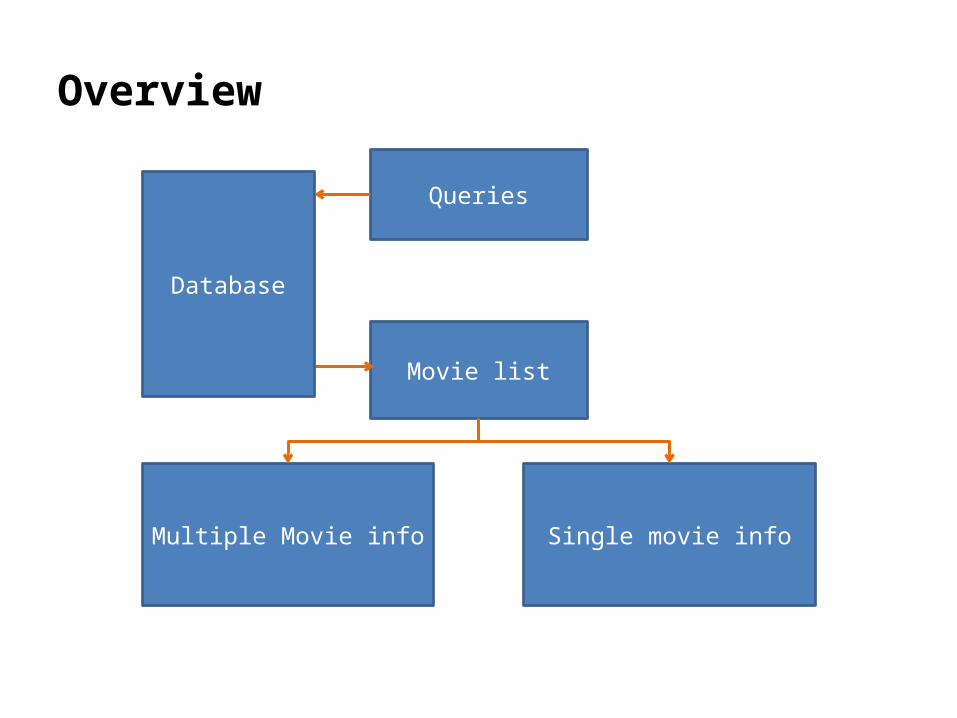
Overview
Movie list
Queries
Single movie infoMultiple Movie info
Database
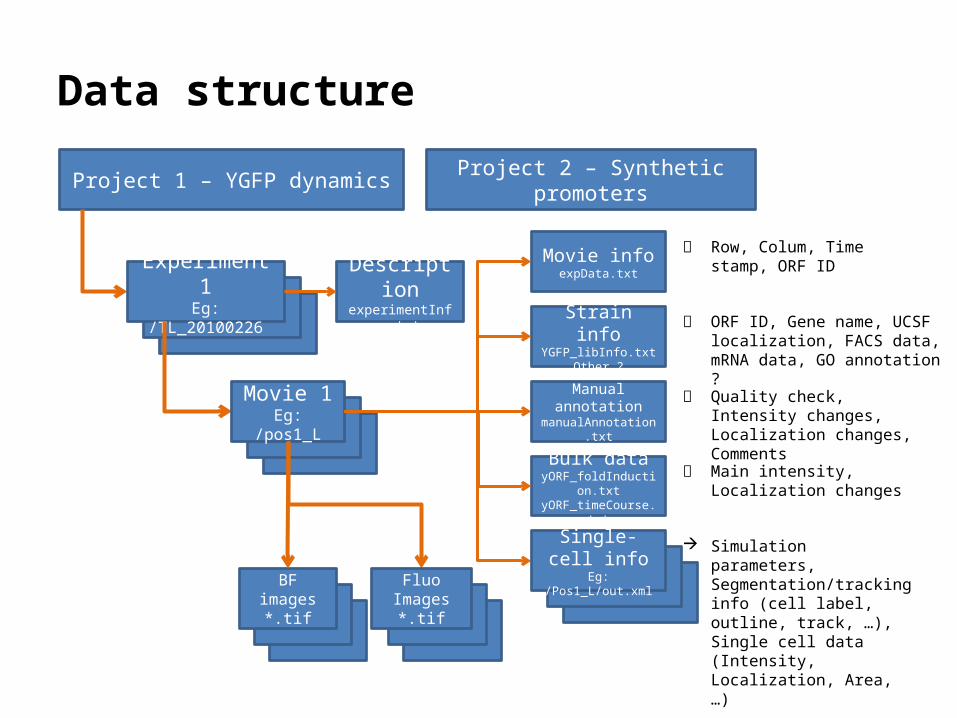
Data structure
Project 1 – YGFP dynamics Project 2 – Synthetic promoters
Experiment 1Eg: /TL_20100226
Movie 1Eg: /pos1_L
BF images*.tif
Bulk datayORF_foldInduction.txtyORF_timeCourse.txt
Manual annotationmanualAnnotation.txt
Fluo Images*.tif
Movie infoexpData.txt
Strain infoYGFP_libInfo.txt
Other ?
Row, Colum, Time stamp, ORF ID
ORF ID, Gene name, UCSF localization, FACS data, mRNA data, GO annotation ?
Quality check, Intensity changes, Localization changes, Comments
Main intensity, Localization changes
Simulation parameters, Segmentation/tracking info (cell label, outline, track, …), Single cell data (Intensity, Localization, Area, …)
DescriptionexperimentInfo.txt
Single-cell infoEg: /Pos1_L/out.xml

Queries
• Project• Experiment• Gene name, ORF ID
• Position within the chip (row, column)
• Intensity, Fold change (manual, bulk or single-cell data)• Localization, Localization Changes (manual, bulk or single-cell data)
• UCSF localization• Microarray data• FACS data• GO annotation
• Unique gene option?Which one to pick? Rating?
Output:- List of genes / ORF ID- Tick selection- Display options
- 1 choice movie, single cell data- n choices overlay graphs
- Export options

Display a single movie
Fluo movie BF movie
Choose analysis - Analysis 1- Analysis 2, …
Display options- Cell outline, label- Single-cell track- Select single cell and
highlight the trace in the graphs
Graph #1- Cells intensity over time
- Cells area over time- Localization over time
- correlation plots (feat.1 vs feat.2)
Distribution, single traces, …
Graph #2Same options as Graph #1
Movie facts- Gene Name- GO- …
Export Graphs png, epsExport source data for editing in Matlab / R

Tracker display – An example

Display multiple movies
Graph #1- Mean intensity over time
- Cells area over time- Localization over time
- correlation plots (feat.1 vs feat.2)
Dendogram (clustering), Traces overlay
Graph #2Same options as Graph #1
Table (Changeable column)
Check ORF ID gene name MA – quality check MA - comments GO process GO function
Options- Check/uncheck to modify the graphs below- Export new selection/table
Export Graphs png, epsExport source data for editing in Matlab / R
Database available to the public
Limited number of functionality
– Queries by gene names, … (no experiment structure)– Acces to the raw images and download– Acces to the data and export– Display tools