what does arts integration do for students? for academic achievement what does arts integration do...
TRANSCRIPT

ARTS FOR ACADEMIC ACHIEVEMENT
What Does Arts Integration Do for Students?
OCTOBER 2003
PREPARED FOR The Minneapolis Public Schools
BY Debra Ingram
Eric Riedel
Center for Applied Research and Educational Improvement College of Education and Human Development
University of Minnesota
Contents Tables and Figures ii Executive Summary iv Introduction 1 Overview of Arts for Academic Achievement / 1 Methods 2 Participants / 2 Measures / 2 Design and Analysis / 3 Achievement Analysis for the 1999-2000 School Year 6 Analysis on All Schools / 6 Methods / 6 Results / 7 Analysis on Case Study Schools / 12 Methods / 12 Results / 13 Discussion / 15 Achievement Analysis for the 2000-2001 School Year 17 Methods / 17 Results / 18 Discussion / 18 Achievement Analysis for the 2001-2001 School Year 19 Methods / 19 Results / 20 Discussion / 32 References 36 Appendix A 37 Appendix B 38 Appendix C 39 Appendix D 41

CENTER FOR APPLIED RESEARCH & EDUCATIONAL IMPROVEMENT ii
Tables and figures Tables 1. Coding Scheme for Dummy Variables 2. Summary of Regression Model Variables for Subgroup Analysis 3. Summary of Regression Analysis for Variables Predicting Fourth Grade Reading Achievement 4. Summary of Regression Analysis for Variables Predicting Mathematics Achievement 5. Summary of Regression Analysis for Variables Predicting Fourth Grade Reading Achievement for Girls in the Lunch Program 6. Summary of Regression Analysis for Variables Predicting Fourth Grade Reading Achievement for Boys in the Lunch Program 7. Summary of Regression Analysis for Variables Predicting Fourth Grade Mathematics Achievement for Girls in the Lunch Program 8. Summary of Regression Analysis for Variables Predicting Fifth Grade Mathematics Achievement for Boys in the Lunch Program 9. Grade Level of Students in Case Study Schools During 1999-2000 10. Reading Achievement and Arts Integration 11. Summary of Regression Analysis for Variables Predicting Third Grade Reading Achievement 12. Mathematics Achievement and Arts Integration 13. Summary of Regression Analysis for Variables Predicting Third Grade Mathematics Achievement 14. Summary of Regression Analysis for Variables Predicting Reading Achievement 15. Third Grade Reading and the Interaction of Arts Integration and English-Language Learner Programming 16. Fifth Grade Reading and the Interaction of Arts Integration and English-Language Learner Programming 17. Third Grade Reading and the Interaction of Arts Integration and Student Socioeconomic Status 18. Fifth Grade Reading and the Interaction of Arts Integration and Student Race/Ethnicity 19. Third Grade Reading and Interdisciplinary Teaming 20. Summary of Regression Analysis for Variables Predicting Mathematics Achievement in Third Grade 21. Summary of Regression Analysis for Variables Predicting Third Grade Reading Achievement for Students in the English-Language Learner Program

CENTER FOR APPLIED RESEARCH & EDUCATIONAL IMPROVEMENT iii
22. Summary of Regression Analysis for Variables Predicting Fifth Grade Reading Achievement for Boys in the Lunch Program 23. Summary of Regression Analysis for Variables Predicting Third Grade Mathematics Achievement for Boys in the Lunch Program 24. Summary of Regression Analysis for Variables Predicting Third Grade Reading Achievement for Girls in the Lunch Program 25. Overview of Significant Relationships between Arts Integration and Student Achievement Figures 1. Third Grade Reading Achievement and Arts Integration 2. Third Grade Mathematics Achievement and Arts Integration

CENTER FOR APPLIED RESEARCH & EDUCATIONAL IMPROVEMENT iv
Executive Summary This report summarizes findings on the relationship between arts-integrated instruction and student achievement in the Arts for Academic Achievement (AAA) program. It is part of a series of reports based on a longitudinal study of AAA by a team of researchers at the Center for Applied Research and Educational Improvement (CAREI). The purpose of the four-year Arts for Academic Achievement: The Annenberg Challenge in Minneapolis project (AAA) was to transform teaching and learning through partnerships between schools, artists, and arts organizations. The theory of action underlying the initiative was that when teachers and artists collaboratively develop instruction that integrates arts and non-arts disciplines, instruction in non-arts disciplines becomes more effective and student achievement increases. Our analyses indicate a significant relationship between arts integrated instruction and improved student learning in reading and mathematics in the Arts for Academic Achievement program. The relationship didn’t occur for every student, in every class, or in every year of the project. Nonetheless, our study offers evidence that AAA was associated with real changes that benefited student learning.
Arts for Academic Achievement assisted all types of students, not just those who were already doing well in school. In some cases, the relationship between arts integration and student achievement was more powerful for disadvantaged learners, the group of students that teachers must reach to close the achievement gap. We used a gain score, the difference in a student’s test score from one year to the next, as the indicator of student learning in our study. By looking at the amount of change in a student’s test score from one year to the next, rather than a test score from one point in time, we minimize the potential for bias due to pre-existing achievement differences between students who received arts integration and those who did not. For each test, the district sets a “gain score range” that it considers a year’s growth in that discipline1. The following examples illustrate the evidence in our study of a significant relationship between arts integration and student learning.
Third-grade reading. Gain scores on the reading test were higher for third grade students whose teacher integrated the arts into English/reading lessons. For each unit increase2 in teachers’ use of arts integration, students’ gain scores increased by 1.02 points. The relationship between arts integration and reading
1 The district considers a gain in the range of 10.0-15.1 to be a year’s growth in reading for third graders, a gain in the range of 6.3-9.5 to be a year’s growth in reading for fourth graders, a gain in the range of 10.0-15.0 to be a year’s growth in mathematics for third graders, and a gain in the range of 6.3-9.5 to be a year’s growth in mathematics for fifth graders. . 2 A unit refers to the four levels of arts integration listed on the teacher survey. Teachers could chose from responses of not at all, very little, some, and a lot to indicate how much they integrated the arts. A unit increase means a change from one level to the next, from very little to some, for example.

CENTER FOR APPLIED RESEARCH & EDUCATIONAL IMPROVEMENT v
achievement was stronger for students in the free- and reduced-price lunch program and students in the English-language learner program. Each of these statistically significant relationships is based on a model that also considered the effect of student characteristics, such as race/ethnicity and special education programming, on gain scores. Third-grade mathematics. For third-graders, the relationship of arts integration and math achievement was also statistically significant. Gain scores increased by 1.08 points for every unit increase in the extent their teacher integrated the arts into mathematics lessons. Again, these findings (as is true for all achievement results in this report) are drawn from a model that takes into account student characteristics that may also influence achievement. Fourth-grade reading. Gain scores on the reading test were higher for fourth grade students whose English/reading teacher integrated the arts. For each unit increase in a teacher’s use of arts integration, students’ gain scores increased by 1.32 points. Fifth-grade mathematics. Gain scores on the mathematics test were higher for fifth-grade students whose teacher integrated the arts into mathematics lessons. For each unit increase in a teacher’s use of arts integration, students’ gain scores increased by .71 points.
In instances where we did not find a significant relationship between arts integration and student achievement, none of our findings indicate that AAA disadvantaged students by lowering their achievement. At minimum, students whose teachers integrated the arts benefited from an increase in arts learning opportunities and achieved on par with their peers who were not in AAA.
The findings also have implications for how the link between AAA and student achievement might be made stronger as the program continues to develop. First, the amount of arts integration makes a difference in how much student test scores increase. Teachers in this study reported integrating the arts at varying levels and the results indicate that the greatest benefit occurs when teachers integrate a lot. For example, students whose teacher integrated the arts a lot into English/reading lessons had significantly higher gain scores on the reading test than students whose teachers integrated the arts to a lesser degree. Although some caution is needed in interpreting these results because the survey did not provide definitions for the levels of integration beyond the value labels of not at all, very little, some, or a lot; the study provides some initial evidence that the intensity of arts integration makes a difference for student learning. Another implication suggested by the data is that it’s better to do more integration in one discipline than lesser amounts of integration in multiple disciplines. Although teachers typically reported using arts integration in more than one non-arts discipline, their overall level of arts integration was not related to achievement in reading or mathematics. Instead, it was the level of integration in a specific discipline that was

CENTER FOR APPLIED RESEARCH & EDUCATIONAL IMPROVEMENT vi
related to achievement. This suggests that teachers and students can get the most benefit from a program like AAA when the integration is focused on one, or maybe two, disciplines, rather than attempting to do small amounts of integration across a wider swath of the curriculum. The achievement study illustrates the difficulty in measuring the level of program implementation for a complex, highly variable initiative such as AAA, and, subsequently assessing the program’s effect on student achievement. During our longitudinal study of AAA, we discovered considerable variation both in how teachers and artists work together to integrate the arts (Freeman, Seashore & Werner, 2003), and in the relative emphasis on arts and non-arts instruction in an integrated lesson. Further research is needed to specify the dimensions of AAA that are most closely related to improvements in teaching and learning. The construct of integrating the arts through arts partnerships seems to have at least two critical axes: how the teacher and arts partner work together, and the nature of the instruction itself. Other important variations may be the art form and the non-art discipline that are being integrated, and whether the art partner is an arts specialist teacher, an external artist, or an artist on the school staff. As in any study of the effects of an attempt to change teaching and learning in a school setting rather than the controlled environment of a lab, it is difficult to isolate the cause of any observed changes. At the same time Minneapolis was involved in AAA they had several other district initiatives also aiming to strengthen teacher instructional practice and improve student achievement in reading, math, science, writing, as well as various improvement programs initiated at the individual school level. Any and all of these interventions could have played a role in the achievement gains reported here. Due to the voluntary nature of teacher participation in AAA, another factor confounding these results may be that teachers who chose to be involved in AAA were already more effective instructors than their peers who chose not to become involved. Data from other portions of our study suggest, however, that even if this were the case, these “good” teachers developed new skills and modified their beliefs about student capacity in ways that help them reach more students. This study examined the impact of arts integrated instruction on student achievement in one school district. Because variation rather than uniformity is the norm among arts in education programs, these findings may not be as applicable to situations where the content of the program (e.g., the intensity and content of professional development provided, the program’s expectations of school teams, the relative focus on achievement in arts or non-arts), or the nature of instruction differs significantly from that of AAA.

CENTER FOR APPLIED RESEARCH AND EDUCATIONAL IMPROVEMENT 1
Introduction
This report summarizes findings on the relationship between arts-integrated instruction and student achievement in the Arts for Academic Achievement (AAA) program. It is part of a series of reports based on a longitudinal study of AAA by a team of researchers at the Center for Applied Research and Educational Improvement (CAREI). Previous reports examine the impact of AAA on variables such as teacher beliefs and attitudes, teacher practice, and professional community. The achievement study covers the last three years of the program’s four years of implementation. Results for each year are reported separately, and then the report concludes with a discussion of the overall findings. Overview of Arts for Academic Achievement The purpose of the four-year Arts for Academic Achievement: The Annenberg Challenge in Minneapolis project (AAA) was to transform teaching and learning through partnerships between schools, artists, and arts organizations. The theory of action underlying the initiative was that when teachers and artists collaboratively develop instruction that integrates arts and non-arts disciplines, instruction in non-arts disciplines becomes more effective and student achievement increases. AAA was primarily a bottom-up change effort; a team of interested teachers within a school initiates a project by designing a program of arts integration and arts partnerships that reflects the unique context of its school community. Teams were required to link their program goals to school and district improvement plans, which provided a top-down framework for the project. The project did not specify a curriculum framework or model for teacher-artist collaboration, nor did it stipulate which arts and non-arts disciplines should be included in the plan. Unlike many "arts integration" initiatives that focus on partnerships as a way to restore discipline-based arts instruction to the curriculum, the purpose of AAA was to strengthen instruction and improve student learning in non-arts areas such as reading and science. In this project, arts integration was not intended to replace the comprehensive, sequential arts instruction already provided by certified arts educators in the district. Instead, the project was based on the belief that students benefit from curriculum that includes both disciplinary-based instruction in the arts and non-arts instruction that is enhanced by integrating the arts. Furthermore, the project was focused on stretching the boundaries of how students learn rather than stretching the boundaries of what students are expected to learn. This made the project different from many arts-integration project that seek to develop student skills in areas such as aesthetics, or critical thinking, which may or may not be specified goals in the current school curriculum. Arts for Academic Achievement funded teams at 31 schools during the first year of implementation and expanded to include 45 schools in the third and fourth years of the

CENTER FOR APPLIED RESEARCH AND EDUCATIONAL IMPROVEMENT 2
program. The majority of the teams were in elementary schools, but four middle schools and six high schools were also involved. Given the complexity of implementing AAA in a school, our analysis of the impact on student achievement begins with the program’s second year, the 1999-2000 school year, which was the second year of implementation for the majority of schools. After an overview of the study methods, the findings are organized into three major sections, one for each program year included in the achievement study.
Methods Participants The study participants were teachers and students in schools funded by AAA for one to four years of program implementation. Schools elected to participate in the program by submitting an application describing the need for the program in their school and the proposed program design. Proposals were reviewed by a panel composed of the program director and representatives from district administration and arts organizations. Schools were required to submit proposals annually even if they had been funded in the previous year. Participation by individual teachers within a school was voluntary. Because the number of participants varies each year, details on participant characteristics are included as part of the major section for each year of the study. Although AAA included teachers and students in grades K-12, the achievement study is focused on student learning in reading and mathematics for grades 3-5 for several reasons:
1) We did not want to increase the testing burden on students and teachers, so we decided to use achievement data already being collected by the district. The district’s standardized testing program is focused on reading and mathematics. 2) We defined our dependent variable as change in student achievement from the prior year to the year a student participated in AAA, so we were limited to grade levels in which tests were administered annually (grades 2-5). This focused our analysis on students in grades 3-5 because students’ test scores from the spring of second grade were used to compute gain in achievement during the third grade year.
Details on participants in each year of the study are included in the report section for each year. Measures Arts Integration We used teacher responses to items on a written survey to determine the amount of arts-integrated instruction each student received in reading and mathematics. The

CENTER FOR APPLIED RESEARCH AND EDUCATIONAL IMPROVEMENT 3
survey was administered to all teachers in the AAA schools in April/May of 2002, even those who had not been actively involved in the program. Because teachers had access to arts partnerships through sources other than AAA, and because they could theoretically integrate the arts by themselves without additional funding, we needed to provide every teacher with the opportunity to report on their use of arts-integration during the year. Teachers were asked to indicate how much they integrated the arts into their reading lessons and their math lessons. The response choices were as follows: not at all, very little, some, a lot. Teachers could also opt out of the item by checking the response “do not teach” if they didn’t happen to teach at all in that discipline. To assist teachers in completing the survey the survey included definitions for arts education and arts integration because we wanted teachers to distinguish between these forms of instruction when completing the survey. The definitions used were as follows: Arts education is instruction and experiences in which the arts are treated as a separate discipline. Others may call this education in the arts. Arts integration is instruction in which arts-related concepts and activities are infused with other academic areas. Others may call this arts infusion or education through the arts. Teachers were asked to write their names on the survey so that we could later match their survey to test data from their students. To increase teacher comfort in identifying themselves on the survey, we emphasized that our intent was not to compare test scores among individual teachers or students, and that in any report on the survey data itself we would not identify individual teachers. To give teachers further reassurance that their responses would remain confidential a member of our research team administered the survey at a teacher meeting at each school and collected the completed surveys before leaving. Student Demographics and Achievement Data on the following student characteristics were provided for this study by the school district: gender, race/ethnicity, participation in English-language learner, special education, and the free- and reduced-price lunch program. Participation in the lunch program is used as an indicator of the socioeconomic status in a student’s family. The district also provided results from the Northwest Achievement Levels Tests in reading and mathematics. The test items used in Minneapolis are selected from an extensive item bank to match the district curricula in reading and mathematics at each grade level. Design and Analysis Many evaluation studies use the allotment of grant funding as the indicator of program implementation, and then, to determine the effect of the program, they contrast school-level change in the dependent variable between schools that received funding and those that did not. Although the intent of AAA was that over time schools would implement arts-integrated instruction school-wide, preliminary data analysis indicated that it would be inappropriate to use school-level achievement data for our dependent variable,

CENTER FOR APPLIED RESEARCH AND EDUCATIONAL IMPROVEMENT 4
because at this point only some classrooms in the funded schools were integrating the arts. School-level test results would represent a mix of scores from students who received arts-integrated instruction and those who did not, making it difficult to make an accurate determination of the program’s effects. We adjusted our design to compare achievement among students who received different levels of arts-integrated instruction as indicated by their teacher’s self-report on a written survey. Because some teachers may have integrated the arts of their own initiative, or through funding from programs other than AAA, we asked every teacher in schools funded by AAA to complete a written survey each spring. We used three sets of multiple regression models to estimate the effect of arts integration on student learning. First, we examined the effect of arts integration on student learning while controlling for student characteristics known to influence achievement such as: gender, race/ethnicity, socioeconomic status, and participation in special education or English-language learner (ELL) programming. The dummy-coded variables used as indicators for these student characteristics are shown in Table 1. Table 1. Coding Scheme for Dummy Variables Student Characteristic Dummy Code=0 Dummy Code=1 Gender male students female students Race/ethnicity non-white students white students Socioeconomic status students not participating
in free- and reduced-price lunch program
students participating in free- and reduced-price lunch program
Special education students not participating in special education programming
students participating in special education programming
English-language learner students not enrolled in English-language learner programming
students enrolled in English-language learner programming
In the second set of models we examined the relationship of arts integration and student learning within certain subgroups of students. Earlier findings based on qualitative data had indicated that teachers believed arts integration was especially effective for students who they often struggle to reach. In the second set of models we examined the relationship of arts integration and student achievement for the following subgroups of students: those enrolled in ELL programming, boys in the free- or reduced-price lunch program, and girls in the free- or reduced-price lunch program. The variables used in each of these models are shown in Table 2. Because these models contain different terms than the first set of models, and because they are based on a subgroup of students rather than the whole group of students in the study, we cannot make direct comparisons between the results of models in the first and second sets.

CENTER FOR APPLIED RESEARCH AND EDUCATIONAL IMPROVEMENT 5
Table 2. Summary of Regression Model Variables for Subgroup Analysis Subgroup Model
Gender White/Non-white Race
Special Education
ELL Lunch Program
Arts Integration
ELL students
x x x x x
Boys in lunch program
x x x x
Girls in lunch program
x x x x
“x” indicates the variable was included in the model Finally, we used a third set of models to examine the interaction of arts integration and certain student characteristics more directly. We added an interaction term to each of the models in the first set to test the impact of the following interactions:
• arts integration and participation in the ELL program • arts integration and participation in the lunch program • arts integration and students’ race/ethnicity categorization of either white or
non-white

CENTER FOR APPLIED RESEARCH AND EDUCATIONAL IMPROVEMENT 6
Achievement Analysis for 1999-2000 School Year
The section is based on data gathered during the 1999-2000 school year when 27 elementary schools (either K-5 or K-8 grade level configurations) in Minneapolis participated in the Arts for Academic Achievement project (AAA). Six of the schools had joined the program in fall 1999, but the majority had been involved since the program began in spring 1998. There are two parts to the analysis for 1999-2000. The first is based on data from all elementary schools involved in the program; and the second is based on ten schools, referred to as the case study schools, from which we had collected multiple sources of information for use in determining which teachers integrated the arts.
I. Analysis on All Schools In an earlier report on the results of the 1999-2000 teacher survey, we noted that the proportion of teachers reporting that they integrated the arts varied considerably among the 27 elementary schools (Ingram, Anderson, Seashore & Freeman, 2001). Our findings show that the proportion ranged from 49% of teachers in building to 92%. Teachers most often integrated the arts into English/reading lessons; almost half (47%) of the elementary teachers indicated they integrated the arts a lot in this discipline. In contrast, math was the discipline least likely to be integrated with the arts. Only 10% of the elementary teachers reported they integrated the arts into mathematics lessons a lot. Of the teachers that integrated the arts, over two-thirds (73%) said they worked with an arts partner to integrate the arts.
Methods
Participants Data on student demographic characteristics and test results was provided by the Minneapolis Public Schools for 5007 students in grades 3, 4, and 5 during the 1999-2000 school year. To examine the potential for bias in the sample of students for whom the full data set was available, we compared student characteristics between the group of students included in the achievement analysis, and those excluded from the analysis because of missing data. Because schools had a choice between using the NALT reading test and an oral reading assessment for second graders, far more students had incomplete data sets in reading than in math. Therefore, we defined the comparison groups for the missing data analysis as follows: those students who had reading test score data from both 1999 and 2000, and could be matched with their teachers report on the survey of the level of arts integration versus those that had one or more of those pieces of data missing. Statistical tests indicate that there are a significantly lower proportion of the following characteristics in the group with complete data: free- and reduced-price lunch, ELL, and

CENTER FOR APPLIED RESEARCH AND EDUCATIONAL IMPROVEMENT 7
non-white race/ethnicity (see Appendix A for details). These characteristics are often associated with student mobility, which may in part explain their under representation in the group of students with complete data sets. Because of these differences, caution is recommended in generalizing these findings beyond the study sample. Design and Analysis The design and analysis used with data from all the schools is consistent with the earlier description. In addition, Appendix D contains some initial results from analysis using the hierarchical linear modeling technique.
Results Reading Achievement For students in fourth grade, arts integration was significantly related to their reading achievement. The relationship between integration and achievement was not significant for either third or fifth grade students3. In fourth grade, multiple regression analysis4 indicates that for every unit of change in the amount a teacher integrates the arts into English/reading lessons (e.g. from very little to some) the change in their students’ scores will increase by 1.32 points (Table 3). When teachers integrate the arts a lot, arts integration is related to 3.96 gain score points on the reading test. This is true even when other factors that influence student learning, such as socioeconomic status and gender are included in the statistical model. This finding is important in analyzing data from a study design such as this one where we are studying intact groups of students, rather than students who are randomly assigned to study groups, who may differ in characteristics that influence achievement. Table 3. Summary of Regression Analysis for Variables Predicting Fourth Grade Reading Achievement (N=966) β SE Beta Constant 6.20*** .73 Gender -1.2*** .33 -.07 ELL 1.3** .45 .06 White/non-white -.51 .43 -.03 Free lunch .28 .42 .02 Special education -.90 .48. -.04 Arts integrated into English/reading lessons
1.32*** .27 .10
R2 .019*** Note: β is the unstandardized coefficient; beta is the standardized coefficient. *p<.05, **p<.01, ***p<.001
3 Given the large number of students who did not take the reading test in second grade, the third grade model may not adequately represent all third grade students involved in the program. 4 For the regression analyses in this paper, cases were weighted based on the frequency of the arts integration variable because the size of the groups differed notably.

CENTER FOR APPLIED RESEARCH AND EDUCATIONAL IMPROVEMENT 8
We also tested models for fourth graders that included interaction terms for arts integration and either student’s race/ethnicity, participation in the ELL program, or free- and reduced-price lunch program. None of these models were significant, indicating that the relationship between arts integration and reading achievement is consistent across these student subgroups. Mathematics Achievement Multiple regression analysis indicates a statistically significant relationship between the extent of integration and student gain scores in mathematics for students in grades three, four, and five (Table 4). In a model that includes other student characteristics that influence learning (gender, special education, ELL, race/ethnicity, free lunch), for every increase of one level in the extent of integration, the gain score for third grade students increases by 1.15 scale score points. For a teacher that integrates the arts a lot, arts integration is related to a 3.45 scale score point increase on the math test. The district considers scale scores of 10.0-15.0 to be in the one-year gain range for third grade mathematics. In fourth and fifth grade, every unit increase in teachers’ use of arts integration increases students gain score by .52 and .71 scale score points, respectively. The district’s one-year gain range for the fourth grade is 7.8-11.8, and for fifth grade is 6.3-9.5. Table 4. Summary of Regression Analysis for Variables Predicting Mathematics Achievement Third Grade Fourth Grade Fifth Grade β SE Beta β SE Beta β SE Beta Constant 9.59*** .60 7.78*** .54 8.55*** .54 Gender .41 .38 .02 .09 .33 .01 -.07 .35 -.01 ELL 1.23* .54 .05 .78 .45 .04 .85 .49 .04 White/non-white
-.48 .47 -.03 -1.17** .42 -.07 -.10 .46 -.01
Free lunch .28 .46 .02 -.63 .42 -.04 -1.6*** .46 -.10 Special education
1.38* .56 .05 .21 .48 .01 -.93 .52 -.04
Arts integrated into mathematics lessons
1.15*** .26 .10 .52* .25 .05 .71** .23 .07
N 1000 876 1013 R2 .014*** .010*** .016*** Note: β is the unstandardized coefficient; beta is the standardized coefficient. *p<.05, **p<.01, ***p<.001

CENTER FOR APPLIED RESEARCH AND EDUCATIONAL IMPROVEMENT 9
None of the interaction models contributed significantly to understanding the relationship between arts integration and math achievement. Arts integration has the same relationship to achievement regardless of whether or not the student is in the ELL program, the lunch program, or is of white or non-white race/ethnicity. Student Subgroup Models In this section we report the results of models that examine the relationship of arts integration and student characteristics on achievement within the following student subgroups:
• students in the ELL program • girls in the lunch program • boys in the lunch program
These models were tested only when arts integration was significantly related to achievement for the overall group of students. Although these models cannot be directly compared to the first two sets of models that are based on the entire student sample, these models clearly describe the relationship between arts integration and student learning in student subgroups that are often the target of improvement efforts. Fourth Grade Reading For fourth grade girls in the lunch program, arts integration is significantly related to reading achievement (Table 5). For teachers who integrate the arts a lot into English/reading lessons, arts integration is related to 3.39 gain score points. Table 5. Summary of Regression Analysis for Variables Predicting Fourth Grade Reading Achievement for Girls in the Lunch Program (N=259) β SE Beta Constant 5.81*** 1.49 ELL .65 .66 .04 White/non-white -.36 .89 -.02 Special education -1.74* .88 -.07 Arts integrated into English/reading lessons
1.13* .46 .09
R2 =.014* Note: β is the unstandardized coefficient; beta is the standardized coefficient. *p<.05, **p<.01, ***p<.001 For fourth grade boys in the lunch program, each level increase in their teacher’s use of arts integration is related to 1.42 gain score points (Table 6). For teachers who integrate the arts a lot, arts integration is related to 4.26 gain score points for boys in the lunch program.

CENTER FOR APPLIED RESEARCH AND EDUCATIONAL IMPROVEMENT 10
Table 6. Summary of Regression Analysis for Variables Predicting Fourth Grade Reading Achievement for Boys in the Lunch Program (N=285) β SE Beta Constant 6.147*** 1.61 ELL 1.77* .74 .08 White/non-white -.29 .92 -.01 Special education -1.72* .79 -.07 Arts integrated into English/reading lessons
1.42** .54 .09
R2=.021*** Note: β is the unstandardized coefficient; beta is the standardized coefficient. *p<.05, **p<.01, ***p<.001 Arts integration is not significantly related to achievement for students in the ELL program. These students show growth on the reading test but arts integration does not contribute to these gains after the effects of race/ethnicity, socioeconomic status and participation in the special education program are taken into consideration in the model. Because arts integration was a significant contributor to the reading gain scores for both boys and girls in the lunch program, we can conclude that arts integration was effective not only for the whole group of students but also those students that teachers struggle to reach. We cannot make direct comparisons of the regression coefficients among these models or with the model that includes all fourth grade students. Nonetheless, these results provide evidence that arts integration is effective for subgroups, not just the whole student body which includes strong and struggling learners. Third Grade Mathematics Arts integration was not significantly related to math achievement for any of the student subgroups in third grade. Fourth Grade Mathematics For fourth grade girls in the lunch program, arts integration is significantly related to math achievement (Table 7). For teachers who integrate the arts a lot into English/reading lessons, arts integration is related to 3.63 gain score points.

CENTER FOR APPLIED RESEARCH AND EDUCATIONAL IMPROVEMENT 11
Table 7. Summary of Regression Analysis for Variables Predicting Fourth Grade Mathematics Achievement for Girls in the Lunch Program (N=259) β SE Beta Constant 7.89*** 1.19 ELL .62 .67 .04 White/non-white -2.74** .88 -.12 Special education -2.54** .89 -.11 Arts integrated into English/reading lessons
1.21** .44 .11
R2 =.036*** Note: β is the unstandardized coefficient; beta is the standardized coefficient. *p<.05, **p<.01, ***p<.001 Arts integration was not significantly related to achievement for boys in the lunch program or students in the ELL program. Fifth Grade Mathematics For fifth grade boys in the lunch program, arts integration was significantly related to math achievement (Table 8). For teachers who integrate the arts a lot into mathematics lessons, arts integration is related to 4.98 gain score points. Table 8. Summary of Regression Analysis for Variables Predicting Fifth Grade Mathematics Achievement for Boys in the Lunch Program (N=285) β SE Beta Constant 5.33*** 1.48 ELL 1.66 .85 .08 White/non-white -.58 1.17 -.02 Special education .55 .88 .03 Arts integrated into English/reading lessons
1.66* .85 .08
R2 =.016* Note: β is the unstandardized coefficient; beta is the standardized coefficient. *p<.05, **p<.01, ***p<.001 Arts integration was not significantly related to achievement for girls in the lunch program or students in the ELL program.

CENTER FOR APPLIED RESEARCH AND EDUCATIONAL IMPROVEMENT 12
II. Analysis on Case Study Schools
In this section of the paper we summarize analyses based on data collected in 10 of the 27 elementary schools participating in AAA during the 1999-2000 school year. The intent of this sub-study was to explore the relationship between arts integration and student achievement in a subset of schools where we had access to multiple indicators of arts integration.
Methods Participants The 10 schools included in this analysis were selected based on the following criteria:
• the geographic location of the schools should be varied • the schools should have varying levels of previous experience with arts
partnership and artist residency programs • the schools should be varied in terms of past performance on standardized
achievement tests, and in percent of students who are non-white, in ELL or special education programming, and receiving lunch subsidies
• a variety of art forms should be used for arts integration among (but not necessarily within) the selected schools
• the schools should have been involved in AAA since spring 1998 • the schools should have had only one site coordinator since spring 1998
The purpose of this analysis was to provide an initial look at how arts integration might affect student achievement in schools that are farthest along in implementation. We intentionally chose schools that had been involved since the program’s start-up, and had the same site coordinator since the beginning because we wanted to study implementation that was relatively stable. Given this emphasis, the findings reported here may be based on schools that were more advanced in their implementation of AAA than the case for the 27 schools overall. Information on student demographics and test scores was available for 1900 third through fifth grade students in these 10 schools. The number of students in each grade level is shown in Table 9. Table 9. Grade Level of Students in Case Study Schools During 1999-2000 Grade Level Number of Students Third 637 Fourth 658 Fifth 605
CENTER FOR APPLIED RESEARCH AND EDUCATIONAL IMPROVEMENT 13
Measures In this sub-study, we classified each classroom teacher as either an integrator or a non-integrator based on the following sources of information:
• individual teacher’s self-report of use of arts integrated instruction on the written survey
• site coordinator’s report5 on the number of hours each teacher worked directly with an artist in their classroom
• teachers’ self-reports on program implementation during a group interview6 with each team during March 2000
Information from each source was compiled and reviewed by our study team. Based on the range of implementation reported, we concluded that teachers would be included in the integrator group if the following criteria were met:
• their survey indicated they had integrated the arts at least “very little” in one non-arts discipline
• the site coordinator had reported that the teacher worked with an arts partner directly in their classroom for a minimum of five hours during the year
• the group interview transcript contained a description of this teacher’s use of arts integrated instruction and work with an arts partner
Although the minimum of five hours work with an artist may seem low for a program of this type, this amount was at the high end of the number of hours reported across the schools. The actual amount of time that a teacher and artist spent working together might be higher because the site coordinators were likely to draw on financial records of how many hours they paid an artist in compiling their reports, rather than a formal tracking system of the number of contact hours.
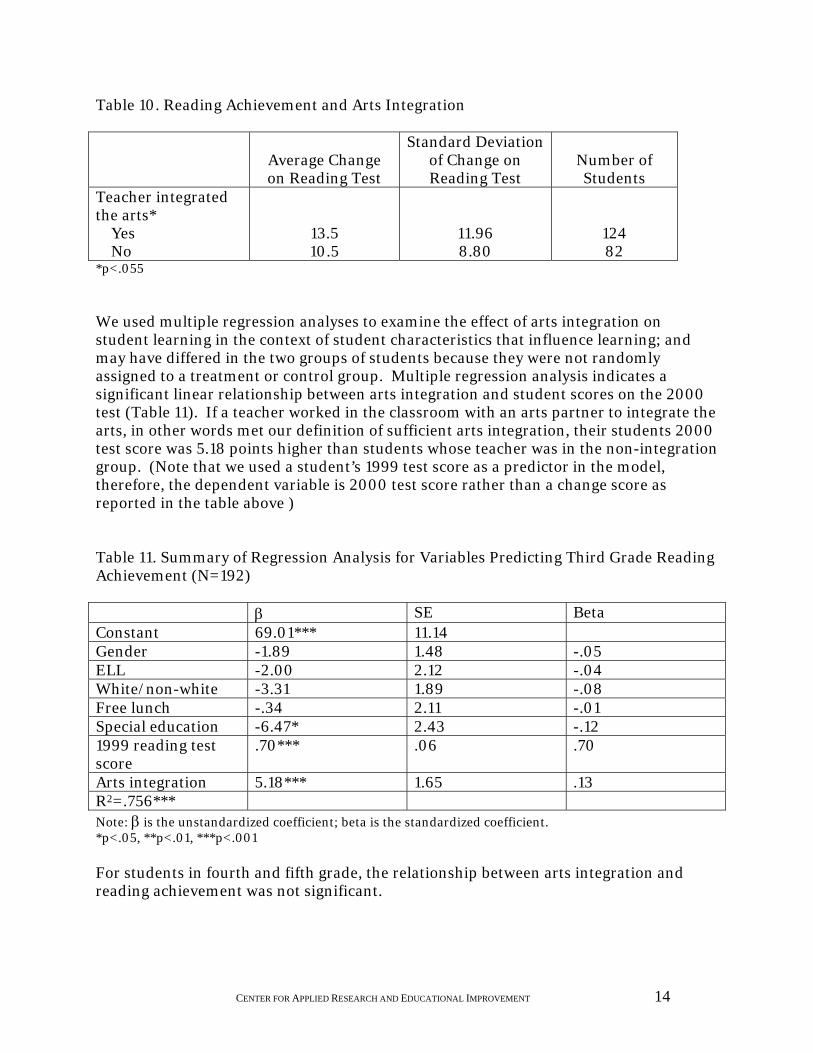
Results Reading Achievement Table 10 compares the average change in test scores from 1999-2000 for third grade students whose teachers integrated the arts and those whose teachers did not integrate the arts. The average for students whose teachers integrated the arts is notably higher than students who didn’t experience arts integrated instruction. Statistical tests indicate the difference is significant at the p<.055 level7.
5 This information had been collected by the program director as part of a larger effort to document initial levels of implementation. 6 For more information on the interview format and findings, see Werner and Ingram, 1999. 7 Typically a p-value of p<.05 is used as the cut-off for determining whether or not the probability that an observed difference is due to chance is too high. However, because this is an initial exploration of the program impact, we decided to report a difference with a slightly higher p-value.
CENTER FOR APPLIED RESEARCH AND EDUCATIONAL IMPROVEMENT 14
Table 10. Reading Achievement and Arts Integration
Average Change on Reading Test
Standard Deviation of Change on Reading Test
Number of Students
Teacher integrated the arts* Yes No
13.5 10.5
11.96 8.80
124 82
*p<.055 We used multiple regression analyses to examine the effect of arts integration on student learning in the context of student characteristics that influence learning; and may have differed in the two groups of students because they were not randomly assigned to a treatment or control group. Multiple regression analysis indicates a significant linear relationship between arts integration and student scores on the 2000 test (Table 11). If a teacher worked in the classroom with an arts partner to integrate the arts, in other words met our definition of sufficient arts integration, their students 2000 test score was 5.18 points higher than students whose teacher was in the non-integration group. (Note that we used a student’s 1999 test score as a predictor in the model, therefore, the dependent variable is 2000 test score rather than a change score as reported in the table above ) Table 11. Summary of Regression Analysis for Variables Predicting Third Grade Reading Achievement (N=192) β SE Beta Constant 69.01*** 11.14 Gender -1.89 1.48 -.05 ELL -2.00 2.12 -.04 White/non-white -3.31 1.89 -.08 Free lunch -.34 2.11 -.01 Special education -6.47* 2.43 -.12 1999 reading test score
.70*** .06 .70
Arts integration 5.18*** 1.65 .13 R2=.756*** Note: β is the unstandardized coefficient; beta is the standardized coefficient. *p<.05, **p<.01, ***p<.001 For students in fourth and fifth grade, the relationship between arts integration and reading achievement was not significant.

CENTER FOR APPLIED RESEARCH AND EDUCATIONAL IMPROVEMENT 15
Math Achievement Table 12 shows the average change in students’ math test scores from 1999-2000. Students whose teacher integrated the arts, based on our classification scheme, had a significantly higher gain. Table 12. Mathematics Achievement and Arts Integration
Average Change on Mathematics
Test
Standard Deviation of Change on
Mathematics Test
Number of Students
Teacher integrated the arts* Yes No
12.2 10.5
8.00 8.53
265 287
*p<.05 In multiple regression analysis, which included students’ 1999 test score as a predictor in the model, arts integration just missed significance at p<.057 (Table 13). Table 13. Summary of Regression Analysis for Variables Predicting Third Grade Mathematics Achievement (N=552) β SE Beta Constant 60.96*** 5.43 Gender -.72 .68 -.02 ELL -2.18* 1.05 -.05 White/non-white -3.06*** .85 -.09 Free lunch -2.41** .87 -.07 Special education -2.37* 1.11 -.05 1999 math test score
.76*** .03 .77
Arts integration 1.33 .70 .04 R2=.781*** Note: β is the unstandardized coefficient; beta is the standardized coefficient. *p<.05, **p<.01, ***p<.001 For students in grades 4 and 5, arts integration was not significantly related to math achievement.
Discussion Our analyses based on data from all the elementary schools involved in AAA indicate that arts integration is significantly related to student reading achievement in grade 4

CENTER FOR APPLIED RESEARCH AND EDUCATIONAL IMPROVEMENT 16
and math achievement in grades 3, 4, and 5. Students whose teachers integrated the arts into English/reading lessons or math lessons had higher gain scores in those disciplines. A sub-study based on data from 10 schools shows that students of third grade teachers who work with an arts partner in their classroom to integrate the arts have significantly higher gain scores in reading than students whose teachers do not work with a partner to integrate the arts. Comparisons between the findings for all the schools and findings for the case study schools are difficult to interpret for several reasons. First, the case study schools were not intended to represent all the schools in the program. We intentionally selected schools that had been in the program since it’s inception and had maintained the same teacher as a site coordinator for both years because we wanted to sample schools that were experiencing more stability in implementation. Therefore, we would expect these schools to have a stronger program effect than the group of schools as a whole, which included several schools new to the program in 1999-2000. Second, in the case school analyses we used a different indicator for program implementation, an indicator we hoped would be a stronger indicator of program implementation than solely relying on teacher self-report on the survey. Both of these differences between the set of case schools and the set of all schools suggest that the findings in the case schools might better represent the potential impact of the program when it is implemented as intended by the program designers. We can’t, however, clearly conclude that the case findings represent the potential of the program when it is well implemented because there is a further difference in the indicators used in the two samples. In the analyses based on all schools, we used survey items that asked specifically about the amount teachers had integrated the arts into English/reading lessons and mathematics lessons. For the case schools, in contrast, we created an indicator that was not specific to a discipline and included information on how much a teacher had worked with an artist in the classroom. The emphasis on how much a teacher worked with an artist in the classroom was a particularly important dimension of implementing AAA because the program’s intent was that teachers and artists move beyond an artist residency model of instruction. Although the indicator used in the analyses of all schools was discipline specific, it did not include the dimension of teacher-artist collaboration that was informed by multiple sources of information. Given these distinctions, each set of analyses offers a different, but related perspective on how AAA might be affecting teaching and learning. Further research is needed to understand which aspect(s) of AAA are key to improving teaching and learning; whether it is the nature and duration of the teacher-artist partnership, the amount of integration in a specific discipline, the amount of integration across multiple non-arts disciplines, or some yet unidentified element of the program.

CENTER FOR APPLIED RESEARCH AND EDUCATIONAL IMPROVEMENT 17
Achievement Analysis for 2000-2001 School Year There were 31 elementary schools involved in Arts for Academic Achievement during the 2000-2001 school year. Five of the schools were new to the program that year, and a sixth school had been involved during the first year of implementation, then stepped away for a year by mutual decision of the school and the program manager, then rejoined AAA in 2000-2001.
Methods As we were completing our first round of data analysis, we learned that many students, even at the elementary level, leave their homeroom for instruction in reading and or mathematics. Because we had been using a student’s home room to match student data to teacher survey data, and because not all teachers at a given grade level may integrate the arts to the same degree, we modified our procedure for matching teacher surveys and student data beginning in 2000-2001. Participants Of the 31 elementary schools involved in AAA this year, 12 were excluded from the analysis because we could not adequately match student data with the survey of their math or reading teacher. In seven schools, students switch teachers for reading and/or math frequently in at least some grade levels. These schools, in some cases only one or two grade levels at a school, were excluded from our analyses because we determined that we did not have an adequate method for quantifying their exposure to arts integration. For example, some, none, or all of the reading teachers a student had during the year may have integrated the arts to varying degrees and we couldn’t determine whether or not the student was receiving instruction from a particular teacher when the integration occurred. We had to exclude five other schools from the analysis because we did not receive any information on which teachers had which students for reading and mathematics. After these exclusions, 19 schools remain for the analysis. Because our analysis includes only a subset of the teachers and students involved in AAA this year, the results may not represent the program’s impact in all 31 schools. Across the 19 schools there were 6371 students in grades 3-5. Some of these cases had to be dropped from our analysis because of missing data. For example, some students are missing test scores or demographic data, or their teacher did not complete the survey, or their teacher completed the survey but did not answer the items needed for our model. There were an especially large proportion of students missing demographic information in this data set. We compared the demographic characteristics of students with complete data sets and those with incomplete data sets to determine the extent to which the sample might be biased. Statistical tests indicate that there is a significantly lower proportion of the following characteristics in the group with complete data sets: free- and reduced-price lunch, special education, ELL, and non-white race/ethnicity (see

CENTER FOR APPLIED RESEARCH AND EDUCATIONAL IMPROVEMENT 18
Appendix B for details). Because these characteristics are often associated with lower achievement levels, it is possible that the findings are biased toward more high achieving students.
Due to the large amount of missing data in third grade, the analysis in this section focuses on students in grades 4 and 5. For reading we only had data for 140 students and only 143 for math out of the 1200 students who were third graders in the 19 schools that year. Design and Analysis Teachers at each school were asked to indicate which students they instructed in reading and which they instructed in math. We entered this information into our data file and were thus able to match each student’s demographic and test data with the survey responses of both their reading teacher and their math teacher. In some cases they were the same person, but in others the student may have had a different teacher for reading, for math, and for the remaining disciplines in the curriculum.
Results
Reading Achievement Multiple regression analyses, with weighted cases, indicate there is no significant linear relationship between extent of integration into English/reading lessons and reading gain scores in either fourth or fifth grade. Caution is needed in generalizing this finding to all fourth graders because only 490 of the 1210 fourth graders had complete data sets. Mathematics Achievement Multiple regression analyses, with weighted cases, indicate there is no significant linear relationship between the extent of arts integration into mathematics lessons and math achievement in either fourth or fifth grade.
Discussion The relationships between arts integration and achievement that occurred in the program’s second year of implementation were not sustained in the third year. One explanation for this difference may be that for the 2000-2001 school year we matched student data to the survey of their reading teacher and the survey of their math teacher, rather than to the survey of their homeroom teacher. Because a student may not always receive reading or math instruction from their homeroom teacher, this change was intended to provide a more accurate measure of how much arts integrated instruction students experienced in each discipline. The findings from the final year of the program will provide further information on the impact of this shift. Another explanation may be that because six additional elementary schools joined this year, some of the teachers were not as experienced at integrating the arts and collaborating with artists.

CENTER FOR APPLIED RESEARCH AND EDUCATIONAL IMPROVEMENT 19
Achievement Analysis for 2001-2002 School Year In the fourth and final year of implementation there were 33 elementary schools involved in AAA. Two of the schools had received small planning grants during the previous year and were implementing the program for the first time in 2001-2002.
Methods
Participants Our analyses are based on data from 17 of the 33 elementary schools. The other schools were dropped from the analyses because we were unable to match individual students with their reading teacher and/or math teacher either because students switch teachers frequently as part of the school’s instructional plan, or we did not get sufficient information from the school on which teachers had which students for reading and mathematics instruction. To assess the extent that the resulting sample varies from the group of students in all 33 program schools, we compared student characteristics and teacher use of arts integration between the 17 schools included in the subsequent analyses and the 16 schools that are not included. Statistical tests indicate there are no significant differences between the two groups of schools. Details on these comparisons appear in the Appendix. There were a total of 2664 students in grades 3-5 in the data files obtained from the school district. Some students had to be excluded from data analysis because of missing data and the size of the sample available for analysis was 1535. Students could have been excluded from the analysis for one of several reasons. Some students were missing demographic information and others did not have test data for both school years under consideration. Some students couldn’t be matched with their teacher’s survey because their teacher did not write his/her name on the survey and some teachers didn’t complete the survey items needed in the analysis, and hence their students had to be excluded. To determine if there were any significant differences in the characteristics of students with complete data sets and those with incomplete data that might bias the findings, we compared the characteristics of the two groups. Statistical tests indicate that there are a significantly lower proportion of the following characteristics in the group with complete data sets: free- and reduced-price lunch, special education, ELL, and non-white race/ethnicity (see Appendix C for details). Because these characteristics are often associated with lower achievement levels, it is possible that the findings are biased toward more high achieving students. Design and Analyses Teachers at each school were asked to indicate which students they instructed in reading
CENTER FOR APPLIED RESEARCH AND EDUCATIONAL IMPROVEMENT 20
and which they instructed in math. We entered this information into our data file and were thus able to match each student’s demographic and test data with the survey responses of both their reading teacher and their math teacher. In some cases they were the same person, but in others the student may have had a different teacher for reading, for math, and for the remaining disciplines in the curriculum. In this final year of study, we added two indicators of program implementation to examine these additional questions about the impact of AAA on student learning:
To what extent does a teacher’s overall use of arts integration in non-arts disciplines improve student learning in reading and mathematics? To what extent does a teacher’s involvement in interdisciplinary teaming with an artist improve student learning in reading and mathematics?
Two scales were created to address these questions based on information from the teacher survey. The first scale, overall integration, was created by summing teachers’ responses to questions about the extent they integrated the arts into lessons in English/reading, mathematics, history/social studies, and science. Response values for each question range from 0, which represents not at all, to 3, which represents a lot. The maximum score possible on the scale is 12. Scores ranged from 0 to 12 with an average of 7.0.
The second scale was interdisciplinary teaming. It was created by combining teachers’ responses to a question about whether they worked with an arts partner to integrate the arts, and questions about how often they did the following with their arts partner: co-developed arts integrated curriculum, co-developed arts integrated assessment, and co-taught students in the teacher’s classroom. These activities were part of a longer list of ways that a teacher may have worked with an arts partner. We limited our definition of interdisciplinary teaming to use of the activities listed above in order to distinguish it from activities more characteristic of an artist residency model. A score of 0 on this scale indicates that the teacher did not have an arts partner, while a score of 3 means that although the individual had an arts partner, he/she did not participate in any of these activities. Scores ranged from 0 to 12 with an average of 6.1. Twenty percent of the teachers did not work with an arts partner but may have integrated the arts by themselves or in collaboration with an arts specialist teacher.
Results
In this section we describe the results of the regression models we tested to explore the relationship of arts integration and student achievement. First, we describe the results from tests of models in the first and third sets, both which are based on analyses of the whole group of students in a grade level. Next, we examine the impact of adding each of the new indicators to the regression model. Finally, we describe the results of models in the second set, which are based on sub-groups of students.

CENTER FOR APPLIED RESEARCH AND EDUCATIONAL IMPROVEMENT 21
Reading Achievement Figure 1 shows the average gain score for third grade students whose reading teacher used different levels of arts integration into English/reading lessons. The average gain score is highest (12.2) for students whose teacher integrated the arts a lot. Figure 1. Third Grade Reading Achievement and Arts Integration
10.6
10.9
12.2
9
9.5
10
10.5
11
11.5
12
12.5
13
13.5
14
Not at all (n=25) Very little/Some (n=252) A lot (n=181)
Level of Arts Integration
Ave
rage
Gai
n Sc
ore
Table 14 shows the regression coefficients for level of arts integration into English/reading lessons for students in grades three, four, and five. There is a significant linear relationship between the extent teachers integrate the arts into English/reading lessons, and the increase in students’ test scores at each grade level. The effect is largest in third grade where for every unit increase in the level of arts integration by a teacher (e.g., from very little to some) the students’ gain on the test increases by 1.02 scale score points. For third grade students whose reading teacher integrates the arts a lot, arts integration is related to an increase of 3.06 scale score points. The district considers a gain in the range of 10.0-15.0 to be a year’s growth in reading for third graders and arts integration makes a significant contribution to the gain in students’ test scores. The regression models for fourth and fifth grade students indicate that their gain scores are increased by .80 scale score points for every unit increase in the level of arts integration by their reading teacher. If, say, a fourth grade teacher integrated the arts a

CENTER FOR APPLIED RESEARCH AND EDUCATIONAL IMPROVEMENT 22
lot into English/reading lessons, arts integration would be related to an increase of 2.4 scale score points on their reading test8. Table 14. Summary of Regression Analysis for Variables Predicting Reading Achievement Third Grade Fourth Grade Fifth Grade β SE Beta β SE Beta β SE Beta Constant 8.04*** 1.19 3.64*** .93 3.45*** .76 Gender -.12 .52 -.01 .10 .39 .01 .01 .34 .00 ELL 2.90*** .69 .12 2.11*** .52 .11 2.51*** .49 .14 White/non-white
.57 .64 .03 2.02*** .51 .12 .92* .44 .06
Free lunch .19 .64 .01 -.89 .49 -.05 -.37 .42 -.03 Special education
2.18* 1.05 .06 .46 .62 .02 2.18*** .52 .10
Arts integrated into English/reading lessons
1.02** .39 .07 .80** .31 .06 .80** .29 .07
N
458 534 543
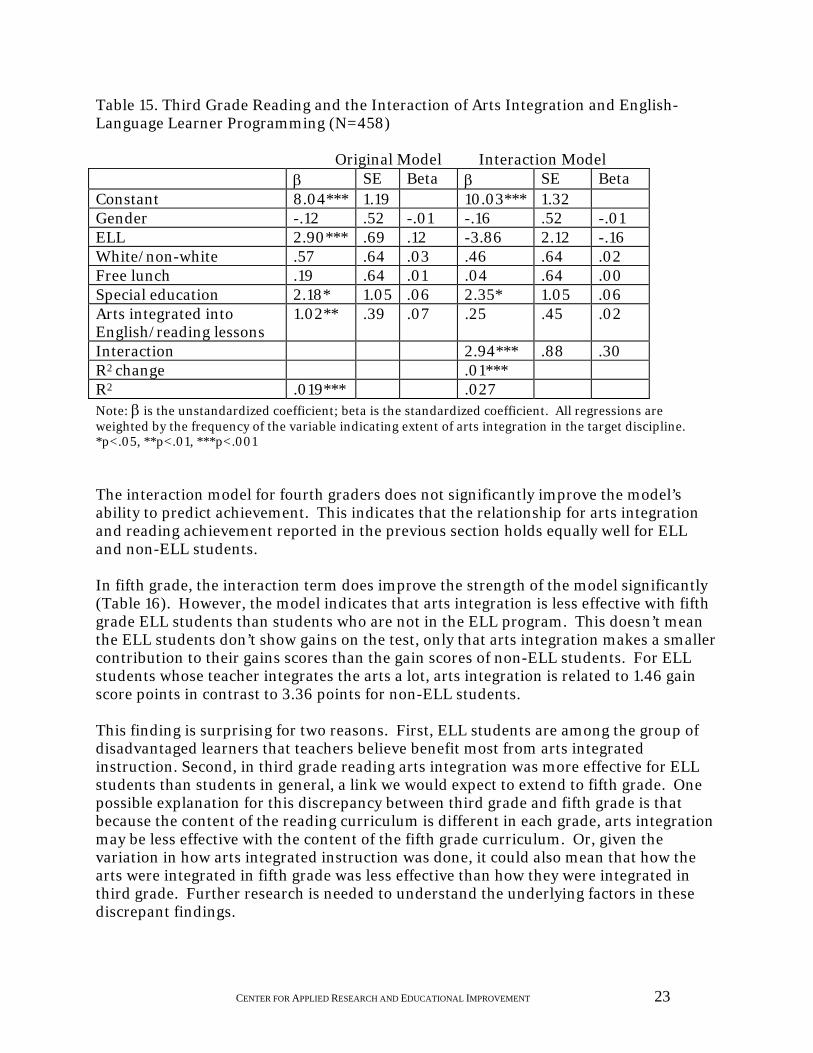
R2 .019 .028 .029 Note: β is the unstandardized coefficient; beta is the standardized coefficient. All regressions are weighted by the frequency of the variable indicating extent of arts integration in the target discipline. *p<.05, **p<.01, ***p<.001 Next, we tested a set of models that included an interaction term for arts integration and the dummy coded variable for either student’s participation in the ELL program, the free- and reduced-price lunch program, or their race/ethnicity. English-Language Learners In third grade, the model including the interaction of arts integration and a student’s participation in the ELL program explains more of the variation in student achievement than the original model described above. The interaction model indicates that arts integration is more powerful for students in the ELL program than students not in the program (Table 15). For students whose teacher integrates the art a lot, arts integration is related to .75 gain score points for non-ELL students in comparison to 3.69 points for ELL students. This doesn’t mean arts integration isn’t effective for students who are not in the ELL program, only that it is more effective for ELL students.
8 The gain range of a year’s growth in fourth and fifth grade reading are 6.3-9.5 and 5.3-7.9, respectively.
CENTER FOR APPLIED RESEARCH AND EDUCATIONAL IMPROVEMENT 23
Table 15. Third Grade Reading and the Interaction of Arts Integration and English-Language Learner Programming (N=458) Original Model Interaction Model β SE Beta β SE Beta Constant 8.04*** 1.19 10.03*** 1.32 Gender -.12 .52 -.01 -.16 .52 -.01 ELL 2.90*** .69 .12 -3.86 2.12 -.16 White/non-white .57 .64 .03 .46 .64 .02 Free lunch .19 .64 .01 .04 .64 .00 Special education 2.18* 1.05 .06 2.35* 1.05 .06 Arts integrated into English/reading lessons
1.02** .39 .07 .25 .45 .02
Interaction 2.94*** .88 .30 R2 change .01*** R2 .019*** .027 Note: β is the unstandardized coefficient; beta is the standardized coefficient. All regressions are weighted by the frequency of the variable indicating extent of arts integration in the target discipline. *p<.05, **p<.01, ***p<.001 The interaction model for fourth graders does not significantly improve the model’s ability to predict achievement. This indicates that the relationship for arts integration and reading achievement reported in the previous section holds equally well for ELL and non-ELL students. In fifth grade, the interaction term does improve the strength of the model significantly (Table 16). However, the model indicates that arts integration is less effective with fifth grade ELL students than students who are not in the ELL program. This doesn’t mean the ELL students don’t show gains on the test, only that arts integration makes a smaller contribution to their gains scores than the gain scores of non-ELL students. For ELL students whose teacher integrates the arts a lot, arts integration is related to 1.46 gain score points in contrast to 3.36 points for non-ELL students. This finding is surprising for two reasons. First, ELL students are among the group of disadvantaged learners that teachers believe benefit most from arts integrated instruction. Second, in third grade reading arts integration was more effective for ELL students than students in general, a link we would expect to extend to fifth grade. One possible explanation for this discrepancy between third grade and fifth grade is that because the content of the reading curriculum is different in each grade, arts integration may be less effective with the content of the fifth grade curriculum. Or, given the variation in how arts integrated instruction was done, it could also mean that how the arts were integrated in fifth grade was less effective than how they were integrated in third grade. Further research is needed to understand the underlying factors in these discrepant findings.

CENTER FOR APPLIED RESEARCH AND EDUCATIONAL IMPROVEMENT 24
Table 16. Fifth Grade Reading and the Interaction of Arts Integration and English-Language Learner Programming (N=543) Original Model Interaction Model β SE Beta β SE Beta Constant 3.45*** .76 2.73*** .81 Gender .01 .34 .00 .07 .35 .01 ELL 2.51*** .49 .14 6.50*** 1.69 .35 White/non-white .92* .44 .06 .85 .44 .06 Free lunch -.37 .42 -.03 -.37 .42 -.03 Special education 2.18*** .52 .10 2.15*** .52 .10 Arts integrated into English/reading lessons
.80** .29 .07 1.12*** .31 .10
Interaction -1.90* .77 -.22 R2 change .004* R2 .029*** .032 Note: β is the unstandardized coefficient; beta is the standardized coefficient. All regressions are weighted by the frequency of the variable indicating extent of arts integration in the target discipline. *p<.05, **p<.01, ***p<.001 Socioeconomic Status For third graders, the addition of an interaction term for arts integration and students’ socioeconomic status improved the power of the model significantly (Table 17). The model indicates that arts integration was more effective for students from low socioeconomic homes. For students in the lunch program whose teacher integrates the arts a lot, arts integration is related to 1.67 gain score points, versus less than one point for students who are not in the lunch program. Table 17. Third Grade Reading and the Interaction of Arts Integration and Student Socioeconomic Status (N=458) Original Model Interaction Model β SE Beta β SE Beta Constant 8.04*** 1.19 10.53*** 1.7 Gender -.12 .52 -.01 -.10 .52 -.01 ELL 2.9*** .69 .12 2.95*** .69 .12 White/non-white .57 .64 .03 .55 .64 .03 Free lunch .19 .64 .01 -3.8 2.04 -.19 Special education 2.18* 1.05 .06 2.32* 1.05 .06 Arts integrated into English/reading lessons
1.02** .39 .07 .02 .62 .00
Interaction 1.61* .79 .20 R2 change .003* R2 .019 .022 Note: β is the unstandardized coefficient; beta is the standardized coefficient. All regressions are weighted by the frequency of the variable indicating extent of arts integration in the target discipline. *p<.05, **p<.01, ***p<.001

CENTER FOR APPLIED RESEARCH AND EDUCATIONAL IMPROVEMENT 25
Adding this interaction to the original model did not improve the model significantly for fourth and fifth grade. This indicates that the relationship for arts integration and reading achievement reported in the previous section holds equally well for fourth and fifth grade students whether they are in the lunch program or not. Non-White Students Adding an interaction term for arts integration and student race/ethnicity improves the power of the model for fifth grade reading (Table 18). However, the model indicates that arts integration is less effective for non-white students than white students in fifth grade reading. Non-white students do show gains on the test, but the relationship between arts integration and reading achievement is weaker for non-white students than white students. For non-white students whose teacher integrates the arts a lot, arts integration is related to 2.34 gain score points in contrast to 3.81 points for white students. Table 18. Fifth Grade Reading and the Interaction of Arts Integration and Student Race/Ethnicity (N=543) Original Model Interaction Model β SE Beta β SE Beta Constant 3.45*** .76 2.44** .87 Gender .01 .34 .00 .01 .34 .00 ELL 2.51*** .49 .14 2.54*** .49 .14 White/non-white .92* .44 .06 4.33** 1.49 .29 Free lunch -.37 .42 -.03 -.38 .42 -.03 Special education 2.18*** .52 .10 2.13*** .52 .10 Arts integrated into English/reading lessons
.80** .29 .07 1.27*** .35 .11
Interaction -1.47* .62 -.24 R2 change .003* R2 .029 .032 Note: β is the unstandardized coefficient; beta is the standardized coefficient. All regressions are weighted by the frequency of the variable indicating extent of arts integration in the target discipline. *p<.05, **p<.01, ***p<.001 The models for third and fourth grade that included the interaction of race/ethnicity and arts integration did not add significantly to the power of the model. This indicates that the relationship for arts integration and reading achievement in grades three and four reported in the previous section holds equally well for white and non-white students. Further research is needed to explore why the findings suggest that arts integration is less effective for non-white students in the fifth grade.

CENTER FOR APPLIED RESEARCH AND EDUCATIONAL IMPROVEMENT 26
Interdisciplinary Teaming For students in the third grade, their teacher’s involvement in interdisciplinary teaming with an artist made a significant contribution to student gains on the reading test, in addition to the gain score points associated with a teacher’s level of arts integration in English/reading. Table 19 shows the resulting model. This finding suggests that it is not only arts integrated instruction that makes a difference in achievement, but also the extent a teacher works collaboratively with an artist to plan and deliver instruction and assessment. The results were not significant for fourth or fifth grade students. Table 19. Third Grade Reading and Interdisciplinary Teaming (N=458) β SE Beta Constant 5.32*** 1.252 Gender -.22 .52 -.01 ELL 2.57*** .69 .11 White/non-white .11 .65 .01 Free lunch .44 .64 .02 Special education 2.28* 1.04 .06 Arts integrated into English/reading lessons
.92* .39 .06
Interdisciplinary teaming .50*** .08 .16 R2 change=.025*** R2=.045*** Note: β is the unstandardized coefficient; beta is the standardized coefficient. All regressions are weighted by the frequency of the variable indicating extent of arts integration in the target discipline. *p<.05, **p<.01, ***p<.001 Overall Integration When a teacher’s score on the overall integration scale was used in the regression model as the indicator of program implementation, the relationship to reading achievement was not statistically significant. This suggests that it is teacher’s specific use of arts integration in English/reading lessons that contributes to achievement gains, rather than a teacher’s general use of arts integration as an instructional strategy. Summary of Findings on Reading Achievement In summary, the analysis of the relationship between arts integrated instruction in English/reading and reading achievement revealed the following significant, linear relationships:
For students in grades three, four, and five, arts integration is significantly related to gain scores in reading. This relationship holds when student characteristics that might also influence test scores are taken into account. Arts integration is more effective for third grade ELL students and third grade students from low socioeconomic homes.

CENTER FOR APPLIED RESEARCH AND EDUCATIONAL IMPROVEMENT 27
Arts integration is less effective for fifth grade ELL students and fifth grade students of non-white race/ethnicity.
For students in the third grade, their teacher’s involvement in interdisciplinary teaming with an artist made a significant contribution to student gains on the reading test, in addition to the gain score points associated with a teacher’s level of arts integration in English/reading.
Mathematics Achievement Figure 2 shows the average gain score for third grade students whose mathematics teacher used different levels of arts integration into mathematics lessons. The average gain score is highest (14.2) for students whose teacher integrated the arts a lot. The district considers the one-year gain range for third grade math to be 10.0-15.0 scale score points. Figure 2. Third Grade Mathematics Achievement and Arts Integration
13.1
11.7
14.2
0
2
4
6
8
10
12
14
16
Not at all (n=61) Very little/Some (n=344) A lot (n=84)
Level of Arts Integration
Ave
rage
Gai
n Sc
ore
Table 20 shows the regression coefficient for the level of arts integration into mathematics lessons for third grade students. Arts integration is significantly related to mathematics achievement; for every level increase in integration, students’ test scores increase by 1.08 scale score points. For third grade students whose math teacher integrates the arts into mathematics lessons a lot, arts integration is related to an increase of 3.24 scale score points.

CENTER FOR APPLIED RESEARCH AND EDUCATIONAL IMPROVEMENT 28
Table 20. Summary of Regression Analysis for Variables Predicting Mathematics Achievement in Third Grade β SE Beta Constant 7.81*** .82 Gender 1.53*** .42 .10 ELL 1.23* .53 .07 White/not-white .70 .50 .04 Free lunch 1.43** .50 .09 Special education 1.90* .75 .07 Arts integrated into mathematics lessons 1.08*** .31 .09 N 489 R2 .084*** Note: β is the unstandardized coefficient; beta is the standardized coefficient. All regressions are weighted by the frequency of the variable indicating extent of arts integration in the target discipline. *p<.05, **p<.01, ***p<.001 The model was not significant for students in grades four and five. These students showed gains on the mathematics test but there was not a significant, linear relationship between the gain score and the amount their mathematics teacher integrated the arts. We also tested a set of models for third graders that included interaction terms for arts integration and either student’s race/ethnicity, participation in the ELL program, or free- and reduced-price lunch program. Interaction Models None of the interaction models contributed significantly to understanding the relationship between arts integration and math achievement. Arts integration has the same relationship to achievement whether or not the student is in the ELL program, the lunch program, or is of white or non-white race/ethnicity. Interdisciplinary Teaming When the indicator for interdisciplinary teaming was added to the regression model there was not a significant increase in the model’s power. This indicates that whether or not a teacher partnered with an artist, and how they worked together, did not contribute to test score gains beyond that already accounted for by how much the teacher integrated the arts into mathematics lessons. Overall Integration When a teacher’s score on the overall integration scale was used in the regression model as the indicator of program implementation, the relationship to reading achievement was not statistically significant. This suggests that it is teacher’s specific use of arts integration in math lessons that contributes to achievement gains rather than a teacher’s general use of arts integration as an instructional strategy.
CENTER FOR APPLIED RESEARCH AND EDUCATIONAL IMPROVEMENT 29
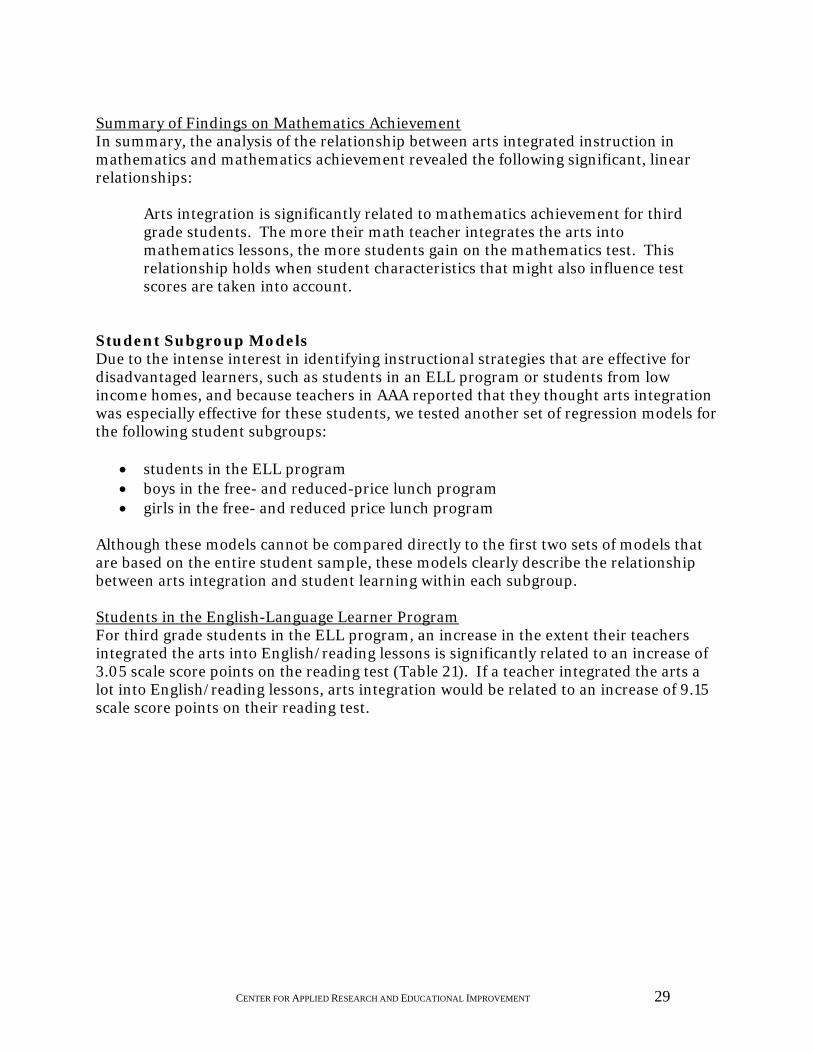
Summary of Findings on Mathematics Achievement In summary, the analysis of the relationship between arts integrated instruction in mathematics and mathematics achievement revealed the following significant, linear relationships:
Arts integration is significantly related to mathematics achievement for third grade students. The more their math teacher integrates the arts into mathematics lessons, the more students gain on the mathematics test. This relationship holds when student characteristics that might also influence test scores are taken into account.
Student Subgroup Models Due to the intense interest in identifying instructional strategies that are effective for disadvantaged learners, such as students in an ELL program or students from low income homes, and because teachers in AAA reported that they thought arts integration was especially effective for these students, we tested another set of regression models for the following student subgroups:
• students in the ELL program • boys in the free- and reduced-price lunch program • girls in the free- and reduced price lunch program
Although these models cannot be compared directly to the first two sets of models that are based on the entire student sample, these models clearly describe the relationship between arts integration and student learning within each subgroup. Students in the English-Language Learner Program For third grade students in the ELL program, an increase in the extent their teachers integrated the arts into English/reading lessons is significantly related to an increase of 3.05 scale score points on the reading test (Table 21). If a teacher integrated the arts a lot into English/reading lessons, arts integration would be related to an increase of 9.15 scale score points on their reading test.

CENTER FOR APPLIED RESEARCH AND EDUCATIONAL IMPROVEMENT 30
Table 21. Summary of Regression Analysis for Variables Predicting Third Grade Reading Achievement for Students in the English-Language Learner Program β SE Beta Constant 12.59** 3.99 Gender .07 1.15 .00 White/not-white -3.65 2.67 -.07 Free lunch*** -9.70 2.35 -.22 Special education 2.54 3.99 .03 Arts integrated into English/reading lessons 3.05*** .80 .20 N=108 R2=.10 Note: β is the unstandardized coefficient; beta is the standardized coefficient. All regressions are weighted by the frequency of the variable indicating extent of arts integration in the target discipline. *p<.05, **p<.01, ***p<.001 There was not a significant linear relationship between arts integration and student reading achievement for ELL students in fourth or fifth grade. This could be due, in part, to the different content of the English/reading curricula in each grade level. In grade 4 students are expected to begin mastering the content of what they read more and more, whereas, in third grade the focus is instead on learning reading skills. It’s possible that the latter are more amenable to the effects of arts integrated instruction. Models of arts integrated math instruction and math achievement for ELL students indicate there is no significant linear relationship for grades 3, 4, or 5. The lack of a linear relationship does not mean that arts integration was detrimental to students, only that arts integration did not contribute to their achievement above and beyond other factors in the model (such as socioeconomic status or race/ethnicity). Boys in the Free- and Reduced-Price Lunch Program For fifth grade boys in the lunch program, reading achievement was significantly related to the extent their reading teacher integrated arts into their English/reading lessons (Table 22). For every level increase in the teacher’s use of arts integration, the student scores increased by 1.32 scale score points. If a teacher integrated the arts a lot into English/reading lessons, arts integration would be related to an increase of 3.96 scale score points on the reading test for boys from low socioeconomic homes.

CENTER FOR APPLIED RESEARCH AND EDUCATIONAL IMPROVEMENT 31
Table 22. Summary of Regression Analysis for Variables Predicting Fifth Grade Reading Achievement for Boys in the Lunch Program β SE Beta Constant 2.06 1.60 ELL 2.63** .96 .13 White/not-white -.95 1.07 -.04 Special education 3.31** 1.03 .15 Arts integrated into English/reading lessons 1.32* .69 .09 N=159 R2=.04 Note: β is the unstandardized coefficient; beta is the standardized coefficient. All regressions are weighted by the frequency of the variable indicating extent of arts integration in the target discipline. *p<.05, **p<.01, ***p<.001
There was not a significant linear relationship between arts integration and reading achievement for third and fourth grade boys in the lunch program. When arts are integrated into math lessons, third grade boys test score gains increase by 1.28 points for every level increase in arts integration by their teacher (Table 23). If a math teacher integrated the arts into math lesson a lot, arts integration would be related to an increase of 3.84 on the math test. The relationship in fourth and fifth grade was not significant. Table 23. Summary of Regression Analysis for Variables Predicting Third Grade Mathematics Achievement for Boys in the Lunch Program β SE Beta Constant 8.36*** 1.29 ELL 1.66* .80 .010 White/not-white 3.39** 1.00 .16 Special education 2.19 1.12 .09 Arts integrated into mathematics lessons 1.28* .55 .11 N=145 R2=.04 Note: β is the unstandardized coefficient; beta is the standardized coefficient. All regressions are weighted by the frequency of the variable indicating extent of arts integration in the target discipline. *p<.05, **p<.01, ***p<.001 Girls in the Free- and Reduced-Price Lunch Program For third grade girls in the lunch program, an increase in teachers’ level of integration is significantly related to a 1.75 change in their reading test score (Table 24). For students

CENTER FOR APPLIED RESEARCH AND EDUCATIONAL IMPROVEMENT 32
whose teacher integrated the arts a lot into English/reading lessons, arts integration would be related to 5.25 scale score points of gain on the reading test. Table 24. Summary of Regression Analysis for Variables Predicting Third Grade Reading Achievement for Girls in the Lunch Program β SE Beta Constant 7.32*** 1.58 ELL 1.29 .93 .07 White/not-white -.43 1.23 -.02 Special education -.02 2.21 .00 Arts integrated into mathematics lessons 1.75** .61 .14 N= 132 R2=.026* Note: β is the unstandardized coefficient; beta is the standardized coefficient. All regressions are weighted by the frequency of the variable indicating extent of arts integration in the target discipline. *p<.05, **p<.01, ***p<.001 The relationship between extent of arts integration and reading achievement was not significant for fourth and fifth grade girls, nor was the relationship between arts integration and math achievement in either grades 3, 4, or 5.
DISCUSSION Our analyses indicate a significant relationship between arts integrated instruction and improved student learning in reading and mathematics in the Arts for Academic Achievement program. The relationship didn’t occur for every student, in every class, or in every year of the project. Nonetheless, our study offers evidence that AAA was associated with real changes that benefited student learning. AAA assisted all types of students, not just those who were already doing well in school. In some cases, the relationship between arts integration and student achievement was more powerful for disadvantaged learners, the group of students that teachers must reach to close the achievement gap. In instances where we did not find a significant relationship between arts integration and student achievement, none of our findings indicate that AAA disadvantages students by lowering their achievement. At minimum, students whose teachers integrated the arts benefited from an increase in arts learning opportunities and achieved on par with their peers who were not in AAA. The findings also have implications for how the link between AAA and student achievement might be made stronger as the program continues to develop. First, the amount of arts integration makes a difference in how much student test scores increase.

CENTER FOR APPLIED RESEARCH AND EDUCATIONAL IMPROVEMENT 33
Teachers in this study reported integrating the arts at varying levels and the results indicate that the greatest benefit occurs when teachers integrate a lot. For example, students whose teacher integrated the arts a lot into English/reading lessons had significantly higher gain scores on the reading test than students whose teachers integrated the arts to a lesser degree. Although some caution is needed in interpreting these results because the survey did not provide definitions for the levels of integration beyond the value labels of not at all, very little, some, or a lot; the study provides some initial evidence that the intensity of arts integration makes a difference for student learning. Another implication suggested by the data is that it’s better to do more integration in one discipline than lesser amounts of integration in multiple disciplines. Although teachers typically reported using arts integration in more than one non-arts discipline, their overall level of arts integration was not related to achievement in reading or mathematics. Instead, it was the level of integration in a specific discipline that was related to achievement. This suggests that teachers and students can get the most benefit from a program like AAA when the integration is focused on one, or maybe two, disciplines, rather than attempting to do small amounts of integration across a wider swath of the curriculum. Based on other data from the larger CAREI evaluation of AAA, we had expected to see a stronger relationship between student achievement and the extent of interdisciplinary teaming between teachers and artists. Information from the annual teacher survey, teacher interviews, and the analyses based on the case study schools in 1999-2000 suggested that teachers who worked in-depth with an arts partner to co-develop and teach arts integrated curriculum were more likely to change their instructional practice and their beliefs about student capabilities (Ingram, Anderson, Seashore & Freeman, 2001) than teachers who collaborated with an artist less intensely or not at all. Teaming with an artist was also strongly related to teachers’ overall level of integrating the arts (Seashore, Anderson, and Riedel, 2003). Given the centrality of arts partnerships to the AAA program, this is an area that warrants further exploration. One possible explanation for the lack of evidence relating interdisciplinary teaming and achievement may be the structure of the survey. Although teachers may have had the opportunity to work with more than one arts partner, and many teachers reported using arts integration in more than one non-arts discipline, the survey asked only about the artist they worked with most closely. Hence, when we modeled the relationship between interdisciplinary teaming and math achievement, we may have based it on a teacher’s description of how they worked with an arts partner to integrate science. The teacher may have integrated the arts into math by themselves or in partnership with an arts specialist teacher, yet the structure of our data did not allow us to make these distinctions. The achievement study illustrates the difficulty in measuring the level of program implementation for a complex, highly variable initiative such as AAA, and, subsequently assessing the program’s effect on student achievement. During our longitudinal study of AAA, we discovered considerable variation both in how teachers and artists work together to integrate the arts (Freeman, Seashore & Werner, 2003), and in the relative

CENTER FOR APPLIED RESEARCH AND EDUCATIONAL IMPROVEMENT 34
emphasis on arts and non-arts instruction in an integrated lesson. Further research is needed to specify the dimensions of AAA that are most closely related to improvements in teaching and learning. The construct of integrating the arts through arts partnerships seems to have at least two critical axis: how the teacher and arts partner work together, and the nature of the instruction itself. Other important variations may be the art form and the non-art discipline that are being integrated, and whether the art partner is an arts specialist teacher, an external artist, or an artist on the school staff. A year by year comparison of the achievement study results shows that the relationship of arts integration and achievement varies notably by program year (Table 25). In the final year of the program, we found a significant relationship between reading achievement and arts integration into English/reading lessons at all grade levels, but in mathematics this occurred only in grade 3. In the program’s second year (the first year of the achievement study), we found a significant relationship between math achievement and arts integration into math lessons at all grade levels, but in reading this occurred only at grade 4. There are several plausible explanations for this variation. Table 25. Overview of Significant Relationships between Arts Integration and Student Achievement 1999-2000 2000-2001 2001-2002 Reading grade 3 Reading grade 4 Reading grade 5 Math grade 3 Math grade 4 Math grade 5 Note: Shaded cells indicate the grade levels and subject areas where we found a positive, linear, statistically significant relationship between arts integration and student learning First, we revised the design in the last two years of the study to match student data with information on how much their math teacher integrated and how much their reading teacher integrated, rather than only with their homeroom teacher. We believe the former provides a more accurate indication of how much arts integrated instruction students received. Second, due to the difficulty in obtaining information needed to match each individual student with their math teacher and reading teacher, the number of schools in the final two years of the study is notably smaller. Although comparisons of student characteristics between all elementary schools in the program in 2001-2002 and the schools included in the analysis did not show any significant differences, it’s possible that some of program effects were different in the schools omitted from the analyses. The evolution of the program itself may also explain the varying findings across the years of the study. Based on information from formative evaluation reports and the experience of program staff, the program was refined as implementation progressed. The understanding and experience of individual teachers and artists also evolved over

CENTER FOR APPLIED RESEARCH AND EDUCATIONAL IMPROVEMENT 35
time leading to changes in how they planned lessons, how they selected partners and how they worked together in the classroom. If we assume that the program was generally being strengthened as time went on, we would expect the strongest results in the final year when the program was at its most thoroughly implemented. Further exploration would be useful to understand why the math effects identified in the program’s second year were not sustained as the program evolved. An added layer to the evolution of the program is change in the teachers and schools involved in the program. Each year new teachers and schools came into the program (including new teachers at schools that were already involved) and some teachers originally involved may have dropped out or been moved to a school that was not involved in the program. Hence, even if we assume that the program evolved over time to become stronger (more effective professional development, for example), not all of the teachers had four years of experience in the program to build their understanding and improve implementation. Further study of a subset of teachers and artists who were involved in the program for the duration may clarify the relationship between arts integrated instruction, arts partnerships, and student achievement. As in any study of the effects of an attempt to change teaching and learning in a school setting rather than the controlled environment of a lab, it is difficult to isolate the cause of any observed changes. At the same time Minneapolis was involved in AAA they had several other district initiatives also aiming to strengthen teacher instructional practice and improve student achievement in reading, math, science, writing, as well as various improvement programs initiated at the individual school level. Any and all of these interventions could have played a role in the achievement gains reported here. The significant amount of missing data suggests caution in generalizing these results to all students. Students of color, or from low income homes, or those participating in English-language learner programs, were underrepresented in the study samples relative to all students enrolled in AAA elementary schools. Because these characteristics are often associated with high mobility rates, these students are more likely to have incomplete data files and not be included in studies such as this one that examine change over time. Due to the voluntary nature of teacher participation in AAA, another factor confounding these results may be that teachers who chose to be involved in AAA were already more effective instructors than their peers who chose not to become involved. Data from other portions of our study suggest, however, that even if this were the case, these “good” teachers developed new skills and modified their beliefs about student capacity in ways that help them reach more students. This study examined the impact of arts integrated instruction on student achievement in one school district. Because variation rather than uniformity is the norm among arts in education programs, these findings may not be as applicable to situations where the content of the program (e.g., the intensity and content of professional development provided, the program’s expectations of school teams, the relative focus on achievement in arts or non-arts), or the nature of instruction differs significantly from that of AAA.

CENTER FOR APPLIED RESEARCH AND EDUCATIONAL IMPROVEMENT 36
References Freeman, C.J., Seashore, K.R., and Werner, L. (2003). Models of implementing Arts for Academic Achievement: Challenging contemporary classroom practice. Center for Applied Research and Educational Improvement, University of Minnesota, Minneapolis, MN. Ingram, D., Anderson, R., Seashore, K.R., and Freeman, C.J. (2001). Results from the 1999-2000 teacher survey. Center for Applied Research and Educational Improvement, University of Minnesota, Minneapolis, MN. Seashore, K.S., Anderson, A.R., and Riedel, E. (2003). The impact of mental models, professional community, and interdisciplinary teaming. Center for Applied Research and Educational Improvement, University of Minnesota, Minneapolis, MN. Werner, L. and Ingram, D. (1999). Report on the 1998-1999 mid-year progress interviews. Center for Applied Research and Educational Improvement, University of Minnesota, Minneapolis, MN.
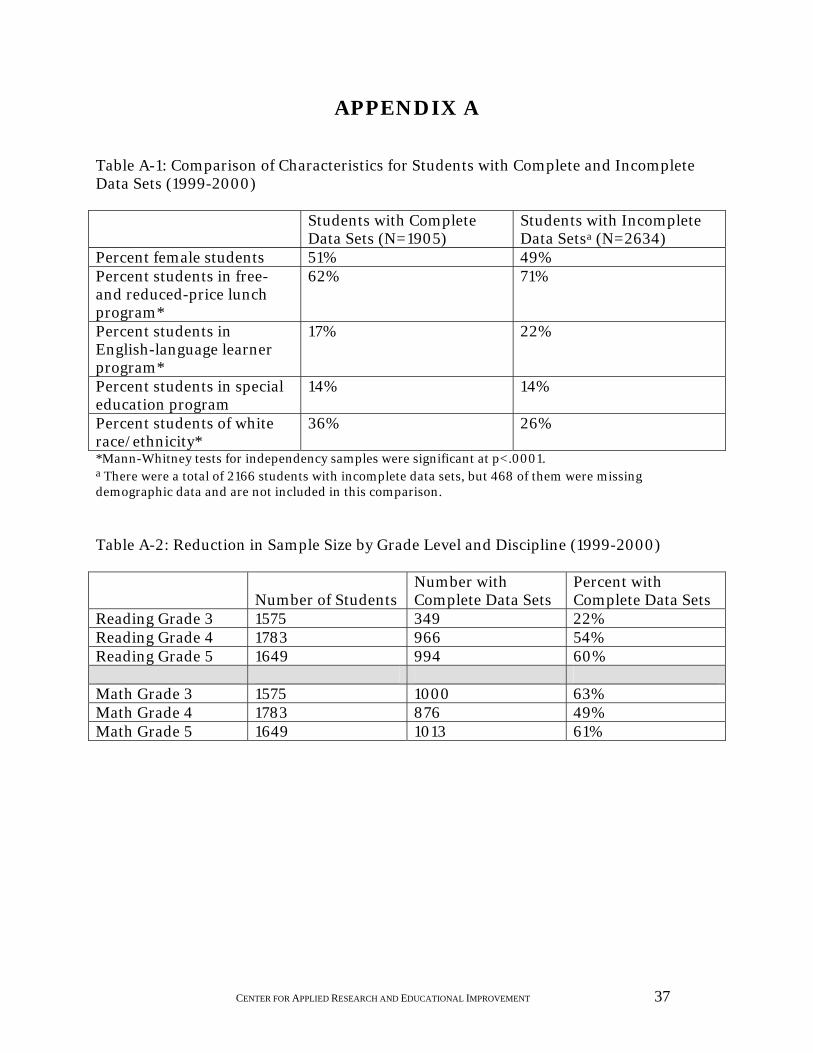
CENTER FOR APPLIED RESEARCH AND EDUCATIONAL IMPROVEMENT 37
APPENDIX A Table A-1: Comparison of Characteristics for Students with Complete and Incomplete Data Sets (1999-2000) Students with Complete
Data Sets (N=1905) Students with Incomplete Data Setsa (N=2634)
Percent female students 51% 49% Percent students in free- and reduced-price lunch program*
62% 71%
Percent students in English-language learner program*
17% 22%
Percent students in special education program
14% 14%
Percent students of white race/ethnicity*
36% 26%
*Mann-Whitney tests for independency samples were significant at p<.0001. a There were a total of 2166 students with incomplete data sets, but 468 of them were missing demographic data and are not included in this comparison. Table A-2: Reduction in Sample Size by Grade Level and Discipline (1999-2000)
Number of Students Number with Complete Data Sets
Percent with Complete Data Sets
Reading Grade 3 1575 349 22% Reading Grade 4 1783 966 54% Reading Grade 5 1649 994 60% Math Grade 3 1575 1000 63% Math Grade 4 1783 876 49% Math Grade 5 1649 1013 61%

CENTER FOR APPLIED RESEARCH AND EDUCATIONAL IMPROVEMENT 38
APPENDIX B
Table B-1: Comparison of Characteristics for Students with Complete and Incomplete Data Sets (2000-2001) Students with Complete
Data Sets (N=1013) Students with Incomplete Data Setsa (N=343)
Percent female students 51% 50% Percent students in free- and reduced-price lunch program*
56% 69%
Percent students in English-language learner program*
16% 27%
Percent students of white race/ethnicity*
37% 27%
*Mann-Whitney tests for independency samples were significant at p<.0001. a There were a total of 1562 students with incomplete data sets, but 1219 of them were missing demographic data and are not included in this comparison. Table B-2: Reduction in Sample Size by Grade Level and Discipline (2000-2001)
Number of Students in 19 Schools
Number with Complete Data Sets
Percent with Complete Data Sets
Reading Grade 3 1086 140 13% Reading Grade 4 873 496 57% Reading Grade 5 780 439 56% Math Grade 3 1086 143 13% Math Grade 4 873 497 57% Math Grade 5 780 424 54%
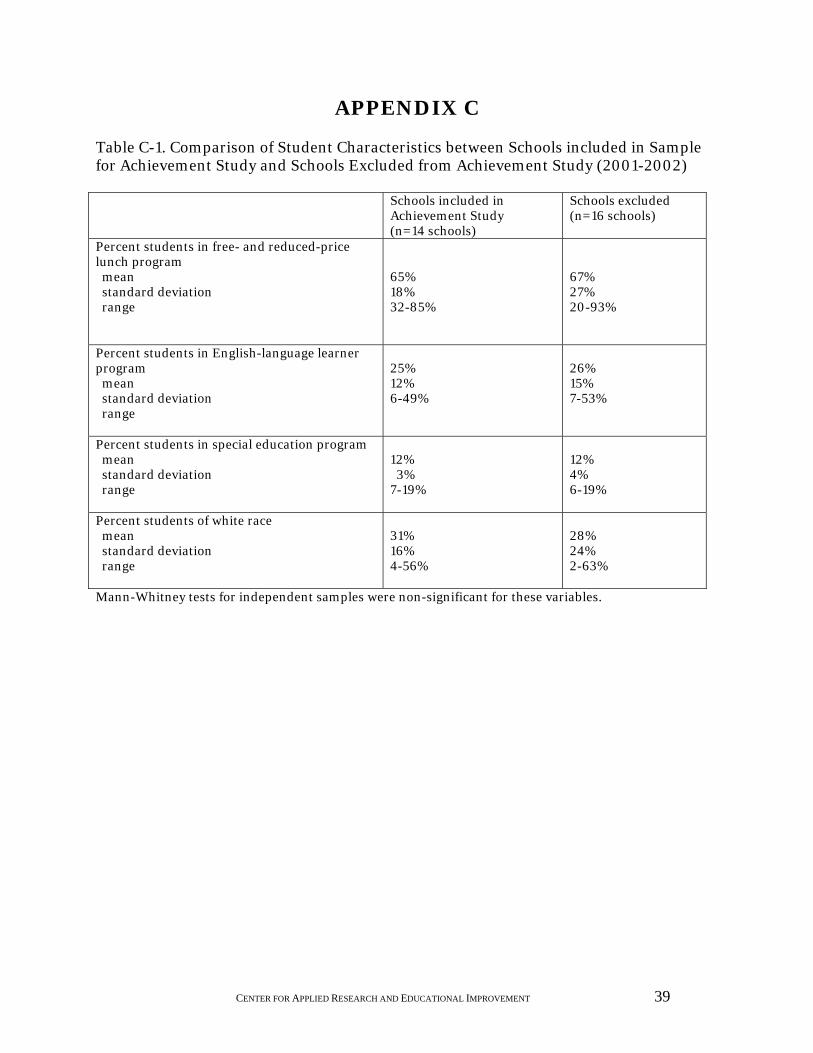
CENTER FOR APPLIED RESEARCH AND EDUCATIONAL IMPROVEMENT 39
APPENDIX C Table C-1. Comparison of Student Characteristics between Schools included in Sample for Achievement Study and Schools Excluded from Achievement Study (2001-2002) Schools included in
Achievement Study (n=14 schools)
Schools excluded (n=16 schools)
Percent students in free- and reduced-price lunch program mean standard deviation range
65% 18% 32-85%
67% 27% 20-93%
Percent students in English-language learner program mean standard deviation range
25% 12% 6-49%
26% 15% 7-53%
Percent students in special education program mean standard deviation range
12% 3% 7-19%
12% 4% 6-19%
Percent students of white race mean standard deviation range
31% 16% 4-56%
28% 24% 2-63%
Mann-Whitney tests for independent samples were non-significant for these variables.

CENTER FOR APPLIED RESEARCH AND EDUCATIONAL IMPROVEMENT 40
Table c-2. Comparison of Student Characteristics between Students with Complete and Incomplete Data Sets (2001-2002) Students with
Complete Data Sets (N=1535)
Students with Incomplete Data Setsa (N=947)
Percent female students 49% 49% Percent students in free- and reduced-price lunch program**
62% 71%
Percent students in English-language learner program**
21% 28%
Percent students in special education program*
10% 14%
Percent students of white race** 33% 25% Mann-Whitney tests for independent samples were significant at p<.0001 for variables marked ** and at p<.05 for variables marked *. aThere were a total of 1129 students with incomplete data sets but 182 of them were missing demographic data and are not included in this comparison. Table C-3. Reduction in Sample Size by Grade Level and Discipline (2001-2002) Number of
Students Number with Complete Data Sets
Percent with Complete Data Sets
Reading Grade 3 797 458 57% Reading Grade 4 870 534 61% Reading Grade 5 815 543 67% Math Grade 3 797 489 61% Math Grade 4 870 538 62% Math Grade 5 815 544 67%

CENTER FOR APPLIED RESEARCH AND EDUCATIONAL IMPROVEMENT 41
APPENDIX D
Initial Results of Hierarchial Linear Modeling of Achievement Data A separate analysis technique called hierarchical linear modeling (HLM) is used to look at the impact of arts integration on changes in student achievement. The typical multiple regression model treats the variables in the model (such as degree of arts integration) as having the same impact on student achievement regardless of the particular school. For example, going from a low to a high level of arts integration increases student achievement three points no matter if it’s in school A, school B, or school C. Hierarchical linear modeling differs from multiple regression by allowing for different effects of the same variable for different subsets of the study sample. HLM imposes some stronger requirements on the data than multiple regression. It requires that data be “nested”. This means that one level of data can encompass another level of data. For example, 20,000 students may be conceived of as 50 schools that have 400 students each. HLM would then combine data about each school as well as each student. The present analysis looked at students from grades four and five. There were 736 fourth grade students grouped in 61 classes which each had a single teacher in common. There were 767 fifth grade students grouped in 64 classes which each had a single teacher in common. The present analysis used two years of achievement data from each student (reading and math NALT scores for 1999 and 2000) as well as free or reduced lunch eligibility and data from each teacher (degree to which they integrated arts into curriculum, use of arts partner). HLM also requires that there is no missing data for any case included in the analysis. For the present analysis that meant that there had to be records on both 1999 and 2000 achievement test scores for a student to be included in the analysis as well as other demographic information. Thus the samples of students in the present analysis were necessarily biased in favor of students who had full information available – typically those who do better on achievement tests. The HLM models used here assumed that year 2000 NALT scores in reading and math were a function of the previous year’s NALT scores and free and reduced lunch status. It was assumed that the average achievement level in each classroom, the impact of the previous year’s NALT scores, and free or reduced lunch status all varied by classroom (and teacher). HLM tested whether this variation by classroom could be predicted by some aspect of the teachers’ integration of arts into the curriculum. Specifically the HLM analysis tested: the direct impact of arts integration on average achievement level of the classroom, a mediating impact of arts integration on student achievement through how free or reduced lunch status impacts student achievement levels, and the impact of using arts partner on the average achievement level of the classroom. The models were tested for the impact on reading and math NALT scores with fourth and fifth grade students. Only with fourth grade reading scores did arts integration appear to influence student achievement and do so through directly affecting the average

CENTER FOR APPLIED RESEARCH AND EDUCATIONAL IMPROVEMENT 42
achievement level in a particular classroom. All other possible effects of arts integration were not supported by the analysis. The specific relationship between arts integration and average classroom fourth grade reading scores will vary by classroom but almost all of those relationships are statistically significant. (If this analysis were repeated with many similar samples, 95 percent of the time an increase in one point on the arts integration scale would result in an increase of between 0.54 and 1.61 in the NALT reading scale score change between 1999 and 2000).