what factors caused the increasing currency hedging cost?
TRANSCRIPT

30
What Factors Caused the Increasing Currency Hedging Cost?
Department of Economics, Musashi University
Sanae Ohno
【Abstract】
The rise in currency hedging costs has been highlighted in recent years. Deviations
from covered interest rate parity (CIP) have become evident even though there has been no
symptom indicating the worsened creditworthiness of global financial institutions and the
associated severe liquidity tightness since the European sovereign crisis.
This study conducts a historical decomposition analysis and panel data estimation to
examine the determinants of CIP deviations. The results show that the cost of hedging
exposure to foreign currencies, particularly the US dollar, can be attributed to increased
outward securities investments, which were probably promoted by the different monetary
policy stance across countries. The US dollar hedging costs, specifically those measured
using foreign exchange swap rates with shorter term maturity, have shown a prominently
increasing trend in recent years.
In addition, this study reveals that macroeconomic structural factors contribute to
increasing hedging costs. The significant increase in the price of hedges for yen investors
might be driven by their bias toward US dollar securities investments and their excess hedge
demand for the US dollar owing to their considerable net external assets.
JEL: F31, F65, G12, G15
Keywords: Deviations from covered interest rate parity, foreign exchange swaps, hedging
costs, outward securities investments, historical decompositions, panel data
analysis
Department of Economics, Musashi University

31
1. Introduction
Japanese investors have struggled with ultra-low yields from domestic investments. Moreover,
in recent years, the gap in bond yields between Japanese and US bonds, which is attributable to
different monetary policy stances between the two nations, has widened and thus, promoted their
investment in US dollar bonds. At the same time, however, Japanese investors are faced with the
increasing cost of hedging against US dollar exposure.
Hedging costs have been growing at a faster pace than the differential between the Japanese and
US money market rates, indicating the violation of covered interest rate parity (CIP). This
contradicts the belief that for markets in developed countries, cross-border capital transactions
are no longer restricted, an arbitrage opportunity will spontaneously disappear at all times except
in a crisis period, when counterparty risks become more serious and arbitrage activities are
limited owing to an acute decline in fundraising liquidity.
Since the end of the European sovereign crisis, there has been no prominent symptom
suggesting the worsening creditworthiness of financial institutions in major countries. In addition,
there has been no indication of fundraising liquidity tightening in international financial markets,
particularly when the monetary authorities of major nations have maintained affluent liquidity
provisions. The deviation from CIP, however, has become evident since 2014 and continues to
grow.
For Japanese institutional investors, such as insurance companies and private pension funds,
currency hedging operations account for a major part of their foreign currency exposure.
According to a survey conducted by JP Morgan Chase & Co., foreign exchange hedging is
performed for 90% of foreign bond portfolios in defined benefit accounts of major Japanese
corporate pension funds. While this hedge rate may be reasonable considering large-scale foreign
exchange (FX) standard deviation, the increasing hedging cost undermines the profitability of
foreign bond investments.
This study investigates the determinants of currency hedging costs by emphasizing the effects of
outward securities investments stimulated by the variation in monetary policy stance across
nations and by other macroeconomic structural factors. The analysis adopts two empirical
methodologies. First, a historical decomposition analysis is conducted to detect and trace the key
factors contributing to the upward trend of hedging costs. Deviations from CIP measured by
using the exchange rate for yen to major currencies are decomposed into several structural shocks
to see what factors contributed to the increase in the hedging cost at each point of time. Second,
panel data analyses are conducted to examine the relationship between CIP deviations and
macroeconomic structural factors. Among investors of major nations, those in Japan have
incurred the greatest increase in hedging costs for investments in US dollar-denominated assets.

32
Hanajiri (2000) suggests that macroeconomic structural factors possibly cause deviations from
CIP; accordingly, this study explores if the prominent increase in hedging cost in terms of the
yen/dollar rate is associated with Japanese bias for US dollar-denominated assets and their excess
demand for the US dollar resulting from the high net external assets.
The remainder of this paper is organized as follows. Section 2 discusses the movements in
hedging costs over the past decade and examines the related literature. Section 3 presents the
historical decomposition results for deviations from CIP in terms of the yen to other major
currencies. Section 4 reports the empirical results of the panel data analyses. Section 5
summarizes the major findings.
2. Literature survey
Hedging tools such as foreign exchange swaps and cross-currency basis swaps are often used to
make investments in foreign currency-denominated securities. A yield from a hedged foreign
bond between time t and time t + k is represented as follows:
, (1)
where is a foreign bond yield from time t to time t + k. and are the spot
exchange rate at time t and the forward exchange rate contracted at time t for an exchange at time
t + k. fp is the forward premium of a foreign currency (−fp is a hedging cost).
Forward premium comprises the differential between the domestic and foreign interest rates and
the remaining portion, also known as a basis ( ).
is represented as
(2)
where are the domestic and foreign money market interest rates from time t to time
33
t + k. A negative indicates that domestic investors are at a disadvantaged position and incur a
higher hedging cost than that implied from CIP.
If the basis is zero, CIP holds as follows:
. (3)
CIP rests on certain assumptions. First is the free international capital movements driven by the
deregulation for cross-border capital trades and the development of information technologies.
CIP generally holds for financial markets in advanced economies, which no longer restrict
cross-border capital transactions. The second assumption is that there is no counterparty risk in
financial institutions engaging in arbitrage activities across domestic and foreign money market
and FX markets. In the past financial crisis periods, financial institutions became more skeptical
about counterparties’ creditworthiness and withdrew from activities of market making and
arbitrage, leading to the deviation from CIP. Third, transaction costs and taxes are negligible.
Therefore, under calm market conditions, an implied foreign interest rate derived from the
relationship with CIP slightly diverges from an actual foreign interest rate, reflecting a small
amount of transaction costs and taxes.
Deviations from CIP became evident when the Japanese financial system was rendered unstable
at the end of the 1990s. Hanajiri (1999) analyzes developments in the “Japan premium” during
this period in three markets: the dollar currency market, the yen currency market, and the
dollar/yen swap market. While the relationship “Japan premium in dollar currency market =
Japan premium in yen currency market + Japan premium in dollar/yen swap market” was
confirmed almost always, a divergence in the swap rate from the theoretical value was observed
during the Japanese crisis period. Hanajiri presents two possible reasons for this phenomenon.
First, the price of underlying assets might not fully reflect risk premiums that implicitly exist in
the market. Second, the widening information gap concerning the creditworthiness of Japanese
banks among market participants may have played a role. The empirical results in this study
support these two possibilities.
While the Japan premium disappeared during the recovery of its financial markets, deviations
from CIP re-emerged following the Paribas shock in the summer of 2007 and aggravated during
the Lehman shock in the autumn of 2008. Previous studies analyzing deviations from CIP during
2007–2009 focus on the effects of not only financial institutions’ creditworthiness but also

34
liquidity tightening intensified by mutual suspicion across financial institutions concerning their
creditworthiness. For example, Coffey (2009) reveals that central bank interventions, including
currency arrangements among advanced economies, helped reduce CIP deviations even though
the swap lines program no longer had a significant impact on CIP deviations following the
bankruptcy of the Lehman Brothers. Severo (2012) creates an indicator of systemic liquidity risk
by considering the possibility that while price differentials for similar securities remain negligible
under normal conditions, significant price differences emerge and persist during periods of stress.
He interprets the magnitude of these differences as an indicator of investors’ ability to promptly
reallocate funds and earn positive excess returns while incurring small risks. Further, Severo
examines the impact of liquidity risk factors on equity returns by employing the created systemic
liquidity risk indicator.
CIP deviations continued to intensify even though the European sovereign crisis was almost
resolved and the creditworthiness of global financial institutions significantly improved in 2014.
Figure 1 presents US government bond yields, Japanese investors’ hedging costs for the US
dollar, and the interest rate differential between the United States and Japan. The upward trend
for hedging costs became prominent in 2014 and persisted until recently. Much of the increase in
hedging costs can be attributed to the increasing interest rate differential and the gap between the
hedging cost and interest rate differential continues to widen. For example, in July 2016, the
hedging cost measured using the one-year forward yen–dollar rate was 1.63% as a monthly
average and the interest rate differential estimated by applying a one-year London inter-bank
offered rate (LIBOR) for the yen and US dollar was 1.25%. Only 77% of the hedging cost is
attributed to the interest rate differential, while the rest can be explained by other factors. Further,
yields on hedged US government bonds at the time were less than zero (−0.13%).
Arai, Makabe, Okawara, and Nagago (2016) offer possible explanations for the divergence from
CIP, including (1) increased demand for US dollars resulting from a divergence in monetary
policy between the United States and other advanced countries, (2) global banks’ reduced
appetite for market making and arbitrage due to regulatory reforms, and (3) reduced supply of US
dollars from foreign reserve managers or sovereign wealth funds against the background of
declining commodity prices and emerging currency depreciations. The market liquidity of FX
swap markets might reduce owing to the decrease in global banks’ market-making and arbitrage
activities, which were caused by newly introduced regulations such as the leverage ratio
requirement and Volker rule.
Iida, Kimura, and Sudo (2016) attempt to verify factors producing CIP deviations by focusing
on the differences in monetary authorities’ stance among developed economies and strengthened
financial regulations in recent years. They theoretically explain how monetary policy differences

35
and regulatory reforms are related to CIP deviations and empirically examine whether the data
are in line with their theory. Their findings suggest that monetary policy was a key factor driving
CIP deviations. The authors also conclude that stricter financial regulations limit non-US banks’
excessive search for yield activities resulting from monetary policy divergence, which amplifies
the impact of adverse shocks in the asset management sector.
Suzuki (2016) obtains empirical results suggesting that the yen/dollar swap basis following the
launch of the policy package under Abenomics was affected by a significant increase in Japanese
investors’ outward securities investments stimulated by the divergence in monetary policies. In
addition, she addresses the possibility of “regulation premium” causing CIP deviations. That is,
global banks might become more unwilling to participate in FX swap trades comprising
yen-denominated assets with lower sovereign credit risks because the introduced financial
regulation requires them to maintain more than one buffer for an additional risk burden.
Japanese and other global investors increased investments in US dollar securities in response to
the normalization of the US monetary policy. Increasing hedging costs for the US dollar have
been commonly observed across major currencies, although the rise in terms of the yen/dollar
rate has been the most prominent. Higher hedging costs have become a critical issue for Japanese
investors, who have been struggling with ultra-low yields from domestic investment
opportunities.
In fact, the increase in hedging costs for US dollar exposure has been larger for Japanese
investors than for investors in countries whose policy interest rates have been lower than that by
the Bank of Japan (BoJ). A possible explanation is that CIP deviations are related not to a policy
interest rate differential but to a term spread differential, which is believed to reflect future
monetary authorities’ policy stances. Japan’s term spread has remained at the lowest level since
2014. Iida et al. (2016) show that term spread differentials, calculated as the gap between a
10-year government bond yield and a 3-month overnight index swap (OIS) rate, have greater
influence on the deviation movements for CIP. Another reason is macroeconomic structural
factors cited in Hanajiri (2000). More specifically, Hanajiri highlights that several Japanese
macroeconomic features hinder arbitrages, for example, the biased investment preference toward
US dollar-denominated assets and the lacking variety of channels to raise foreign currencies. The
lower amount of yen-denominated treasury bills may restrict arbitrages across the Japanese and
US money markets and FX swap markets. According to Ando (2012), FX swap trades are a tool
to borrow foreign currencies using raised domestic currencies as collaterals. The insufficient
supply of collaterals is likely to limit arbitrages for excess returns, resulting in CIP deviations.
Given the above discussion, this study analyzes the determinants of CIP deviations by
examining not only fundraising conditions and the gap in credit risk across market participants

36
but also the differences in monetary policy stance across developed countries and those in
macroeconomic structural factors. In next section, historical decomposition analyses are
conducted to investigate factors causing fluctuations in CIP deviations in terms of exchange rates
of the yen to other major currencies. In section 4, panel data models are estimated to confirm if
macroeconomic structural factors have rendered Japanese investors more susceptible to the
increased US dollar hedging costs.
3. Historical decomposition analysis on determinants of CIP deviations
This section conducts a historical decomposition analysis to explore the determinants of
deviations from CIP and detect key factors driving the upward movement in hedging costs for
Japanese investors.
Iida et al. (2016) conduct a panel regression to explore the effects of three determinants on
deviations from CIP: (1) term spread differential indicating the degree of monetary policy
divergence between domestic and foreign countries, (2) default probability of two counterparties,
and (3) market participants’ liquidity needs. They use the Chicago Board Option Exchange
(CBOE) volatility index as a proxy for liquidity needs owing to the precautionary demand
originating from market uncertainty. Unlike Iida et al. (2016), Fukuda and Tanaka (2017) apply
the spread between LIBOR and OIS rate as an indicator of currency-specific money market risks
to capture financial market tightness in each currency and emphasize its effect on deviations from
CIP. This study employs a vector autoregressive (VAR) model that incorporates these
determinants and deviations from CIP to explore their effect on hedging costs and consider the
possibility of reverse reactions such that the increased hedging costs restrain outward securities
investments. The methodology of historical decomposition is employed to detect and trace a key
factor contributing toward the upward trend of hedging costs.
This study adopts a recurve-type structural VAR model with four variables: funding liquidity,
gap in creditworthiness between domestic and foreign banking sectors, term spread differential,
and deviation from CIP. The Japanese yen is used as the benchmark currency to calculate
deviations from CIP. The order in which the shocks spread is based on the assumption that the
indicators of funding liquidity or creditworthiness gap are the most exogenous and CIP deviation
is the least exogenous. The analysis presents the results obtained using two combinations of
variables. The first combination includes the difference in credit default swap (CDS) spreads
between Japanese and foreign banking sectors, gap in money market risk between the yen and a
foreign currency, term spread differential, and deviation from CIP. The second combination
consists of the VIX, difference in CDS spreads, amount of outward portfolio investments from
Japan, and deviation from CIP. VIX and gap in money market risk are used as indicators for

37
fundraising liquidity and difference in CDS spreads is considered a gap in the default risk
between the domestic and foreign banking sectors. Drawing on Suzuki’s (2016) suggestion that
the basis widens when outward portfolio investments expand, the second model incorporates the
amount of outward portfolio investment instead of term spread differential. Investors searching
for yields might respond to the increasing term spread differential that reflects the difference in
monetary policy stance. This study uses the amount of net purchases of foreign securities divided
by the volume of FX swaps traded on the Tokyo market to determine the effects of Japanese
investors’ investment abroad to produce excess demand for FX hedging. A lag order in the VAR
model is set according to the Bayesian information criterion, Akaike information criterion,
Hannan–Quinn information criterion, and General-to-Specific (GTOS) Criterion1. All except
certain variables in this study satisfy stationarity under the augmented Dickey–Fuller (ADF)
test2.
The deviation from CIP is calculated as an annualized deviation from CIP, measured using the
three-month forward premium for the yen against the US dollar, euro, pound, and Australian
dollar and the three-month LIBOR for the yen and counterparty countries’ currencies. A
logarithmic VIX is used as one of the determinants of deviations from CIP. A difference in money
market risk (money market risk for a foreign currency − money market risk for the yen) is
calculated by applying a spread between the three-month LIBOR and three-month OIS rate for
the two currencies. This study employed the CDS spreads available for major banks as a
reference entity3. Further, as an indicator of default risk in a country’s banking sector, this study
substituted a common factor extracted using five-year CDS spreads for banks whose headquarter
is located in the said country4. The term spread differential between a foreign and Japanese term
spread is measured using the spread between the 10-year government bond yield and three-month
OIS rate. Data on outward portfolio investments are downloaded from the International
Transaction in Securities database, available on Japan’s Ministry of Finance website, and data on
FX swap volume are collected from the BoJ website. All other data are from Thomson Reuters’
Datastream. The sample period for this study is from December 2009 to August 2018.
1 The lag order in this study is set on the basis of the majority rule. Estimations were conducted
using an alternative lag order and produced similar results. In addition, similar results were derived using alternate combinations of variables and orderings.
2 Although certain variables such as a difference in credit default swap (CDS) spreads between the Japanese and UK banking sectors, the gaps in the money market risks between the yen and euro and between the yen and pound, and term spread differentials between Japan and the United Kingdom and between Japan and the United States do not satisfy stationarity, this study employed these variables to conduct historical decompositions.
3 Most of the banks are identified as global systemically important banks. 4 This study used the first principal component derived from a principal component analysis
conducted on the spreads of financial institutions’ senior and subordinated CDSs located in a country as a common factor. Using a simple average of these CDS spreads marginally changes the result.

38
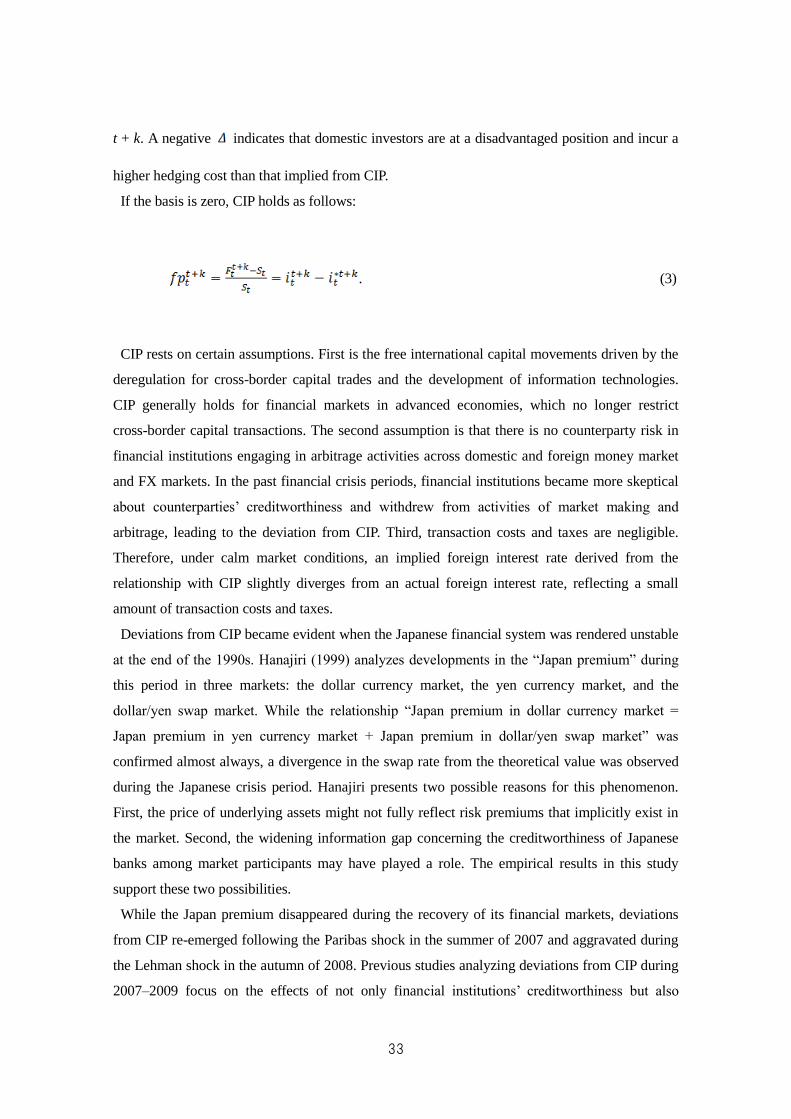
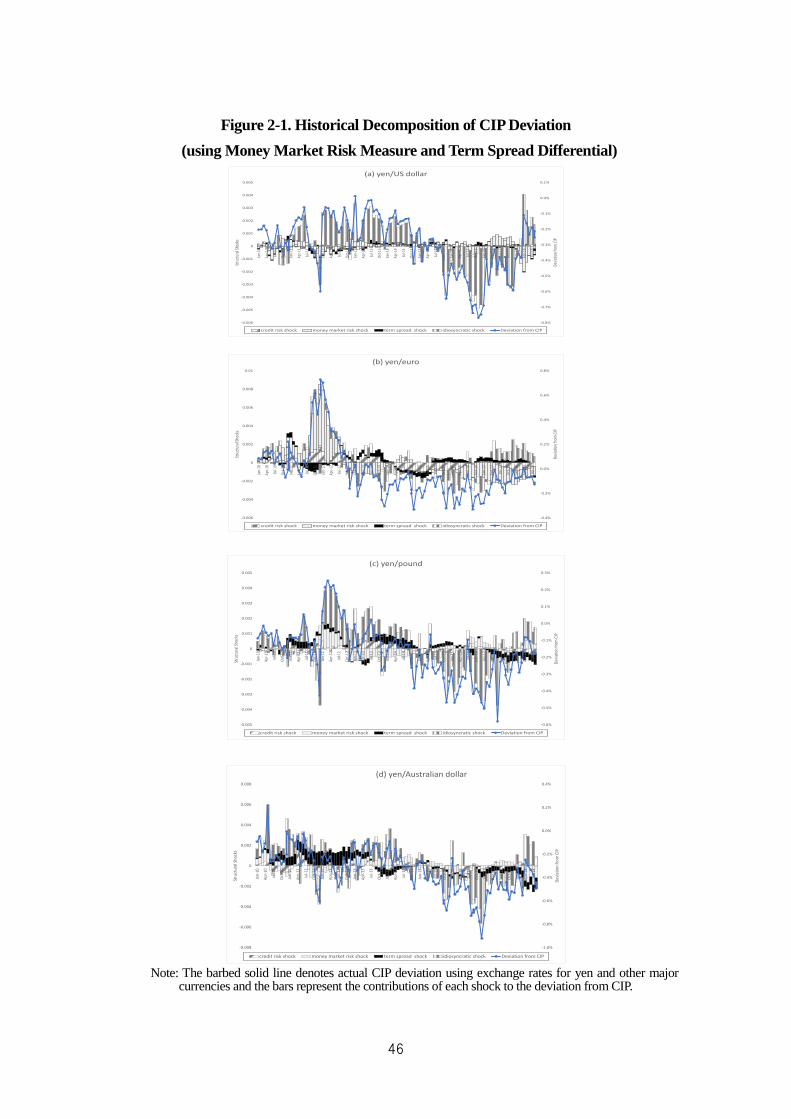
Figure 2-1 presents the historical decomposition results for the deviation from CIP derived from
the model estimated using the first combination of variables. In this case, daily data are used to
estimate the VAR model. The estimated contributions of each shock and the deviation from CIP
are averaged for four weeks. Since 2013, the tendency of a rising basis for the four currencies has
become prominent. Japanese investors’ outward securities investments began expanding in the
second half of 2013, when the term spread differential between Japan and the United States
widened as a result of the clear difference in monetary policy stance between the two nations.
Around this time, the term spread differentials between Japan and other major nations also
widened. In 2016, following the termination of the zero interest-rate policy by the Federal
Reserve Bank (FRB) and the implementation of the negative interest-rate policy by the BoJ,
outward portfolio investments sufficiently expanded. According to the Ministry of Finance,
Japan’s net purchases of foreign long-term debt securities reached 13.2 trillion yen in the first
half of 2016. Figure 2-1 shows that in 2014, when the term spread differential between the euro
area and Japan exceeded 1%, the contribution of the term spread differential to the deviation from
CIP grew, resulting in the disadvantageous increase in Japanese investors’ hedging costs for the
euro. From the second half of 2013 to the first half of 2014 and between the second half of 2016
and the first half of 2017, when the term spread differential between Australia and Japan sharply
increased, the influence of the term spread differential became increasingly significant on the
deviation from CIP in terms of the yen/Australian dollar. As for the pound, the contribution of the
term spread differential became larger in the second half of 2013 and after 2016. A comparison
with the three currencies reveals that the impact of the term spread differential on the US dollar
basis is negligible, although a considerable portion of the investment funds is expected to have
entered the US securities markets. This is partially because US bond yields were likely to decline
as a result of investors’ search for yield. According to the average value for four weeks, in
October 2016, the basis of the US dollar reached 0.77%. The US term spread, however, showed a
downward trend owing to a decline in government bond yield and a gradual increase in the
short-term interest rate reflecting a tightening monetary policy5,6.
Figure 2-2 presents the historical decomposition results for the deviations from CIP obtained
using the model with the second combination of variables including the modified outward
securities investments instead of the term spread differentials. Data on outward securities
investment are available on a monthly basis and thus, the model is estimated using monthly data.
The contribution of outward portfolio investments has increased since 2014. The feature is more
5 Although the effect of the term spread differential slightly increases when the model is estimated
for the period from January 2012 to December 2015, its contribution remains small. 6 Similar results are observed when the gap in the money market risk is replaced with the Chicago
Board Options Exchange’s volatility index (VIX) and an alternative ordering of variables is selected.

39
clearly confirmed for the basis of the US dollar. This may be consistent with the finding in Figure
2-1 that investors searching for yield rushed into US dollar-denominated securities, thus
increasing hedging costs and possibly, narrowing US term spread7.
Figures 2-1 and 2-2 show that the increase in the cost of the euro and pound after 2014 can be
attributed to the relative improvement in European banks’ creditworthiness. Further, Figure 2-1
shows that the contribution of money market risk tends to increase after 2016. This tendency is
commonly observed for the US dollar, euro, and Australian dollar. It is possible that the tighter
liquidity condition resulting from the termination of a non-traditional monetary policy is related
to the higher hedging costs, which warrant further investigation.
In 2011 and 2012, when the European sovereign crisis exacerbated, the basis for the euro
largely decreased because of the tightened fundraising liquidity and the worsened
creditworthiness of European financial institutions. Given the Japanese banks’ superiority in
default risk during the period, Japanese investors experienced advantageous conditions for
investment in euro-denominated securities. Similar tendencies have been observed for the basis
of the pound.
Figure 2-2 also presents the historical decomposition for deviations from CIP calculated using
the one-year yen/dollar forward exchange rate. Compared with the results obtained using the
three-month yen/dollar forward exchange rate, the magnitude of the deviation from CIP between
2015 and 2016 is smaller. In addition, idiosyncratic shocks, which reflect fluctuations in hedging
costs caused by factors whose consideration is beyond the scope of this analysis, have a limited
impact on widening the gap. Intensified regulatory reforms introduced following the global
financial crisis possibly affected dollar funding liquidity. VIX and money market risk, used as
fundraising liquidity indicators in this study, are unlikely to reflect changes in the availability of
the US dollar as a result of global banks’ reduced market-making and arbitrages activities in
recent years.
Banks and institutional investors, including pension funds and life insurance companies, often
use three-month FX swaps to perform rolling hedges for long-term foreign bond investments.
Their preferences for short-term maturity FX swaps can be attributed to lower transaction costs
resulting from the relatively affluent liquidity of markets in which many global banks participate
as market makers and arbitragers. If global banks become more unwilling to burden risks because
of additional restrictions, the FX swap market for shorter-term maturity could tighten. Arai et al.
(2016) mention that the declining transaction volume in the FX swap markets may be related to
7 In addition, the results confirmed that in comparison with the other currencies, the contribution of
the basis for the US dollar to the term spread differential between the United States and Japan is larger in the downward trend.

40
global banks’ reduced appetite for arbitrage trading and market-making activities, which may
amplify the cross-currency basis widening. This should be rigorously examined in future
analyses.
4. Impact of macroeconomic structural factors on hedging costs
In 1999, deviations from CIP were observed even though the Japanese financial crisis was
almost resolved and the economic upturn became evident owing to the IT bubble. Hanajiri (2000)
discusses the deviation from CIP at the end of the 1990s from the viewpoint of macroeconomic
structural factors. Japan was the world’s largest net external creditor and US dollar-denominated
assets accounted for a considerable portion of Japan’s external assets8. Investors in the euro area
have a unified large-scale market for securities denominated in the euro and those in neighboring
European countries can make investments without being subjected to large exchange risks in the
euro area’s markets. This is because the monetary authorities in these nations have been making
efforts to stabilize their currencies against the euro. Therefore, investors can diversify their funds
across markets in Europe without facing large exchange risks and markets for securities
denominated in the US dollar, which report the lowest market liquidity risk. Japanese investors,
on the other hand, must face exchange risks when investing in foreign currency-denominated
securities and thus, are inclined toward investing in US dollar-denominated securities.
Under the above-mentioned macroeconomic conditions, Japanese investors’ cost of hedging the
US dollar is likely to increase by a larger extent. Figure 3 shows deviations from CIP in terms of
the US dollar to other major currencies. Among them, the extent of increase in the cost of
hedging the US dollar is the largest for Japanese investors. During the period of yield gap
expansion, which reflected the normalization of monetary policy more quickly for FRB than any
other monetary authority, global investors increased their investments in US dollar-denominated
securities. For Japanese investors, the hedging cost could increase as a result of the nation’s
macroeconomic structural factors coupled with the widened yield gap led by the BOJ’s
aggressive monetary easing and the end of the FRB’s quantitative easing.
This section presents the empirical results for the panel data analysis on the relationships among
macroeconomic structural factors and the deviation from CIP in terms of the US dollar against
the nine currencies presented in Figure 3. The regression formula is as follows:
(4)
8 According to the International Monetary Fund’s (IMF) coordinated portfolio investment survey
(CPIS) estimates for 2012–2017, the average share of US dollar-denominated securities held in the euro area, Sweden, Switzerland, and Japan are 12%, 7.4%, 34%, and 46.8%, respectively.
41
where DEVCIPi,t denotes deviation from CIP (basis) for an exchange rate between the US dollar
and the i-th country’s currency at time t. DEVCIPi,t is applied with in equation (2). is
calculated using a three-month forward rate for the US dollar against the i-th country’s currency
as well as the three-month LIBOR for the US dollar and the counterparty country’s currency and
is annualized. A decrease in DEVCIP disadvantages investors in the counterparty country as they
must incur an additional increase in the cost of hedging the US dollar-denominated securities.
TSi,t denotes a term spread gap between the United States and the i-th country and a term spread
is calculated using 10-year treasury bond yields and three-month OIS rates for the two countries.
USRi,t is the ratio of the US dollar-denominated securities to the total external securities held by
the i-th country. If the coefficients of in equation (9) are estimated as negative, then a
country with a greater USR is likely to incur a higher dollar hedging cost, particularly when the
term spread gap widens and investments in the US dollar-denominated securities increase.
Considering the limited availability of data on the ratio of US dollar securities, those for
investments in the US securities markets to total external securities (GEOUSR) are used instead
of USR.
CDSBANKi,t signifies the credit risk gap in the banking sectors between the United States and
the i-th country. Coefficient is expected to be negative. This study employs sovereign CDS
spread differentials (CDSSOV) considering Suzuki’s (2016) suggestion that the deviation from
CIP increases because global banks have become more reluctant to incur risks associated with
investments in a country with a lower sovereign credit rating under the new regulation. Finally,
FXVOLi,t is logarithmic three-month implied volatility in the exchange rate for the US dollar
relative to the i-th country’s currency. Coefficient is expected to be negative because
increased volatility infers a higher risk premium. In addition, a logarithmic VIX is used as an
alternative explanatory variable.
If a country holds an amount of US dollar-denominated liabilities to almost match an amount of
US dollar-denominated assets, excess demand for the US dollar may decrease. However, for a
country such as Japan, whose net external assets are enormous, FX hedging accompanied by
investments in US dollar assets may largely exceed FX hedging derived from US dollar
fundraising. Therefore, this study uses the following formula:
42
(5)
where ALFi,t is the i-th country’s ratio of total external assets to total external liabilities at time t.
By introducing ALF, this study examines if a country’s bias toward US dollar investments and an
unbalanced hedging demand structure resulting from huge net external assets are susceptible to
higher hedging costs for US dollar exposure.
It is expected that investments in US bonds increase with a rise in TS. Next, analyses are
conducted using the first-order difference between outstanding outward securities investments
(DOSI) (or outstanding outward securities investments relative to GDP (OSIGDP)) instead of TS.
Yearly data are obtained for Japan, Switzerland, Sweden, euro area, the United Kingdom,
Australia, Canada, New Zealand, and Norway. The sample period is 2009−2016. Data for
exchange rates, interest rates, government bond yields, CDS spreads, FX volatilities, and VIX are
downloaded from Thomson Reuters’ Datastream. Information for securities investments is
collected from International Monetary Fund’s (IMF) Balance of Payments (BOP) Statistics. USR,
GEOUSR, and ALF are calculated using data from IMF’s coordinated portfolio investment
survey (CPIS). This study adopts the least squares dummy variable (LSDV) method to estimate
the cross-sectional, fixed-effects model. t-value is calculated using a covariance matrix that
allows for the cross-sectional heteroscedasticity of residual terms.
Table 1 presents the estimation results. The coefficients of USR and GEOUSR are estimated to
be negative, implying that investors in a country with a biased preference for US
dollar-denominated assets are likely to face higher hedging costs. The coefficients for ALF are
also negative but not statistically significant and the cross-term for USR and ALF and that for
GEOUSR and ALF report a negative sign. In other words, the increase in hedging costs is
intensified in a country where the demand for hedging along with outward investments exceeds
that for hedging accompanied by fundraising abroad.
The cross-terms for TS and USR are not statistically significant. Table 2 presents the analyses
using DOSI and OSIGDP instead of TS. The combination of USR (or GEOUSR) and ALF with
DOSI (or OSIGDP) shows a negative sign. This suggests that for a country with a biased
preference toward US dollar assets coupled with excess demand for hedging against foreign
currency exposures as a result of considerable net external assets, hedging costs will significantly
increase when outward securities investments expand.
Tables 1 and 2 report that hedging costs increase disadvantageously for financial institutions

43
with aggravated creditworthiness. The coefficients of CDSSOV are also estimated as negative,
which is consistent with Suzuki’s (2016) suggestion that a country with a lower credit rating is
likely to make an additional risk premium payment owing to stricter financial regulations.
The coefficients of FXVOL and VIX are negative, which is consistent with our expectations.
This indicates that, under stressful conditions, flight to liquidity (or flight to the US dollar) is
observed and investors outside of the United States incur higher hedging costs. This tendency is
confirmed for currencies of, for example, Australia, which was considered to be less severely
affected by the financial crises during the analysis period.
5. Conclusions
This study reached the following salient conclusions. First, the cost of hedging major currencies,
particularly the US dollar, increased because of a rise in outward securities investments, which
was possibly promoted by different monetary policy stances across countries. The cost of
hedging the US dollar, specifically those measured using FX swap rates with shorter-term
maturity, has reported a prominently increasing trend. This phenomenon may be largely
attributed to factors such as the tightened market liquidity of FX swaps caused by newly imposed
financial regulations following the global financial crisis, which are beyond the scope of this
study. During the European sovereign crisis, the cost of hedging the euro decreased, reflecting the
worsened creditworthiness of European financial institutions.
Second, the results of the panel data analyses reveal that macroeconomic structural factors are
related to an increase in hedging costs. Japanese investors tend to prefer investments in US
dollar-denominated securities. Their biased preference coupled with the large amount of net
external assets might produce excess demand for hedging against the US dollar. As a result of
their concentrated securities investments in the United States, which has already begun reporting
signs of monetary policy normalization, Japanese investors might face more expensive hedging
costs. This study, however, did not reveal the effects of a term spread gap on the deviation from
CIP. This is because the term spread gap shrunk in response to the concentrated investments
made in US bonds by investors who searched for yield, which is left for future research.
To improve the profitability of their portfolio investments, Japanese investors may be asked to
incur a higher risk burden. Alternatively, they could choose currencies other than the US dollar
since the hedging cost for currencies of countries with a negative interest-rate policy are likely to
be almost zero or negative. While the validity of investments in securities outside of the United
States should be rigorously examined, the diversification across currencies can contribute to a
decrease in dollar-hedging costs.

44
【Reference】
M. Ando, “Recent Developments in U.S. Dollar Funding Costs through FX Swaps,” Bank of Japan
Review, No.12-E-3, 2012.
F. Arai, Y. Makabe, Y. Okawara and T. Nagago, “Recent Trends in Cross-currency Basis,” Bank of
Japan Review, No.16-E-7, 2016.
N. Coffey, W. B. Hrung and Asani Sarkar, “Capital Constraints, Counterparty Risk, and Deviations
from Covered Interest Rate Parity,” Federal Reserve Bank of New York Staff Reports, No.393,
2009.
S. Fukuda and M. Tanaka, “Monetary Policy and Covered Interest Parity in the Post GFC Period:
Evidence from the Australian Dollar and the NZ Dollar,” Journal of International Money and
Finance, Vol.74, pp.301-317, 2017.
T. Hanajiri, “Three Japan Premiums in Autumn 1997 and Autumn 1998 – Why did Premiums Differ
between Markets?” Bank of Japan, Financial Markets Department Working Paper Series, No.
Financial Markets Department, 99-E-1, 1999.
T. Hanajiri, “Fund Raising Premium for Foreign Currencies: Exploring the Relationship with
Macroeconomic Structures – Comparisons among Japan, US, UK and Germany” Bank of Japan,
Financial Markets Department Working Paper Series, No. 2000-J-5, 2000. (in Japanese)
T. Iida, T. Kimura and N. Sudo, “Regulatory Reforms and the Dollar Funding of Global Banks:
Evidence from the Impact of Monetary Policy Divergence,” Bank of Japan Working Paper
Series, No.16-E-14, 2016.
T. Severo, “Measuring Systemic Liquidity Risk and the Cost of Liquidity Insurance,” IMF Working
Paper, WP/12/194, 2012.
Y. Suzuki, “Japan Premium in 2014-2015: Examining the Structural Fragility of Dollar Funding via
FX Swaps,” Kokusai Keizai, Vol.67, pp.123-152, 2016 (in Japanese).

45
Figure 1. US Government Bond Yield and Hedging Cost
0%
1%
2%
3%
4%
5%
Jan
-07
May
-07
Sep
-07
Jan
-08
May
-08
Sep
-08
Jan
-09
May
-09
Sep
-09
Jan
-10
May
-10
Sep
-10
Jan
-11
May
-11
Sep
-11
Jan
-12
May
-12
Sep
-12
Jan
-13
May
-13
Sep
-13
Jan
-14
May
-14
Sep
-14
Jan
-15
May
-15
Sep
-15
Jan
-16
May
-16
Sep
-16
Jan
-17
May
-17
Hedging Cost Interest Rate Differential US Government Bond Yield (10 YR)
Note: The figure reflects the author’s calculations using data from Thomson Reuters’ Datastream. Hedging costs are estimated using one-year forward exchange rates for the yen/US dollar. Interest rate differentials are measured by applying one-year LIBOR for the yen and US dollar.
46
Figure 2-1. Historical Decomposition of CIP Deviation
(using Money Market Risk Measure and Term Spread Differential)
-0.8%
-0.7%
-0.6%
-0.5%
-0.4%
-0.3%
-0.2%
-0.1%
0.0%
0.1%
-0.006
-0.005
-0.004
-0.003
-0.002
-0.001
0
0.001
0.002
0.003
0.004
0.005
Jan-
10
Apr-
10
Jul-1
0
Oct
-10
Jan-
11
Apr-
11
Jul-1
1
Oct
-11
Jan-
12
Apr-
12
Jul-1
2
Oct
-12
Jan-
13
Apr-
13
Jul-1
3
Oct
-13
Jan-
14
Apr-
14
Jul-1
4
Oct
-14
Jan-
15
Apr-
15
Jul-1
5
Oct
-15
Jan-
16
Apr-
16
Jul-1
6
Oct
-16
Jan-
17
Apr-
17
Jul-1
7
Oct
-17
Jan-
18
Apr-
18
Jul-1
8
Devi
atio
n fr
om C
IP
Stru
ctur
al S
hock
s
(a) yen/US dollar
credit risk shock money market risk shock term spread shock idiosyncratic shock Deviation from CIP
-0.4%
-0.2%
0.0%
0.2%
0.4%
0.6%
0.8%
-0.006
-0.004
-0.002
0
0.002
0.004
0.006
0.008
0.01
Jan-
10
Apr-
10
Jul-1
0
Oct
-10
Jan-
11
Apr-
11
Jul-1
1
Oct
-11
Jan-
12
Apr-
12
Jul-1
2
Oct
-12
Jan-
13
Apr-
13
Jul-1
3
Oct
-13
Jan-
14
Apr-
14
Jul-1
4
Oct
-14
Jan-
15
Apr-
15
Jul-1
5
Oct
-15
Jan-
16
Apr-
16
Jul-1
6
Oct
-16
Jan-
17
Apr-
17
Jul-1
7
Oct
-17
Jan-
18
Apr-
18
Jul-1
8
Devi
atio
n fr
om C
IP
Stru
ctur
al S
hock
s
(b) yen/euro
credit risk shock money market risk shock term spread shock idiosyncratic shock Deviation from CIP
-0.6%
-0.5%
-0.4%
-0.3%
-0.2%
-0.1%
0.0%
0.1%
0.2%
0.3%
-0.005
-0.004
-0.003
-0.002
-0.001
0
0.001
0.002
0.003
0.004
0.005
Jan-
10
Apr-
10
Jul-1
0
Oct
-10
Jan-
11
Apr-
11
Jul-1
1
Oct
-11
Jan-
12
Apr-
12
Jul-1
2
Oct
-12
Jan-
13
Apr-
13
Jul-1
3
Oct
-13
Jan-
14
Apr-
14
Jul-1
4
Oct
-14
Jan-
15
Apr-
15
Jul-1
5
Oct
-15
Jan-
16
Apr-
16
Jul-1
6
Oct
-16
Jan-
17
Apr-
17
Jul-1
7
Oct
-17
Jan-
18
Apr-
18
Jul-1
8
Dev
iatio
n fr
om C
IP
Stru
ctur
al S
hock
s
(c) yen/pound
credit risk shock money market risk shock term spread shock idiosyncratic shock Deviation from CIP
-1.0%
-0.8%
-0.6%
-0.4%
-0.2%
0.0%
0.2%
0.4%
-0.008
-0.006
-0.004
-0.002
0
0.002
0.004
0.006
0.008
Jan-
10
Apr
-10
Jul-1
0
Oct
-10
Jan-
11
Apr
-11
Jul-1
1
Oct
-11
Jan-
12
Apr
-12
Jul-1
2
Oct
-12
Jan-
13
Apr
-13
Jul-1
3
Oct
-13
Jan-
14
Apr
-14
Jul-1
4
Oct
-14
Jan-
15
Apr
-15
Jul-1
5
Oct
-15
Jan-
16
Apr
-16
Jul-1
6
Oct
-16
Jan-
17
Apr
-17
Jul-1
7
Oct
-17
Jan-
18
Apr
-18
Jul-1
8
Dev
iatio
n fr
om C
IP
Stru
ctur
al S
hock
s
(d) yen/Australian dollar
credit risk shock money market risk shock term spread shock idiosyncratic shock Deviation from CIP Note: The barbed solid line denotes actual CIP deviation using exchange rates for yen and other major
currencies and the bars represent the contributions of each shock to the deviation from CIP.

47
Figure 2- 2. Historical Decomposition of CIP Deviation
(using VIX and Outward Portfolio Investments)
-0.9%
-0.8%
-0.7%
-0.6%
-0.5%
-0.4%
-0.3%
-0.2%
-0.1%
0.0%
-0.006
-0.005
-0.004
-0.003
-0.002
-0.001
0
0.001
0.002
0.003
Dev
iati
on
fro
m C
IP
Stru
ctu
ral S
ho
cks
(a) yen/dollar(three-month)
VIX shock Credit risk shock PI demand shock Idiosyncratic shock Deviation from CIP
-0.4%
-0.2%
0.0%
0.2%
0.4%
0.6%
0.8%
-0.006
-0.004
-0.002
0
0.002
0.004
0.006
0.008
Jan-
11
Apr-
11
Jul-1
1
Oct
-11
Jan-
12
Apr-
12
Jul-1
2
Oct
-12
Jan-
13
Apr-
13
Jul-1
3
Oct
-13
Jan-
14
Apr-
14
Jul-1
4
Oct
-14
Jan-
15
Apr-
15
Jul-1
5
Oct
-15
Jan-
16
Apr-
16
Jul-1
6
Oct
-16 Dev
iati
on fr
om C
IP
Stru
ctur
al S
hock
s
(b) yen/euro(three-month)
VIX shock Credit risk shock PI demand shock Idiosyncratic shock Deviation from CIP
-0.6%
-0.5%
-0.4%
-0.3%
-0.2%
-0.1%
0.0%
0.1%
0.2%
0.3%
-0.005
-0.004
-0.003
-0.002
-0.001
0
0.001
0.002
0.003
0.004
0.005
0.006
Jan-
11
Apr-
11
Jul-1
1
Oct
-11
Jan-
12
Apr-
12
Jul-1
2
Oct
-12
Jan-
13
Apr-
13
Jul-1
3
Oct
-13
Jan-
14
Apr-
14
Jul-1
4
Oct
-14
Jan-
15
Apr-
15
Jul-1
5
Oct
-15
Jan-
16
Apr-
16
Jul-1
6
Oct
-16
Dev
iatio
n fr
om C
IP
Stru
ctur
al S
hock
s
(c) yen/pound(three-month)
VIX shock Credit risk shock PI demand shock Idiosyncratic shock Deviation from CIP
-0.6%
-0.5%
-0.4%
-0.3%
-0.2%
-0.1%
0.0%
-0.004
-0.003
-0.002
-0.001
0
0.001
0.002
0.003
Jan-
11
Apr
-11
Jul-1
1
Oct
-11
Jan-
12
Apr
-12
Jul-1
2
Oct
-12
Jan-
13
Apr
-13
Jul-1
3
Oct
-13
Jan-
14
Apr
-14
Jul-1
4
Oct
-14
Jan-
15
Apr
-15
Jul-1
5
Oct
-15
Jan-
16
Apr
-16
Jul-1
6
Oct
-16
Dev
iati
on fr
om C
IP
Stru
ctur
al S
hock
s
(d) yen/dollar(one-year)
VIX shock Credit risk shock PI demand shock Idiosyncratic shock Deviation from CIP
Note: The solid barbed line represents actual CIP deviations using exchange rates for yen and other major currencies and the bars denote contributions of each shock to the deviation from CIP.

48
Figure 3. Deviation from CIP Calculated using Exchange Rate of the US Dollar to
Other Major Currencies
-1.0%
-0.8%
-0.6%
-0.4%
-0.2%
0.0%
0.2%
YEN EUR GBP CHF SEK AUD CAD NZD NOK
YEN
CHF
NZDGBP AUD
SEK
EUR
CAD
NOK
Notes: The figure presents the author’s calculations using data from Thomson Reuters’ Datastream. Deviation
from CIP measured using the three-month forward exchange rate for the US dollar against another major currency and the three-month money market rate for the US and a counterparty country are annualized. Negative (positive) values mean that the hedging cost for investments in the United States (a counterparty country) increases, thus exceeding the level of interest rate differential between the two nations.
Table 1. Relationship between Deviations from CIP and Macroeconomic Structural Factors
Observations 47 31 51 23 47 31 23 47 47 31 23 31Const. 0.011 *** 0.012 *** 0.005 ** 0.013 *** 0.013 ** 0.015 *** 0.017 * 0.013 ** 0.008 *** 0.010 *** 0.008 * 0.008 **GEOUSR -0.023 ** -0.004 -0.025 ** -0.026 **USR -0.019 *** -0.028 * -0.022 *** -0.037 *ALF -0.001 -0.002 -0.002 -0.001GEOUSR*ALF -0.012 **USR*ALF -0.011 ** -0.009 -0.011 **TS*GEOUSRTS*USRTS*GEOUSR*ALFTS*USR*ALFCDSBANK -0.021 -0.067 * -0.022 -0.070 * -0.038 -0.054 -0.088 ** -0.094 *CDSSOV -0.109 -0.137 -0.148 -0.121 *FXVOL -0.003 *** -0.004 *** -0.003 *** -0.004 *** -0.003 *** -0.004 *** -0.004 *** -0.003 *** -0.004 *** -0.003 ***VIX -0.003 *** -0.002 **adj R2 0.496 0.445 0.503 0.425 0.497 0.463 0.449 0.386 0.494 0.445 0.322 0.229
Observations 47 47 23 31 51 47 31 23 47 31Const. 0.012 *** 0.012 *** 0.018 *** 0.013 *** 0.005 *** 0.011 *** 0.012 *** 0.013 *** 0.008 *** 0.010 ***GEOUSR -0.018 ** -0.016 * -0.004 -0.023 **USR -0.036 *** -0.013 ** -0.020 *** -0.030 *ALFGEOUSR*ALF -0.008 * -0.008 * -0.012 **USR*ALF -0.009 * -0.007 * -0.011 **TS*GEOUSR -0.005 0.050TS*USR 0.187 0.153TS*GEOUSR*ALF 0.047TS*USR*ALF 0.011CDSBANK -0.041 -0.024 -0.071 * -0.020 -0.063 * -0.054 -0.089 **CDSSOV -0.172 -0.110 -0.114FXVOL -0.003 *** -0.004 *** -0.003 *** -0.003 *** -0.004 *** -0.004 *** -0.003 *** -0.004 ***VIX -0.003 *** -0.003 ***adj R2 0.428 0.537 0.398 0.518 0.490 0.485 0.452 0.410 0.483 0.422***, ** and * denote significance at the 1%, 5% and 10% levels, respectively.

49
Table 2. Relationship between Deviations from CIP and Macroeconomic Structural Factors.
Observations 47 51 47 31 31 31 31 31 31 47 47 47 47
Const. 0.011 *** 0.005 ** 0.011 ** 0.013 *** 0.012 *** 0.012 *** 0.010 *** 0.007 ** 0.007 *** 0.007 *** 0.006 *** 0.008 *** 0.008 ***GEOUSR -0.022 *** -0.004 -0.021 *
USR -0.018 *** -0.016 **
GEOUSR*ALF -0.008 * -0.008 * -0.010 * -0.010 **USR*ALF -0.012 ** -0.009 * -0.008 * -0.008 *
GEOUSR*DOSI -3.6E-09 -2.3E-09
GEOUSR*OSIGDP -13658.6
USR*DOSI -3.5E-09
USR*OSIGDP -24232.1
GEOUSR*ALF*DOSI -1.2E-08 ** -5.0E-09
GEOUSR*ALF*OSIGDP -63891 ** -29629 **USR*ALF*DOSI -4.4E-09 ** -8.6E-09 **
USR*ALF*OSIGDP -20441.4 * -49294 **
DOSI 2.27E-09 * 2.72E-09 *
OSIGDP 20768 14018
CDSBANK -0.036 -0.033 -0.075 * -0.075 ** -0.098 *** -0.089 ** -0.033 -0.038 -0.039 -0.021 -0.074 -0.068
CDSSOV -0.097
FXVOL -0.003 *** -0.003 *** -0.003 *** -0.005 *** -0.004 *** -0.004 *** -0.004 *** -0.003 *** -0.003 *** -0.003 *** -0.002 *** -0.003 *** -0.003 ***adj R2 0.497 0.495 0.491 0.437 0.449 0.498 0.496 0.551 0.542 0.569 0.551 0.513 0.552***, ** and * denote significance at the 1%, 5% and 10% levels, respectively.