what factors drive investment flows?
TRANSCRIPT
?
What Factors Drive Investment Flows?
Executive Summary
We study historical investor preferences for mutual funds as expressed in monthly fund flow data. We
identify significant, persistent patterns in fund flows as they relate to fund-specific and firm-level
characteristics. Far from just relying on past performance as an indicator, we uncover that investors have
expressed strong preferences for types of fund structure, level of fees, higher firm quality, greater
management continuity, and specific kinds of style tilts. This paper’s scope is broad: covering the global
fund universe and three major asset classes: equity, fixed income, and balanced. Our findings and
conclusions will be of interest to anyone looking to understand how investors make investment decisions.
• U.S. investors strongly prefer low-cost funds, but these preferences are virtually nonexistent
outside of the United States. (Page 5)
• Indexed equity funds receive higher flows at the expense of active equity funds. The trend
reverses for fixed-income and balanced funds, as active strategies are favored. (Page 7)
• Investors show a strong preference for funds with favorable ratings from Morningstar. (Page
10)
• Funds with style tilts in certain markets get higher flows. (Page 12)
• In the balanced asset class, fund-of-funds structures are strongly preferred in the U.S., but the
trend is not as evident globally. (Page 8)
• Socially responsible funds reap large inflows, with the strongest effect present in the European
and Cross-Border marketplaces. (Page 9)
• Investors value greater continuity of management. The loss of a long-tenured manager has
significantly negative consequences for flows into the fund. (Page 13)
• In the Cross-Border marketplace, larger asset-management firms have distinct advantages in
garnering fund flows due to their different, bank-dominated distribution model. (Page 16)
• Investors seek out funds from higher-quality firms. (Page 16)
• The long-run consistency of preferences for fund-specific factors is remarkable. (Page 17)
Morningstar Research November 2015 Contents
2 Introduction 3 Results 5 Key Take-Aways
18 Conclusion 19 Data 25 Model Methodology 27 References 28 Data Tables Lee Davidson, CFA Senior Quantitative Analyst Global Quantitative Research +1 312 244-7541 [email protected] Timothy Strauts, CFP Senior Analyst Markets Research +1 312 384-3994 [email protected]
Page 2 of 33
Morningstar Research | November 2015
Introduction
Mutual funds are one of the primary investment products for investors. As of October 2015, Morningstar
tracks $28.8 trillion in mutual fund assets globally. There are over 74,000 mutual funds available, and
how investors make the decision about where to invest their money has broad implications for the asset
management industry and for individual fund performance. Trends in investment flows are closely
watched by the asset management industry. They want to know what categories are attracting the most
assets, which funds are seeing the biggest inflows or outflows, and what broad trends they can
capitalize on when creating new funds. Little research has been done to date, however, to rigorously
analyze investor preferences for specific fund characteristics. This paper focuses on identifying and
measuring the factors that drive investor fund selection within an asset class.
Since a study like this can be performed in a number of ways, a brief elaboration of how we empirically
investigated this topic would likely be useful. Consider a world with a single asset–a mutual fund–with a
set of characteristics (alpha, net expense ratio, market beta, turnover, and so on) and a fixed amount of
invested capital. In this world, all investors place all their money with the single fund because that is the
only option. But now, consider the introduction of a new fund with all the same characteristics except
that its fees are lower. What would happen in such a world? The answer to this question reveals
investor preferences about fees. If we observe that flows are suddenly positive for the new fund, then
flows must be negative for the old fund. Our conclusion would be that investors prefer to invest with
funds that have lower fees, all else equal. In a very real way, therefore, this paper is about the
reallocation of resources across the mutual fund industry attributable to observable fund data.
Although the above example is simple and stylistic, the intuition can be extended to the results from our
analysis. We seek to identify and measure the factors driving flows or the reallocation of resources
between funds. To this end, we employed rolling, monthly cross-sectional regressions where a new
model is estimated for each month. This method enabled us to both control for many factors and
estimate each factor’s importance to determining flows each month. In order to interpret these results, it
is important to recognize that all continuous variables are z-scored or converted in standard deviation
units. By doing so, we place all variables onto the same scale so that the estimated effects can be
directly compared. For a full explanation of our model, please read the methodology section in the
Appendix.
Our study will likely be of interest to asset management firms that can use these insights to better
understand why one fund gets larger flows than another. We looked at 26 fund-specific factors, including
data on past performance, fees, strategy type, manager characteristics, and firm quality. For
organizational purposes, we placed the factors into categories corresponding to the five pillars
methodology used in Morningstar’s fund research process–Performance, Price, Process, People, and
Parent.
Asset management firms are only required to disclose nets assets and not investment flows. So,
Morningstar calculates estimated flows by looking at the change month-to-month in net assets that
cannot be explained by the fund’s return. The calculation includes an adjustment for reinvested dividends,

Page 3 of 33
Morningstar Research | November 2015
which can have a large impact on funds where dividend payouts are large and frequent. For a full
explanation, please consult the Morningstar Cash Flow Methodology document.
For purposes of this paper, we chose to focus strictly on the fund flows in the global open-end mutual
fund universe and thereby will not include flows into exchange-traded funds. ETF flows can be difficult to
observe clearly; because the investors base is not just long-term investors but a collection of groups that
use ETFs as a short-term trading vehicle. The largest ETFs have an average holding period of only a few
weeks. As such, we felt it prudent to exclude ETFs to focus on long-term investor decision making
process. Furthermore, restricting our universe to only mutual funds allows us to more closely analyze
how investors choose between actively managed funds. Unlike ETFs, mutual funds have meaningful
variation in fund-level characteristics (for example, manager tenure, alpha, or turnover) that could
potentially be used in an investor’s decision-making process. Of course, within the mutual fund universe,
there are a minority of index funds. We decided to include these in our sample since they trade similarly,
are offered through similar channels, and can be explicitly controlled for in our model. We leave open the
possibility for future studies that straightforwardly address the question of how investors decide
between active and passive strategies regardless of investment vehicle.
Our study uses Morningstar’s global, survivorship-bias-free mutual fund database. In the U.S., our
sample begins in mid-2003, but due to data availability, the ex-U.S. sample does not begin until 2008.
Our sample ends in December 2014. The results are estimated globally as well as separately by region,
which allows additional insight into how investors in different parts of the world make decisions. The
regions are broken down geographically except the Cross-Border region, which comprises UCITS funds
that are domiciled in locales like Luxembourg and Ireland and are distributed in many markets, primarily
in Europe, but also in Asia, Latin America, and the Middle East. Funds are grouped into one of three
broad asset classes–equity, fixed-income, and balanced–because we observed that investor preferences
can vary quite strongly depending on the asset classes. We excluded commodity, alternative, and
leveraged funds from the study because of a small sample size.
Thus far, our research does not address several questions related to flows. We do not explore how
investors allocate between asset classes. We do not fully address the question of how investors decide
between active and passive products because we did not include ETFs in our sample. Our study provides
no commentary on how flows might impact the future performance of mutual funds. Indeed, we remain
agnostic as to what these findings mean for investors aside from being purely informative about their
past behavior. All of these are avenues ripe for further research, however.
Results
In order to introduce our results and how they should be interpreted, we first present a chart that shows
the estimated contributions of each factor for U.S.-domiciled equity funds during the period mid-2003 to
2014. As explained above, Morningstar calculates estimated flows by looking at the change in net
assets from month to month that cannot be explained by the fund’s return. For our study, we converted
all flows into USD. Then, we computed the organic growth rate–net estimated flows divided by
beginning fund assets. Our results are displayed by showcasing the typical change in the organic growth
rate for a fund given a change in one of the underlying variables holding all other changes constant. All
Page 4 of 33
Morningstar Research | November 2015
coefficients and estimated effects should be interpreted, therefore, as additions to the organic growth
rate of a fund. For simplicity, we may refer to this throughout the paper as an increase or decrease in
flows.
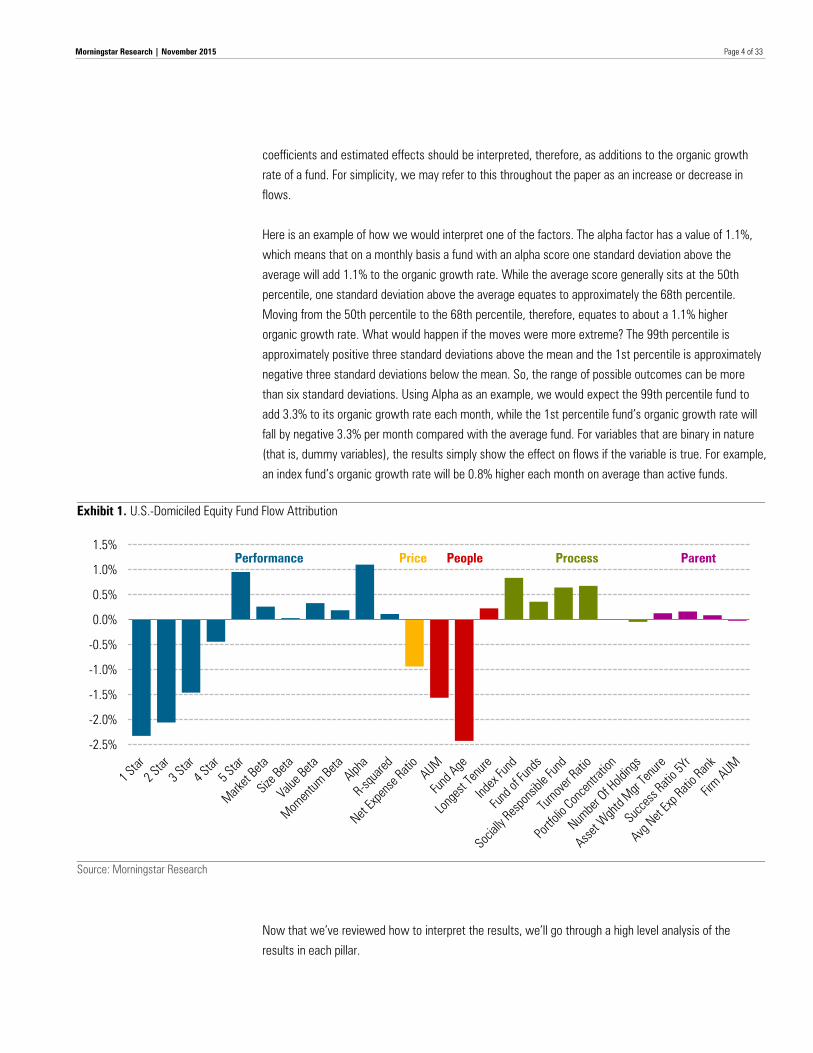
Here is an example of how we would interpret one of the factors. The alpha factor has a value of 1.1%,
which means that on a monthly basis a fund with an alpha score one standard deviation above the
average will add 1.1% to the organic growth rate. While the average score generally sits at the 50th
percentile, one standard deviation above the average equates to approximately the 68th percentile.
Moving from the 50th percentile to the 68th percentile, therefore, equates to about a 1.1% higher
organic growth rate. What would happen if the moves were more extreme? The 99th percentile is
approximately positive three standard deviations above the mean and the 1st percentile is approximately
negative three standard deviations below the mean. So, the range of possible outcomes can be more
than six standard deviations. Using Alpha as an example, we would expect the 99th percentile fund to
add 3.3% to its organic growth rate each month, while the 1st percentile fund’s organic growth rate will
fall by negative 3.3% per month compared with the average fund. For variables that are binary in nature
(that is, dummy variables), the results simply show the effect on flows if the variable is true. For example,
an index fund’s organic growth rate will be 0.8% higher each month on average than active funds.
Exhibit 1. U.S.-Domiciled Equity Fund Flow Attribution
Source: Morningstar Research
Now that we’ve reviewed how to interpret the results, we’ll go through a high level analysis of the
results in each pillar.
-2.5%
-2.0%
-1.5%
-1.0%
-0.5%
0.0%
0.5%
1.0%
1.5%Performance Price People Process Parent

Page 5 of 33
Morningstar Research | November 2015
Overall, you’ll notice that the performance variables have a very big impact on future fund flows. Having a
Morningstar Rating of 5 stars gets a fund almost 1% higher flows per month, while being rated 1 star
correlates with negative 2.3% flows each month. We also observe a slight preference for funds that tilt
toward value, momentum, and market exposure.
Morningstar has been recommending for many years that one of the best ways to get better
performance out of your mutual funds is to choose funds with low fees. It seems that the message has
gotten to U.S. investors because a fund with fees one standard deviation below average will get 0.9%
flows per month.
You’ll notice that assets under management and fund age are strongly negative. This is because we are
showing results in percentage terms. A fund with only $50 million in assets can grow much faster in
percentage terms than a fund with $1 billion in assets. Helping to counteract the strong bias for new
funds is a slightly positive relationship for funds with long-tenured managers.
There is a strong preference for index funds, which makes sense because this study starts in 2003 –
right when index investing took off in the United States. While still a relatively small category of funds,
investors give socially responsible funds higher flows. Finally, high-turnover funds get higher flows than
low-turnover funds. This result is surprising and only present in the U.S. data. Globally, there is a slightly
negative bias for high turnover.
The Parent Pillar factors don’t show any strong relationships. This means that U.S. investors choose
equity funds individually regardless of fund family.
The full results of our global study are in the tables at the end of the paper. In the next section, we
review what we think are the biggest take-aways from the full, global set of data.
Key Take-Aways
Low Fees Matter More in the U.S. Than Globally. In the past decade, fees have been declining as
investors have expressed preferences for passive investments with lower cost profiles and firms have
competed with each other to cut costs in response. Journalists and industry-watchers have even gone
so far as to label this a ”price war.” A recent report by Morningstar indicates that the asset-weighted
expense ratios across all U.S. funds have declined to 0.64% in 2014 compared with 0.76% in 2009.
Coinciding with this fee decline, the report finds that flows into passive investments far outstrip their
active counterparts. Even within U.S. active funds, Morningstar found that the funds in the cheapest
quintile received approximately 95% of the estimated net new flows during that past decade. While this
report focused on the U.S., few studies have looked at the global preferences of investors with respect
to costs. Even fewer studies have sought to control for the myriad differences across funds and truly
isolate the effect of cost on flows.
In our study, we control for a host of differences–style tilts, fund structure, manager profile, past
performance, and parent company quality–and find that investor preferences for low-cost funds are very
Page 6 of 33
Morningstar Research | November 2015
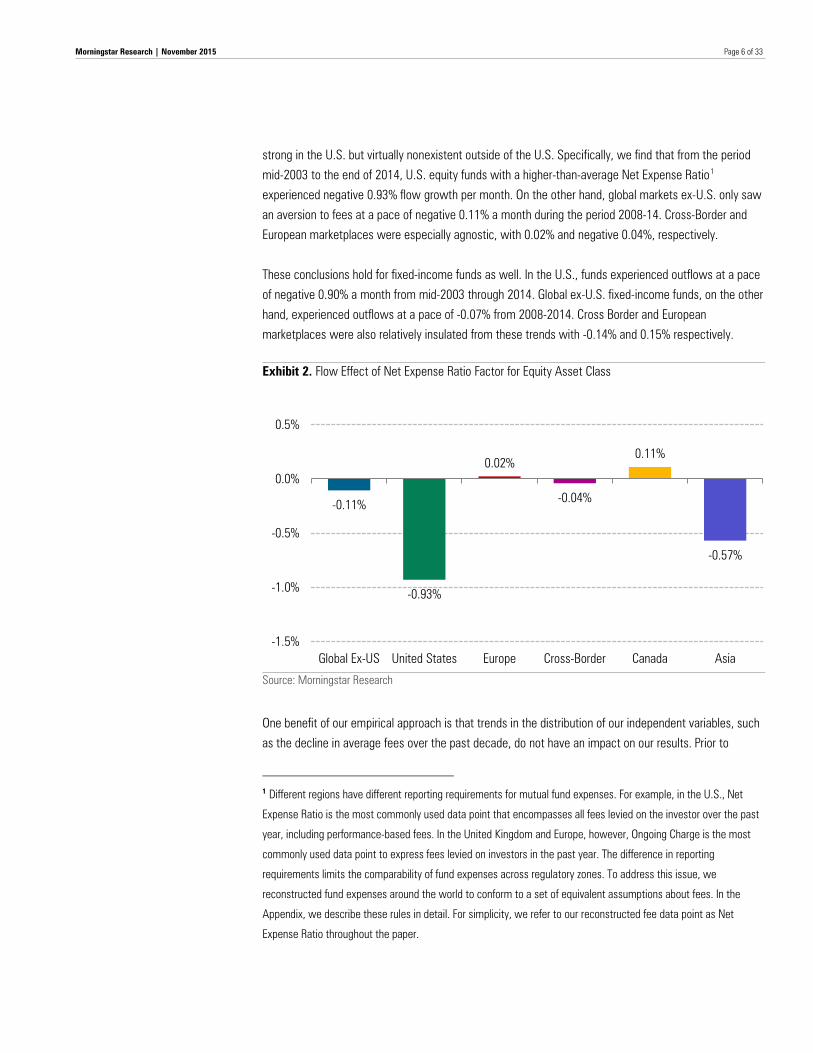
strong in the U.S. but virtually nonexistent outside of the U.S. Specifically, we find that from the period
mid-2003 to the end of 2014, U.S. equity funds with a higher-than-average Net Expense Ratio1
experienced negative 0.93% flow growth per month. On the other hand, global markets ex-U.S. only saw
an aversion to fees at a pace of negative 0.11% a month during the period 2008-14. Cross-Border and
European marketplaces were especially agnostic, with 0.02% and negative 0.04%, respectively.
These conclusions hold for fixed-income funds as well. In the U.S., funds experienced outflows at a pace
of negative 0.90% a month from mid-2003 through 2014. Global ex-U.S. fixed-income funds, on the other
hand, experienced outflows at a pace of -0.07% from 2008-2014. Cross Border and European
marketplaces were also relatively insulated from these trends with -0.14% and 0.15% respectively.
Exhibit 2. Flow Effect of Net Expense Ratio Factor for Equity Asset Class
Source: Morningstar Research
One benefit of our empirical approach is that trends in the distribution of our independent variables, such
as the decline in average fees over the past decade, do not have an impact on our results. Prior to
1 Different regions have different reporting requirements for mutual fund expenses. For example, in the U.S., Net
Expense Ratio is the most commonly used data point that encompasses all fees levied on the investor over the past
year, including performance-based fees. In the United Kingdom and Europe, however, Ongoing Charge is the most
commonly used data point to express fees levied on investors in the past year. The difference in reporting
requirements limits the comparability of fund expenses across regulatory zones. To address this issue, we
reconstructed fund expenses around the world to conform to a set of equivalent assumptions about fees. In the
Appendix, we describe these rules in detail. For simplicity, we refer to our reconstructed fee data point as Net
Expense Ratio throughout the paper.
-0.11%
-0.93%
0.02%
-0.04%
0.11%
-0.57%
-1.5%
-1.0%
-0.5%
0.0%
0.5%
Global Ex-US United States Europe Cross-Border Canada Asia
Page 7 of 33
Morningstar Research | November 2015
estimation, we normalize all independent variables (for example, fees) by date such that we are always
investigating whether investors reallocate resources to relatively more expensive or relatively cheaper
funds regardless of what the average happens to be at that time. This is important to keep in mind as it
indicates a fund’s flow is not related to the absolute level of its fees but rather its place in the distribution
relative to its peers.
The conclusion is that U.S. funds seem especially pressured to lower costs in order to attract assets, but
non-U.S.-domiciled funds have not yet felt this same pressure. Any differences observed in flows
between low-cost and high-cost funds ex-U.S. identified through aggregations are more likely to be
connected to other fund-specific characteristics.
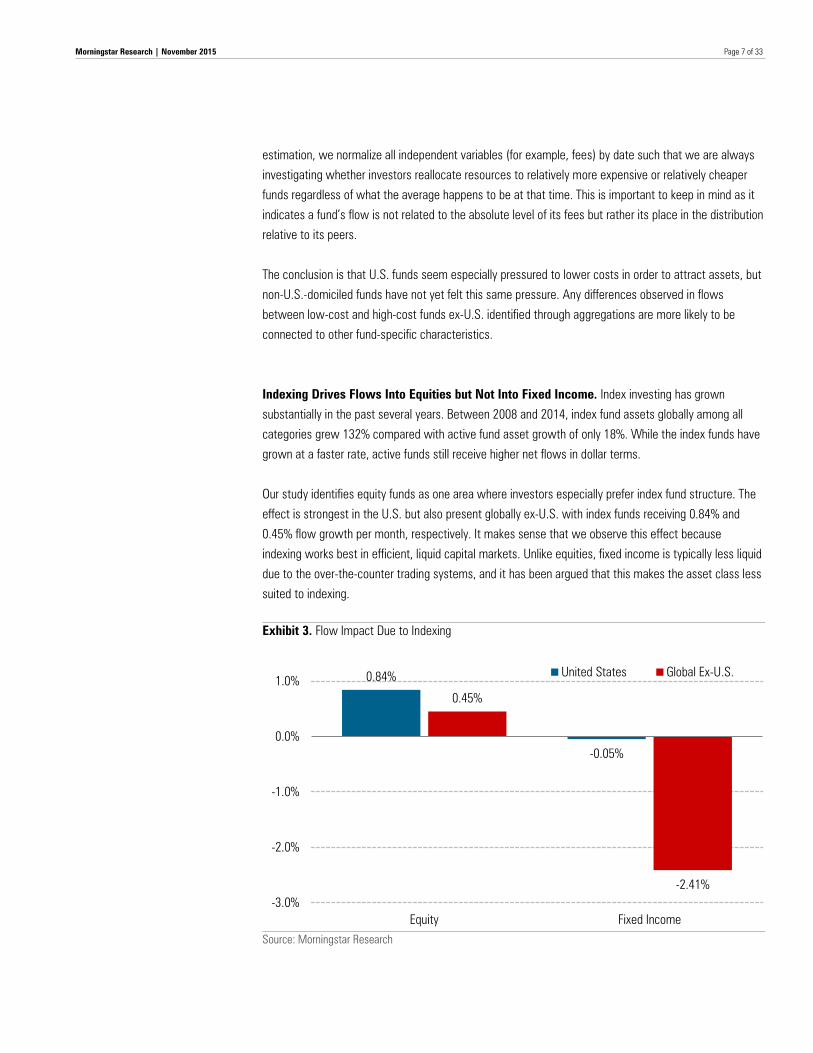
Indexing Drives Flows Into Equities but Not Into Fixed Income. Index investing has grown
substantially in the past several years. Between 2008 and 2014, index fund assets globally among all
categories grew 132% compared with active fund asset growth of only 18%. While the index funds have
grown at a faster rate, active funds still receive higher net flows in dollar terms.
Our study identifies equity funds as one area where investors especially prefer index fund structure. The
effect is strongest in the U.S. but also present globally ex-U.S. with index funds receiving 0.84% and
0.45% flow growth per month, respectively. It makes sense that we observe this effect because
indexing works best in efficient, liquid capital markets. Unlike equities, fixed income is typically less liquid
due to the over-the-counter trading systems, and it has been argued that this makes the asset class less
suited to indexing.
Exhibit 3. Flow Impact Due to Indexing
Source: Morningstar Research
0.84%
-0.05%
0.45%
-2.41% -3.0%
-2.0%
-1.0%
0.0%
1.0%
Equity Fixed Income
United States Global Ex-U.S.
Page 8 of 33
Morningstar Research | November 2015
Indeed, investors have recognized this possibility. Over the time period we studied, investors showed no
preference for fixed-income indexing in the U.S., while outside the U.S. investors exhibited a very strong
preference for active fixed-income funds. Exhibit 3 showcases these findings.
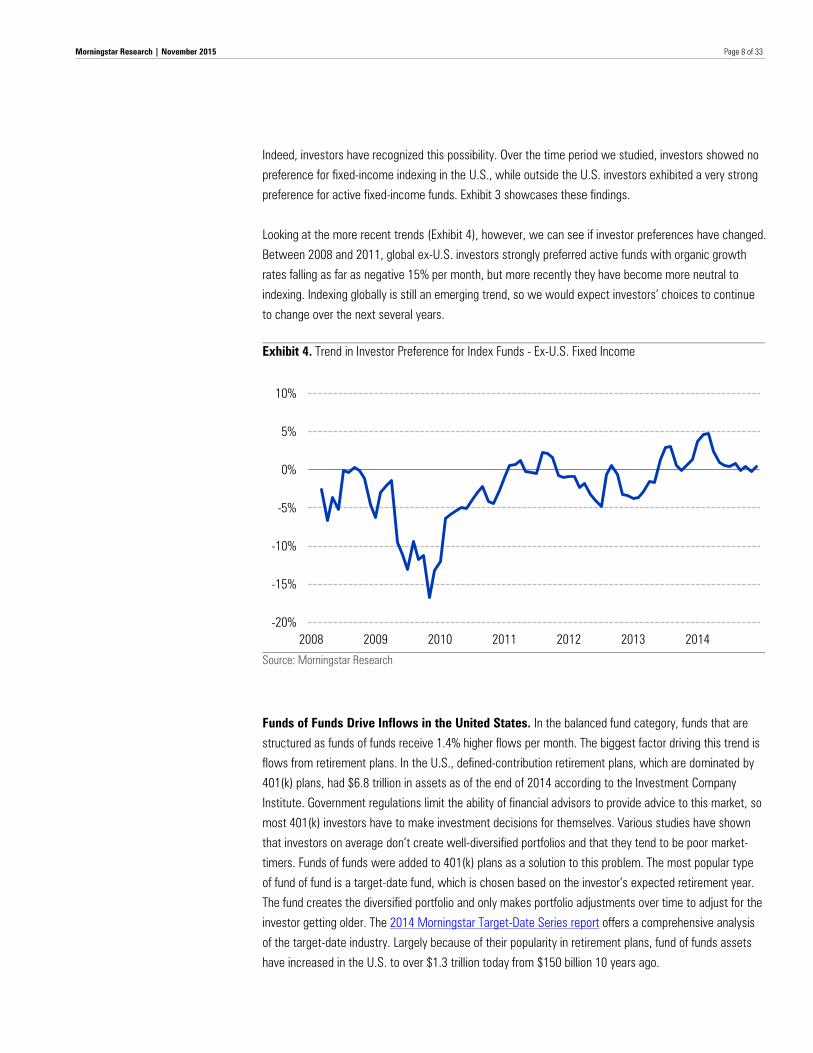
Looking at the more recent trends (Exhibit 4), however, we can see if investor preferences have changed.
Between 2008 and 2011, global ex-U.S. investors strongly preferred active funds with organic growth
rates falling as far as negative 15% per month, but more recently they have become more neutral to
indexing. Indexing globally is still an emerging trend, so we would expect investors’ choices to continue
to change over the next several years.
Exhibit 4. Trend in Investor Preference for Index Funds - Ex-U.S. Fixed Income
Source: Morningstar Research
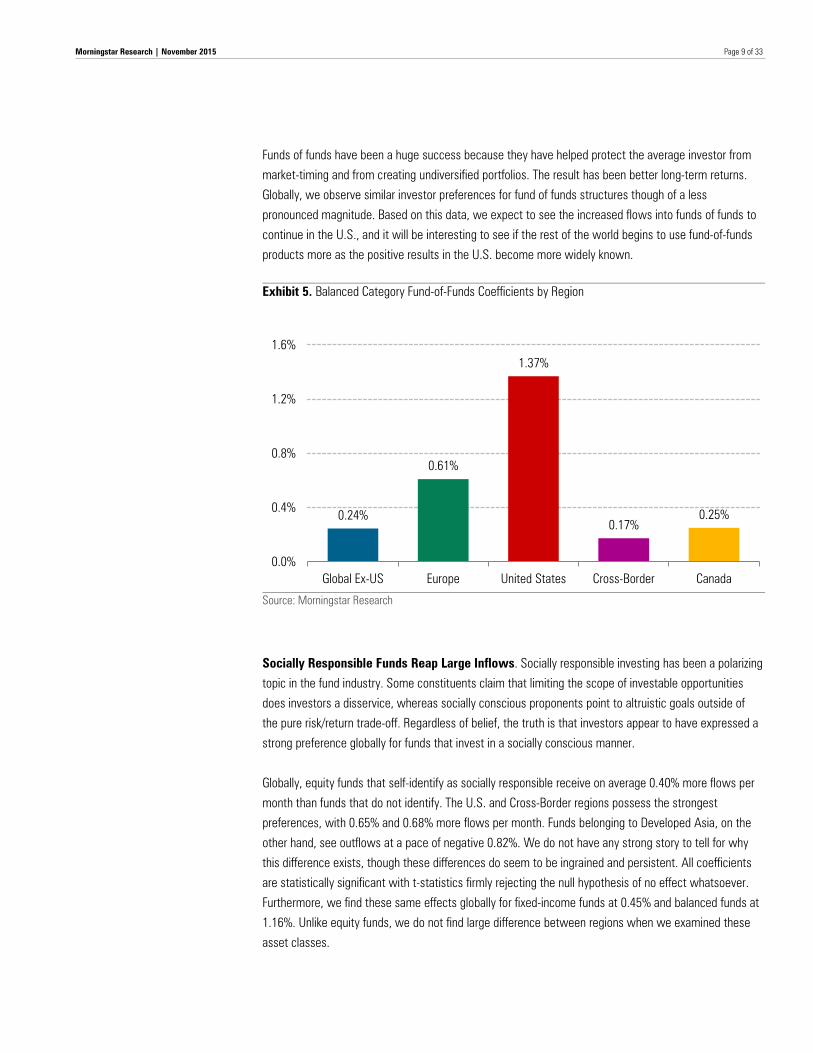
Funds of Funds Drive Inflows in the United States. In the balanced fund category, funds that are
structured as funds of funds receive 1.4% higher flows per month. The biggest factor driving this trend is
flows from retirement plans. In the U.S., defined-contribution retirement plans, which are dominated by
401(k) plans, had $6.8 trillion in assets as of the end of 2014 according to the Investment Company
Institute. Government regulations limit the ability of financial advisors to provide advice to this market, so
most 401(k) investors have to make investment decisions for themselves. Various studies have shown
that investors on average don’t create well-diversified portfolios and that they tend to be poor market-
timers. Funds of funds were added to 401(k) plans as a solution to this problem. The most popular type
of fund of fund is a target-date fund, which is chosen based on the investor’s expected retirement year.
The fund creates the diversified portfolio and only makes portfolio adjustments over time to adjust for the
investor getting older. The 2014 Morningstar Target-Date Series report offers a comprehensive analysis
of the target-date industry. Largely because of their popularity in retirement plans, fund of funds assets
have increased in the U.S. to over $1.3 trillion today from $150 billion 10 years ago.
-20%
-15%
-10%
-5%
0%
5%
10%
2008 2009 2010 2011 2012 2013 2014
Page 9 of 33
Morningstar Research | November 2015
Funds of funds have been a huge success because they have helped protect the average investor from
market-timing and from creating undiversified portfolios. The result has been better long-term returns.
Globally, we observe similar investor preferences for fund of funds structures though of a less
pronounced magnitude. Based on this data, we expect to see the increased flows into funds of funds to
continue in the U.S., and it will be interesting to see if the rest of the world begins to use fund-of-funds
products more as the positive results in the U.S. become more widely known.
Exhibit 5. Balanced Category Fund-of-Funds Coefficients by Region
Source: Morningstar Research
Socially Responsible Funds Reap Large Inflows. Socially responsible investing has been a polarizing
topic in the fund industry. Some constituents claim that limiting the scope of investable opportunities
does investors a disservice, whereas socially conscious proponents point to altruistic goals outside of
the pure risk/return trade-off. Regardless of belief, the truth is that investors appear to have expressed a
strong preference globally for funds that invest in a socially conscious manner.
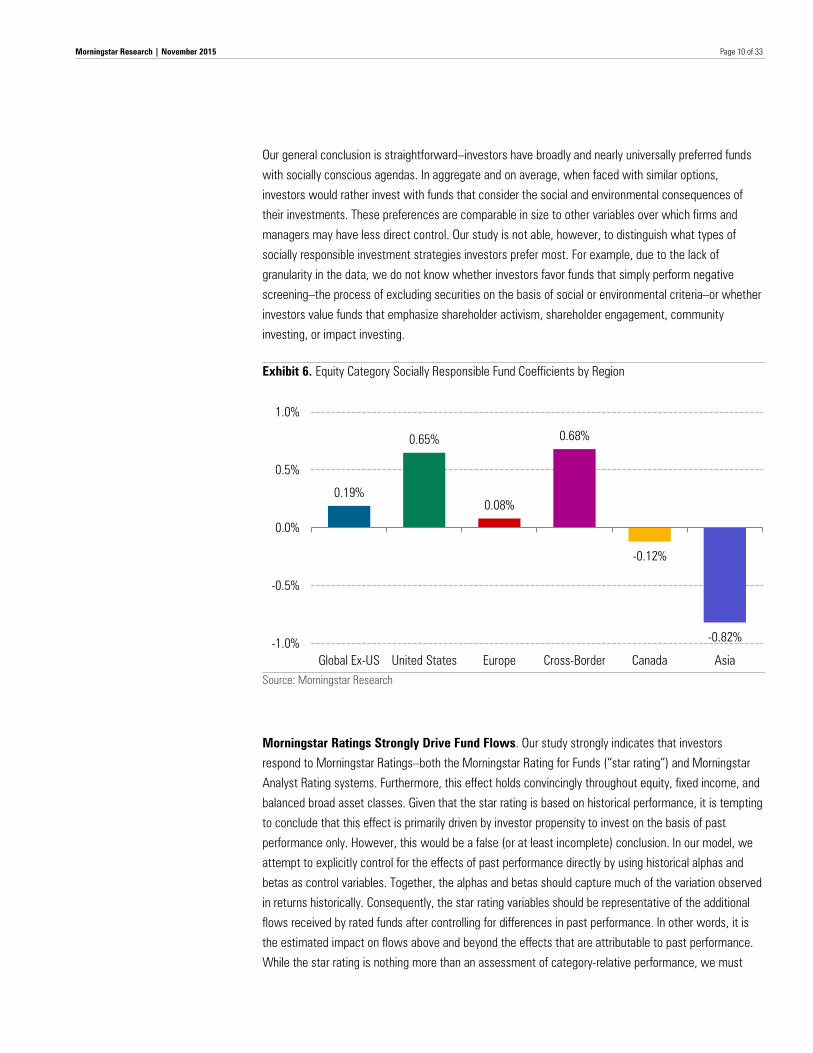
Globally, equity funds that self-identify as socially responsible receive on average 0.40% more flows per
month than funds that do not identify. The U.S. and Cross-Border regions possess the strongest
preferences, with 0.65% and 0.68% more flows per month. Funds belonging to Developed Asia, on the
other hand, see outflows at a pace of negative 0.82%. We do not have any strong story to tell for why
this difference exists, though these differences do seem to be ingrained and persistent. All coefficients
are statistically significant with t-statistics firmly rejecting the null hypothesis of no effect whatsoever.
Furthermore, we find these same effects globally for fixed-income funds at 0.45% and balanced funds at
1.16%. Unlike equity funds, we do not find large difference between regions when we examined these
asset classes.
0.24%
0.61%
1.37%
0.17% 0.25%
0.0%
0.4%
0.8%
1.2%
1.6%
Global Ex-US Europe United States Cross-Border Canada
Page 10 of 33
Morningstar Research | November 2015
Our general conclusion is straightforward–investors have broadly and nearly universally preferred funds
with socially conscious agendas. In aggregate and on average, when faced with similar options,
investors would rather invest with funds that consider the social and environmental consequences of
their investments. These preferences are comparable in size to other variables over which firms and
managers may have less direct control. Our study is not able, however, to distinguish what types of
socially responsible investment strategies investors prefer most. For example, due to the lack of
granularity in the data, we do not know whether investors favor funds that simply perform negative
screening–the process of excluding securities on the basis of social or environmental criteria–or whether
investors value funds that emphasize shareholder activism, shareholder engagement, community
investing, or impact investing.
Exhibit 6. Equity Category Socially Responsible Fund Coefficients by Region
Source: Morningstar Research
Morningstar Ratings Strongly Drive Fund Flows. Our study strongly indicates that investors
respond to Morningstar Ratings–both the Morningstar Rating for Funds (“star rating”) and Morningstar
Analyst Rating systems. Furthermore, this effect holds convincingly throughout equity, fixed income, and
balanced broad asset classes. Given that the star rating is based on historical performance, it is tempting
to conclude that this effect is primarily driven by investor propensity to invest on the basis of past
performance only. However, this would be a false (or at least incomplete) conclusion. In our model, we
attempt to explicitly control for the effects of past performance directly by using historical alphas and
betas as control variables. Together, the alphas and betas should capture much of the variation observed
in returns historically. Consequently, the star rating variables should be representative of the additional
flows received by rated funds after controlling for differences in past performance. In other words, it is
the estimated impact on flows above and beyond the effects that are attributable to past performance.
While the star rating is nothing more than an assessment of category-relative performance, we must
0.19%
0.65%
0.08%
0.68%
-0.12%
-0.82% -1.0%
-0.5%
0.0%
0.5%
1.0%
Global Ex-US United States Europe Cross-Border Canada Asia
Page 11 of 33
Morningstar Research | November 2015
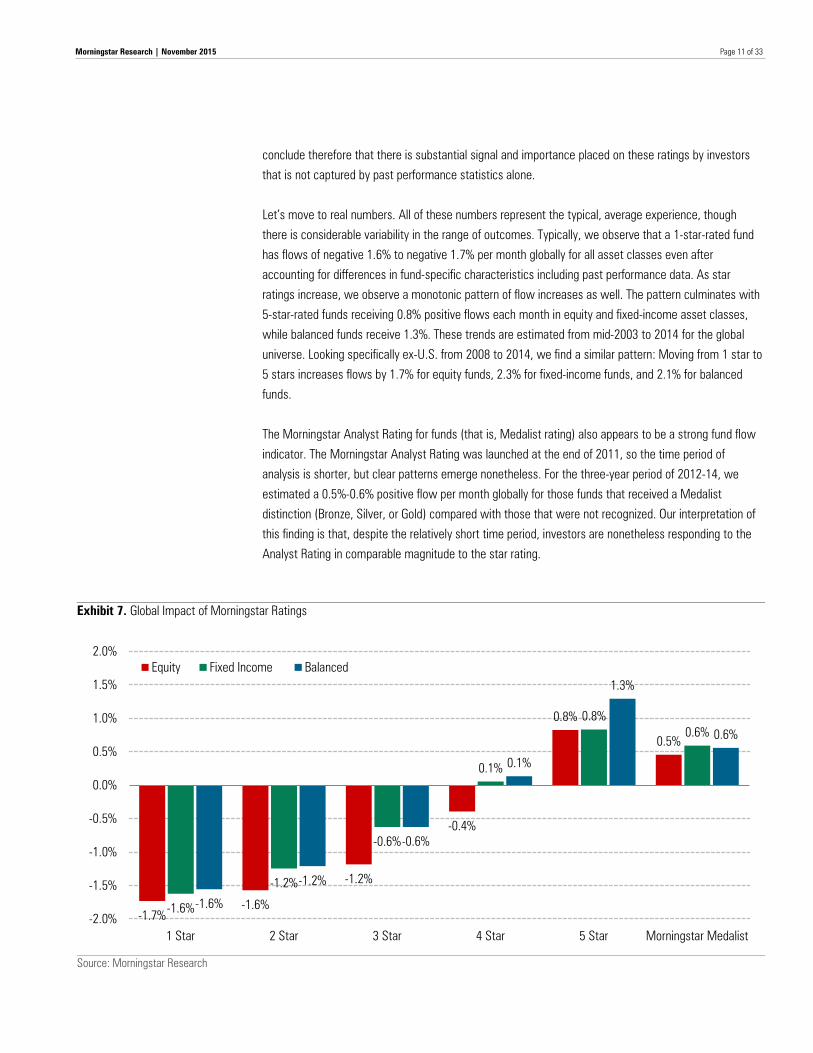
conclude therefore that there is substantial signal and importance placed on these ratings by investors
that is not captured by past performance statistics alone.
Let’s move to real numbers. All of these numbers represent the typical, average experience, though
there is considerable variability in the range of outcomes. Typically, we observe that a 1-star-rated fund
has flows of negative 1.6% to negative 1.7% per month globally for all asset classes even after
accounting for differences in fund-specific characteristics including past performance data. As star
ratings increase, we observe a monotonic pattern of flow increases as well. The pattern culminates with
5-star-rated funds receiving 0.8% positive flows each month in equity and fixed-income asset classes,
while balanced funds receive 1.3%. These trends are estimated from mid-2003 to 2014 for the global
universe. Looking specifically ex-U.S. from 2008 to 2014, we find a similar pattern: Moving from 1 star to
5 stars increases flows by 1.7% for equity funds, 2.3% for fixed-income funds, and 2.1% for balanced
funds.
The Morningstar Analyst Rating for funds (that is, Medalist rating) also appears to be a strong fund flow
indicator. The Morningstar Analyst Rating was launched at the end of 2011, so the time period of
analysis is shorter, but clear patterns emerge nonetheless. For the three-year period of 2012-14, we
estimated a 0.5%-0.6% positive flow per month globally for those funds that received a Medalist
distinction (Bronze, Silver, or Gold) compared with those that were not recognized. Our interpretation of
this finding is that, despite the relatively short time period, investors are nonetheless responding to the
Analyst Rating in comparable magnitude to the star rating.
Exhibit 7. Global Impact of Morningstar Ratings
Source: Morningstar Research
-1.7% -1.6%
-1.2%
-0.4%
0.8%
0.5%
-1.6%
-1.2%
-0.6%
0.1%
0.8% 0.6%
-1.6%
-1.2%
-0.6%
0.1%
1.3%
0.6%
-2.0%
-1.5%
-1.0%
-0.5%
0.0%
0.5%
1.0%
1.5%
2.0%
1 Star 2 Star 3 Star 4 Star 5 Star Morningstar Medalist
Equity Fixed Income Balanced
Page 12 of 33
Morningstar Research | November 2015
Funds With Style Tilts in Certain Markets Get Higher Flows. Strategic beta (or smart beta) has
been an industry buzzword in the past few years. Furthermore, segmenting funds that label themselves
as strategic beta has uncovered seemingly high investor preferences for these types of investment
vehicles offering nontraditional beta exposure. However, it is problematic to lump all strategic beta funds
together and draw conclusions on investor preferences for nontraditional beta. It ignores the fact that
funds can be constructed to tilt high or low, positive or negative, or up or down on a specific type of beta.
For example, the strategic-beta umbrella would include low-beta and high-beta funds. Looking at the
aggregate makes it difficult to discern whether investors actually prefer lower beta or higher beta. The
same can be said for value and growth tilts, which are generally thought to be opposites. The truth is
that investors prefer certain types and tilts of beta more than others, and preferences for nontraditional
beta differ strongly by market.
The equity style tilts (or betas) that we examine are market, size, value, and momentum. By the market
style tilt, we aim to capture low-beta, low-volatility, and high-leverage type strategies. It is worth noting
that the market beta can be interpreted in the same manner as a fund’s trailing volatility or standard
deviation. Higher market beta is associated with higher volatility. With the size style tilt, we capture
investor preferences for small cap versus large cap. With the value style tilt, we capture investor
preferences for funds with value or growth biases. Lastly, the momentum style tilt effectively captures
investor preferences for the momentum effect or its contrarian offset.
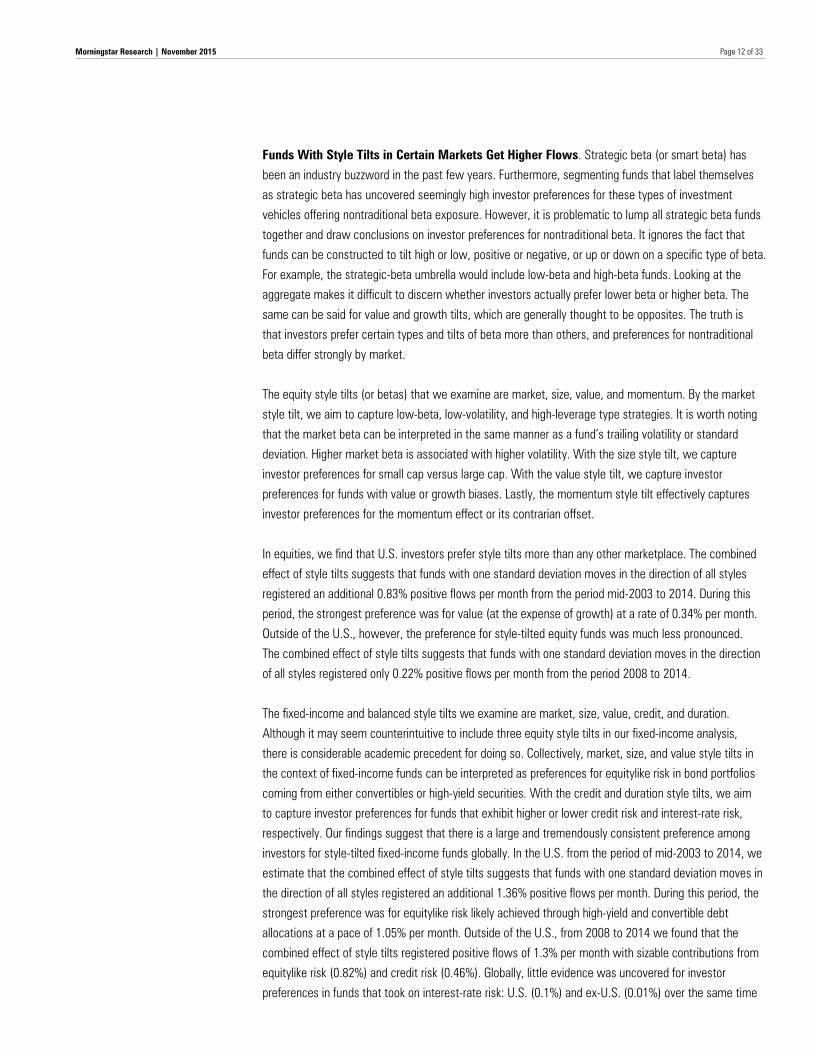
In equities, we find that U.S. investors prefer style tilts more than any other marketplace. The combined
effect of style tilts suggests that funds with one standard deviation moves in the direction of all styles
registered an additional 0.83% positive flows per month from the period mid-2003 to 2014. During this
period, the strongest preference was for value (at the expense of growth) at a rate of 0.34% per month.
Outside of the U.S., however, the preference for style-tilted equity funds was much less pronounced.
The combined effect of style tilts suggests that funds with one standard deviation moves in the direction
of all styles registered only 0.22% positive flows per month from the period 2008 to 2014.
The fixed-income and balanced style tilts we examine are market, size, value, credit, and duration.
Although it may seem counterintuitive to include three equity style tilts in our fixed-income analysis,
there is considerable academic precedent for doing so. Collectively, market, size, and value style tilts in
the context of fixed-income funds can be interpreted as preferences for equitylike risk in bond portfolios
coming from either convertibles or high-yield securities. With the credit and duration style tilts, we aim
to capture investor preferences for funds that exhibit higher or lower credit risk and interest-rate risk,
respectively. Our findings suggest that there is a large and tremendously consistent preference among
investors for style-tilted fixed-income funds globally. In the U.S. from the period of mid-2003 to 2014, we
estimate that the combined effect of style tilts suggests that funds with one standard deviation moves in
the direction of all styles registered an additional 1.36% positive flows per month. During this period, the
strongest preference was for equitylike risk likely achieved through high-yield and convertible debt
allocations at a pace of 1.05% per month. Outside of the U.S., from 2008 to 2014 we found that the
combined effect of style tilts registered positive flows of 1.3% per month with sizable contributions from
equitylike risk (0.82%) and credit risk (0.46%). Globally, little evidence was uncovered for investor
preferences in funds that took on interest-rate risk: U.S. (0.1%) and ex-U.S. (0.01%) over the same time
Page 13 of 33
Morningstar Research | November 2015
periods. This is despite the fact that, since 2003, taking on higher duration would have been one of the
most profitable strategies.
Investors in balanced funds also exhibit sizable preferences for style tilts, though their preferences
change by marketplace. In the U.S., the combined effect of style tilts registered 1.83% inflows per
month from mid-2003 to 2014 with higher market leverage (0.52%) and higher credit risk (0.48%) as the
leading contributors. Furthermore, within the U.S., investors exhibited a relatively strong preference for
small-cap stocks (0.26%). Outside of the U.S., the combined effect of style tilts registered 1.54% inflows
per month. However, ex-U.S. investors differed from their U.S. counterparts in that they exhibited strong
preferences for large-cap stocks (0.71%) and lower credit risk (negative 0.31%).
Exhibit 8. Style Tilts
Source: Morningstar Research
The Effect of a Manager Change on Flows Cannot Be Ignored. Our findings have important
implications for how firms should manage fund manager transitions. We find a statistically and
economically powerful relationship between flows and manager tenure. Since funds can be comanaged,
for purposes of our study we define manager tenure as longest tenure. Longest tenure is simply
calculated by selecting the single fund manager out of the fund’s list of comanagers who has the longest
tenure at the fund and counting the number of months served continuously without interruption. It is
important to note that this is not synonymous with manager experience. Years of experience
accumulated at other firms or other funds at the same firm will not be counted. Therefore, when we say
manager tenure, we really mean tenure at the fund in question, and this is, therefore, a measure of fund-
management continuity.
0.83%
1.36%
1.83%
0.22%
1.30%
1.54%
0.0%
1.0%
2.0%
Equity Fixed Income Balanced
United States Global Ex-U.S.
Page 14 of 33
Morningstar Research | November 2015
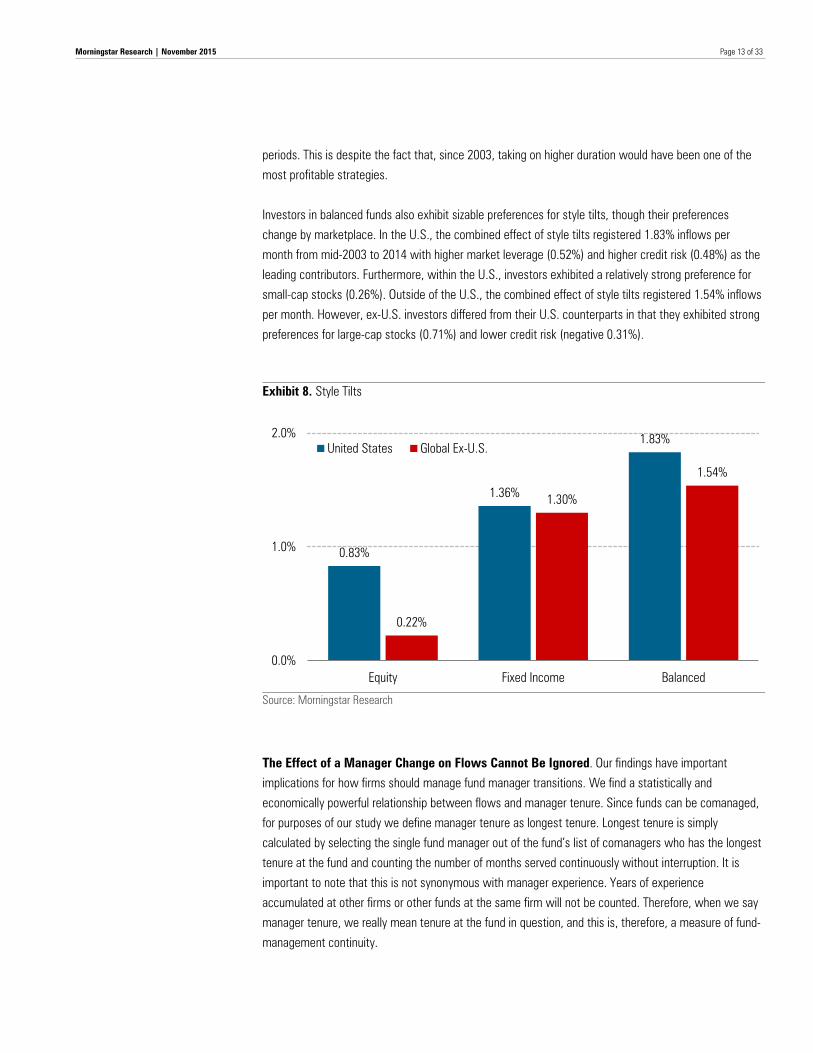
Globally, equity fund managers with a higher-than-average tenure collect inflows at a rate of 0.29% per
month. The effect is present globally but is strongest in Canada (0.35%). For fixed income, we find a
weaker pattern globally (0.16%) because of the apparent lack of investor preference for longer-tenured
managers in the U.S. fixed-income fund marketplace. Outside of the U.S., however, we find that
investors strongly prefer long-tenured managers, rewarding them with inflows at a rate of 0.48% per
month. Similarly, investors in balanced funds exhibit strong preferences for long-tenured managers
globally (0.42%) and ex-U.S. (0.63%), but these preferences deteriorated in the U.S. (0.16%).
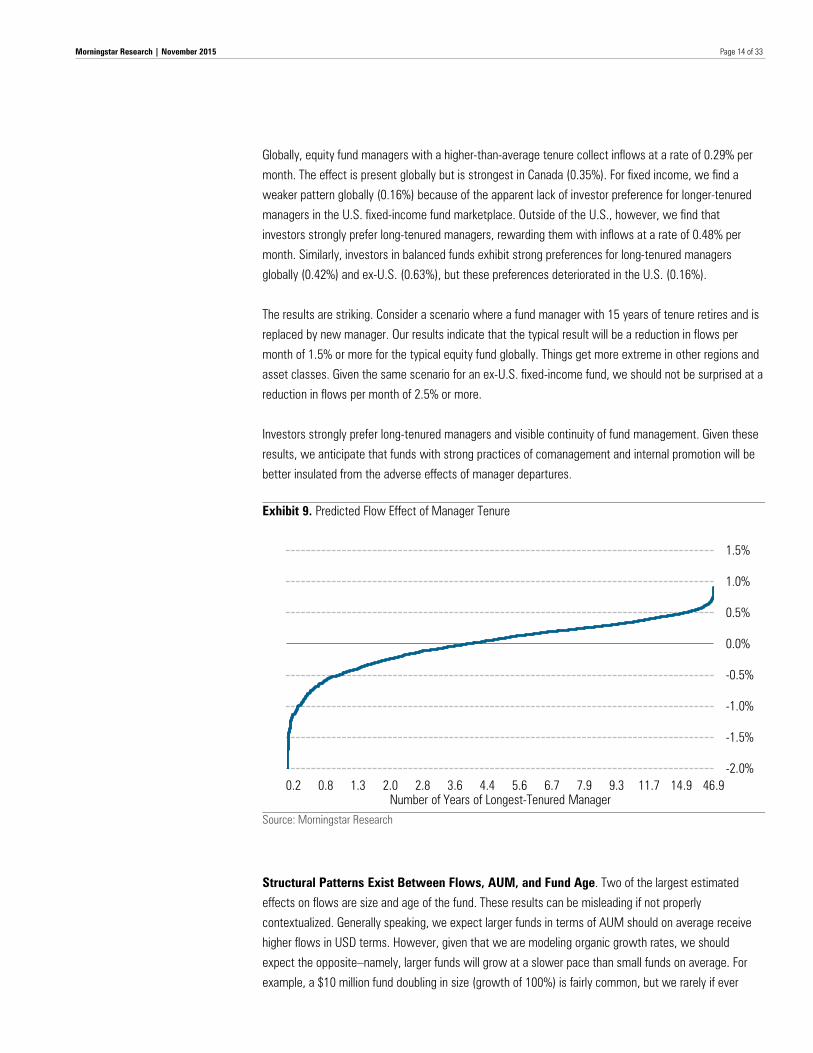
The results are striking. Consider a scenario where a fund manager with 15 years of tenure retires and is
replaced by new manager. Our results indicate that the typical result will be a reduction in flows per
month of 1.5% or more for the typical equity fund globally. Things get more extreme in other regions and
asset classes. Given the same scenario for an ex-U.S. fixed-income fund, we should not be surprised at a
reduction in flows per month of 2.5% or more.
Investors strongly prefer long-tenured managers and visible continuity of fund management. Given these
results, we anticipate that funds with strong practices of comanagement and internal promotion will be
better insulated from the adverse effects of manager departures.
Exhibit 9. Predicted Flow Effect of Manager Tenure
Source: Morningstar Research
Structural Patterns Exist Between Flows, AUM, and Fund Age. Two of the largest estimated
effects on flows are size and age of the fund. These results can be misleading if not properly
contextualized. Generally speaking, we expect larger funds in terms of AUM should on average receive
higher flows in USD terms. However, given that we are modeling organic growth rates, we should
expect the opposite–namely, larger funds will grow at a slower pace than small funds on average. For
example, a $10 million fund doubling in size (growth of 100%) is fairly common, but we rarely if ever
-2.0%
-1.5%
-1.0%
-0.5%
0.0%
0.5%
1.0%
1.5%
46.914.911.79.37.96.75.64.43.62.82.01.30.80.2Number of Years of Longest-Tenured Manager
Page 15 of 33
Morningstar Research | November 2015
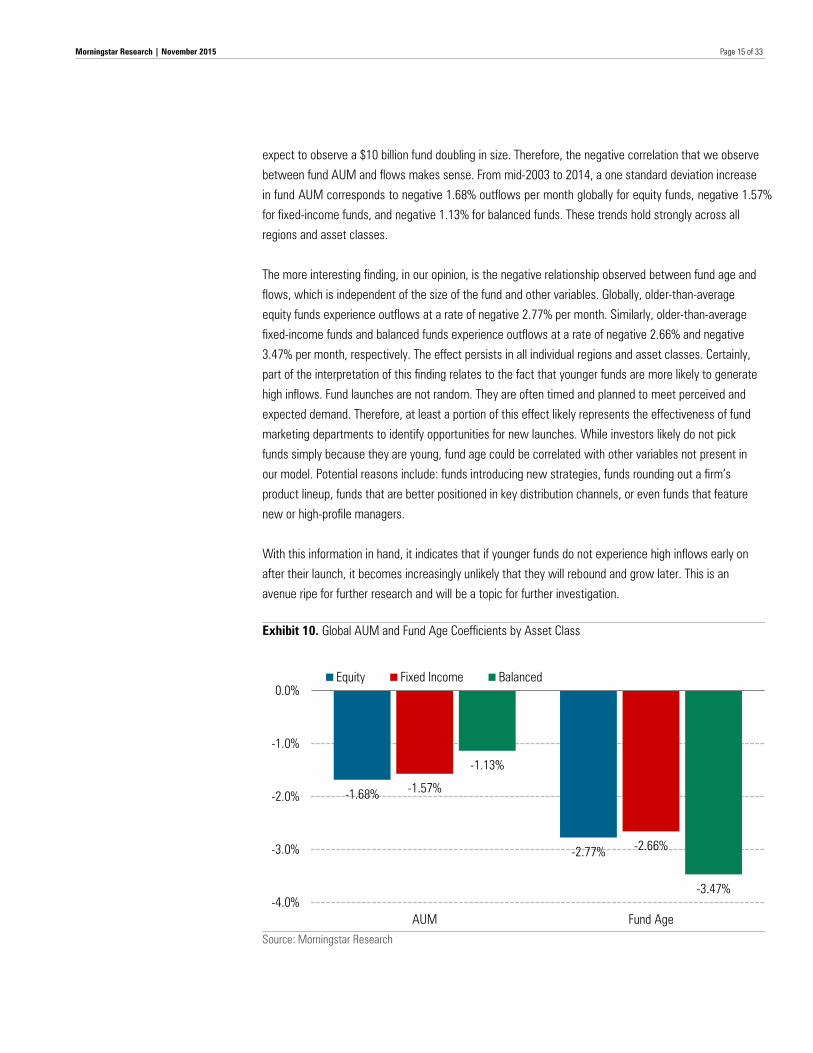
expect to observe a $10 billion fund doubling in size. Therefore, the negative correlation that we observe
between fund AUM and flows makes sense. From mid-2003 to 2014, a one standard deviation increase
in fund AUM corresponds to negative 1.68% outflows per month globally for equity funds, negative 1.57%
for fixed-income funds, and negative 1.13% for balanced funds. These trends hold strongly across all
regions and asset classes.
The more interesting finding, in our opinion, is the negative relationship observed between fund age and
flows, which is independent of the size of the fund and other variables. Globally, older-than-average
equity funds experience outflows at a rate of negative 2.77% per month. Similarly, older-than-average
fixed-income funds and balanced funds experience outflows at a rate of negative 2.66% and negative
3.47% per month, respectively. The effect persists in all individual regions and asset classes. Certainly,
part of the interpretation of this finding relates to the fact that younger funds are more likely to generate
high inflows. Fund launches are not random. They are often timed and planned to meet perceived and
expected demand. Therefore, at least a portion of this effect likely represents the effectiveness of fund
marketing departments to identify opportunities for new launches. While investors likely do not pick
funds simply because they are young, fund age could be correlated with other variables not present in
our model. Potential reasons include: funds introducing new strategies, funds rounding out a firm’s
product lineup, funds that are better positioned in key distribution channels, or even funds that feature
new or high-profile managers.
With this information in hand, it indicates that if younger funds do not experience high inflows early on
after their launch, it becomes increasingly unlikely that they will rebound and grow later. This is an
avenue ripe for further research and will be a topic for further investigation.
Exhibit 10. Global AUM and Fund Age Coefficients by Asset Class
Source: Morningstar Research
-1.68%
-2.77%
-1.57%
-2.66%
-1.13%
-3.47% -4.0%
-3.0%
-2.0%
-1.0%
0.0%
AUM Fund Age
Equity Fixed Income Balanced
Page 16 of 33
Morningstar Research | November 2015
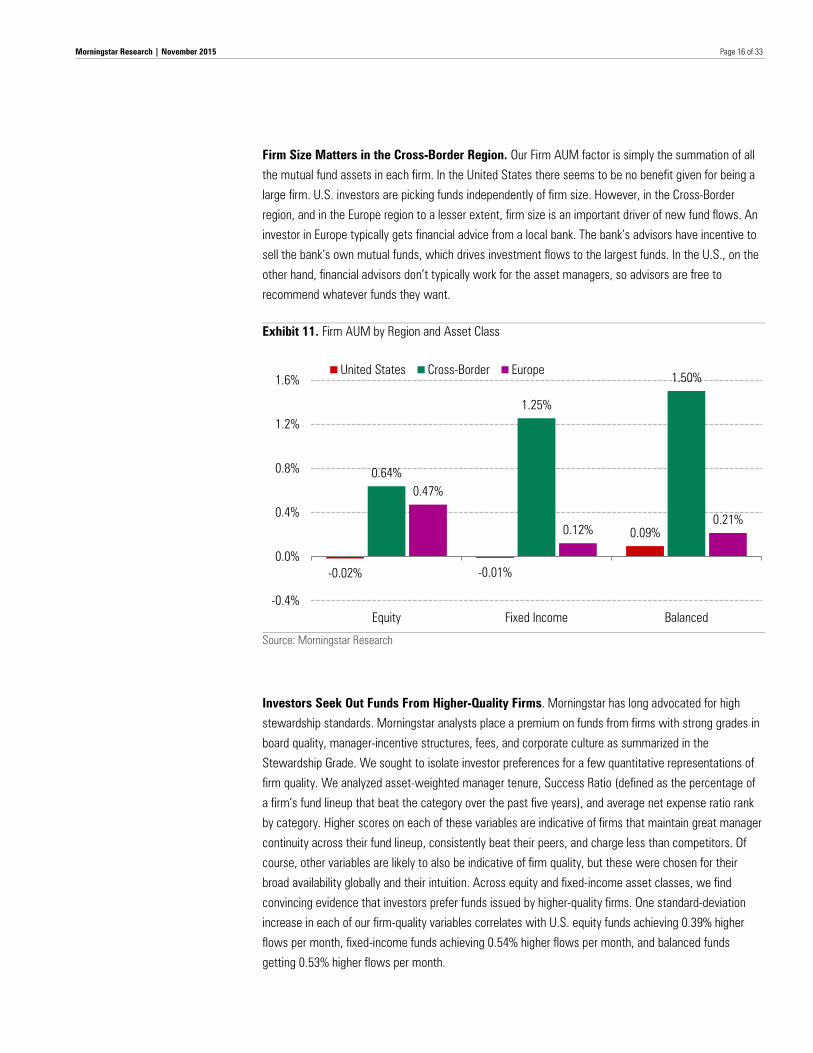
Firm Size Matters in the Cross-Border Region. Our Firm AUM factor is simply the summation of all
the mutual fund assets in each firm. In the United States there seems to be no benefit given for being a
large firm. U.S. investors are picking funds independently of firm size. However, in the Cross-Border
region, and in the Europe region to a lesser extent, firm size is an important driver of new fund flows. An
investor in Europe typically gets financial advice from a local bank. The bank’s advisors have incentive to
sell the bank’s own mutual funds, which drives investment flows to the largest funds. In the U.S., on the
other hand, financial advisors don’t typically work for the asset managers, so advisors are free to
recommend whatever funds they want.
Exhibit 11. Firm AUM by Region and Asset Class
Source: Morningstar Research
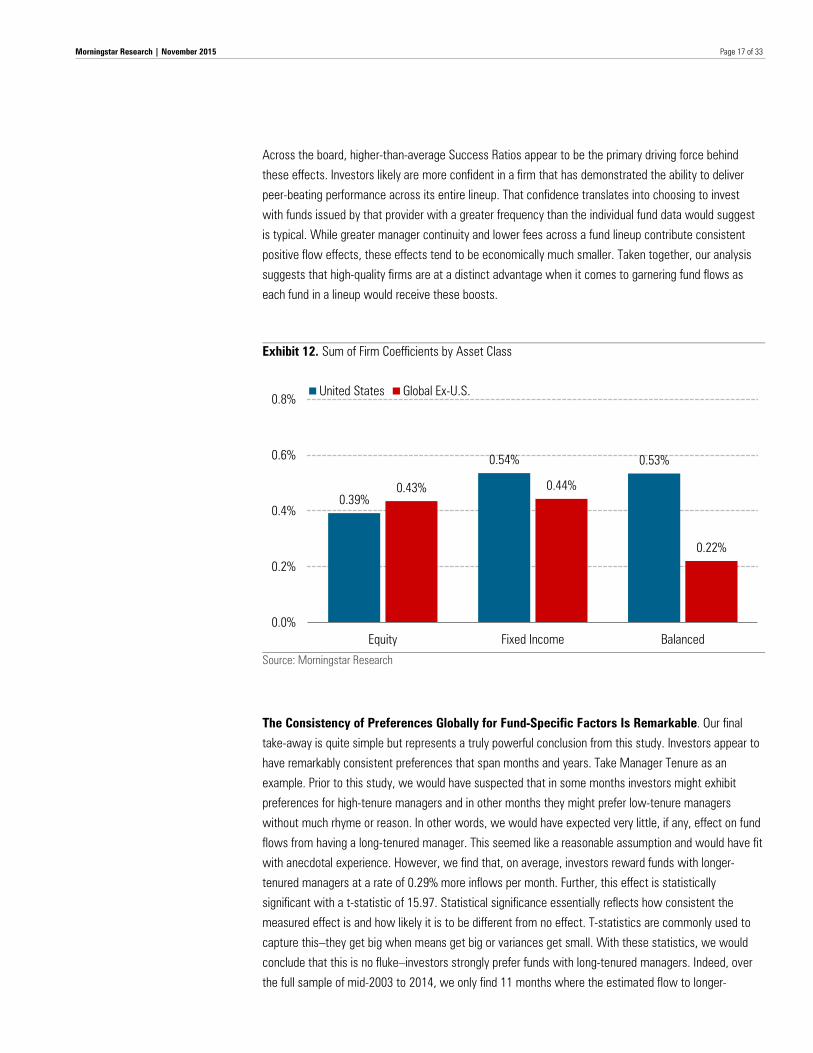
Investors Seek Out Funds From Higher-Quality Firms. Morningstar has long advocated for high
stewardship standards. Morningstar analysts place a premium on funds from firms with strong grades in
board quality, manager-incentive structures, fees, and corporate culture as summarized in the
Stewardship Grade. We sought to isolate investor preferences for a few quantitative representations of
firm quality. We analyzed asset-weighted manager tenure, Success Ratio (defined as the percentage of
a firm’s fund lineup that beat the category over the past five years), and average net expense ratio rank
by category. Higher scores on each of these variables are indicative of firms that maintain great manager
continuity across their fund lineup, consistently beat their peers, and charge less than competitors. Of
course, other variables are likely to also be indicative of firm quality, but these were chosen for their
broad availability globally and their intuition. Across equity and fixed-income asset classes, we find
convincing evidence that investors prefer funds issued by higher-quality firms. One standard-deviation
increase in each of our firm-quality variables correlates with U.S. equity funds achieving 0.39% higher
flows per month, fixed-income funds achieving 0.54% higher flows per month, and balanced funds
getting 0.53% higher flows per month.
-0.02% -0.01%
0.09%
0.64%
1.25%
1.50%
0.47%
0.12% 0.21%
-0.4%
0.0%
0.4%
0.8%
1.2%
1.6%
Equity Fixed Income Balanced
United States Cross-Border Europe
Page 17 of 33
Morningstar Research | November 2015
Across the board, higher-than-average Success Ratios appear to be the primary driving force behind
these effects. Investors likely are more confident in a firm that has demonstrated the ability to deliver
peer-beating performance across its entire lineup. That confidence translates into choosing to invest
with funds issued by that provider with a greater frequency than the individual fund data would suggest
is typical. While greater manager continuity and lower fees across a fund lineup contribute consistent
positive flow effects, these effects tend to be economically much smaller. Taken together, our analysis
suggests that high-quality firms are at a distinct advantage when it comes to garnering fund flows as
each fund in a lineup would receive these boosts.
Exhibit 12. Sum of Firm Coefficients by Asset Class
Source: Morningstar Research
The Consistency of Preferences Globally for Fund-Specific Factors Is Remarkable. Our final
take-away is quite simple but represents a truly powerful conclusion from this study. Investors appear to
have remarkably consistent preferences that span months and years. Take Manager Tenure as an
example. Prior to this study, we would have suspected that in some months investors might exhibit
preferences for high-tenure managers and in other months they might prefer low-tenure managers
without much rhyme or reason. In other words, we would have expected very little, if any, effect on fund
flows from having a long-tenured manager. This seemed like a reasonable assumption and would have fit
with anecdotal experience. However, we find that, on average, investors reward funds with longer-
tenured managers at a rate of 0.29% more inflows per month. Further, this effect is statistically
significant with a t-statistic of 15.97. Statistical significance essentially reflects how consistent the
measured effect is and how likely it is to be different from no effect. T-statistics are commonly used to
capture this–they get big when means get big or variances get small. With these statistics, we would
conclude that this is no fluke–investors strongly prefer funds with long-tenured managers. Indeed, over
the full sample of mid-2003 to 2014, we only find 11 months where the estimated flow to longer-
0.39%
0.54% 0.53%
0.43% 0.44%
0.22%
0.0%
0.2%
0.4%
0.6%
0.8%
Equity Fixed Income Balanced
United States Global Ex-U.S.
Page 18 of 33
Morningstar Research | November 2015
tenured managers was negative. Out of 138 months considered, investors preferred longer-tenured
managers in 127 of those months, holding other characteristics about those funds constant.
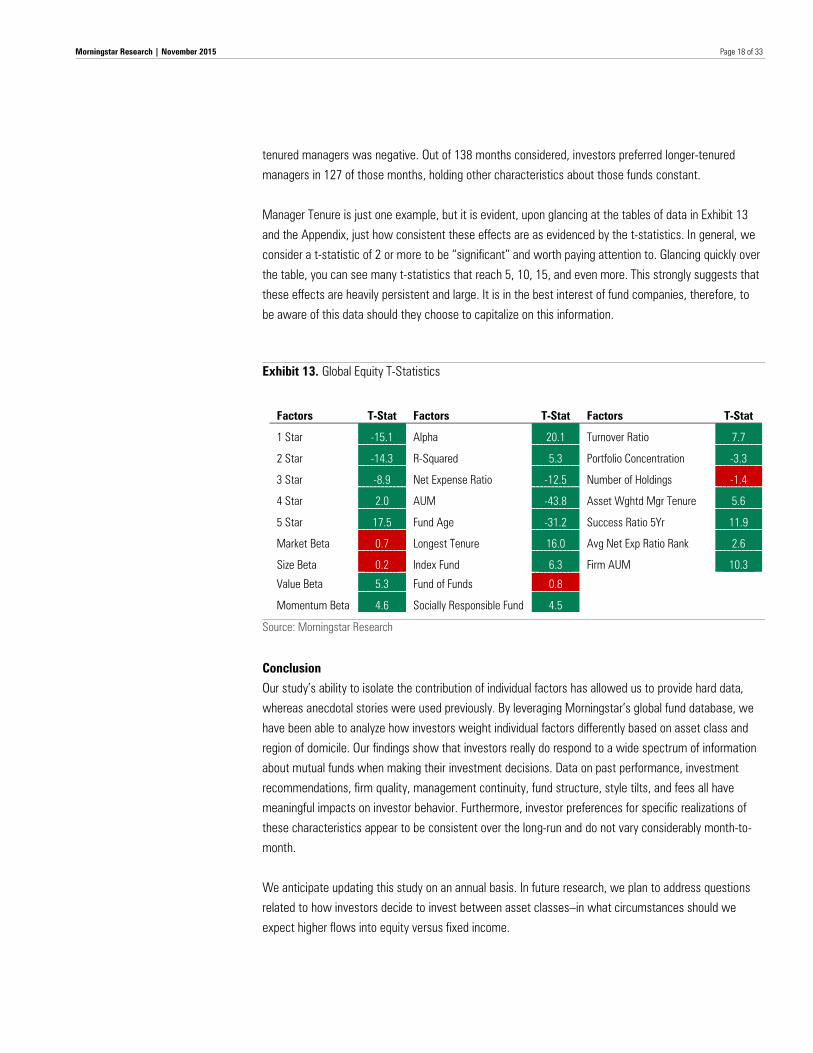
Manager Tenure is just one example, but it is evident, upon glancing at the tables of data in Exhibit 13
and the Appendix, just how consistent these effects are as evidenced by the t-statistics. In general, we
consider a t-statistic of 2 or more to be “significant” and worth paying attention to. Glancing quickly over
the table, you can see many t-statistics that reach 5, 10, 15, and even more. This strongly suggests that
these effects are heavily persistent and large. It is in the best interest of fund companies, therefore, to
be aware of this data should they choose to capitalize on this information.
Exhibit 13. Global Equity T-Statistics
Factors T-Stat Factors T-Stat Factors T-Stat
1 Star -15.1 Alpha 20.1 Turnover Ratio 7.7
2 Star -14.3 R-Squared 5.3 Portfolio Concentration -3.3
3 Star -8.9 Net Expense Ratio -12.5 Number of Holdings -1.4
4 Star 2.0 AUM -43.8 Asset Wghtd Mgr Tenure 5.6
5 Star 17.5 Fund Age -31.2 Success Ratio 5Yr 11.9
Market Beta 0.7 Longest Tenure 16.0 Avg Net Exp Ratio Rank 2.6
Size Beta 0.2 Index Fund 6.3 Firm AUM 10.3
Value Beta 5.3 Fund of Funds 0.8
Momentum Beta 4.6 Socially Responsible Fund 4.5
Source: Morningstar Research
Conclusion
Our study’s ability to isolate the contribution of individual factors has allowed us to provide hard data,
whereas anecdotal stories were used previously. By leveraging Morningstar’s global fund database, we
have been able to analyze how investors weight individual factors differently based on asset class and
region of domicile. Our findings show that investors really do respond to a wide spectrum of information
about mutual funds when making their investment decisions. Data on past performance, investment
recommendations, firm quality, management continuity, fund structure, style tilts, and fees all have
meaningful impacts on investor behavior. Furthermore, investor preferences for specific realizations of
these characteristics appear to be consistent over the long-run and do not vary considerably month-to-
month.
We anticipate updating this study on an annual basis. In future research, we plan to address questions
related to how investors decide to invest between asset classes–in what circumstances should we
expect higher flows into equity versus fixed income.
Page 19 of 33
Morningstar Research | November 2015
Appendix Data
Our study relies entirely on Morningstar fund data sources. The sample period begins in July 2003 and
ends in December 2014. However, because of a lack of data availability, we restrict our analysis of ex-
US funds to the time period of January 2008 to December 2014. Over the entirety of the sample,
monthly fund share-class counts range from 7,824 to 70,978 depending on the period concerned, with
more recent periods having higher counts. Our sample includes multiple broad asset classes--balanced
funds (counts range from 352 to 11,934 funds), equity (4,977 to 43,363 funds), and fixed income (2,495
to 17,208 funds). Given the small universe of alternative funds, we chose to not include them for the
purposes of this study. In December 2014, our sample spans a total of 70,978 fund share classes.
Before 2008, our sample is composed entirely of U.S. funds. However, after 2008, our sample
incorporates ex-U.S. funds and is thereafter quite geographically diverse throughout the remainder of the
period tested. By the end of the period, funds domiciled in the U.S. account for 31.4% of the total
universe, Cross-Border funds represent 26.2%, European funds 22.6%, Canada 6.7%, Asia 10.8%, and
funds domiciled in Latin America, Oceania, Middle East, and Africa round out the remainder (~5%). Of
all developed countries, Japan is least represented in the sample, owing to a lack of reliable fund data
collected for funds domiciled in that nation.
We do not restrict our analysis to a single share class of individual funds because we are interested in
modeling the variation in fund flows between share classes, especially as it relates to cost. We
recognize that an alternative method of analysis would select representative share classes before
proceeding, such as choosing “retail” or “institutional” shares. However, it was not feasible to select
share classes in this manner because of regional differences in share-class topology. Furthermore, we
believe the primary differences between share-class selection approaches resolve to cost. Given that we
included fees in all of our regressions, we believe our analysis controls for any fund flow disparities
related to fee differences (stemming from share-class differences or otherwise).
We further restrict our analysis to funds that possessed monthly returns and funds that are categorized
into a Morningstar broad asset class. We further filter out any funds that do not have Net Assets or are
less than one month old.
We remove funds that are associated with the following Morningstar Categories: Trading – Inverse
Equity, Trading – Leverage Equity, Managed Futures, Bear Market, Multialternative, Long/Short Equity,
and Volatility. We do not include any ETFs or leveraged/inverse funds in our sample, though we do allow
index mutual funds. Our rationale is that fund flows into products in ETFs and the categories above more
likely represent responses to information other than the specific fundamentals of the funds themselves.
Since the goal of our study is to learn about investor preferences for fund-level fundamentals, we felt
including these ETFs and trading/alternative categories would cloud our ability to discern these
preferences.
Page 20 of 33
Morningstar Research | November 2015
Our sample does not suffer from survivorship bias. Morningstar’s global fund databases retain a full
history of dead funds, and these funds are included in our sample. Moreover, our evaluation technique
dynamically incorporates monthly changes in fund universe composition, providing a more holistic and
realistic picture of historical performance. Each monthly snapshot captures any funds that were
subsequently merged or liquidated away.
Regression Coefficients
The control variables in our regressions are important to understand. All continuous explanatory variables
are winsorized at the 99% level and standardized to standard deviation units (mean 0, standard deviation
1) cross-sectionally by date and asset class. No imputation was performed on any observable data.
Turnover Ratio and Style Tilts were the only exceptions to the imputation routine as explained in detail
below.
Performance
Morningstar Rating for Funds:
The Morningstar Rating™ is a quantitative assessment of a fund’s past performance—both return and
risk—as measured from 1 to 5 stars. It uses focused comparison groups to better measure fund
manager skill on an after-fee basis. The peer group for each fund’s rating is its Morningstar Category™.
Ratings are based on funds’ risk-adjusted returns. Funds must first have a minimum three-year track
record. Performance is then assessed after fees and on a risk-adjusted basis. The Morningstar Rating
rewards long-term consistent performance, low volatility of returns, and low fees--aspirational areas for
the typical investor. More information can be found at this link.
For the purposes of this study, we define dummy variables for the level of the star rating that take the
value 1 when a fund is rated a specific level for month t and 0 otherwise. Star Ratings can take on values
of 1 star, 2 stars, 3- stars, 4 stars, and 5 stars. Star Ratings are typically published three business days
after month-end. It could be argued, therefore, that any results obtained by using Star Ratings as of time
t to predict flows at time t+1 will not represent an appropriate insight. We recognize this and sought to
insulate our study from this criticism in addition to any potential look-ahead bias. Therefore, we use Star
Ratings as of time t-1 to test the efficacy of the rating system in terms of predicting flows. Therefore, the
rating information would have been available for nearly a month, allowing plenty of time for investors to
act on this information.
Alpha and Style Tilts:
Equity funds: We run rolling three-year regressions of a fund’s return onto the region-appropriate Fama-
French-Carhart factors–RMRF, HML, SMB, and UMD. All returns, which we source from the French data
library, are in U.S. dollars, include dividends and capital gains, and are not continuously compounded. We
select region-appropriate factors based on each fund’s Morningstar Category classification, which is
based in turn on the fund’s portfolio holdings data. For example, funds that invest in the stocks of U.S.
large-capitalization firms are classified into the U.S. Large Blend category. The Fama-French-Carhart
factors are calculated for each of the following regions: Global, Global ex-U.S., Europe, Japan, Asia
Pacific ex-Japan, and North America. Each regional set of factors will contain the following:
Page 21 of 33
Morningstar Research | November 2015
• RMRF (also known as “excess return on the market”) is the excess return of the region-
specific market portfolio, which is calculated as that market’s market-cap weighted portfolio
return minus the regional risk-free rate (that is, the one-month T-bill in the U.S.).
• SMB (“small minus big”) and HML (“high minus low”) portfolio returns represent factor
portfolios designed to proxy a common risk in equity returns arising from cross-sectional
differences in market capitalization and valuation. To construct the SMB and HML factors,
stocks in a region are sorted into two market-cap and three book/market equity (B/M) groups
at the end of each June. “Big” stocks are those in the top 90% of June market cap for the
region, and “small” stocks are those in the bottom 10%. The B/M breakpoints for a region are
the 30th and 70th percentiles of B/M for that region’s “big” stocks.
• SMB is the equal-weight average of the returns on the three “small” stock portfolios
for the region minus the average of the returns on the three “big” stock portfolios.
• HML is the equal-weight average of the returns for the two high B/M portfolios for a
region minus the average of the returns for the two low B/M portfolios.
• UMD (“up minus down”) is a factor portfolio designed to proxy an observed return
pattern of momentum in equities where recent winners keep winning and recent
losers keep losing. The 2x3 sorts on size and lagged momentum to construct UMD
are similar, but the size-momentum portfolios are formed monthly. For portfolios
formed at the end of month t–1, the lagged momentum return is a stock's
cumulative return for month t–12 to month t–2. The momentum breakpoints for a
region are the 30th and 70th percentiles of the lagged momentum returns of the
“big” stocks of the region. UMD is the equal-weight average of the returns for the
two winner portfolios for a region minus the average of the returns for the two loser
portfolios.
The regression rolls monthly–providing a set of factor betas, alpha, and R-squared each month estimated
from the prior 36 months’ experience. The equity asset class regression takes the form:
𝑟𝑖,𝑡 = 𝛼𝑖 + 𝛽𝑖𝑟𝑟𝑟𝑟𝑅𝑅𝑅𝑅𝑡 + 𝛽𝑖ℎ𝑟𝑚𝐻𝑅𝐻𝑡 + 𝛽𝑖𝑠𝑟𝑠𝑆𝑅𝑆𝑡 + 𝛽𝑖𝑢𝑟𝑢𝑈𝑅𝑈𝑡 + 𝑒𝑖,𝑡
Subsequently, we use the estimated time-series of factor alphas and betas above
�𝛼𝑖 , 𝛽𝑖𝑟𝑟𝑟𝑟 ,𝛽𝑖ℎ𝑟𝑚 ,𝛽𝑖𝑠𝑟𝑠 ,𝛽𝑖𝑢𝑟𝑢� as our explanatory variables in our cross-sectional regressions. For
simplicity, we refer to these in our write-ups and charts as Alpha (𝛼𝑖), Market Beta �𝛽𝑖𝑟𝑟𝑟𝑟�, Value
Beta �𝛽𝑖ℎ𝑟𝑚�, Size Beta �𝛽𝑖𝑠𝑟𝑠�, and Momentum Beta �𝛽𝑖𝑢𝑟𝑢�.
Fixed income and balanced funds: We run rolling three-year regressions of a fund’s return onto the
region-appropriate Fama-French factors – RMRF, HML, and SMB – as well as TERM and DEF factor
series, which we compute in a manner consistent with that set forth in Chen, Roll, and Ross (1986) and
Fama-French (1993).
• TERM (“term premium”) is a factor portfolio designed to proxy a common risk in bond returns
arising from unexpected changes in interest rates. The portfolio return is calculated by going
long the Barclays Capital U.S. Treasury 10-20 Year TR USD Index and short the Barclays Capital
U.S. Treasury Bill 1-3 Month TR USD Index.

Page 22 of 33
Morningstar Research | November 2015
• DEF (“default”) is a factor portfolio designed to proxy a common risk in bond returns arising
from shifts in economic conditions that could change the likelihood of default. The portfolio
return is calculated by going long the Barclays Capital U.S. Corporate High Yield TR USD Index
and short the Barclays Capital U.S. Government TR USD Index.
The regression rolls monthly–providing a set of factor betas, alpha, and R-squared each month estimated
from the prior 36 months’ experience. The fixed income and balanced asset class returns-based style-
analysis regression takes the form:
𝑟𝑖,𝑡 = 𝛼 + 𝛽𝑖𝑟𝑟𝑟𝑟𝑅𝑅𝑅𝑅𝑡 + 𝛽𝑖ℎ𝑟𝑚𝐻𝑅𝐻𝑡 + 𝛽𝑖𝑠𝑟𝑠𝑆𝑅𝑆𝑡 + 𝛽𝑖𝑡𝑡𝑟𝑟𝑇𝑇𝑅𝑅𝑡 + 𝛽𝑖
𝑢𝑡𝑟𝑈𝑇𝑅𝑡 + 𝑒𝑖,𝑡
Subsequently, we use the estimated time-series of factor betas above
�𝛼𝑖 , 𝛽𝑖𝑟𝑟𝑟𝑟 ,𝛽𝑖ℎ𝑟𝑚 ,𝛽𝑖𝑠𝑟𝑠 ,𝛽𝑖𝑡𝑡𝑟𝑟,𝛽𝑖
𝑢𝑡𝑟� as our explanatory variables in our cross-sectional regressions.
For simplicity, we refer to these in our write-ups and charts as Alpha (𝛼𝑖), Market Beta �𝛽𝑖𝑟𝑟𝑟𝑟�, Value
Beta �𝛽𝑖ℎ𝑟𝑚�, Size Beta �𝛽𝑖𝑠𝑟𝑠�, Duration Beta (𝛽𝑖𝑡𝑡𝑟𝑟), and Credit Beta �𝛽𝑖𝑢𝑡𝑟�.
To estimate a fund’s beta to the factors above, we require 36-months of return history. For those funds
that do not have 36-months of return history, they will not have their own set of factor betas, alphas, or
R-squared. In this case, we impute the Morningstar Category average value by date. Once the fund
passes the 36-month mark, we stop the imputation.
Degree of Passive: From the above regressions, we also obtain a time-series of R-squared values for each fund over the
past three years. These R-squared values can be interpreted as the degree to which a fund’s return
profile is fully captured by known and achievable sources of return. Higher R-squared values indicate that
a fund’s return profile is not very unique and can be easily replicated. Therefore, we interpret these
values as the degree of passiveness that fund has exhibited over the past three years. Lower values
indicate a greater degree of active behavior.
Price
Net Expense Ratio Equivalent: Different regions have different reporting requirements for mutual fund expenses. For example, in the
U.S., Net Expense Ratio is the most commonly used data point that encompasses all fees levied on the
investor over the past year, including performance-based fees. In the United Kingdom and Europe,
Ongoing Charge is the most commonly used data point to express fees levied on investors in the past
year. Unlike Net Expense Ratio, Ongoing Charge does not include performance-based fees. Therefore, to
harmonize net expense ratios of U.S., U.K., and Europe-domiciled funds, we add back in performance
fees to the Ongoing Charge.
For Fund of Funds, we also included acquired fund expenses.
For all domiciles in our purview, we do our best to harmonize fee-reporting differences across
geographies using the following mapping procedure:
Page 23 of 33
Morningstar Research | November 2015
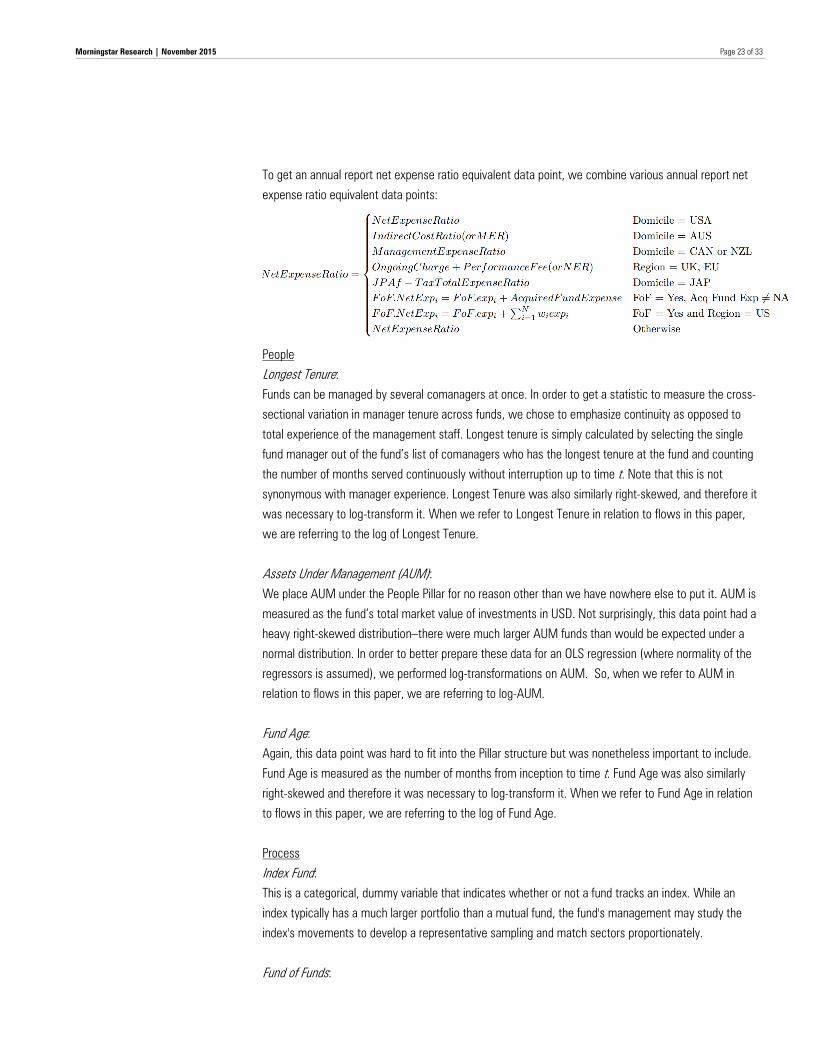
To get an annual report net expense ratio equivalent data point, we combine various annual report net
expense ratio equivalent data points:
People
Longest Tenure:
Funds can be managed by several comanagers at once. In order to get a statistic to measure the cross-
sectional variation in manager tenure across funds, we chose to emphasize continuity as opposed to
total experience of the management staff. Longest tenure is simply calculated by selecting the single
fund manager out of the fund’s list of comanagers who has the longest tenure at the fund and counting
the number of months served continuously without interruption up to time t. Note that this is not
synonymous with manager experience. Longest Tenure was also similarly right-skewed, and therefore it
was necessary to log-transform it. When we refer to Longest Tenure in relation to flows in this paper,
we are referring to the log of Longest Tenure.
Assets Under Management (AUM): We place AUM under the People Pillar for no reason other than we have nowhere else to put it. AUM is
measured as the fund’s total market value of investments in USD. Not surprisingly, this data point had a
heavy right-skewed distribution–there were much larger AUM funds than would be expected under a
normal distribution. In order to better prepare these data for an OLS regression (where normality of the
regressors is assumed), we performed log-transformations on AUM. So, when we refer to AUM in
relation to flows in this paper, we are referring to log-AUM.
Fund Age:
Again, this data point was hard to fit into the Pillar structure but was nonetheless important to include.
Fund Age is measured as the number of months from inception to time t. Fund Age was also similarly
right-skewed and therefore it was necessary to log-transform it. When we refer to Fund Age in relation
to flows in this paper, we are referring to the log of Fund Age.
Process
Index Fund:
This is a categorical, dummy variable that indicates whether or not a fund tracks an index. While an
index typically has a much larger portfolio than a mutual fund, the fund's management may study the
index's movements to develop a representative sampling and match sectors proportionately.
Fund of Funds:
Page 24 of 33
Morningstar Research | November 2015
This is a categorical, dummy variable that indicates whether or not a fund is structured as a fund of
funds--a fund that specializes in buying shares in other mutual funds rather than individual securities.
Quite often this type of fund is not discernible from its name alone but rather through prospectus
wording (that is, the fund's charter).
Socially Responsible Fund:
This is a categorical, dummy variable that indicates whether or not a fund has identified itself as socially
conscious. This data point indicates if the fund selectively invests based on certain noneconomic
principles. Such funds may make investments based on such issues as environmental responsibility,
human rights, or religious views. A socially conscious fund may take a proactive stance by selectively
investing in, for example, environmentally friendly companies or firms with good employee relations. This
group also includes funds that avoid investing in companies involved in promoting alcohol, tobacco, or
gambling, or in the defense industry.
Turnover Ratio:
There are two main methods of calculating Turnover Ratio–US SEC and UCITS. Taiwan also has unique
rules about Turnover calculations, but for simplicity, we only cover the US and UCITS rules here.
• US SEC measures the portfolio manager’s trading activity by taking the lesser of purchases or
sales (excluding all securities with maturities of less than one year) and dividing by average
monthly net assets. A turnover ratio of 100% or more does not necessarily suggest that all
securities in the portfolio have been traded. In practical terms, the resulting percentage loosely
represents the percentage of the portfolio’s holdings that have changed over the past year.
• UCITS calculates turnover ratio by (absolute value of purchases + absolute value of sales) –
(absolute value of inflows + absolute value of outflows), all divided by average net assets.
• In the absence of flows, the UCITS methodology double counts turnover. For example, if a
manager sells all the securities in the portfolio and replaces them, turnover is 200% (not
100%). The calculation is based on the assumption that all flow activity triggers trades and
that these trades should not be counted as turnover (hence the subtraction of the gross
absolute value of flows). This has important implications for how we choose to standardize
turnover ratios since the raw values will be distributed differently depending on the region
considered. U.S. funds’ Turnover Ratios are systematically lower than UCITS funds simply due
to this difference in reporting requirements. Therefore, we chose to standardize Turnover Ratio
cross-sectionally by date, asset class, and U.S./ex-U.S. regional distinctions.
• Furthermore, for the purposes of the analysis, we very much wanted to include Turnover Ratio
as one proxy for a fund’s degree of activeness. However, in Asia, the availability of Turnover
Ratio data is extremely sparse (<5% of the population). Therefore, we decided to impute
broad asset class average Turnover Ratio values onto Asian funds by date. This retained the
ability to both include Asian funds in our sample and Turnover Ratio as an explanatory data
globally.
Portfolio Concentration:
This is the aggregate assets, expressed as a percentage, of the fund's top 10 portfolio holdings. This
figure is meant to be a measure of portfolio concentration, making it potentially indicative of manager

Page 25 of 33
Morningstar Research | November 2015
conviction or fund risk. Specifically, the higher the percentage, the more concentrated the fund is in a
few companies or issues, the more the fund is susceptible to the market fluctuations in these few
holdings, and the more likely the manager has a strong belief in the future prospects of these holdings.
Cash and cash equivalents are generally not included in this calculation. (An exception is made for
money market portfolios.)
Number of Holdings:
This is the net number of holdings in the portfolio. It is also an alternative measure of portfolio
concentration.
Parent
Asset-Weighted Manager Tenure:
The firm-level tenure number is an asset-weighted average of the longest manager tenure of each fund
assigned to the firm. The tenure number at the fund level is the number of months the current manager
has been on the fund. For funds with more than one manager, the tenure of the manager who has been
with the fund the longest is used in the calculation.
Success Ratio:
Success ratio measures the percentage of a provider company's open-end mutual funds with a
Morningstar Category rank of less than 50 over the five-year period through the previous month's end.
Average Net Expense Ratio Rank:
The firm-level fee number is an equal-weighted average of the net expense ratio equivalent data point
ranked by Morningstar Category of each fund assigned to the firm. Net Expense Ratios are defined per
the definition in the preceding sections and ranked by Morningstar Category. Each fund’s fee rank is then
averaged to arrive at a firmwide estimate of the typical, relative cost of their fund lineup.
Firm AUM:
The firm-level AUM number is a simple summation of each fund’s AUM ($) assigned to the firm. Firm-
level AUM is expressed in USD.
Model Methodology
To evaluate the fund-specific drivers of flows, we employ a series of monthly cross-sectional regressions.
Each month, we regress the forward one-month fund flows on a set of contemporaneous explanatory
variables. The set of explanatory variables we use for equity funds is slightly different than the set of
explanatory variables we use for fixed income and balanced funds. As so constructed, we believe that
this model offers a glimpse at the underlying decision-making process that investors go through when
choosing to allocate their money. We purposefully re-estimate the models by asset class so that we are
capturing the within-asset-class variation in fund flows rather than the between-asset-class variation.
After the investor has made a decision to allocate to equity funds, we want to know how they go about
choosing which equity funds to invest with.

Page 26 of 33
Morningstar Research | November 2015
We apply the following framework to regional and market-based subsets of the data. This framework is
applied separately by asset class to market-based groupings as follows: global, U.S., Ex-U.S., Canada,
Latin America, Europe, Cross-Border, Asia, Middle East, Africa, and Oceania. This framework is also
applied separately by asset class to regional-based groupings as follows: global, U.S., Canada, U.K.,
Eurozone, Developed Asia, Latin America, and Australia/NZ.
Cross-Sectional Regression:
𝑓𝑓𝑓𝑓𝑖, 𝑡+1 = 𝛾 + 𝛺𝑡𝑆𝑆𝑆𝑟𝑆𝑖,𝑡−1 + 𝜙𝑡𝑍𝑖,𝑡 + 𝜆𝑡𝑋𝑖,𝑡 + 𝜀𝑖,𝑡+1
Where 𝑓𝑓𝑓𝑓𝑖 , 𝑡+1 is defined as the organic growth rate of the fund’s net assets from month t to month
t+1, 𝑆𝑆𝑆𝑟𝑆𝑖 is a vector of star-rating dummy variables at time t-1. 𝑍𝑖 is a vector of returns-based style
analysis variables obtained over from t-36 months ago to time t. 𝑋𝑖 is vector of explanatory
characteristics at time t.
The vector of returns-based style analysis variables, 𝑍𝑖, is estimated uniquely by fund from a regression
on the prior 36 months of returns. The regression rolls monthly–providing a set of factor betas, alpha,
and R-squared each month estimated from the prior 36 months’ experience. The factors included in the
regression change depending on the broad asset class considered.
The equity asset class returns-based style-analysis regression takes the form:
𝑟𝑖,𝑡 = 𝛼 + 𝛽𝑖𝑟𝑟𝑟𝑟𝑅𝑅𝑅𝑅𝑡 + 𝛽𝑖ℎ𝑟𝑚𝐻𝑅𝐻𝑡 + 𝛽𝑖𝑠𝑟𝑠𝑆𝑅𝑆𝑡 + 𝛽𝑖𝑢𝑟𝑢𝑈𝑅𝑈𝑡 + 𝑒𝑖,𝑡
The fixed income and balanced asset class returns-based style-analysis regression takes the form:
𝑟𝑖,𝑡 = 𝛼 + 𝛽𝑖𝑟𝑟𝑟𝑟𝑅𝑅𝑅𝑅𝑡 + 𝛽𝑖ℎ𝑟𝑚𝐻𝑅𝐻𝑡 + 𝛽𝑖𝑠𝑟𝑠𝑆𝑅𝑆𝑡 + 𝛽𝑖𝑡𝑡𝑟𝑟𝑇𝑇𝑅𝑅𝑡 + 𝛽𝑖
𝑢𝑡𝑟𝑈𝑇𝑅𝑡 + 𝑒𝑖,𝑡
The contents of the vectors -𝑆𝑆𝑆𝑟𝑆𝑖, 𝑍𝑖, 𝑋𝑖 are as follows: 𝑺𝑺𝑺𝑺𝑺𝒊 𝒁𝒊 𝑿𝒊
1 Star (yes/no) Alpha Net Expense Ratio 2 Stars (yes/no) Market Beta AUM 3 Stars (yes/no) Value Beta Fund Age 4 Stars (yes/no) Size Beta Manager Tenure 5 Stars (yes/no) Momentum Beta (equity only) Index Fund (yes/no)
Credit Beta (fixed income and balanced only)
Fund of Funds (yes/no)
Duration Beta (fixed income and balanced only)
Socially Responsible Fund (yes/no)
R-Squared Turnover Ratio Portfolio Concentration Number of Holdings Firm-Level Average Tenure Success Ratio Firm-Level Average Expense Ratio Firm AUM

Page 27 of 33
Morningstar Research | November 2015
How to Obtain Final Estimates:
Cross-sectional regressions, as specified above, are run each month. As a result, we are left with several
vectors of coefficients on each date estimated from each model. For example, we have a matrix 𝑆�⃑ that
collects the time-series of estimated coefficients from t=1 to t=T for each vector:
𝑆�⃑ = �𝛺1 𝜙1 𝜆1⋮ ⋮ ⋮𝛺𝑇 𝜙𝑇 𝜆𝑇
�
Then, the final estimates of the coefficient vectors 𝛺,𝜙, 𝜆 are averages across time:
𝛺� =1𝑇� 𝛺𝑡�
𝑇
𝑡=1
𝜙� =1𝑇� 𝜙𝑡�
𝑇
𝑡=1
�̂� =1𝑇� 𝜆𝑡�
𝑇
𝑡=1
Standard errors are assumed to be uncorrelated over time:
𝜎�𝛺�� =1𝑇𝑣𝑆𝑟(𝛺𝑡) =
1𝑇2
� �𝛺𝑡� − 𝛺�2𝑇
𝑡=1
𝜎�𝜙�� =1𝑇𝑣𝑆𝑟(𝜙𝑡) =
1𝑇2
� �𝜙𝑡� − 𝜙�2𝑇
𝑡=1
𝜎��̂�� =1𝑇𝑣𝑆𝑟(𝜆𝑡) =
1𝑇2
� �𝜆𝑡� − 𝜆�2𝑇
𝑡=1
References
Our methodology uses the regression approach pioneered in Fama and MacBeth (1973) to easily
calculate standard errors that correct for correlation across assets. Furthermore, using the approach
found in Fama and MacBeth (1973), we are able to easily build models in which the independent
variables change over time.
Fama, E.F. & MacBeth, J.D. 1973. "Risk, Return, and Equilibrium: Empirical Tests." Journal of Political Economy, Vol. 81, P. 607–636.
Chen, N., Roll, R., & Ross, S.A.. 1986. “Economic Forces and the Stock Market.” Journal of Business, Vol.
59, P. 383-403.
Fama, E.F., French, K.R. 1993. “Common Risk Factors in the Returns on Stocks and Bonds.” Journal of Financial Economics, Vol. 33, P. 3-56.
Johnson, B., & Rawson, M. 2015. 2015 Fee Study: Investors Are Driving Expense Ratios Down.
http://news.morningstar.com/pdfs/2015_fee_study.pdf
Morningstar Rating Methodology. June 30, 2009.
http://hk.morningstar.com/ODS_Images/Morningstar_Rating_Methodology_20090630.pdf
Yang, J., & Lutton, L.P. 2014. 2014 Target-Date Series Research Paper.

Page 28 of 33
Morningstar Research | November 2015
http://corporate.morningstar.com/us/documents/MethodologyDocuments/MethodologyPapers/2014-
Target-Date-Series-Research-Paper.pdf
Morningstar Cash Flow Methodology. Oct. 31, 2011.
http://corporate.morningstar.com/us/documents/Direct/MorningstarCashFlowMethodology.pdf
Data Tables
In the table below, we show the aggregated monthly cross-sectional regression results. Coefficients are
expressed in percentage terms and are bolded when statistically significant at the 5% level. Below the
coefficients, t-statistics are presented in parenthesis. Coefficients can be interpreted as the change in
the monthly organic growth rate of a fund given a one-standard deviation increase in the factor or, for
the cases of dummy variables, when the factor is True. The models were re-estimated globally and by
marketplace–global ex-U.S., U.S., Europe, Cross-Border, Canada, and Asia. For fixed-income and
balanced funds, we do not present results for Asia because of lack of data availability.

Page 29 of 33
Morningstar Research | November 2015
Exhibit 14. Equity Asset-Class Results by Region Factors All
Global Ex-U.S.
United States Europe
Cross-Border Canada Asia
Intercept 3.12% 2.06% 3.58% 3.81% 2.22% 1.84% -1.03% (22.38) (19.91) (25.42) (15.9) (15.62) (10.63) (-4.64)
1 Star -1.40% -0.34% -2.32% -1.94% -0.80% -0.20% 1.88% (-15.06) (-3.41) (-25.49) (-12.6) (-5.79) (-1.17) (7.41)
2 Stars -1.16% -0.04% -2.05% -1.72% -0.49% 0.20% 1.97% (-14.26) (-0.45) (-27.35) (-11.55) (-4.41) (1.23) (7.66)
3 Stars -0.68% 0.13% -1.45% -1.72% -0.24% 0.27% 2.14% (-8.88) (1.62) (-19.83) (-11.7) (-2.21) (1.91) (8.8)
4 Stars 0.14% 0.59% -0.44% -1.33% 0.41% 0.60% 2.20% (1.99) (7.93) (-5.83) (-8.8) (3.78) (4.5) (9.35)
5 Stars 1.30% 1.38% 0.96% -0.92% 1.73% 1.39% 2.54% (17.51) (16.66) (10.84) (-5.25) (14.55) (10.89) (10.18)
Market Beta 0.03% -0.09% 0.27% 0.09% 0.13% -0.06% -0.21% (0.74) (-2.16) (3.69) (2.12) (1.79) (-1.43) (-2.58)
Size Beta 0.01% -0.02% 0.04% 0.00% -0.06% -0.05% -0.30% (0.15) (-0.66) (0.92) (-0.03) (-1.06) (-0.82) (-4.87)
Value Beta 0.26% -0.03% 0.34% 0.00% 0.15% -0.08% 0.14% (5.28) (-0.89) (6.18) (0.05) (3.27) (-1.78) (2.9)
Momentum Beta 0.22% 0.08% 0.19% 0.07% 0.03% -0.02% 0.27% (4.63) (1.88) (3.99) (1.71) (0.47) (-0.47) (3.96)
Alpha 0.94% 0.88% 1.11% 0.86% 1.29% 1.06% 0.41% (20.12) (20.09) (21.01) (18.17) (16.55) (14.2) (5.77)
R-Squared 0.27% 0.10% 0.12% 0.01% -0.24% 0.37% -0.71% (5.26) (2.1) (1.96) (0.22) (-3.82) (4.91) (-7.24)
Net Expense Ratio -0.45% -0.11% -0.93% 0.02% -0.04% 0.11% -0.57% (-12.51) (-3.96) (-21.55) (0.59) (-0.79) (1.88) (-6.03)
AUM -1.68% -1.77% -1.56% -1.72% -2.10% -1.16% -2.00% (-43.79) (-42.52) (-33.17) (-23.34) (-42.27) (-17.64) (-15.93)
Fund Age -2.77% -2.95% -2.42% -1.81% -2.59% -3.77% -3.30% (-31.24) (-24.37) (-35.13) (-14.81) (-27.26) (-21.64) (-9.26)
Longest Tenure 0.29% 0.31% 0.23% 0.14% 0.27% 0.35% 0.31% (15.97) (14.68) (11.56) (4.95) (8.51) (9.21) (4.31)
Index Fund 0.67% 0.45% 0.84% 0.15% 0.47% 0.94% 2.25% (6.26) (5.66) (5.44) (1.51) (2.69) (4.08) (4.24)
Fund of Funds 0.39% 0.15% 0.36% 0.12% 0.27% -1.22% -0.16% (0.77) (1.78) (6.13) (1.11) (1.92) (-7.82) (-0.81)
Socially Responsible Fund
0.40% 0.19% 0.65% 0.08% 0.68% -0.12% -0.82% (4.53) (2.71) (6.28) (1.1) (4.79) (-0.6) (-2.64)
Turnover Ratio 0.41% -0.06% 0.68% -0.10% -0.10% 0.13% - (7.73) (-2.84) (10.5) (-4.02) (-3.76) (2.27) (0)
Portfolio Concentration -0.12% -0.30% 0.00% -0.26% -0.22% 0.08% -0.24% (-3.32) (-7.01) (0.04) (-6.7) (-3.29) (1.18) (-3.16)
Source: Morningstar Research
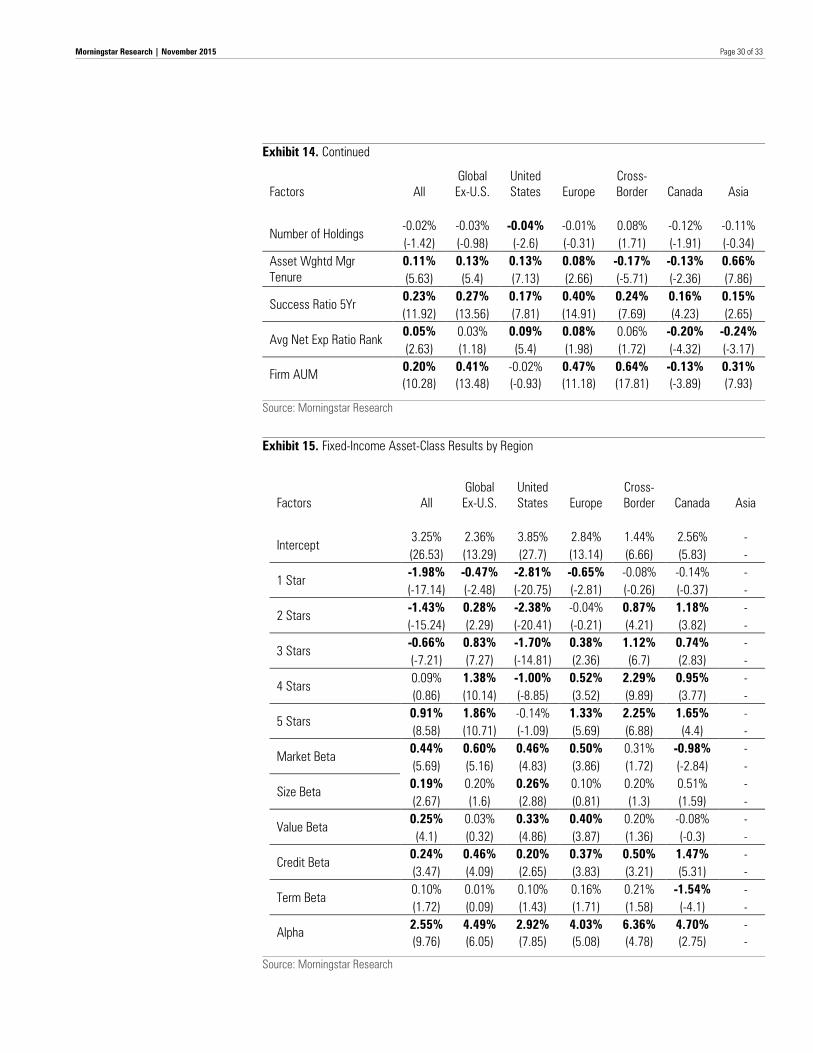
Page 30 of 33
Morningstar Research | November 2015
Exhibit 14. Continued Factors All
Global Ex-U.S.
United States Europe
Cross-Border Canada Asia
Number of Holdings -0.02% -0.03% -0.04% -0.01% 0.08% -0.12% -0.11% (-1.42) (-0.98) (-2.6) (-0.31) (1.71) (-1.91) (-0.34)
Asset Wghtd Mgr Tenure
0.11% 0.13% 0.13% 0.08% -0.17% -0.13% 0.66% (5.63) (5.4) (7.13) (2.66) (-5.71) (-2.36) (7.86)
Success Ratio 5Yr 0.23% 0.27% 0.17% 0.40% 0.24% 0.16% 0.15% (11.92) (13.56) (7.81) (14.91) (7.69) (4.23) (2.65)
Avg Net Exp Ratio Rank 0.05% 0.03% 0.09% 0.08% 0.06% -0.20% -0.24% (2.63) (1.18) (5.4) (1.98) (1.72) (-4.32) (-3.17)
Firm AUM 0.20% 0.41% -0.02% 0.47% 0.64% -0.13% 0.31% (10.28) (13.48) (-0.93) (11.18) (17.81) (-3.89) (7.93)
Source: Morningstar Research
Exhibit 15. Fixed-Income Asset-Class Results by Region
Factors All Global Ex-U.S.
United States Europe
Cross-Border Canada Asia
Intercept 3.25% 2.36% 3.85% 2.84% 1.44% 2.56% - (26.53) (13.29) (27.7) (13.14) (6.66) (5.83) -
1 Star -1.98% -0.47% -2.81% -0.65% -0.08% -0.14% - (-17.14) (-2.48) (-20.75) (-2.81) (-0.26) (-0.37) -
2 Stars -1.43% 0.28% -2.38% -0.04% 0.87% 1.18% - (-15.24) (2.29) (-20.41) (-0.21) (4.21) (3.82) -
3 Stars -0.66% 0.83% -1.70% 0.38% 1.12% 0.74% - (-7.21) (7.27) (-14.81) (2.36) (6.7) (2.83) -
4 Stars 0.09% 1.38% -1.00% 0.52% 2.29% 0.95% - (0.86) (10.14) (-8.85) (3.52) (9.89) (3.77) -
5 Stars 0.91% 1.86% -0.14% 1.33% 2.25% 1.65% - (8.58) (10.71) (-1.09) (5.69) (6.88) (4.4) -
Market Beta 0.44% 0.60% 0.46% 0.50% 0.31% -0.98% - (5.69) (5.16) (4.83) (3.86) (1.72) (-2.84) -
Size Beta 0.19% 0.20% 0.26% 0.10% 0.20% 0.51% - (2.67) (1.6) (2.88) (0.81) (1.3) (1.59) -
Value Beta 0.25% 0.03% 0.33% 0.40% 0.20% -0.08% - (4.1) (0.32) (4.86) (3.87) (1.36) (-0.3) -
Credit Beta 0.24% 0.46% 0.20% 0.37% 0.50% 1.47% - (3.47) (4.09) (2.65) (3.83) (3.21) (5.31) -
Term Beta 0.10% 0.01% 0.10% 0.16% 0.21% -1.54% - (1.72) (0.09) (1.43) (1.71) (1.58) (-4.1) -
Alpha 2.55% 4.49% 2.92% 4.03% 6.36% 4.70% - (9.76) (6.05) (7.85) (5.08) (4.78) (2.75) -
Source: Morningstar Research
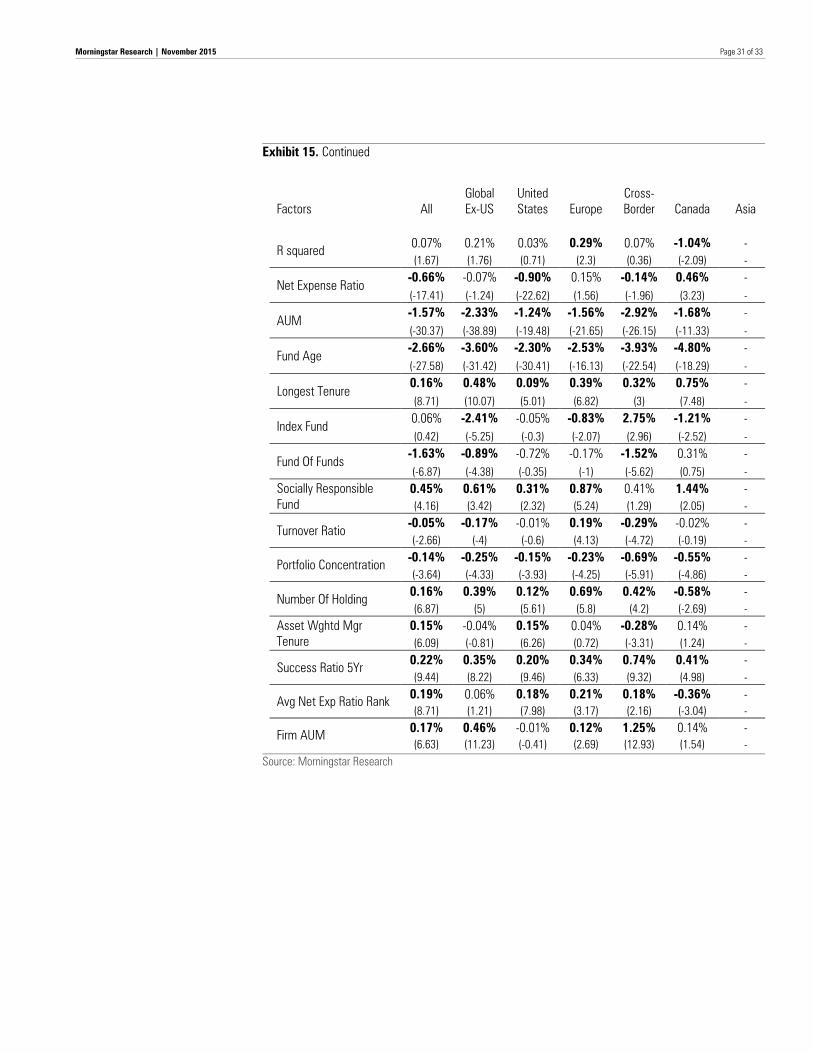
Page 31 of 33
Morningstar Research | November 2015
Exhibit 15. Continued
Factors All Global Ex-US
United States Europe
Cross-Border Canada Asia
R squared 0.07% 0.21% 0.03% 0.29% 0.07% -1.04% - (1.67) (1.76) (0.71) (2.3) (0.36) (-2.09) -
Net Expense Ratio -0.66% -0.07% -0.90% 0.15% -0.14% 0.46% - (-17.41) (-1.24) (-22.62) (1.56) (-1.96) (3.23) -
AUM -1.57% -2.33% -1.24% -1.56% -2.92% -1.68% - (-30.37) (-38.89) (-19.48) (-21.65) (-26.15) (-11.33) -
Fund Age -2.66% -3.60% -2.30% -2.53% -3.93% -4.80% - (-27.58) (-31.42) (-30.41) (-16.13) (-22.54) (-18.29) -
Longest Tenure 0.16% 0.48% 0.09% 0.39% 0.32% 0.75% - (8.71) (10.07) (5.01) (6.82) (3) (7.48) -
Index Fund 0.06% -2.41% -0.05% -0.83% 2.75% -1.21% - (0.42) (-5.25) (-0.3) (-2.07) (2.96) (-2.52) -
Fund Of Funds -1.63% -0.89% -0.72% -0.17% -1.52% 0.31% - (-6.87) (-4.38) (-0.35) (-1) (-5.62) (0.75) -
Socially Responsible Fund
0.45% 0.61% 0.31% 0.87% 0.41% 1.44% - (4.16) (3.42) (2.32) (5.24) (1.29) (2.05) -
Turnover Ratio -0.05% -0.17% -0.01% 0.19% -0.29% -0.02% - (-2.66) (-4) (-0.6) (4.13) (-4.72) (-0.19) -
Portfolio Concentration -0.14% -0.25% -0.15% -0.23% -0.69% -0.55% - (-3.64) (-4.33) (-3.93) (-4.25) (-5.91) (-4.86) -
Number Of Holding 0.16% 0.39% 0.12% 0.69% 0.42% -0.58% - (6.87) (5) (5.61) (5.8) (4.2) (-2.69) -
Asset Wghtd Mgr Tenure
0.15% -0.04% 0.15% 0.04% -0.28% 0.14% - (6.09) (-0.81) (6.26) (0.72) (-3.31) (1.24) -
Success Ratio 5Yr 0.22% 0.35% 0.20% 0.34% 0.74% 0.41% - (9.44) (8.22) (9.46) (6.33) (9.32) (4.98) -
Avg Net Exp Ratio Rank 0.19% 0.06% 0.18% 0.21% 0.18% -0.36% - (8.71) (1.21) (7.98) (3.17) (2.16) (-3.04) -
Firm AUM 0.17% 0.46% -0.01% 0.12% 1.25% 0.14% - (6.63) (11.23) (-0.41) (2.69) (12.93) (1.54) -
Source: Morningstar Research
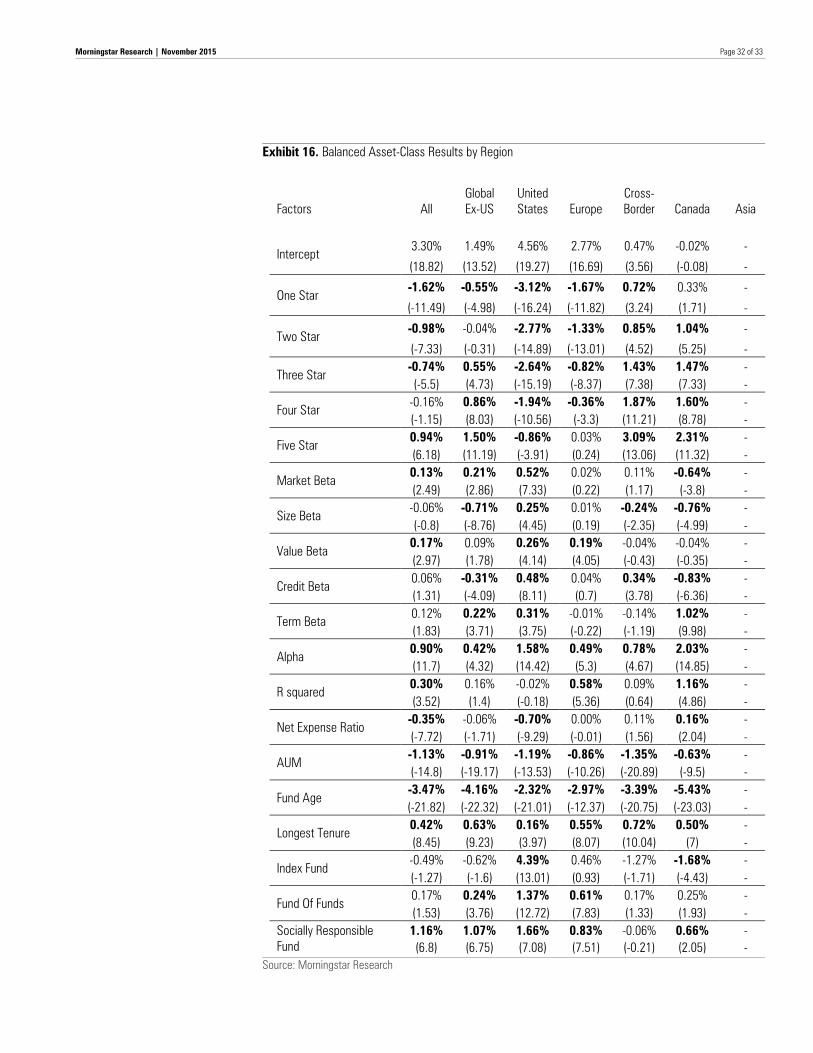
Page 32 of 33
Morningstar Research | November 2015
Exhibit 16. Balanced Asset-Class Results by Region
Factors All Global Ex-US
United States Europe
Cross-Border Canada Asia
Intercept 3.30% 1.49% 4.56% 2.77% 0.47% -0.02% -
(18.82) (13.52) (19.27) (16.69) (3.56) (-0.08) -
One Star -1.62% -0.55% -3.12% -1.67% 0.72% 0.33% -
(-11.49) (-4.98) (-16.24) (-11.82) (3.24) (1.71) -
Two Star -0.98% -0.04% -2.77% -1.33% 0.85% 1.04% -
(-7.33) (-0.31) (-14.89) (-13.01) (4.52) (5.25) -
Three Star -0.74% 0.55% -2.64% -0.82% 1.43% 1.47% - (-5.5) (4.73) (-15.19) (-8.37) (7.38) (7.33) -
Four Star -0.16% 0.86% -1.94% -0.36% 1.87% 1.60% - (-1.15) (8.03) (-10.56) (-3.3) (11.21) (8.78) -
Five Star 0.94% 1.50% -0.86% 0.03% 3.09% 2.31% - (6.18) (11.19) (-3.91) (0.24) (13.06) (11.32) -
Market Beta 0.13% 0.21% 0.52% 0.02% 0.11% -0.64% - (2.49) (2.86) (7.33) (0.22) (1.17) (-3.8) -
Size Beta -0.06% -0.71% 0.25% 0.01% -0.24% -0.76% - (-0.8) (-8.76) (4.45) (0.19) (-2.35) (-4.99) -
Value Beta 0.17% 0.09% 0.26% 0.19% -0.04% -0.04% - (2.97) (1.78) (4.14) (4.05) (-0.43) (-0.35) -
Credit Beta 0.06% -0.31% 0.48% 0.04% 0.34% -0.83% - (1.31) (-4.09) (8.11) (0.7) (3.78) (-6.36) -
Term Beta 0.12% 0.22% 0.31% -0.01% -0.14% 1.02% - (1.83) (3.71) (3.75) (-0.22) (-1.19) (9.98) -
Alpha 0.90% 0.42% 1.58% 0.49% 0.78% 2.03% - (11.7) (4.32) (14.42) (5.3) (4.67) (14.85) -
R squared 0.30% 0.16% -0.02% 0.58% 0.09% 1.16% - (3.52) (1.4) (-0.18) (5.36) (0.64) (4.86) -
Net Expense Ratio -0.35% -0.06% -0.70% 0.00% 0.11% 0.16% - (-7.72) (-1.71) (-9.29) (-0.01) (1.56) (2.04) -
AUM -1.13% -0.91% -1.19% -0.86% -1.35% -0.63% - (-14.8) (-19.17) (-13.53) (-10.26) (-20.89) (-9.5) -
Fund Age -3.47% -4.16% -2.32% -2.97% -3.39% -5.43% - (-21.82) (-22.32) (-21.01) (-12.37) (-20.75) (-23.03) -
Longest Tenure 0.42% 0.63% 0.16% 0.55% 0.72% 0.50% - (8.45) (9.23) (3.97) (8.07) (10.04) (7) -
Index Fund -0.49% -0.62% 4.39% 0.46% -1.27% -1.68% - (-1.27) (-1.6) (13.01) (0.93) (-1.71) (-4.43) -
Fund Of Funds 0.17% 0.24% 1.37% 0.61% 0.17% 0.25% - (1.53) (3.76) (12.72) (7.83) (1.33) (1.93) -
Socially Responsible Fund
1.16% 1.07% 1.66% 0.83% -0.06% 0.66% - (6.8) (6.75) (7.08) (7.51) (-0.21) (2.05) -
Source: Morningstar Research
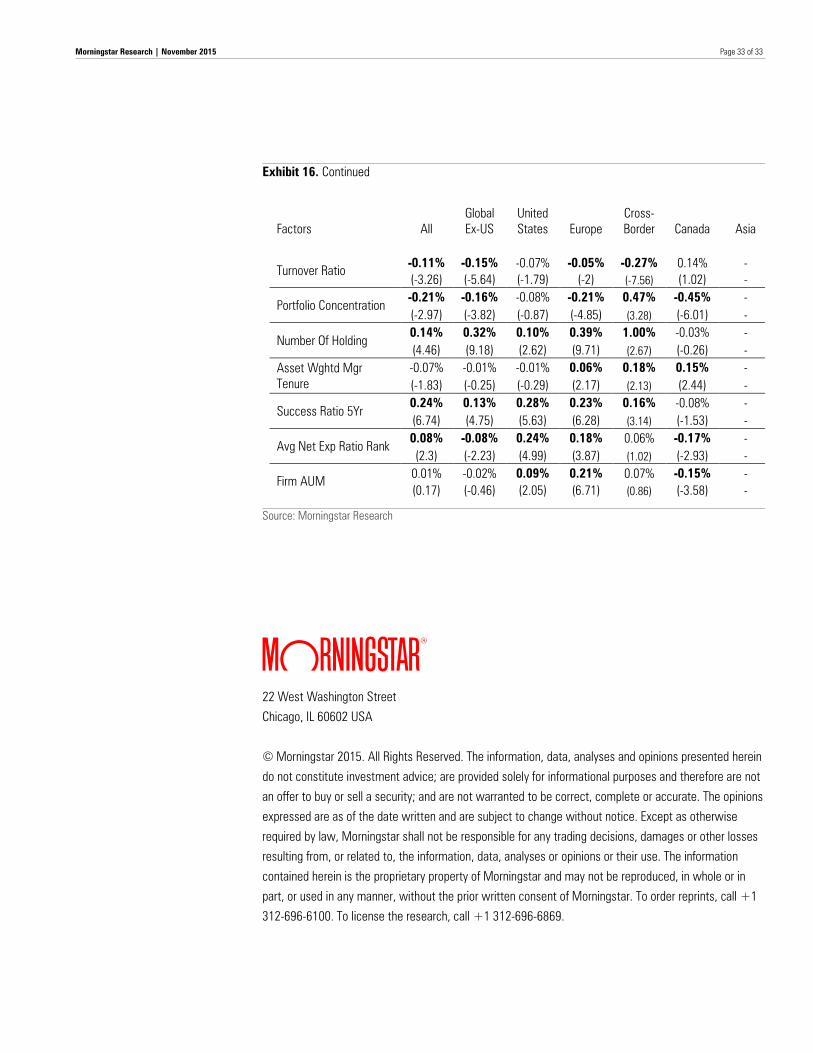
Page 33 of 33
Morningstar Research | November 2015
Exhibit 16. Continued
Factors All Global Ex-US
United States Europe
Cross-Border Canada Asia
Turnover Ratio -0.11% -0.15% -0.07% -0.05% -0.27% 0.14% - (-3.26) (-5.64) (-1.79) (-2) (-7.56) (1.02) -
Portfolio Concentration -0.21% -0.16% -0.08% -0.21% 0.47% -0.45% - (-2.97) (-3.82) (-0.87) (-4.85) (3.28) (-6.01) -
Number Of Holding 0.14% 0.32% 0.10% 0.39% 1.00% -0.03% - (4.46) (9.18) (2.62) (9.71) (2.67) (-0.26) -
Asset Wghtd Mgr Tenure
-0.07% -0.01% -0.01% 0.06% 0.18% 0.15% - (-1.83) (-0.25) (-0.29) (2.17) (2.13) (2.44) -
Success Ratio 5Yr 0.24% 0.13% 0.28% 0.23% 0.16% -0.08% - (6.74) (4.75) (5.63) (6.28) (3.14) (-1.53) -
Avg Net Exp Ratio Rank 0.08% -0.08% 0.24% 0.18% 0.06% -0.17% - (2.3) (-2.23) (4.99) (3.87) (1.02) (-2.93) -
Firm AUM 0.01% -0.02% 0.09% 0.21% 0.07% -0.15% - (0.17) (-0.46) (2.05) (6.71) (0.86) (-3.58) -
Source: Morningstar Research
? 22 West Washington Street
Chicago, IL 60602 USA
© Morningstar 2015. All Rights Reserved. The information, data, analyses and opinions presented herein
do not constitute investment advice; are provided solely for informational purposes and therefore are not
an offer to buy or sell a security; and are not warranted to be correct, complete or accurate. The opinions
expressed are as of the date written and are subject to change without notice. Except as otherwise
required by law, Morningstar shall not be responsible for any trading decisions, damages or other losses
resulting from, or related to, the information, data, analyses or opinions or their use. The information
contained herein is the proprietary property of Morningstar and may not be reproduced, in whole or in
part, or used in any manner, without the prior written consent of Morningstar. To order reprints, call +1
312-696-6100. To license the research, call +1 312-696-6869.