what factors drive transport and logistics costs in africa?
TRANSCRIPT

HAL Id: hal-03198081https://hal.uca.fr/hal-03198081
Preprint submitted on 14 Apr 2021
HAL is a multi-disciplinary open accessarchive for the deposit and dissemination of sci-entific research documents, whether they are pub-lished or not. The documents may come fromteaching and research institutions in France orabroad, or from public or private research centers.
L’archive ouverte pluridisciplinaire HAL, estdestinée au dépôt et à la diffusion de documentsscientifiques de niveau recherche, publiés ou non,émanant des établissements d’enseignement et derecherche français ou étrangers, des laboratoirespublics ou privés.
What Factors Drive transport and Logistics Costs inAfrica ?
Patrick Plane
To cite this version:
Patrick Plane. What Factors Drive transport and Logistics Costs in Africa ?. 2021. �hal-03198081�

What Factors Drive Transport and Logistics Costs in Africa?
Patrick Plane
CERDI- CNRS
Université Clermont Auvergne (UCA)
63000, Clermont-Ferrand, France
September 2020
2
Acknowledgments
The author is grateful to Simone Bertoli, Mohamed Chaffai, Jean-Louis Combes, Clive Gray, Jaime
de Melo, Camille da Piedade, Gaël Raballand, and two referees of the Journal for useful comments
on an earlier version of this paper. The usual disclaimers apply. Financial support from the Agence
Nationale de la Recherche of the French government through the program “Investissements
d'avenir “ANR-10-LABX-14-01” is gratefully acknowledged.
E-mail address. [email protected]

What Factors Drive Transport and Logistics Costs in Africa?
Abstract
We analyze the domestic transport and logistics costs of importing a 20-foot container into Africa. We
run regressions on a panel of 50 African countries for the period 2006-2014 using the RE-2SLS
estimator. Distance from port of arrival to the point of delivery is an important explanatory factor of
cost. Time-varying variables yield additional and valuable information. For the 2010-2014 sub-period,
the simulations suggest that reducing processing times and adjusting real exchange rates to PPP
equilibrium levels would save 12% of the cost to import for North Africa and 37% for Central Africa.
Keywords: Cost of transport and logistics, Africa, physical geography, real exchange rate,
transaction costs, rent seeking, processing time.
JEL: L92, 055, H54, N7, N77, R4
Highlights
- Distance matters in domestic transport and logistics costs in Africa
- Cost to import is sensitive to domestic prices and processing times
- Institutions and organizations are powerful drivers of cost reduction
- Significant cost savings can be achieved through time-varying variables
4
What Factors Drive Transport and Logistics Costs in Africa?
1. Introduction
Transport and logistics are a crucial component of competitiveness. In Africa, where
these costs account for 15-20% of the CIF value of imports, they are three to four times higher
than elsewhere in the world (Raballand and Teravaninthorn 2009), and are a major obstacle
to diversifying the productive base (Alfonso and Vergara, 2019; Eifert et al, 2008; Hoekman
and Nicita, 2011). Given the fragmentation of production processes (Feenstra, 1998; Radelet
& Sachs 1998), trade costs strongly influence the profitability of producing tradable goods,
thus hampering the emergence of African manufacturing. This is especially true for goods,
which are part of global supply chains where each phase of production faces narrow profit
margins (Christ and Ferrantino, 2011). Limao and Venables (2001) have established that
ground transport costs are 7 times higher per unit of distance than sea transport costs. Sea
transport accounts for over 80% of Africa’s external trade. Apart from remoteness from
developed economies, many other factors, at seaports as well as along the continent’s roads,
impede Africa’s competitiveness (see Radelet and Sachs, 1998; Clark, Dollar and Micco 2004;
Iwanow and Kirkpatrick, 2009). This paper focuses on the domestic costs of delivering an
imported container from its arrival at an African seaport to its final destination.
Our analysis differs on several points from Limao and Venables (2001), who consider
total transport and logistics costs, including both maritime and land components. First, we do
not take into account the cost of sea transport, which is volatile and depends on factors such
as the nature of the good, the port of departure, and the shipping route. Second, we adopt a
continent-wide perspective by considering a nearly exhaustive set of African countries for the

5
period 2006-2014. Data about costs of importing are from the Trading Across Borders section
of the World Bank’s Doing Business report (DB). This includes all costs incurred from the
landfall seaport to a warehouse in the importing country’s capital or principal city (Appendices
1 and 2). For each country, DB identifies a pair of origin and destination cities. In the case of
landlocked economies, the fastest and most used transit corridor is considered. On average, if
more than 80% of Africa’s exports are in bulk or liquid form, more than 50% of the continent’s
imports are containerized.
To the best of our knowledge, transport and logistic costs have not been investigated
systematically for Africa as a whole (Appendix 1). Besides the role of physical geography,
two time-varying-country-specific factors are considered in our regression models: the real
exchange rate level, which captures the impact of relative prices, and the processing time,
which is influenced by market failures, organizational failures, or the poor quality of the hard
infrastructure. The results show the heterogeneity of costs in Africa. North African countries
have lower costs than the other regions, especially Central Africa, where costs are the highest.
Distance, measured by kilometers between port of entry and point of delivery, is statistically
significant and proves to be the major source of cost differences across countries. Beyond the
impact of this geographical factor, transport and logistics are sensitive to relative prices as
proxied by the ratio of the Purchasing Power Parity conversion factor to the official exchange
rate. Abnormal processing times also influence cost levels (Hummels and Schaur, 2013).
Taken together, these two time-varying factors lead to a potential cost saving of US $ 905 per
container for Central Africa. During 2010-2014, avoidable cost ranged from 12% of import
costs for North Africa to 37% for Central Africa.
The rest of the paper is organized as follows: Section 2 reviews the main factors driving
transport and logistics costs in Africa. Section 3 specifies the model and uses econometric
regressions to estimate the respective impact of explanatory factors. Section 4 checks the

6
robustness of empirical results and simulates potential cost savings by modifying time-varying
variables. Section 5 concludes and outlines policy implications of the analysis.
2. Determinants of transport and logistics cost
The explanatory variable refers to a 20-foot container containing imported dry cargo
weighing 10 tons, with a CIF value of US $20,000. The cost of delivering does not take
account of tariffs nor sea transport, but includes fees for documents, customs inspection and
clearance, customs brokerage, port charges, and inland transport. Two categories of factors
cause prices of inland transport and logistics to vary across countries. The literature
emphasizes time-invariant factors, largely based on geography. One novelty of this empirical
work is to pay attention to time-varying-country-specific determinants.
Factors with low or no variance over time
Among geographical factors, distance-i.e. kilometers from the gateway port to the delivery
point is the most obvious source of heterogeneity across countries. The landlocked situation
is also a factor considered in the literature (Arvis, 2010). The most direct route may require
more than 1,000 kilometers. The longest continental corridors are between Harare
(Zimbabwe) and Durban (South Africa): 1,678 km, Ndjamena (Chad) and Douala
(Cameroon): 1,600 km, Kigali (Rwanda) and Dar es Salaam (Tanzania): 1,418 km, Juba
(South Sudan) and Mombasa (Kenya): 1,338 km (see Appendix 2). The case of island
countries is ambiguous. Small islands generally use a foreign hub for trans-shipment, with
feeder vessels conveying the cargo to a national port and conducting customs brokerage and
freight forwarding, which increases import cost. Country size and trading volume probably
affect the impact of being an island. Limao and Venables (2001) find this feature to be a cost-
reducing factor. Climate may also affect the cost to import with a big difference between the

7
arid areas of North Africa and the dense, humid forests of Central Africa. The vector of
regional dummies captures this impact.
The quality of the hard infrastructure is also important, and depends on the influence of
climate, and public policy through the regular maintenance of the stock and the effectiveness
of regulations (e.g. axle load rules) (François and Manchin, 2013). Portugal-Perez and Wilson
(2012) raise the point that hard and soft infrastructure complement each other and sometimes
self-reinforce in a dynamic process. Creating infrastructure without addressing policy and
institutional shortcomings underlying its use, contributes to high transport costs. Maintenance
expenditure is generally under-budgeted, and this budget item is often the first to be cut in
times of severe financial constraints (see Adam and Bevan, 2014). Infrastructure quality of
roads and ports is measured from the components of the World Bank’s Logistics Performance
Index (LPI, 2014). The same statistical source is also used to capture the structural efficiency
of customs clearance procedures. The low variance over time of this factor goes hand-in-hand
with the inertia in customs officers' behavior, which is unlikely to change as quickly as reforms
expect. Finally, we test country risk via the Fund for Peace’s Fragile States Index (FSI)i.
Based on 12 political, social and economic indicators, the FSI combines quantitative
information and expert judgment. The higher the index, the greater a country’s vulnerability.
Time-varying determinants
We explore the influence of the Real Exchange Rate (RER), and the Processing time. The
RER sheds light on the cost of production as reflected by the cost of living in the economy. It
is measured from the Purchasing Power Parity Conversion Factor (PPP CF)- i.e. the number
of units of a country's currency required to buy the same amount of goods and services in the
domestic market as a U.S. dollar would buy in the United States (c.f. the World Bank’s World
Development Indicators). For a country j and a year t, we divide the PPP CF, expressed in US

8
dollars, by the official exchange rate level (NER) of the dollar in the African domestic
currency.
𝑅𝑅𝑅𝑅𝑅𝑅𝑗𝑗𝑗𝑗 = (𝑃𝑃𝑃𝑃𝑃𝑃 𝐶𝐶𝐶𝐶/𝑁𝑁𝑅𝑅𝑅𝑅)𝑗𝑗𝑗𝑗 (1)
The departure of the RER from the value 1 tells us to what extent the cost of living differs
from that of the United States. In transport terms, the higher this ratio, the more expensive the
domestic cost to import a container. Assuming a unique price, and only one tradable good, the
ratio shows to what extent the cost of living, i.e. the price of non-tradables, departs from that
of the United States. The use of the US dollar as the reference currency allows the calculation
of potential production cost differences of transport and logistics services across African
countries. Competition level is one reason of cost differences. In some countries, bilateral
agreements set quotas for transit freight. While this procedure supports the domestic
transporters of landlocked countries, it does it against the interest of the final importer who
pays more than he should. According to Raballand and Teravaninthorn (2009), truckers have
big profit margins in Central and West Africa, from 60% to 160%. One of the most expensive
corridors is between Ngaoundéré (Cameroon) and Moundou (Chad). Other researchers
emphasize the rents received throughout the logistics' chain that benefit shippers and haulers,
chambers of commerce, managers of warehouses or dry ports, and customs officials who
solicit bribes. Negotiations between stakeholders raise transaction costs. In 2008, along the
Tema(Ghana) -Ouagadougou(Burkina Faso) corridor, the average bribe to customs officers
on a 20-foot imported container amounted to 8.2% of CIF value. Robbery and theft added less
than 1% to cost.
With respect to the time to import, the DB data encompass time spent on customs
clearance, inspection, handling, storage at terminals, and transport of a container from
landfall port to point of delivery. By processing time, we mean the number of days above

9
the “normal” time (i.e. average continental days) required to convey a container from the
port to the point of delivery by road. A wide array of factors underlie delivery delays
including the quality of roads, weather conditions, congestion, roadblocks, political
vulnerability, and border crossing procedures. To break down the time to import of the DB
into 2 components, the following econometric method is used. By the regression (2), we
assess the impact of the distance (θ), which is then subtracted to the Time to import of the
DB to identify the Processing time (3).
(2) 𝑇𝑇𝑇𝑇𝑇𝑇𝑇𝑇 𝑗𝑗𝑡𝑡 𝑇𝑇𝑇𝑇𝑖𝑖𝑡𝑡𝑖𝑖𝑗𝑗𝑗𝑗𝑗𝑗 = 𝜃𝜃 𝐷𝐷𝑇𝑇𝐷𝐷𝑗𝑗𝐷𝐷𝐷𝐷𝐷𝐷𝑇𝑇𝑗𝑗 + 𝛿𝛿 + εjt
(3) 𝑃𝑃𝑖𝑖𝑡𝑡𝐷𝐷𝑇𝑇𝐷𝐷𝐷𝐷𝑇𝑇𝐷𝐷𝑃𝑃 𝑗𝑗𝑇𝑇𝑇𝑇𝑇𝑇𝑗𝑗𝑗𝑗 = 𝑇𝑇𝑇𝑇𝑇𝑇𝑇𝑇 𝑗𝑗𝑡𝑡 𝑇𝑇𝑇𝑇𝑖𝑖𝑡𝑡𝑖𝑖𝑗𝑗𝑗𝑗𝑗𝑗 − 𝜃𝜃 𝐷𝐷𝑇𝑇𝐷𝐷𝑗𝑗𝐷𝐷𝐷𝐷𝐷𝐷𝑇𝑇𝑗𝑗
Here Table 1
For two sub-periods, Table 1 provides statistical information about time-varying variables
including the cost to import. We divide the 50 African countries into 5 regions with differing
numbers of countries. The cost to import depends on the distance and the time the container
has to travel. North Africa is at an advantage in this respect as capital cities are close to the
port of arrival and the delivery point. This is not the case for West Africa and Southern Africa
where a significant percentage of countries are landlocked, 19% for West Africa and 50% for
Southern Africa, with a capital far from the port of arrival (see Appendix 2). Geography
influences the time to import but distance is not the only fact to consider. A continental ranking
clearly emerges with Processing times, which account for about 50% of the time to import.
This percentage is consistent with the average of 20 days that Raballand et al (2012) report
for the whole continent. For the 2010-2014 period, it takes 34 days to process a container in
Central Africa with little change from the previous sub-period, compared to just over 14 days
in North Africa. Relative prices may also partly explain differences in cost to import. In
Central Africa, real exchange rate levels (RERs) are high, and the cost of living is only 50%

10
lower than in the United States at the official exchange rate, while it is 70% lower in the
middle-income countries of North Africa.ii
3. Specification of the model and regression results By estimating the cost to import (Cjt) on a panel of 50 African countries observed on
the 2006-2014 period, we have to take into account heterogeneities across countries and years.
The pooled OLS regression neglects the panel character of the dataset. The fixed effects
estimator (FE) is an option. Using only the within variation, leads to less-efficient estimation,
and an inability to estimate coefficients of time-invariant regressors. The random effects model
(RE) is efficient, reducing the variance of estimates of coefficients as long as individual effects
are not correlated with the regressors. Processing times are likely to be problematic. Bribes
affect Processing times in different ways according to importers who strive to limit time spent
with customs officials and other uniformed personnel (Hallward-Driemeier and Pritchett,
2015; Freund, Hallward-Driemeier, and Rijkers, 2014). If Processing times depend on
importers’ willingness to pay, the aforementioned estimators (OLS, FE, RE) are biased, none
of them providing information about causal relationships. The Hausman-Wu (1978) test did
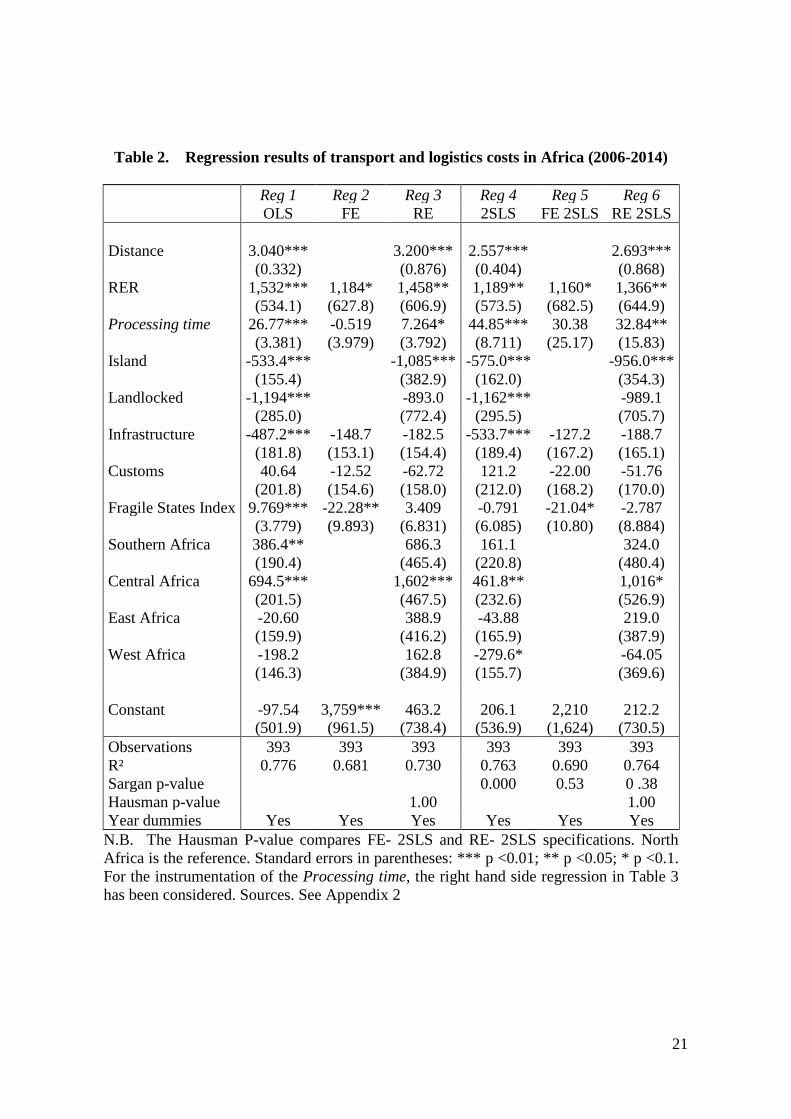
not reject the presence of endogeneity. Table 2 presents the main empirical results by
considering the broadest specification of the model.The linear form simplifies economic
interpretation of regression coefficients, and log-log or semi-log specifications did not provide
better fits. Equation (4) is the random effect estimator that proved to be the most appropriate.
Subscripts j and t are country and year, respectively.
𝐶𝐶𝑗𝑗𝑗𝑗 = α + 𝜇𝜇𝐷𝐷𝑇𝑇𝐷𝐷𝑗𝑗𝐷𝐷𝐷𝐷𝐷𝐷𝑇𝑇𝑗𝑗+ 𝛽𝛽𝑅𝑅𝑅𝑅𝑅𝑅𝑗𝑗𝑗𝑗+ 𝜔𝜔 𝑃𝑃𝑖𝑖𝑡𝑡𝐷𝐷𝑇𝑇𝐷𝐷𝐷𝐷𝑇𝑇𝐷𝐷𝑃𝑃 𝑗𝑗𝑇𝑇𝑇𝑇𝑇𝑇𝑗𝑗𝑗𝑗 +δ’𝑍𝑍𝑗𝑗𝑗𝑗+ τ’D +ηt + 𝜆𝜆𝑗𝑗𝑗𝑗 (4)
j = 1…50, and t = 2006…2014, with 𝜆𝜆𝑗𝑗𝑗𝑗=𝛾𝛾𝑗𝑗+ εjt

11
Beside RER and Processing time, because of the dominant impact on the dependent
variable, we separate Distance (i.e. kilometers) from the Z-vector of other determinants with
a limited time variance: infrastructure, customs, and Fragile States Index. D is the matrix of
dummy variables for regions, landlocked, island; α is the intercept; ηt are year fixed effects;
𝜆𝜆𝑗𝑗𝑗𝑗 is the error term with γj specific effects by country, uncorrelated with the independent
variables; and εjt is the idiosyncratic error. In other words:
E(γj) = E(εjt) = 0; E(X’γj) = E (X’ εjt) = 0; and E ( 𝜆𝜆𝑗𝑗𝑗𝑗,𝑃𝑃𝑖𝑖𝑡𝑡𝐷𝐷𝑇𝑇𝐷𝐷𝐷𝐷𝑇𝑇𝐷𝐷𝑃𝑃 𝑗𝑗𝑇𝑇𝑇𝑇𝑇𝑇𝑗𝑗𝑗𝑗)≠0.
To get an unbiased coefficient for Processing time, we use 3 instruments which meet
the exclusion restriction. Population size is correlated with infrastructure quality and port
economies of scale. Jedwab and Storeygard (2017) find that large African countries build
relatively more infrastructure in order to improve internal communication. Correlation with
cost to import is only indirect, through the productivity effect. We add 2 instruments, not
correlated with each other, that reflect the role of institutions. The longer it takes to resolve
insolvency of firms, the longer the time required to manage containers. We also introduce the
processing time of bordering countries. By using this variable, adjusted for the distance
impact, we hypothesize that sub-regional behavior is similar to the characteristics of logistics
in the country under study. For landlocked economies, to prevent direct correlation with 𝐶𝐶𝑗𝑗𝑗𝑗
we remove the transit country from the list of neighbors.iii
Here Table 2
In Table 2, the Hausman test between the FE and RE estimators does not reject the hypothesis
that the variations across countries are random, uncorrelated with the regressors. In this case,
the RE-2SLS is the most efficient (Reg 6), the instrumented regression about the Processing
time being given in Table 3. Table 2 shows that 5 variables are statistically relevant including

12
the 2 time-varying variables: RER and Processing time. If the dominant impact of distance is
shown, the island characteristic also matters. The regional dummy for Central Africa varies
from the average regression result with an extra cost estimated at about 1,000 US dollars.
More comments about the coefficients of the main variables are provided with the
parsimonious specification (Table 3). For now, let us observe that some variables, such as the
landlocked characteristic, are not significant.
Prima facie, when we account for distance variation across countries, the “border effect”,
which is collinear with the landlocked feature, no country has more than one border to cross,
is not as costly as generally assumed (Limao and Venables 2001, Christ and Ferrantino, 2011).
However, this result has to be qualified. The correlation with Processing time may explain the
non-significance of the landlocked coefficient. A long trip and a border crossing generate
uncertainty and dispersion around the conventional costs and time that the DB hypothesizes.
The Abidjan-Ouagadougou corridor illustrates the dispersion of costs interacting with import
time. In 2016, the Conseil Burkinabé des Chargeurs evaluated the average time at 17 days,
within a range of 5 to 32 days. This includes 1 to 18 days for document preparation, customs
clearance, inspection, and port and terminal handling; 2 to 8 days for land transport; and 2 to
6 days for container processing. To some extent, the DB ignores this dispersion effect, which
may particularly impact landlocked economies. No specific contribution arises in the
explanation of the dependent variable with the 3 following variables: Infrastructure, customs
services, and the Fragile State Index (FSI). We may assume that Processing time captures the
impact of these phenomena.
Table 3 focuses on the parsimonious empirical model that only accounts for statistically
significant variables (Reg 7). Based on the F-test, we keep regional and year dummies to
identify non-observable heterogeneities. The first stage regression of the RE-2SLS estimator
is proposed on the right-hand side. The set of instruments proves significant. The F-value of

13
this first stage regression is 78.2, far above the threshold of 10 for weak instruments (Stock
and Yogo, 2005). In addition, the Sargan test of overidentifying restrictions does not reject
the null hypothesis, which means that our instruments are adequate. In the cost to import
regression, distance remains a major component. The coefficient yields a marginal cost 16.8
US cents per ton-kilometer, higher than reported in previous African case studies. However,
the DB assumes a container with a 10-ton load. Most container are more heavily loaded. For
example, on the Dakar (Senegal)-Bamako (Mali) corridor, rice containers vary between 20
and 25 tons (ADB, 2015), which makes for a big difference between the DB convention and
actual values (Hallward-Driemeier and Prichett, 2015). Per ton-kilometer, the market price for
standard products varies from 4 US cents in Kenya and Zambia (close to the price in European
and Asian countries), to 11-15 US cents in some landlocked countries, such as Burundi, Chad,
Central African Republic and Niger (Raballand and Teravaninthorn, 2009; Gwilliam, 2011;
Osborne, Pachon and Araya, 2014). If we raise the 10-ton load to 20 tons, the coefficient is
about 8.4 US cents per ton-kilometer, close to what Raballand and Teravaninthorn (2009)
observe. Being an island is a cost saving characteristic of US $580. Nonetheless, it is
important to be careful in interpreting this coefficient. The sub-sample of islands is a small
one, and 71% of observations are for middle-income countries, a distribution that differs from
the per capita income criterion for the whole continent (51%).
Table 3 here
Given the Processing time coefficient, the marginal cost of an extra day is US $33.9.
It means that over the period 2010-2014, the average cost of Processing time ranges from US
$498 per TEU in North Africa (33.91x14.7) to US $1,272 in Central Africa (33.91x37.5).
Within the latter group, in Chad, in 2014 it took 55 days to comply with formalities and
overcome hurdles along the Douala-Ndjamena corridor. The resulting cost was US $1,865.

14
What about the impact of the real exchange rate? RER ranges between 0 and 1. The upper
limit means that, at the official exchange rate, the local currency’s purchasing power equals
that of the US dollar in the United States. In other words, assuming similar productivity levels
between 2 African countries, Reg 7, Table 3 shows that a difference of 20% in the RER means
an additional import cost of US $311 (0.2x1,557).
4. Robustness checks and policy implications
So far, some institutional factors, whose impact is qualitative and difficult to measure,
have been left aside. This is the case of the property rights structure, especially the influence
of the private management of public services, and the market competitive pressure. Although
the Hausman test did not reveal a specific problem in that respect, omitted variables could
affect the coefficient of time-varying variables. Regression results may also be sensitive to
regions, or per capita income levels heterogeneities (Appendix 1). Finally, under the
hypothesis that empirical results prove robust, in what proportion is it possible to reduce the
cost to import by modifying the RER or the Processing time?
Assessing the impact of institutional reforms
Four private international operators manage port terminals over the continent. Bolloré,
the leader in transport and logistics, combines a wide range of services and promotes a door-
to-door strategy, from maritime shipment to warehouse delivery. Competing firms are also
moving to multimodal services (APM, MSC, CMA-CGM). In 2014, while private firms had
already long-standing involvement in the management of port terminal activities (Tanzania,
Cameroon, Côte d’Ivoire and Egypt), very few African countries did not trust in the private
operators yet (South Africa, Namibia, Sudan, Mauritius, etc.).
We define several variables reflecting institutional changes: (i) First, we differentiate
countries according to whether they have a private port operator. For a long time, pilotage,

15
towing, mooring, dredging, and cargo handling were a public monopoly. In this context, a
wide array of stakeholders colludes to extract rents pushing the cost of services up. A private
operator is expected to cut these economic inefficiencies. (ii) Second, we ask whether the
number of years of private management makes prices lower keeping in mind that the port is
only one segment of the domestic cost to import. Door-to-door services are quite limited.
Private international operators are far from providing integrated services on the whole
transport and logistic chain. (iii) Third, we conduct a before/after analysis by restricting the
sample to countries that awarded, during the period, a concession contract for the port to a
private group. (iv) Finally, we test direct and indirect competition by introducing the number
of port terminal operators and the presence of a railway. Along a corridor, competition and/or
complementarity between rail and road may optimize freight movement and reduce costs. Rail
is a safer mode of transport because it is not subject to unexpected charges such as roadblocks.
Rail transport is less expensive than road at market prices and even more when economic
prices are considered, i.e. taking into account externalities. Multimodal transport can be an
option but is penalized by additional fixed costs resulting from loading and reloading
activities.iv
Of these additional variables, only the number of years of private management is
significant with a counter-intuitive sign (Reg 9). Several reasons may underlie this result. First,
private port services are only one component of the cost to import. No clear conclusion arises
without breaking down the cost into port and road services. Secondly, regulatory agencies
may have failed to promote fair sharing of economic surplus between consumers and
producers. In this case, the private firm maintains high prices and captures the efficiency gains
to accelerate its investment payback. Finally, there is a possibility, of a more optimistic
interpretation that we cannot check - higher prices of transport and logistics are positively
correlated with a higher quality of service.

16
Table 4 here
Sensitivity of regression results to sample size
To examine the heterogeneity of slope coefficients, we rerun regression 7 (Table 3), by
modifying the sample size. First, we separate middle- from low-income countries (Appendix
1). We conduct a second sensitivity test by eliminating income distribution tails. This means
dropping North African countries from the sample. Due to being close to Europe, these
countries are more integrated into global value chains, and their costs are more subject to
competitive pressure. Then we also drop Central African countries, which suffer from the
strong influence of geographical variables.
Table 5 here
Table 5 shows that regression coefficients remain quite stable across per capita income
categories. This is especially true of public policy variables (RER and Processing time) that
can change import costs quickly. A similar outcome occurs when we remove the tails of the
statistical distribution.
Simulation of potential cost savings
In the short-to-medium term, one way to reduce transport and logistics prices is to push up
direct and indirect competition. For landlocked economies strengthening the competitive
market structure proves beneficial in East Africa (Kunaka, Raballand, Fitzmaurice, 2016). In
Congo (RDC), the use of the Luanda (Angola)-Kinshasa (RDC) corridor as an alternative to
the traditional corridor from the national port of Matadi also reduces prices and profit margins.
An alternative or a complementary channel to influence prices is to change RERs and/or
processing times to appropriate levels. For the RER, let us consider Balassa (1964) and

17
Samuelson (1964)'s argument, which assumes that the lower the level of development the
lower the price of non-tradables. In other words, the price of domestic transport and logistics
increases as the productivity level rises in the tradable sector as measured by the per capita
income. Although the empirical sample is not worldwide, African countries are not
homogenous with respect to the per capita income level. In addition, some of them benefit
from rents, and the GDP clearly overestimates the true productivity level to implement the
diversification of the productive base. Equatorial Guinea is an extreme case. Its per capita
GDP in 2007 was close to that of Greece and Portugal because of high rents from exported oil
and gas. Accordingly, we make a double correction to assess the cost savings that may result
from an adequate RER. First, we subtract natural resource rents from the GDP at current prices
in US dollars, and then we adjust RER levels to account for the impact of the productivity
bias.
For country j and product k (i.e. oil, natural gas, coal, minerals, and forest products), the World
Bank defines the percentage of rents as the difference between world market price (𝑃𝑃𝑘𝑘𝑗𝑗) and
domestic average cost (𝐶𝐶𝐶𝐶𝑗𝑗𝑘𝑘𝑗𝑗). We weight these differences by product k’s contribution to
GDP in year t, giving the percentage of rents in domestic activity, which is denoted (𝜃𝜃𝑗𝑗𝑗𝑗 ).
With 𝜃𝜃𝑗𝑗𝑗𝑗 = ∑ �𝑃𝑃𝑘𝑘𝑗𝑗 − 𝐶𝐶𝐶𝐶𝑗𝑗𝑘𝑘𝑗𝑗�𝜇𝜇𝑗𝑗𝑘𝑘𝑗𝑗𝑛𝑛𝑘𝑘=1 𝜃𝜃𝑗𝑗 𝜖𝜖 [0, 1] (5)
Taking 190 countries over the period 2006-2014, we regress the real exchange rate (RER),
i.e. Price level ratio of PPP conversion factor (PPP CF) to the official exchange rate (NER),
on the productivity indicator (Appendix 3). From equations (6) and (7), we estimate the impact
of relative prices via the difference or misalignment (MIS), between the actual RER and the
Balassa-Samuelson adjusted rate (Rodrik, 2008). Calculation is based on the information
delivered by the FERDI Sustainable Competitiveness Observatory (SCO) (see:

18
https://competitivite.ferdi.fr/) and the information of the World Development Indicators of the
World Bank.
𝑅𝑅𝑅𝑅𝑅𝑅𝑗𝑗𝑗𝑗 = (𝑃𝑃𝑃𝑃𝑃𝑃 𝐶𝐶𝐶𝐶/𝑁𝑁𝑅𝑅𝑅𝑅)𝑗𝑗𝑗𝑗 = 𝛼𝛼 + 𝜎𝜎 ∗ ��1 − 𝜃𝜃𝑗𝑗𝑗𝑗� ∗ 𝑖𝑖𝑇𝑇𝑖𝑖 𝐷𝐷𝐷𝐷𝑖𝑖 𝐺𝐺𝐷𝐷𝑃𝑃𝑗𝑗𝑗𝑗� + 𝑢𝑢𝑗𝑗𝑗𝑗 (6)
𝐶𝐶𝑀𝑀𝑀𝑀𝑗𝑗𝑗𝑗 = (𝑅𝑅𝑅𝑅𝑅𝑅𝑗𝑗𝑗𝑗– 𝑅𝑅𝑅𝑅𝑅𝑅𝚥𝚥𝑗𝑗� ) (7)
Now moving to the Processing time, for each country, we compare it to a reference value
corresponding, for each sub-period, to the distribution’s fourth quintile (i.e., 13.75 days for
2006-10 and 7.18 days for 2010-14). This African quintile is realistic, achieved by 17
countries at least once during the 2006-2014 period. For countries, whose performance is
better than the reference value, we keep national figures.
𝑀𝑀𝑇𝑇𝑖𝑖𝑡𝑡𝑖𝑖𝑗𝑗 𝐷𝐷𝑡𝑡𝐷𝐷𝑗𝑗 𝐷𝐷𝐷𝐷𝑠𝑠𝑇𝑇𝐷𝐷𝑃𝑃𝐷𝐷𝑗𝑗𝑗𝑗 = 𝜐𝜐 [𝐶𝐶𝑀𝑀𝑀𝑀𝑗𝑗𝑗𝑗 ] + 𝜒𝜒 [ 𝑃𝑃𝑖𝑖𝑡𝑡𝐷𝐷𝑇𝑇𝐷𝐷𝐷𝐷𝑇𝑇𝐷𝐷𝑃𝑃 𝑇𝑇𝑇𝑇𝑇𝑇𝑇𝑇𝑗𝑗𝑗𝑗 – 𝑃𝑃𝑖𝑖𝑡𝑡𝐷𝐷𝑇𝑇𝐷𝐷𝐷𝐷𝑇𝑇𝐷𝐷𝑃𝑃 𝑇𝑇𝑇𝑇𝑇𝑇𝑇𝑇 (𝑖𝑖𝑇𝑇𝑟𝑟) ] (8)
Table 6 here
In Table 6, potential cost savings are in US $ and percentages of the price paid. Information
is provided by sub-region, and for each of them we mention the country having the most to
earn, in all cases around 50% of the price paid (Appendix 4). For expression (8), regression
coefficients for Processing time and the RER are from Reg 7, Table 3. For the period 2010-
2014, Central Africa has the most to gain, especially DR Congo (US $1,591, 43%). West
Africa and Southern Africa follow with potential cost savings of about US $ 500. Northern
Africa logically has less to save. These countries are the continental reference although they
do not reflect the best worldwide state of art for transport and logistics services. These
calculations inspire two comments. First, in each sub-region the least efficient country is
coastal, relativizing the border effect argument. Second, container processing times account
for more than 90% of the potential cost saving. However, for some countries, the impact of

19
real exchange rates adjustments is not negligible. For Angola, over the most recent period, the
misalignment of the RER accounts for 25% of the potential gain (357/1,156).
5. Concluding remarks
High domestic transport and logistics costs impede African countries’ ability to diversify and
participate in global value chains. However, the situation is far from homogeneous across
Africa. These services in Central Africa are expensive compared to those in middle-income
North African countries. Geographical remoteness, market failure, and weak institutions, bear
the responsibility for these excessive costs. The paper has focused attention on 2 time-varying
factors, 2 non-exclusive options to improve competitiveness of transport and logistics
services. The first avenue is through the exchange rate policy that reduces the relative price
of non-tradable goods. The second avenue, which may interact with the previous one, is to
have more efficient processing times in the spirit of the Trade Facilitation Agreement (WTO,
2017).
Our analysis yields a set of main empirical conclusions. First, after accounting for
distance, landlocked status is not statistically significant. No country crossing more than one
border, being landlocked correlates perfectly with the border effect. Second, hidden
transaction costs reflected in the processing time offer the greatest opportunity for reducing
costs, on average 90% of the effective domestic cost. All things being equal, an additional day
in delivery costs about US $34 per container. Third, relative prices have a limited impact,
except for some countries where raw material rents are a source of price distortion. Angola, a
costal country with one of Africa’s highest transport and logistics costs, illustrates this
phenomenon. Fourth, cost to import does not prove sensitive to the number and the presence
of private operators in port terminals. More work is needed to refine this last conclusion, which
does not take account of the quality of services.

20
Table 1. Domestic transport and logistics costs in Africa: time-varying variables
N.B. For the sources and for no-time-varying variables, see Appendix 2. Processing time is calculated as mentioned in section 2, relations (2) and (3). On the left hand side column, in bold characters the number of countries is indicated for each region. The Cost to import, -i.e. the dependent variable, refers to a container and is expressed in US dollars. Time to import and Processing time are expressed in days. RER is defined on the interval (0-1).
Mean Median Standard deviation 2006-2010 2010-2014 2006-2010 2010-2014 2006-2014 2006-2014
North Africa (4) Cost to import 1,087 985.6 1,000 915 352.5 212.9 Time to import 23.2 18.6 22.5 17 4.70 4.419 Processing time 19.3 14.7 21.7 14.4 6.5 7.6 RER 0.32 0.32 0.34 0.32 0.19 0.05 West Africa (16) Cost to import 1,723.1 1,910.7 1,363.0 1,521.5 882.2 1,001.6 Time to import 37.8 32.8 35.0 32.0 13.9 12.1 Processing time 32.5 27.5 31.7 28.8 9.1 9.2 RER 0.38 0.41 0.38 0.41 0.07 0.06 East Africa (14) Cost to import 2,080.0 2,236.3 1,815 1,925 1,194.4 1,272.6 Time to import 39.9 30.5 36.0 28.0 20.5 12.5 Processing time 25.8 16.4 24.4 17.7 13.2 9.6 RER 0.38 0.39 0.38 0.38 0.09 .077 Central Africa (8) Cost to import 2,809.2 3,852.9 2,201.0 2,625.0 1,704.0 2,695.5 Time to import 52.5 50.5 53.5 49.5 24.9 24.9 Processing time 39.4 37.5 37.2 34.1 13.3 13.8 RER 0.46 0.479 0.45 0.47 0.07 0.06 Southern Africa (8) Cost to import 2,243.37 3,084.25 1,950 2,482 845.74 1,544.901 Time to import 45.47 40.9 46 36.0 15.9 16.8 Processing time 26.7 22.1 21.5 20.0 14.4 12.5 RER 0.44 0.47 0.44 0.46 0.08 0.09
21
Table 2. Regression results of transport and logistics costs in Africa (2006-2014)
Reg 1 Reg 2 Reg 3 Reg 4 Reg 5 Reg 6 OLS FE RE 2SLS FE 2SLS RE 2SLS Distance 3.040*** 3.200*** 2.557*** 2.693*** (0.332) (0.876) (0.404) (0.868) RER 1,532*** 1,184* 1,458** 1,189** 1,160* 1,366** (534.1) (627.8) (606.9) (573.5) (682.5) (644.9) Processing time 26.77*** -0.519 7.264* 44.85*** 30.38 32.84** (3.381) (3.979) (3.792) (8.711) (25.17) (15.83) Island -533.4*** -1,085*** -575.0*** -956.0*** (155.4) (382.9) (162.0) (354.3) Landlocked -1,194*** -893.0 -1,162*** -989.1 (285.0) (772.4) (295.5) (705.7) Infrastructure -487.2*** -148.7 -182.5 -533.7*** -127.2 -188.7 (181.8) (153.1) (154.4) (189.4) (167.2) (165.1) Customs 40.64 -12.52 -62.72 121.2 -22.00 -51.76 (201.8) (154.6) (158.0) (212.0) (168.2) (170.0) Fragile States Index 9.769*** -22.28** 3.409 -0.791 -21.04* -2.787 (3.779) (9.893) (6.831) (6.085) (10.80) (8.884) Southern Africa 386.4** 686.3 161.1 324.0 (190.4) (465.4) (220.8) (480.4) Central Africa 694.5*** 1,602*** 461.8** 1,016* (201.5) (467.5) (232.6) (526.9) East Africa -20.60 388.9 -43.88 219.0 (159.9) (416.2) (165.9) (387.9) West Africa -198.2 162.8 -279.6* -64.05 (146.3) (384.9) (155.7) (369.6) Constant -97.54 3,759*** 463.2 206.1 2,210 212.2 (501.9) (961.5) (738.4) (536.9) (1,624) (730.5) Observations 393 393 393 393 393 393 R² 0.776 0.681 0.730 0.763 0.690 0.764 Sargan p-value 0.000 0.53 0 .38 Hausman p-value 1.00 1.00 Year dummies Yes Yes Yes Yes Yes Yes
N.B. The Hausman P-value compares FE- 2SLS and RE- 2SLS specifications. North Africa is the reference. Standard errors in parentheses: *** p <0.01; ** p <0.05; * p <0.1. For the instrumentation of the Processing time, the right hand side regression in Table 3 has been considered. Sources. See Appendix 2

22
Table 3. Transport and logistics costs determinants and instrumentation of the Processing time
Reg 7
RE- 2SLS
Processing time
First stage regression
Distance 1.683*** 0.0251***
(0.352) (0.002) RER 1,557** -0.275
(608.3) (7.125) Processing time 33.91***
(11.21) Island -579.6** 0.152
(272.7) (3.652) Resolving Insolvency -0.245***
(0.057) Processing time of neighbours 0.128*
(0.070) log (population) 3.999***
(0.719) Southern Africa 62.63 18.84***
(378.0) (4.220) Central Africa 758.0 26.51***
(465.2) (4.382) East Africa 138.0 10.23*
(344.5) (3.824) West Africa -66.41 12.18***
(330.8) (3.749) Constant -651.0 -35.54***
(450.1) (13.76) Observations Wald P-value
450 0.00
450 0.00
F-test 78.2*** R-squared 0.78 0.64
Year Dummies Yes Yes Hausman P-value 1.000 Sargan P-value 0.613
N.B. The right hand side column is for the instrumented variable of the Processing time that we use to explain the cost to import on the left hand side. The Hausman P-value compares FE- 2SLS and RE- 2SLS specifications. North Africa is the reference. Standard errors in parentheses: *** p <0.01; ** p <0.05; * p <0.1

23
Table 4. Transport and logistics costs: Private management and competition in port terminals
Reg 8 Reg 9 Reg 10 RE-2SLS RE-2SLS RE-2SLS Distance 1.697*** 1.654*** 1.189*** (0.359) (0.327) (0.422) RER 1,489** 1,372** 1,896** (613.2) (587.4) (784.5) Processing time 32.02*** 27.00*** 32.07** (11.76) (9.821) (12.63) Island -524.2* -346.9 -686.6* (291.4) (277.6) (371.7) Private management (years) 76.60*** (19.26) Number of port operators 67.50 -32.44 88.98 (154.9) (144.4) (231.2) Private Presence 72.44 (112.9) Transition to private port 109.8 (129.9) Railway 30.31 220.0 40.26 (200.7) (188.3) (255.7) Southern Africa 152.9 295.7 288.5 (421.1) (375.1) (461.8) Central Africa 806.9* 892.7** 710.2 (486.2) (430.5) (570.5) East Africa 162.5 34.66 293.5 (370.1) (343.9) (465.4) West Africa -67.06 55.29 17.69 (343.4) (307.3) (382.0) Constant -708.2 -455.9 -815.6 (495.9) (434.4) (561.8) Observations 450 450 315 R² 0.78 0.78 0.66 Sargan P-Value 0.72 0.96 0.96 Hausman P-Value 1.00 1.00 1.00 Year dummies Yes Yes Yes Number of countries 50 50 35
Sources. See Appendix 2. North Africa is the reference. Robust standard errors in parentheses *** p<0.01, ** p<0.05, * p<0.1.

24
Table 5. Sensitivity of regression results to regions and per capita income levels
Reg 11 RE-2SLS
Reg 12 RE-2SLS Less NAF
Reg 13 RE-2SLS
Less NAF/CAF
Reg 14 RE-2SLS
LIC
Reg 15 RE-2SLS
MIC Distance 1.683*** 1.731*** 1.623*** 1.784*** 2.036*** (0.352) (0.358) (0.314) (0.563) (0.510) RER 1,557** 1,496** 1,976*** 2,171** 1,815** (608.3) (638.8) (552.0) (935.4) (914.3) Processing time 33.91*** 31.87*** 36.59*** 38.92** 26.96** (11.21) (11.23) (10.77) (15.79) (10.63) Island -579.6** -601.3** -163.3 11.52 -901.6*** (272.7) (282.2) (287.8) (518.7) (273.8) Southern Africa 62.63 136.9 122.8 255.4 -34.40 (378.0) (249.2) (217.2) (730.3) (379.4) Central Africa 758.0 861.0*** 863.9** (465.2) (308.0) (393.5) East Africa 138.0 201.0 124.6 -84.57 353.7 (344.5) (218.5) (191.9) (319.1) (353.4) West Africa -66.41 116.7 (330.8) (327.9) Constant -651.0 -658.0 -1,004* -1,128* -467.7 (450.1) (524.2) (517.3) (673.5) (468.4) Observations 450.00 414.00 342.00 216.00 234.00 R² 0.78 0.78 0.76 0.85 0.60 Sargan p-value 0.64 0.57 0.85 0.51 0.65 Hausman p-value 1.00 1.00 1.00 1.00 1.00 Year dummies Yes Yes Yes Yes Yes
Sources. See Appendix 2. Reg 11 is the same as Reg 6, Table 3. In Reg 12, we drop the North African countries (NAF) and in Reg 13, we also remove Central African countries (NAF, CAF). In Reg 14 and Reg 15, we focus on low (LIC) and middle-income (MIC) countries. Robust standard errors in parentheses *** p<0.01, ** p<0.05, * p<0.1.

25
Table 6. Simulation of potential savings on the costs to import (2006-2014) (From regression 6, Table 3)
Average 2006-2010 Average 2010-2014 RER Time Total RER Time Total Dollars Dollars (%) Dollars Dollars (%) Northern Africa 0 83 83 10 0 135 135 12 - Algeria 0 77 77 5,3 0 401 401 30 West Africa 14 459 473 34 20 491 511 33 -Nigeria 0 896 896 75 40 832 872 58 East Africa 30 328 358 21 29 195 224 14 -Mozambique 182 478 660 54 130 463 593 39 Central Africa 64 670 734 31 87 817 905 37 - Congo DRC 131 1,267 1,398 46 199 1,392 1,591 43 Southern Africa 40 291 331 17 86 337 422 15 - Angola 192 1,297 1,489 69 357 1,157 1,513 54
Results are from Reg 7, Table 3 or Reg 11, Table 5. Percentages are relative to the average domestic cost to import. Time reflects what can be earned with a more efficient Processing time. Results by country are given in Appendix 4. RER is the real exchange rate. Sources, Appendix 2.

26
Appendices
Appendix 1. Africa by region and income level countries
Southern Africa Central Africa East Africa West Africa North
Africa
South African Rep Central African Rep Burundi Benin Algeria
Angola Cameroon Comoros Burkina-Faso Egypt Botswana Congo Djibouti Cape Verde Morocco Lesotho Gabon Ethiopia Côte d'Ivoire Tunisia Namibia Equatorial Guinea Kenya Gambia Swaziland R.D of Congo Madagascar Ghana
Zambia Sao Tomé & Principe Malawi Guinea
Zimbabwe Chad Mauritius Guinea -Bissau Mozambique Liberia Rwanda Mali Seychelles Mauritania Sudan Niger Tanzania Nigeria Uganda Senegal Sierra Leone Togo Note. Income level categories. Bold and italics relate to upper and lower middle-income countries as defined by the World Bank in June 2018. The other countries are low-income economies.

27
Appendix 2. Domestic transport and logistics in Africa (2014)
Countries Distance (Km)
Misalignment
(%)
RER
Processing time
Years with a private port
operator
Nbr of private port
operators
Port of arrival
Angola 27 +22 0.71 42.3 8 1 Luanda Burundi 1419 -8 0.37 8.8 15 1 Dar-es-Salaam Benin 6 -1 0.45 26.8 6 2 Cotonou Burkina Faso 944 -2 0.42 24.2 11 3 Abidjan Botswana 917 -9 0.45 10.9 0 1 Durban Central African Republic 1404 +14 0.59 18.1 11 2 Douala Côte d'Ivoire 23 +2 0.47 33.4 11 3 Abidjan Cameroon 15 +1 0.47 24.6 11 2 Douala Congo, DRC 327 +15 0.58 54.4 0 1 Matadi Congo, Rep 560 +3 0.50 39.3 7 2 Pointe Noire Comoros 2 +11 0.57 23.9 3 1 Moroni Cabo Verde 6 +7 0.57 17.8 0 1 Praia Djibouti 11 +8 0.55 17.7 9 2 Djibouti Algeria 7 -12 0.39 26.8 7 1 Alger Egypt, Arab Rep, 224 -17 0.32 9.1 11 2 Alexandria Ethiopia 864 -7 0.38 21.3 9 2 Djibouti Gabon 18 +2 0.55 21.5 8 1 Libreville Ghana 36 -11 0.35 41.0 11 2 Tema Guinea 27 -1 0.44 30.3 4 2 Conakry Gambia, The 2 -18 0.27 18.9 0 1 Banjul Guinea-Bissau 8 -2 0.44 21.8 0 1 Bissau Equatorial Guinea 7 -3 0.58 43.8 0 1 Malabo Kenya 481 0 0.46 13.4 7 1 Mombasa Liberia 10 +9 0.54 28.7 4 1 Monrovia Lesotho 549 -4 0.41 18.6 0 1 Durban Morocco 337 -6 0.42 6.1 8 2 Tangiers Madagascar 356 -14 0.31 11.6 10 1 Toamasina Mali 1093 -4 0.42 6.3 8 2 Dakar Mozambique 14 +9 0.55 24.6 7 1 Maputo Mauritania 16 -11 0.35 37.6 7 1 Nouakchott Mauritius 5 -4 0.53 8.9 0 1 Port Louis Malawi 948 -14 0.31 14.1 7 1 Beira Namibia 394 +2 0.53 9.6 0 1 Walvis Bay Niger 1021 0 0.45 35.2 6 2 Cotonou Nigeria 11 +6 0.52 32.7 9 3 Apapa Tin Can Rwanda 1418 -4 0.42 -7.2 15 1 Dar-es-Salaam Sudan 831 +2 0.49 24.2 0 1 Port Soudan Senegal 17 -1 0.45 14.5 8 2 Dakar Sierra Leone 8 -6 0.40 29.8 4 1 Freetown South Sudan 1338 +9 0.55 94.9 7 1 Mombasa São Tomé and Príncipe 3 +13 0.60 27.9 0 1 Sao Swaziland 539 -8 0.42 8.8 0 1 Durban Seychelles 0 -5 0.59 17.0 0 1 Port Victoria Chad 1642 +1 0.47 54.9 11 2 Douala Togo 8 -1 0.45 28.8 5 3 Lome Tunisia 13 -12 0.38 16.6 0 1 Rades Tanzania 5 -8 0.38 30.9 15 1 Dar-es-Salaam Uganda 1145 -5 0.41 2.9 7 1 Mombasa South Africa 570 -3 0.50 6.0 0 1 Durban

28
Zambia 1051 -1 0.45 25,4 7 1 Durban Zimbabwe 1678 +5 0.52 27,0 7 1 Durban
Sources. Cost to import, distance, the port of arrival, and time to import from which the processing time is calculated are from the Doing business, World Bank, different years. For landlocked economies, the port referred to is that of the Doing Business. Real Exchange Rates (RER) are from the World Bank’s World Development Indicators with adjustments for resource natural rents given by rents. Adjustment for rents and the productivity bias are calculated from the information of the OSD-FERDI website (https://competitivite.ferdi.fr). The Logistics Performance Index (LPI) and its components: Customs or Infrastructure have been downloaded from the World Bank website (https://lpi.worldbank.org). The Fragile States Index refers to the Fund for Peace (http://fundforpeace.org/fsi). Private port operators, number of port operators are gleaned from different sources including Proparco, the French Development Agency (AFD): Secteur Privé et développment, le secteur portuaire en Afrique, plein cap sur le développement, March-May 2017. The database is available on request from the author.
Appendix 3. Regression of Price level ratio of PPP conversion factor to market exchange rate on per capita GDP (2006-2014, 190 countries)
Variables Linear model [GDP – Rents] per capita 1.23e-05*** (2.05e-07) Year dummies 0.00310** (0.00152) Constant 0.427*** (0.00880) Observations 1,629 R-squared 0.690
N.B. Robust standard errors in parentheses *** p<0.01, ** p<0.05, * p<0.1. Nominal per capita GDPs from which total natural rents are removed are in current dollars. Sources. From the World Development Indicators, World Bank.

29
Appendix 4. By country potential savings on domestic costs of transport and logistics
Trade cost savings 2006-2010 Trade cost savings 2010-2014
RER Processing time Total cost saved RER Processing time Total cost saved Amount Amount Amount (%) Amount Amount Amount (%)
Angola 191.9 1297.0 1488.8 69.4 356.5 1156.7 1513.3 54.4 Burundi 0.0 465.4 465.4 11.5 0.0 150.3 150.3 3.7 Benin 0.0 595.1 595.1 47.1 0.0 578.6 578.6 39.0 Burkina Faso 0.0 311.5 311.5 8.1 0.0 354.4 354.4 8.5 Botswana 0.0 0.0 0.0 0.0 0.0 72.4 72.4 2.2 Central Africa Rep 103.3 309.2 412.5 8.9 135.6 352.1 487.7 8.6 Côte d’Ivoire 0.0 758.0 758.0 36.1 15.9 719.5 735.3 32.3 Cameroon 7.9 426.0 433.9 21.1 3.6 394.3 397.9 17.5 Congo (DRC) 130.7 1267.4 1398.1 46.0 199.3 1391.7 1591.0 42.8 Congo 95.8 924.5 1020.3 43.4 127.0 1096.2 1223.3 21.2 Comoros 149.4 132.4 281.8 25.0 162.9 358.4 521.2 42.4 Cabo Verde 176.5 37.3 213.7 22.1 136.5 151.3 287.8 31.1 Djibouti 48.7 96.1 144.8 17.4 107.6 146.9 254.5 27.9 Algeria 0.0 77.0 77.0 5.3 0.0 401.4 401.4 30.3 Egypt 0.0 69.1 69.1 6.3 0.0 0.0 0.0 0.0 Ethiopia 0.0 0.0 0.0 0.0 0.0 269.6 269.6 10.1 Gabon 98.1 50.3 148.4 8.9 108.3 276.3 384.6 19.3 Ghana 0.0 873.6 873.6 98.7 0.0 836.8 836.8 65.3 Guinea 0.0 381.4 381.4 28.7 0.0 600.6 600.6 40.6 Gambia 0.0 98.4 98.4 11.8 0.0 215.9 215.9 29.9 Guinea- Bissau 0.0 127.0 127.0 6.8 0.0 285.2 285.2 13.4 Equatorial Guinea 0.0 763.7 763.7 46.8 0.0 1038.9 1038.9 64.0 Kenya 0.0 322.2 322.2 14.4 0.0 0.0 0.0 0.0 Liberia 0.0 396.5 396.5 33.3 107.3 534.4 641.6 48.4 Lesotho 13.5 493.4 506.9 38.8 20.9 326.1 347.0 19.9 Morocco 0.0 1.9 1.9 0.1 0.0 0.0 0.0 0.0 Madagascar 0.0 439.5 439.5 34.3 0.0 48.3 48.3 3.0 Mali 0.0 515.7 515.7 17.9 0.0 0.0 0.0 0.0 Mozambique 182.0 477.7 659.8 53.6 130.4 463.0 593.4 38.9 Mauritania 0.0 662.5 662.5 47.3 0.0 847.8 847.8 55.7 Mauritius 0.0 0.0 0.0 0.0 0.0 0.0 0.0 0.0 Malawi 0.0 308.0 308.0 12.3 0.0 242.3 242.3 9.4 Namibia 82.0 0.0 82.0 5.1 135.4 0.0 135.4 7.3 Niger 0.0 649.9 649.9 21.4 0.7 835.3 836.0 23.7 Nigeria 0.0 895.8 895.8 74.6 40.1 831.9 872.0 58.3 Rwanda 0.0 739.7 739.7 18.0 0.0 0.0 0.0 0.0 Sudan 0.0 861.4 861.4 42.0 0.0 366.8 366.8 12.6 Senegal 49.2 165.6 214.7 11.1 14.2 39.8 54.0 2.7 Sierra Leone 0.0 466.1 466.1 43.1 0.0 529.4 529.4 35.9 Sao Tome-Principe 0.0 301.0 301.0 52.2 78.0 506.7 584.6 101.3 Swaziland 0.0 0.0 0.0 0.0 0.0 16.8 16.8 0.7 Seychelles 37.3 0.0 37.3 4.3 0.0 143.1 143.1 17.2 Chad 77.9 1318.2 1396.1 23.9 47.0 1483.1 1530.1 19.0 Togo 0.0 415.3 415.3 43.9 0.0 502.2 502.2 44.6 Tunisia 0.0 181.9 181.9 28.6 0.0 138.3 138.3 16.1 Tanzania 0.0 519.7 519.7 46.4 0.0 545.6 545.6 36.0 Uganda 0.0 235.9 235.9 8.0 0.0 0.0 0.0 0.0 South Africa 31.0 0.0 31.0 2.4 79.6 115.3 194.8 10.7 Zambia 0.0 385.9 385.9 13.1 18.3 489.8 508.1 9.9 Zimbabwe 0.0 150.2 150.2 5.0 76.0 515.2 591.2 11.3

References
Adam. C., & Bevan. D. (2014). Public Investment, Public Finance, and Growth: The Impact of Distortionary Taxation, Recurrent Costs, and Incomplete Appropriability, IMF Working Paper WP/14/73 African Development Bank. (2015). Problématique de la facilitation du transport en Afrique de l’Ouest et Plan d’actions, Département des Transports, du Développement Urbain et des TIC, Abidjan. Alfonso. H and S. Vergara. (2019). Exporters in Africa, What Role for Trade Costs? Munich Personal RepEc Archive (MPRA), September. Arvis, J.F., Raballand.G., &,. Marteau, J.F. (2010). The Cost of Being Landlocked: Logistics Costs and Supply Chain Reliability. Washington, DC: World Bank. Bhattacharya, S., &. Collier. P. (2011). Public Capital in Resource Rich Economies: Is there a curse? CSAE Working Paper WPS/2011-14. Balassa, B. (1964). The purchasing-power parity doctrine: a reappraisal. The Journal of Political Economy, vol. 72, n° 6, 584–596. Christ, M., & Ferrantino, M.J. (2011). Land Transport for Export: The Effects of Cost, Time, and Uncertainty in Sub-Saharan Africa. World Development, Vol. 39, No. 10, pp. 1749–1759, 2011. Clark, X., Dollar, D., & Micco, A. (2004). Port efficiency, maritime transport costs, and bilateral trade. Journal of Development Economics, 75, 417–450. Devarajan, S. (2012). Why does cargo spend week in Sub Saharan African ports, lesson from six countries. Forward, in Raballand, G, Refas, S, Beuran, M & Isik, G, World Bank, Washington D.C Eifert. B, Gelb. A., & Ramachandran, V. (2008). The Cost of Doing Business in Africa: Evidence from Enterprise Survey Data? World Development, Vol. 36, No. 9, pp. 1531–1546, Feenstra, R .C. (1998). Integration of Trade and disintegration of production in the global economy. The Journal of Economic Perspectives, Volume 12, Number 3
Foster, V., & Briceno-Garmendia, C. (2010). Africa's Infrastructure: a Time for Transition, World Bank, Washington DC. François, J., & Manchin, M. (2013). Institutions, Infrastructure, and Trade, World Development Vol. 46, pp. 165–175, 2013 Freund, C; Hallward-Driemeier. M., & Rijkers. B. (2014). Deals and Delays, Firm-level Evidence on Corruption and Policy Implementation Times, The World Bank, Development Research Group Finance and Private Sector Development Team and Trade and International Integration Team, June

31
Gwilliman, K. (2011). Africa’s transport infrastructure, Mainstreaming, Maintenance and Management? The World Bank, 576 p Hoekman, B &., Nicita, A. (2011). Trade Policy, Trade Costs, and Developing Country Trade? World Development Vol. 39, No. 12, pp. 2069–2079 Hausman, J. (1978). Specification tests in econometrics, Econometrica, vol. 46, issue 6, 1251-1271 Hallward-Driemeier, M., & Pritchett, L.(2015). How Business is Done in the Developing World: Deals versus Rules. The Journal of Economic Perspectives, Volume 29, Number 3 Hummels, D.L., & Schaur, G. (2013). Time as a Trade Barrier. American Economic Review, 103 (7): 2935-59. IMF. (2015). Making Public Investment More Efficient, IMF Staff Report, Washington. Iwanow, T., & Kirkpatrick, C. (2009). Trade Facilitation and Manufactured Exports: Is Africa Different? World Development, 2009, vol. 37, issue 6, 1039-1050. Jedwab, R., & A. Storeygard. (2017). Economic and Political Factors in Infrastructure Investment: Evidence from Railroads and Roads in Africa 1960-2015, Institute for International Economic Policy Working Paper series, Elliott School of International Affairs, The George Washington University Kunaka, C., Raballand. G., & Fitzmaurice, M.(2016). How trucking services have improved and may contribute to economic development, the case of East Africa. WIDER Working Paper 2016/152, December, Helsinki Limao, N., & Venables, A. (2001). Infrastructure, geographical disadvantage, transport costs and trade. The World Bank Economic Review, 15(3), 451–479. Lindsay, C.M. (1976). A Theory of Government enterprise. Journal of Political Economy, 84/5 October 1061-1077. Portugal-Perez, A., & Wilson, J. S. (2012). Export performance and trade facilitation reform: Hard and soft infrastructure. World Development, 40(7), 1295–1307. Osborne. T, Pachon, M.C., & Araya, G.E. (2014). What Drives the High Price of Road Freight Transport in Central America? The World Bank, Latin America and the Caribbean Region Sustainable Development Department, WPS6844, April 2014. PROPARCO. (2017). Secteur Privé et développment, le secteur portuaire en Afrique, plein cap sur le développement. (Group of the French Agency of Development- AFD), Mars-Mai 2017. Raballand, G., Refas, S., Beuran, M., & Isik, G. (2012). Why does cargo spend week in Sub Saharan African ports, lesson from six countries? World Bank, Washington D.C Raballand, G., & Teravaninthorn. S. (2009). Transport prices and costs in Africa: A review of the international corridors. Washington, DC: The World Bank.

32
Radelet, S., & Sachs, J. (1998). Shipping costs, manufactured exports, and economic growth. Presented at American Economic Association Annual Meeting. http://www.earth.columbia.edu /sitefiles/File/about/ director/pubs/shipcost.pdf. Rodrik, D. (2008). The Real Exchange Rate and Economic Growth. Brookings Papers on Economic Activity (Fall), vol 2, 365–412
Sequeira, S., & Djankov, S. (2014). Corruption and firm behavior: evidence from African ports Journal of International Economics, 94 (2). 277-294. Stock J. H.& Yogo, M. (2005). Testing for weak instruments in linear IV regression, in Stock J. H. et Andrews D. W. K. (eds), Identification and Inference for Econometric Models: Essays in Honor of T.J. Rothenberg, Cambridge University Press. World Bank. (2007). Port Reform Toolkit, PPIAF, 2nd Edition, Washington McMillan, M., Rodrik, D., & Verduzco-Gallo. I. (2014). Globalization, Structural Change, and Productivity Growth, with an Update on Africa. World Development, Vol. 63, 11-32
World Bank. 2014. Connecting to Compete– Trade Logistics in the Global Economy. Washington, DC: The World Bank.
i The Fragile States Index is based on a conflict assessment framework, designed to measure vulnerability in pre-conflict, active conflict and post-conflict situations. The methodology can be found at //fundforpeace.org/fsi/indicators/ ii The Hausman-Wu (1978) test about potential endogeneity of the processing time and the RER were implemented. Endogeneity is not rejected only for the former variable. Empirical results of the test are not incorporated in the text, but are provided on request. iii The country of transit contributes to the price of the imported container, meaning that time spent in the port or along the corridor can be a source of endogeneity. iv Central Africa has very high transport and logistics costs. In Cameroon, the distance between the port of Douala and the capital city (Yaoundé), 230 km, is relatively short, and transport of containers by rail is marginal. It is more developed for longer trips to the hinterland (Chad and Central African Republic), but service quality is poor. In Gabon, Libreville is close to the port of Owendo. However, 95% of containers from Libreville to Franceville go by rail. In the Democratic Republic of Congo (DRC), Katanga province receives container traffic from South Africa, Namibia and Mozambique. Containers move up the Congo and Kasaï rivers to Ilebo, whence they proceed to Katanga by rail.