what has regionalism left to multilateralism
TRANSCRIPT

What has Regionalism Left to Multilateralism ?
A Comprehensive Picture of the Trade and Protection Effect of
a Decade of Preferential Trade Agreements
Houssein Guimbard
J. Christophe Bureau
Sébastien Jean
IATRC, December 2013, Florida

Outline
• Motivations.
• Literature.• Literature.
• Descriptive evidence.
• Preliminary results of simulations.

Motivations• « DDA light package » adopted in Bali this month (Doha Development Agenda, launched in 2001). « Around 10% of the initial proposal ».
• Growing number of signed PTAs (Preferential Trade Agreements).Agreements).
• Launch of large scale negotiations (mega deals) among largestcountries this year.
• Specific databases built by CEPII (MAcMap-HS6 & BACI).
• Provide descriptive evidence on regionalism during the last 10 years, focusing on detailed tariffs and trade (WTO+ or WTO-X provisions not taken into account).
• Provide quantitative results about the effects of PTAs and recent negotiations (Mega Deals and others).

LiteratureLiterature

Theory
• Extensive theoritical literature since Viner (1950): Krugman
(1989), Grossman & Helpman (1994, 1995)…
• No clear consensus about positive or negative effects of
regionalism (or PTAs) when compared to multilateralism: « itsregionalism (or PTAs) when compared to multilateralism: « its
depends ». Many famous economists have tackle the issue.
▫ Bhagwati: still a stepping stone, spaggheti bowl, risk of
fragmentation of trade.
▫ Bergsten: it will help multilateralism in the end.
▫ Baldwin: WTO 2.0: international value chains.
• Limao: extend to non-reciprocal agreements. Special &
differential treatment as a risk for multilateralism (Bagwell &
Staiger, 2012).

Empirics
• WTO’s World Trade Report 2011 provides a comprehensivevision (presentation by R. Acharya, IATRC, December 2012).
• Many CGE analysis (APC, CPB, WB, CEPII…) studying the effects of various bilateral trade agreements.effects of various bilateral trade agreements.
• Considerable number of econometric estimates, most of them based on gravity (Cipollina & Salvatici 2010 for a review) even though recent developments on gravity lead to consider most studies prior to 2009 as suspect (multilateralresistance, etc.)
• Also an extensive literature on PTAs using other methodssuch as DD (Romalis). See Head and Meyer (2013) for a comparison.

Descriptive evidenceDescriptive evidence
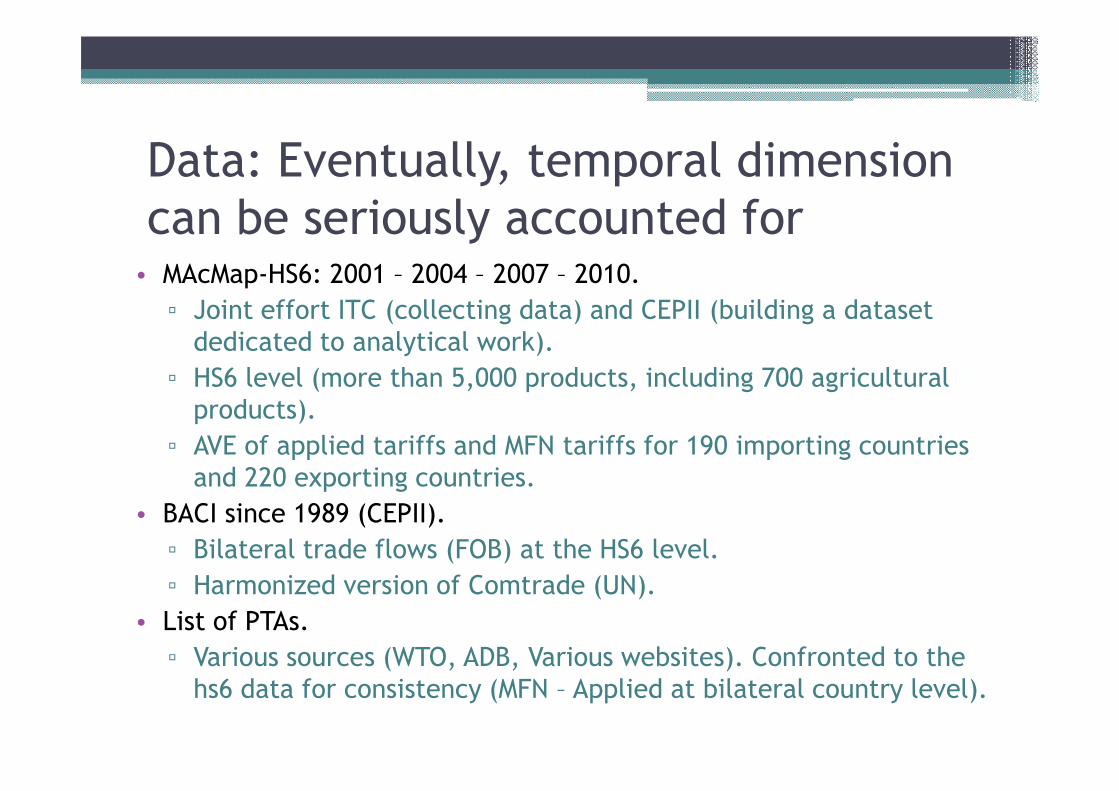
Data: Eventually, temporal dimension
can be seriously accounted for• MAcMap-HS6: 2001 – 2004 – 2007 – 2010.
▫ Joint effort ITC (collecting data) and CEPII (building a dataset
dedicated to analytical work).
▫ HS6 level (more than 5,000 products, including 700 agricultural
products).products).
▫ AVE of applied tariffs and MFN tariffs for 190 importing countries
and 220 exporting countries.
• BACI since 1989 (CEPII).
▫ Bilateral trade flows (FOB) at the HS6 level.
▫ Harmonized version of Comtrade (UN).
• List of PTAs.
▫ Various sources (WTO, ADB, Various websites). Confronted to the
hs6 data for consistency (MFN – Applied at bilateral country level).

Methodological Choices
• Definition of PTA adopted.
▫ Reciprocal tariffs dismantlement in goods between 2 or more
countries. Some agreements excluded (non reciprocal): LAIA, PTN,
PAFTA, IGAD, GSTP (EBA, AGOA initiative…). Partial Scope Agreements
are also excluded.
▫ Intra EU trade excluded, EU 27 considered as a single trade partner▫ Intra EU trade excluded, EU 27 considered as a single trade partner
over the period (while 10 new members in 2004 and 2 in 2007)
• Geographical aggregation: 5 groups of countries.
▫ Geographical aggregation to present synthetic results: Africa (also
includes Middle East), Asia, Europe (includes : Turkey and
Commonwealth of Independent States ), North America, South America
(includes: Central America).
• Sectoral aggregation.
▫ The definition of agriculture is one retained by the WTO.

Overall picture of world trade and tariffs
Sectors Applied 2001 Applied 2010 Sectors Trade 2001 Trade 2010
All products 5.5 4.3 All products 4,536 11,604
NAMA 4.5 3.5 NAMA 3,456 8,090
Agriculture 18.3 16.0 Agriculture 298 771Agriculture 18.3 16.0 Agriculture 298 771
Textile 11.6 10.1 Textile 209 404
Energy 1.9 1.2 Energy 573 2,338
Countries Applied 2001 Applied 2010 Countries Trade 2001 Trade 2010
Developed countries 3.5 2.7 Developed Countries 3,372 7,340
Developing countries 12.0 7.4 Developing Countries 1,129 4,088
LDCs 12.6 9.8 LDCs 35 176
Note: in 2001: 35% on world trade with nul MFN; 44% in 2010

Regional dimension of protection:
average duties by region
Region
2001 2004 2007 2010
Intra
AVE
Extra
AVE
Intra
AVE
Extra
AVE
Intra
AVE
Extra
AVE
Intra
AVE
Extra
AVEAVE AVE AVE AVE AVE AVE AVE AVE
Africa 10.1 11 10.1 10.2 6.1 7.5 5.9 7.7
Asia 8.5 7.6 6.9 6.4 6.1 5.6 4.9 5.1
Europe 2.9 3.9 2.5 3.4 2.4 3 2.5 3.1
North
America0.7 3.5 0.5 3.2 0.5 2.7 0.5 2.5
South
America8.2 9.3 5.7 8.2 4.2 7.5 3.8 7.4

Sensitive sectors in PTAs: Focus on
agricultureHS2
CodeNAME App 2001
MFN
2001
Rel MP
2001
App
2004
App
2007
App
2010
MFN
2010
Rel MP
2010
01 Live Animals 19.4 34 42.9 21.6 33.7 40.8 50.4 19
02 Meat and Edible Meat Offal 44.5 74.5 40.3 35.7 38.2 39.6 61.5 35.6
10 Cereals 32.3 50.7 36.3 21 19.9 32.6 38.3 14.9
17 Sugars and Sugar Confectionery 22.7 35.7 36.4 21.4 28.5 32.2 37.4 13.9
04Dairy Products (includes birds eggs, natural
honey)55.1 71 22.4 43.2 31.3 28.8 43.5 33.8
11 Products of the Milling Industry. Malt. Starches. 35.4 44 19.5 25.8 18.3 20.8 30.2 31.1
24 Tobacco and Manufactured Tobacco Substitutes 20.3 34.3 40.8 19.9 14.5 18.9 28.1 32.7
21 Miscellaneous Edible Preparations 12 20.6 41.7 10.4 12.9 17.9 25.4 29.5
12Oil Seeds and Oleaginous Fruits. Miscellaneous
Grains6.4 10.8 40.7 5.6 5.4 17.7 19.9 11.1
22 Beverages Spirits and Vinegar 10.1 14.6 30.8 11.5 11.5 14.9 22.3 33.2

Supply chains and PTAs
Ave 2010
Relative
Preferential
Margin 2010
Ave 2010
Relative
Preferential
Margin 2010
Ave 2010
Relative
Preferential
Margin 2010
All goods 16.04 13.9 15.88 9 16.75 30.3
Primary and intermediate goods 13.9 9.7 13.57 6.8 15.66 21.1
Sector Categories
ALL Outside FTA Inside FTA
Agriculture Primary and intermediate goods 13.9 9.7 13.57 6.8 15.66 21.1
Final goods 17.3 15.7 17.3 10 17.29 33.8
All goods 3.8 18.1 4.22 9.2 2.04 55.4
Primary and intermediate goods 3.22 17 3.55 7.8 1.84 54
Final goods 4.43 18.7 4.95 10.3 2.26 56.5
All goods 1.18 19.7 1.24 12.7 0.81 54.2
Primary and intermediate goods 0.58 14.7 0.63 4.5 0.24 68.8
Final goods 2.49 22.9 2.64 17 1.78 48.3
All goods 4.27 16.9 4.56 9.5 2.96 47.4
Primary and intermediate goods 3.18 15.4 3.39 7.4 2.23 47
Final goods 5.53 18.1 5.95 10.7 3.76 47.5
NAMA
Energy
All sectors
Agriculture

Quantitative effects of Quantitative effects of
regionalism and multilateralism
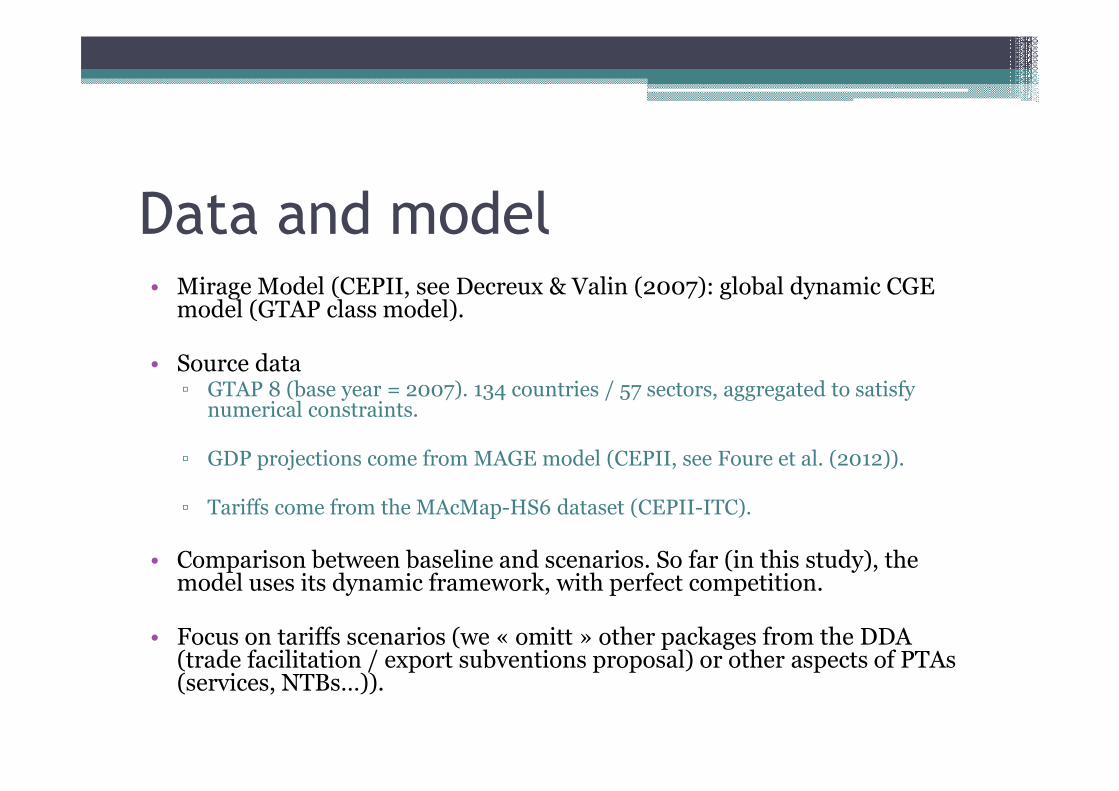
Data and model• Mirage Model (CEPII, see Decreux & Valin (2007): global dynamic CGE
model (GTAP class model).
• Source data ▫ GTAP 8 (base year = 2007). 134 countries / 57 sectors, aggregated to satisfy▫ GTAP 8 (base year = 2007). 134 countries / 57 sectors, aggregated to satisfy
numerical constraints.
▫ GDP projections come from MAGE model (CEPII, see Foure et al. (2012)).
▫ Tariffs come from the MAcMap-HS6 dataset (CEPII-ITC).
• Comparison between baseline and scenarios. So far (in this study), the model uses its dynamic framework, with perfect competition.
• Focus on tariffs scenarios (we « omitt » other packages from the DDA (trade facilitation / export subventions proposal) or other aspects of PTAs(services, NTBs…)).

Policy baseline and Scenarios
• Baseline: pre-experiment on tariffs (2007->2010).
• 1st block of scenarios: Consequences of PTAs (the role of PTAs in shapping world trade patterns and contributions PTAs in shapping world trade patterns and contributions to welfare).▫ Sc1: back to 2001 level (impacts of signed PTAs between
2001 and 2010).▫ Sc 2: Mega Deals & PTAs (tariff level in 2020: impacts « of
in negotiation PTAs »).▫ Sc 3: MFN (impacts of in force PTAs).
• 2nd block: Consequences of PTAs on DDA proposal(stumbling stones versus building blocks?).▫ DDA impact compared to Baseline, sc1, sc2 and sc3.

Variations of tariffs between scenarios
Sector
Baseline Sc 1 Sc 2 Sc 2 (bis) Sc 3 Sc 4
Applied
2010
Applied
2001
Future PTAs
(partial)
Future PTAs
(full)
MFN
2010
DDA
2020
All 3.77 4.86 3.27 2.50 5.08 3.03
Agriculture 13.77 15.78 12.87 8.39 18.67 11.49
NAMA 2.91 3.99 2.44 1.99 3.90 2.29

Preliminary Results: macroeconomic
indicators
sc1 sc2 sc3 sc4
Applied 2001 Future PTAs MFN 2010 DDA proposalVariables
Applied 2001 Future PTAs MFN 2010 DDA proposal
Exports (vol) -3.99 1.96 -3.18 2.42
World GDP (volume) -0.31 0.11 -0.05 0.14
World Welfare -0.29 0.08 -0.09 0.11
Variables
(in % compared to the baseline, 2025)

Preliminary Results: Variation of exports
sc1 sc2 sc3 sc4
Primary sectors 1 183.63 -2.52 1.91 1.66 2.04
Manufacture 660.00 -8.14 -0.42 -5.81 1.13
Services 275.91 -3.02 -0.48 -0.95 -0.49
Scenario : Variation of exports compared to baselineInitialSectorRegion
Africa
(in % compared to the baseline, 2025)
Services 275.91 -3.02 -0.48 -0.95 -0.49
Primary sectors 445.27 0.24 3.93 1.95 4.00
Manufacture 6 283.38 -9.38 3.73 1.21 5.67
Services 1 240.28 -1.77 0.60 0.35 0.17
Primary sectors 987.34 -0.96 2.66 -4.36 2.83
Manufacture 5 917.98 -1.04 1.20 -10.59 0.76
Services 2 025.99 0.06 -0.16 0.86 0.25
Primary sectors 487.12 -15.80 -0.23 -1.94 0.71
Manufacture 2 225.02 -1.11 1.95 -4.63 2.01
Services 690.33 1.42 0.44 -0.71 0.72
Primary sectors 274.57 -16.05 5.16 0.85 3.19
Manufacture 458.23 -5.10 4.44 -8.86 3.32
Services 127.24 3.39 3.85 0.28 0.90
Europe
North America
South America
Asia

Conclusion
• Challenge to synthetise detailed information (around 10 illustrations for the paper).
• Trade policies are not inactive even when• Trade policies are not inactive even whenmultilateralism does not « work » (decrease in tariffprotection since 2001).
• Regionalism has increase since 2001 and its effectsare non-neglectable.
• Impacts of Mega Deals as large as DDA !

Research agenda
• 2nd block of simulations to perform and interpret.
• Analysis of the simulations.
• Descritpives statistics with constant uv and weights ?
• Other sensitive analyses in CGE ?

Thank you for your attention !