what if joseph had used derivatives? hedging commodity price risk 1. many developing countries are...
TRANSCRIPT

What If Joseph Had Used Derivatives?Hedging commodity price risk
1. Many developing countries are highly dependent upon commodity production for exports, and also dependent upon some key commodity imports for food and energy. Thus exposes them to substantial amounts of commodity price risk.
2. Correlation between commodity prices, revenue, exports and output
3. Prices are VOLATILE -
4. Long swings
5. Long-term impact of short-term problem

Long swings in commodity prices• Raul Prebish, Singer (confirmed by Kindleberger) secular fall relative to
manufactured goods• Problem for terms of trade, national income and development• Attempts at import substitution• Attempts at commodity pools• Trend problems comes to fore when price take deep downward dive• This is sometimes misleadingly referred to as volatility

Export Dependence of Developing Countries
Africa Asia
Mauritania 99.8 Gambia, The 92.8 Yemen, Rep. 99.4
Mali 99.8 Malawi 92.7 Papua New Guinea96
Nigeria 99.3 Ghana 92.3 Kuwait 95.3
Ethiopia 99.3 Cameroon 92 Saudi Arabia 93.2
Chad 99.1 Madagascar 85.6 Syria 90.8
Rwanda 98.4 Mozambique 83.9 Mongolia 89.8
Gabon 98.1 Guinea-Bissau 82.5 Myanmar 88.6
Angola 97.8 Burkina Faso 80.1 Iran 86.5
Congo, Rep. 97.9 Tanzania 78.2 Oman 86.1
Nigeria 97.6 Senegal 74.6 Cambodia 82.8
Algeria 96.3 Kenya 71.7 Laos 71.3
Libya 96.1 Uganda 70.7 Vietnam 63.7
Benin 95.4 Zimbabwe 70.4 Jordan 61.3
Sudan 95.4 Cote d'Ivoire 68.7 Latin America
Zambia 95.4 Namibia 68.4 Ecuador 91.1
Togo 93.6 Egypt, Arab Rep. 68.4 Venezuela 88.5
Burundi 93.5 Sierra Leone 57.8 Chile 85.3
Guinea-Bissau 93.1 Central African Rep 57.4 Peru 84
South Africa 50.8 Bolivia 84
Paraguay 83
Panama 79.7
Russian Federation83.3 Costa Rica 75.5
Kazakhstan 82.2 Argentina 69.9
Georgia 82.2 Honduras 69.5
Turkmenistan 78.1 Guatemala 69.3
Moldova 77.3 Nicaragua 66.3
Tajikistan 75.3 Colombia 65.8
Azerbaijan 73.2 Uruguay 63.9
Ukraine 66.5 Trinidad and Tobago61.3
Bulgaria 64.5 El Salvador 58.8
Kyrgyz Republic 61.6
Armenia 56.1
Macedonia, FRY 52.5
Yugoslavia, FR 51.1
Commodities as % of Total Merchandise Export (1996)
Europe & Central Asia
Commodities as % of exports in 1996

TABLE 2 Correlations with Major Export Commodity Price
Country Commodity GDP Exports Revenue
Burundi Coffee -0.55 0.44 1
Colombia Oil 0.05 0.3 0.62
Ethiopia Coffee 0.44 0.33 0.36
Ghana Cocoa 0.75 0.22 0.72
Kazakhstan Oil 0.65 0.9 0.44
Nicaragua Coffee 0.48 0.4 0.48
Nigeria Oil 0.3 0.66 0.11
Uganda Coffee 0.65 0.52 0.64
Uruguay Beef 0.2 0 0.45
Venezuela Oil 0.01 0.71 0.5
-- GDP and Revenue in real 1995 local currency values
-- Exports in nominal U.S. dollar values
-- International Financial Statistics
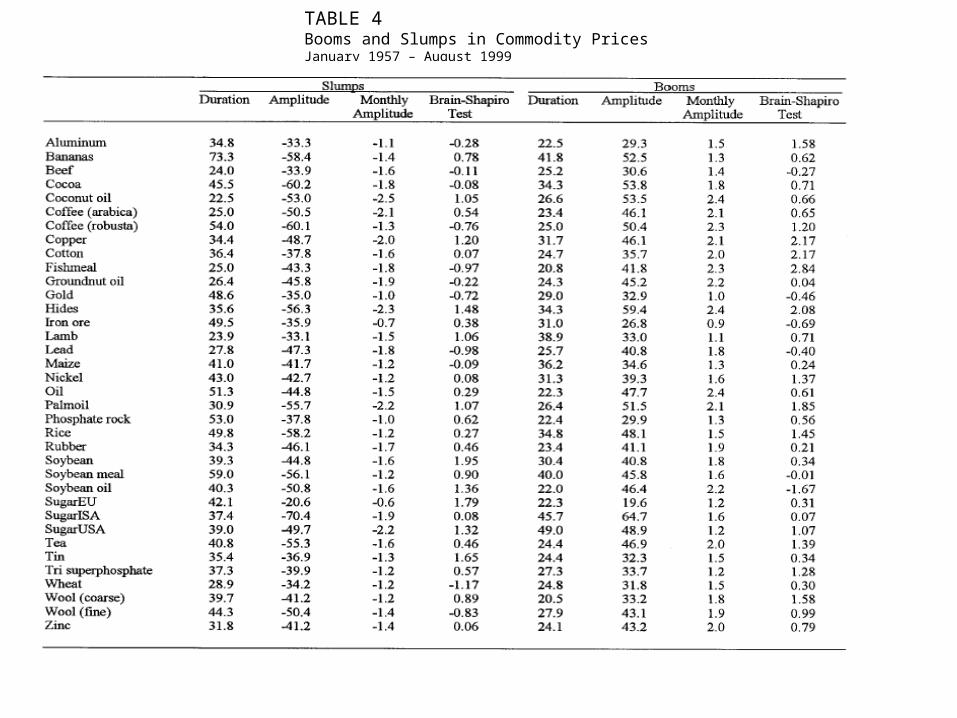
TABLE 4Booms and Slumps in Commodity PricesJanuary 1957 – August 1999

TABLE 3
PermanentAluminum 29 (1 & up) Beef 57, (20 & up) Coffee 150, (26 & up) Cocoa beansFishmeal 45, (18 & up) Coconut oil 70, (22 & up) Cotton 152, (26 & up) Coffee
(Robusta)Gasoline 44, 8 & up) Copper 81, (23 & up) Nickel 175, (26 & up) 103 (24 & up)
GoldIron Ore 32, (15 & up) Groundnut oil 58, (20 & up) Rice Hardwood (logs)Lamb 14, (9 & up) Lead 64, (21 & up) Natural gasRubber 43, (18 & up) Maize 55, (20 & up) PetroleumSoybean meal 26, (14 & up) Palm oil 64, (21 & up) SawnwoodSoybean 30, (15 & up) Phosphate rock 49, (19 & up) TinSugar (U.S.) 27, (14 & up) Soybean oil 51, (0 & up) TobaccoWheat 44, (18 & up) Wool (coarse) 70, (22 & up) TSP
Wool (fine) 57, (20 & up)Zinc 94, (24 & up)
Note: Estimated average duration (half-life) of price shocks (in months) is given by the first number in each relevant column and is followed by range of duration in parentheses.
Source: IMF Finance & Development (2001) “Do Commodity Price Shocks Last Too Long for Stabilization Schemes to Work? “
Duration of Commodity Price Shocks: 1957–199812 to 28 months 48 to 96 months 96 to 216 months
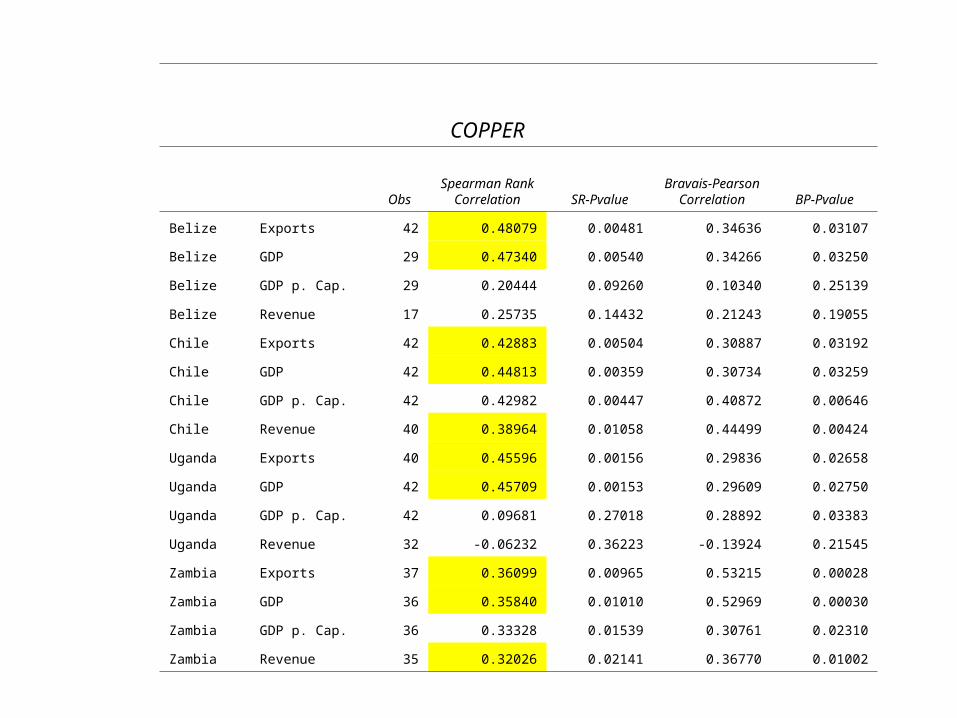
COPPER
ObsSpearman Rank
Correlation SR-PvalueBravais-Pearson
Correlation BP-Pvalue
Belize Exports 42 0.48079 0.00481 0.34636 0.03107
Belize GDP 29 0.47340 0.00540 0.34266 0.03250
Belize GDP p. Cap. 29 0.20444 0.09260 0.10340 0.25139
Belize Revenue 17 0.25735 0.14432 0.21243 0.19055
Chile Exports 42 0.42883 0.00504 0.30887 0.03192
Chile GDP 42 0.44813 0.00359 0.30734 0.03259
Chile GDP p. Cap. 42 0.42982 0.00447 0.40872 0.00646
Chile Revenue 40 0.38964 0.01058 0.44499 0.00424
Uganda Exports 40 0.45596 0.00156 0.29836 0.02658
Uganda GDP 42 0.45709 0.00153 0.29609 0.02750
Uganda GDP p. Cap. 42 0.09681 0.27018 0.28892 0.03383
Uganda Revenue 32 -0.06232 0.36223 -0.13924 0.21545
Zambia Exports 37 0.36099 0.00965 0.53215 0.00028
Zambia GDP 36 0.35840 0.01010 0.52969 0.00030
Zambia GDP p. Cap. 36 0.33328 0.01539 0.30761 0.02310
Zambia Revenue 35 0.32026 0.02141 0.36770 0.01002

COTTON
ObsSpearman Rank
Correlation SR-PvalueBravais-Pearson
Correlation BP-Pvalue
Chile Exports 42 0.40199 0.00459 0.45343 0.00165
Chile GDP 42 0.40264 0.00453 0.45395 0.00163
Chile GDP p. Cap. 42 0.10607 0.24591 0.02586 0.43344
Chile Revenue 40 0.35610 0.01216 0.32709 0.01929
Colombia Exports 42 0.45450 0.00161 0.43064 0.00263
Colombia GDP 42 0.45612 0.00156 0.43005 0.00266
Colombia GDP p. Cap. 42 0.40183 0.00460 0.41971 0.00326
Colombia Revenue 8 0.38095 0.14063 0.27729 0.21644
Nigeria Exports 42 0.32907 0.01648 0.17580 0.12728
Nigeria GDP 42 0.33004 0.01622 0.17523 0.12805
Nigeria GDP p. Cap. 42 0.49097 0.00073 0.32366 0.01797
Nigeria Revenue 37 0.37767 0.01080 0.34330 0.01839
Peru Exports 13 0.36813 0.09220 0.51960 0.03050
Peru GDP 13 0.36813 0.09220 0.51841 0.03080
Peru GDP p. Cap. 13 0.43956 0.05650 0.23068 0.20278
Peru Revenue 12 0.51049 0.03850 0.61456 0.01663
Zambia Exports 37 0.30785 0.03237 0.47792 0.00207
Zambia GDP 36 0.32124 0.02696 0.47466 0.00220
Zambia GDP p. Cap. 36 0.33807 0.01987 0.44638 0.00331
Zambia Revenue 35 0.39328 0.00999 0.55155 0.00055

PETROLEUM
Obs
Spearman Rank
Correlation SR-
Pvalue
Bravais-Pearson
Correlation BP-
Pvalue Bahrain Exports 36 0.51770 0.00357 0.35603 0.03216 Bahrain GDP 27 0.48962 0.00548 0.35915 0.03101
Bahrain GDP p. Cap. 27 0.82537 0.00000 0.88841 0.00000
Bahrain Revenue 27 0.62576 0.00057 0.44926 0.00979 Belize Exports 42 0.54187 0.00176 0.53663 0.00193 Belize GDP 29 0.55764 0.00134 0.54879 0.00156
Belize GDP p. Cap. 29 0.41194 0.00380 0.37678 0.00731
Belize Revenue 17 0.70588 0.00180 0.33723 0.08220 Colombia Exports 42 0.25023 0.05244 0.27126 0.03938 Colombia GDP 42 0.26407 0.04351 0.27303 0.03841
Colombia GDP p. Cap. 42 0.32335 0.01806 0.26561 0.04259
Colombia Revenue 8 -0.14286 0.34308 -0.08472 0.40531 Cote d'Ivoire Exports 42 0.36097 0.00966 0.13182 0.19647 Cote d'Ivoire GDP 42 0.35380 0.01093 0.12626 0.20661 Cote d'Ivoire
GDP p. Cap. 42 0.38556 0.00623 0.23194 0.06640
Cote d'Ivoire Revenue 5 0.10000 0.41153 0.06426 0.44287 Nigeria Exports 42 0.33100 0.01597 0.29239 0.02905 Nigeria GDP 42 0.33003 0.01623 0.29144 0.02946
Nigeria GDP p. Cap. 42 0.57496 0.00010 0.74699 0.00000
Nigeria Revenue 37 0.39497 0.00814 0.51574 0.00085 Venezuela Exports 42 0.26879 0.04076 0.47233 0.00110 Venezuela GDP 42 0.24811 0.05392 0.46489 0.00129
Venezuela GDP p. Cap. 42 0.71274 0.00000 0.87463 0.00000
Venezuela Revenue 41 0.31051 0.02339 0.72440 0.00000

-30
-20
-10
0
10
20
30
40
50
1970 1975 1980 1985 1990 1995 2000
World Coffee Prices (NY): Monthly Nominal Percentage Changes

-20
-10
0
10
20
30
1970 1975 1980 1985 1990 1995 2000
World Cocoa Prices: Monthly Nominal Percentage Changes

-20
0
20
40
60
80
100
1970 1975 1980 1985 1990 1995 2000
Average Crude Petroleum Prices: Monthly Nominal Percentage Changes

-30
-20
-10
0
10
20
30
1970 1975 1980 1985 1990 1995 2000
World Cotton Prices: Monthly Nominal Percentage Changes

-20
-10
0
10
20
30
1970 1975 1980 1985 1990 1995 2000
US Gulf Wheat Prices: Monthly Nominal Percentage Changes
-30
-20
-10
0
10
20
30
1970 1975 1980 1985 1990 1995 2000
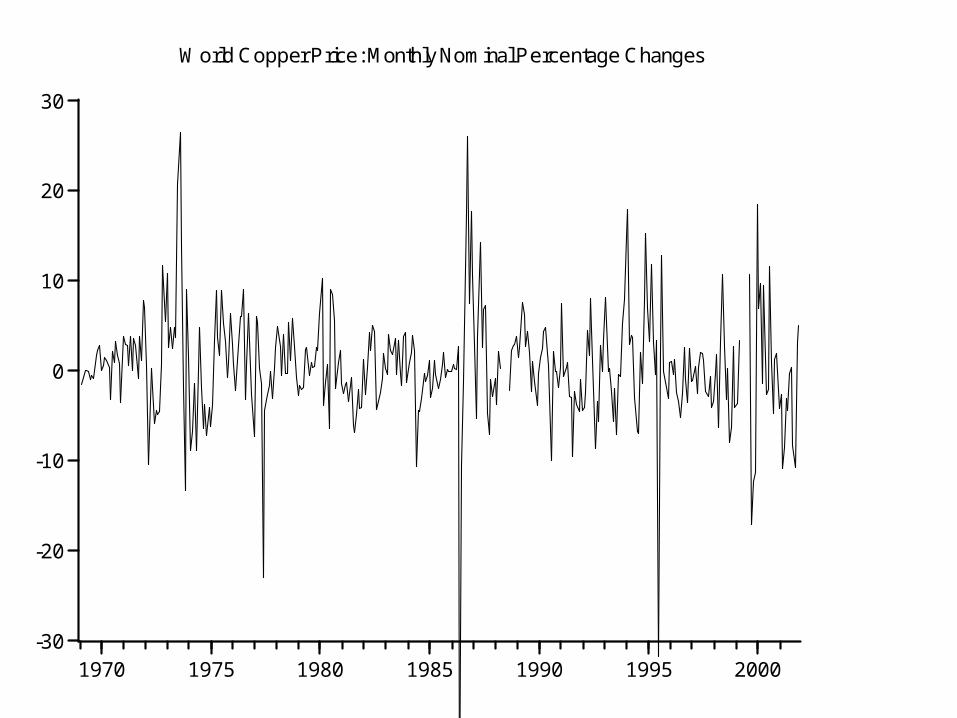
World Copper Price: Monthly Nominal Percentage Changes

4000
8000
12000
16000
20000
24000
28000
32000
36000
40000
1970 1975 1980 1985 1990 1995 2000
R_ALU
0
1000
2000
3000
4000
5000
1970 1975 1980 1985 1990 1995 2000
R_COBNY
0
400
800
1200
1600
2000
2400
1970 1975 1980 1985 1990 1995 2000
R_COCONY
0
5000
10000
15000
20000
25000
30000
35000
1970 1975 1980 1985 1990 1995 2000
R_COPPA
200
400
600
800
1000
1200
1400
1600
1970 1975 1980 1985 1990 1995 2000
R_COTTUSO
0
100
200
300
400
500
600
700
800
1970 1975 1980 1985 1990 1995 2000
R_PETRACP
0
50
100
150
200
250
300
350
1970 1975 1980 1985 1990 1995 2000
R_SUGCAR
0
40000
80000
120000
160000
200000
1970 1975 1980 1985 1990 1995 2000
R_TIN
0
500
1000
1500
2000
2500
3000
3500
4000
1970 1975 1980 1985 1990 1995 2000
R_WHUS
0
5000
10000
15000
20000
25000
30000
1970 1975 1980 1985 1990 1995 2000
R_ZINC
Real Commodity Prices: Absolute Values (Deflated by World CPI (IFS)), Monthly 1969 - 2001, Source: Unctad

Short-term price fluctuations• Although the focus of many observers and economists has been towards long-term price movements, the importance of short-term fluctuations did not go unnoticed. Singer (1950, 1958) made several observations about their importance.• “fluctuations in the volume and value of foreign trade tend to be proportionately more violent in that of underdeveloped countries and therefore a fortiori also more important in relation to national income.” Singer (1950, p. 473)• “The case for stabilization of terms of trade … has, it seems to me, nothing to do with the existence of their secular trends but a great deal to do with their large and extremely damaging cyclical and short-term fluctuations. Long-run trends are if anything an argument against stabilization of terms of trade, as I believe most sensible people agree. But the violent cyclical and short-term fluctuations certainly add to the underlying difficulty discerned by Prebisch and others.” Singer (1958, p. 85)• A clear and simple method for analyzing price movements is to break them down into movements along a trend and then movements around that trend. The former are associated with long-term economic factors while the latter are short-term fluctuations that are associated with either short-term factors or even “noise.”

The costs of volatility• Volatility interrupts investment, development and growth• Income variability retards development by slowing savings, discouraging investment and lowering living standards• Hampers ability to service debt• Reduces social welfare because the because of concave utility functions, i.e. diminishing marginal utility of income means that benefit of upswing is less then cost of downswing.• Government budget are correlated with commodity prices, and so fiscal policy becomes pro-cyclical. • Also, the volatility of prices of primary exports shapes the credit rating of the developing country government. High volatility can thereby lead to higher borrowing costs because investors take into consideration the dependence of the government on export commodity prices for their revenue needed to service foreign debt.• Effect on the integrity of prices as market signals, and use of signals for short and long term signals for consumption and investment decisions

Commodities vs Stocks
0
50
100
150
200
250
300
350
400
Cocoa
Coffee
Copper
Oil
Rubber
S&P

Commodities vs Stocks
-0.3
-0.2
-0.1
0
0.1
0.2
0.3
0.4
0.5
0.6
19
93
M2
19
93
M8
19
94
M2
19
94
M8
19
95
M2
19
95
M8
19
96
M2
19
96
M8
19
97
M2
19
97
M8
19
98
M2
19
98
M8
19
99
M2
19
99
M8
20
00
M2
20
00
M8
20
01
M2
20
01
M8
20
02
M2
20
02
M8
Cocoa Coffee
Copper Oil
Rubber S&P


