what is behind latin america’s declining income inequality? · of a rising middle class. second,...
TRANSCRIPT

WP/14/124
What is Behind Latin America’s Declining
Income Inequality?
Evridiki Tsounta and Anayochukwu I. Osueke

© 2014 International Monetary Fund WP/14/124
IMF Working Paper
Western Hemisphere Department
What is Behind Latin America’s Declining Income Inequality?*
Prepared by Evridiki Tsounta and Anayochukwu I. Osueke
Authorized for distribution by Dora Iakova
July 2014
Abstract
Income inequality in Latin America has declined during the last decade, in contrast to the
experience in many other emerging and developed regions. However, Latin America remains
the most unequal region in the world. This study documents the declining trend in income
inequality in Latin America and proposes various reasons behind this important development.
Using a panel econometric analysis for a large group of emerging and developing countries,
we find that the Kuznets curve holds. Notwithstanding the limitations in the dataset and of
cross-country regression analysis more generally, our results suggest that almost two-thirds
of the recent decline in income inequality in Latin America is explained by policies and
strong GDP growth, with policies alone explaining more than half of this total decline.
Higher education spending is the most important driver, followed by stronger foreign direct
investment and higher tax revenues. Results suggest that policies and to some extent positive
growth dynamics could play an important role in lowering inequality further.
JEL Classification Numbers: D63, D31, E6, H53, I28, I38
Keywords: Income inequality, Latin America, Gini, emerging economies, Kuznets
Author’s E-Mail Address:[email protected]; [email protected]
*We are grateful to Luis Cubeddu for encouring us to work on this topic and to Dora Iakova for her strong support
and guidance throughout this project.We also thank Alejandro Werner, Ravi Balakrishnan, Maura Francese,
This Working Paper should not be reported as representing the views of the IMF.
The views expressed in this Working Paper are those of the author(s) and do not necessarily
represent those of the IMF or IMF policy. Working Papers describe research in progress by the
author(s) and are published to elicit comments and to further debate.

3
Mumtaz Hussain, Grace Li, Bernardo Lischinsky, Nicolas Magud, and Chris Papageorgiou for helpful comments
and suggestions. Patricia Delgado provided production assistance. All errors are ours.
Contents Page
Abstract ......................................................................................................................................2
I. Introduction ............................................................................................................................4
II. Social Indicators: Some Stylized Facts .................................................................................7
A. The Good News: Considerable Improvements in Social Indicators .........................7 B. The Bad News: Still a Long Way to Go..................................................................11
III. What Determines Income Inequality in Latin America? ...................................................15
A. Simple Correlations.................................................................................................16 B. Does the Kuznets Curve Exist? ...............................................................................17 C. Policies to the Rescue ..............................................................................................18
IV. Conclusions and Policy Implications.................................................................................20
References ................................................................................................................................22
Annex .......................................................................................................................................26
Appendix ..................................................................................................................................35

4
I. INTRODUCTION
In the last decade, Latin America (LA) has enjoyed strong economic growth coupled with
improved social indicators.1 The region’s real GDP has grown by an annual average of over 4
percent, almost twice the rate of the 1980s and 1990s, while unemployment declined steadily
to multi-year lows; public debt and inflation also declined significantly. Social indicators also
improved—poverty rate, income inequality and polarization declined markedly. The region’s
decline in income inequality is in contrast to other emerging and developed regions which
have experienced rising income inequality despite buoyant economic conditions over the last
decade. The downward trend in income inequality in LA is tempered however, by the fact
that the region remains the most unequal in the world. Also worrisome is the fact that the
latest data point to a small reversal of the declining trend in inequality in some countries,
such as Bolivia, Ecuador, Mexico, Paraguay, and Peru; though it is too soon to know if this
reversal suggests an emerging trend.
Understanding the key drivers behind the decline in income inequality in Latin America is
therefore particularly important. Countries that effectively address income disparities tend to
experience more harmonious civil and political societies, and typically have more sustainable
growth (Berg and Ostry, 2011; and Ostry, Berg, and Tsangarides (2014)).2 Indeed, inequality
could limit a country’s growth potential and could result in higher poverty during bad
economic times (see Jaumotte, Lall, and Papageorgiou (2008) for more details). In addition,
in societies with stagnant growth, inequality could lead to a backlash against economic
liberalization and protectionist pressures, limiting the ability of economies to benefit from
globalization. Some also argue that rising income shares at the top of the income distribution
could lead to credit booms and eventually to financial crises.
There is no consensus in the literature on the causes behind the decline in income inequality
in Latin America; moreover, statistical noise created by variations in inequality surveys force
researchers to be cautious when drawing conclusions from data trends. Notwithstanding these
concerns, studies often cite structural reforms and increased social spending, a decline in skill
premia, and strong macroeconomic policies as major contributing factors in the inequality
decline in Latin America. Specifically, Reynolds (1996) emphasizes higher social spending
on education and healthcare as primary drivers of Latin America’s declining income
inequality. Others point to the reduction in educational inequality and skill premia amid
rising supplies of skilled labor and institutional reforms (World Bank, 2011; and Cornia,
1 Unless otherwise noted, Latin America in our analysis refers to Argentina, Bolivia, Brazil, Chile, Colombia,
Costa Rica, Dominican Republic, Ecuador, El Salvador, Guatemala, Honduras, Mexico, Nicaragua, Panama,
Paraguay, Peru, Uruguay, and Venezuela.
2 More unequal societies typically have limited investments in human capital given the high opportunity cost of
studying and credit market imperfections. In addition, inequality is typically associated with higher political
instability that results in lower physical capital accumulation and thus GDP growth. 3 While there are various
measures of inequality, including wealth, opportunities and gender, our focus is primarily on income inequality.
For a broader discussion of inequality issues, please refer to IMF (2014a).

5
2012). Cornia (2012) concludes that Latin America’s inequality decline was driven by more
equitable macroeconomic, tax, social expenditure and labor market policies; and Soares et al.
(2009) find that conditional cash transfers accounted for 15-21 percent of the inequality
reduction in Brazil, Mexico and Chile. Goñi, López and Servén (2008), on the other hand,
find that in most Latin American countries the fiscal system is of little help in reducing
income inequality while Bucheli and others (2012) find large disparities on the redistributive
effects of in-kind benefits and tax policies, despite a widespread decline in income
inequality.
There are also mixed views about the importance of external factors in explaining the recent
decline in income inequality. Cornia (2012) finds that terms of trade, migrant remittances,
foreign direct investment (FDI) and world growth played a small role in explaining the
decline in income inequality in a group of 18 Latin American countries. In contrast, Coble
and Magud (2010) find that improvements in terms of trade have actually widened the
Chilean skill premium and thus raised income inequality.
The purpose of this study is two-fold.
First, we document developments in social indicators (e.g., income inequality, access to
education and basic services, poverty and polarization) in recent years by looking at
historical trends and cross-regional comparisons.3 We also investigate if there has been a
convergence of income levels across population segments in Latin America, an indication
of a rising middle class.
Second, in contrast to most studies which analyze the causes of income inequality for one
or a small group of countries, we explore possible drivers behind the decline in income
inequality in Latin America as a whole. To undertake this task, we utilize an array of
methodologies—including correlation and econometric techniques. To start, we look at
simple correlations between changes in policy variables and changes in income inequality
in Latin America, and then investigate econometrically in a panel regression for a large
group of emerging and developing countries the importance of policies, GDP growth, and
external factors in explaining the decline in income inequality—an issue that, as already
noted, remains highly contested.
3 While there are various measures of inequality, including wealth, opportunities and gender, our focus is
primarily on income inequality. For a broader discussion of inequality issues, please refer to IMF (2014a).
6
Our approach has two important advantages. First, we deploy several methodologies to
ensure the robustness of our results. Second, we extend the sample beyond Latin American
countries to offer a more informed perspective into what drives income inequality, while
providing additional degrees of freedom in our econometric analysis.4 This is a novelty
compared to most of the studies analyzing income inequality in LA which rely primarily on
correlations and only concentrate on a small sample of LA countries.
Our main results are as follows:
Latin America and Sub-Sahara Africa are the only regions that have experienced declines
in income inequality in the last decade. Latin America saw a decline in its Gini coefficient
of around 3 Gini points over the last decade; it also experienced declining trends in poverty
and polarization rates since the 1990s and saw a large surge in its middle class. However,
Latin America remains the most unequal region in the world, with education and health
outcomes less favorable than in other regions with comparable spending levels.
Notwithstanding the inherent limitations of the data set and of cross-country regression
analysis more generally, we find that well-designed policies explain more than half of the
decline in income inequality in Latin America. Our econometric analysis suggests that
higher education spending is the most important contributor to the decline in income
inequality (explaining almost one-fourth of the total decline) followed by higher FDI (partly
reflecting strong economic fundamentals), and higher tax revenue. We find that appreciating
exchange rates have a small but dampening effect on equality. Our results quantitatively
support the assertions that policies have been important in explaining the decline in LA’s
income inequality (Reynolds, 1996; and World Bank, 2011). We also confirm the existence
of the Kuznets curve, which suggests that economic growth has been conducive to declining
income inequality, thought (as is typical in the literature) we find that its impact has been
limited. The correlation analysis for our sample of Latin American countries suggests that tax
revenues (including from direct and property taxation) and spending on education are
negatively correlated with inequality.
The remainder of the paper is organized as follows. Section II provides stylized facts on the
changes in social indicators in Latin America from a historical perspective as well as in cross
country comparisons. Section III analyzes the drivers behind Latin America’s changes in
income inequality using correlation and econometric analyses; Section IV concludes.
4 We control for country-specific differences (e.g., institutional characteristics) by including country-fixed
effects.

7
II. SOCIAL INDICATORS: SOME STYLIZED FACTS
A. The Good News: Considerable Improvements in Social Indicators
During the last decade, income inequality, poverty and
polarization rates have declined significantly in Latin
America, while the middle class surged (Figure 1).5
The Gini coefficient—the most widely used measure of
income inequality—has declined by an (unweighted)
average of around 3-4 Gini points in the last decade;
now hovering at around 50 Gini points (out of 100,
World Bank, 2014).6 Data from the Socio-Economic
Database in Latin America and the Caribbean
(SEDLAC) suggest that the average decline in the Gini
coefficient over the last decade is around 4 Gini points
while World Bank data suggest an average decline of
around 3 Gini points.7
The decline in income inequality is impressive, given
the widening income inequality in other emerging
market and advanced economies (Figure 2). Poverty is
also on the decline in most LA countries, despite the
recent global financial crisis. In addition, almost half of
Latin America’s population is now regarded as middle
class which is up from a mere 20 percent of the
population just a decade ago (Figure 1).8
We also investigate how the change in income
inequality in LA compares to the developments in other
regions over the last two decades. To undertake this
analysis we document episodes of large changes
(increases and decreases) in the Gini coefficient using a
5 Polarization measures how distant the rich and poor are from one another. (Gigliarano and Muliere, 2012). 6 Like most studies we take the average Gini coefficient across many countries (as in IMF (2014a)), which
essentially assumes that we can rank (and thus compare) income of households in different countries (see for
example, Deaton (2010, 2013) and Deaton and Heston (2010) for a discussion of the limitations of this
approach).
7 In our econometric analysis and when undertaking cross-country comparisons, we utilize the latter database
that homogenizes differences in household surveys across time and countries and uses, when available, after tax
and transfers Gini estimates. In contrast, SEDLAC data refer to the distribution of household’s per capita
income, taking into account family size.
8 Following Milanovic and Yitzhaki (2002) we define as middle class people with per capita income between
$10-$50 per day (2005 PPP).
40
44
48
52
56
2000 2004 2008 2012
12
16
20
24
28
32
Poverty (%, rhs)²
Inequality (Gini coefficient)
Polarization
Figure 1. Latin America: Poverty, Polarization, Inequality and the
Middle Class since 2000¹ (Simple average)
Sources: PovcalNet; SEDLAC; World Bank, World Development Indicators ; and authors'
calculations.
¹ Includes Argentina, Bolivia, Brazil, Chile,
Colombia, Costa Rica, Dominican Republic, Ecuador, El Salvador, Honduras, Mexico,
Panama, Paraguay, Peru, Uruguay, and
Venezuela.
² Poverty line of US$2.5 per day.³ Middle class is defined as people with per
capita income between $10-$50 per day
(2005 PPP),
as defined by Milanovic, Branko and Yitzhaki, Shlomo (2002), “Decomposing
World Income Distribution: Does the World
Have a Middle Class?”, Review of Income and Wealth, International, Vol. 48(2).
-20 0 20 40 60
URYCHLCRI
MEXARGBRAVENPER
GUAPRYECU
DOMPANCOLNICESVBOL
HON
2000Change
2010 Middle Class³(Percent of population)

8
sample of over 170 countries for the period 1990–2012. We define “large” as a change in the
Gini coefficient of at least 3 Gini points between the 1990s and the latest available year.
Table 1 suggests that out of a sample of 29 countries that have experienced large declines in
income inequality over the last two decades, almost half of them are actually located in Latin
America.9 Table 2 reports countries with large increases in income inequality, this sample
includes Honduras and Costa Rica. Particularly worrisome is the fact that countries with
significant increases in income inequality have actually experienced strong growth
momentum during the same period.
9 Argentina’s Gini coefficient increased dramatically following the debt crisis in the early 2000s and then
subsequently declined. For a data disclaimer on Argentinean data please look at Appendix 2.1 in IMF (2014b).
Sources: OECD; World Bank, World Development Indicators; and authors' calculations.¹ Includes Argentina, Belize, Bolivia, Brazil, Chile, Colombia, Ecuador, Guatemala, Honduras, Mexico, Nicaragua, Panama, Paraguay, Peru, Uruguay and
Venezuela RB.² Includes Burkina Faso, Burundi, Cameroon, Central African Republic, Chad, Comoros, Congo, Dem. Rep., Congo, Rep., Cote d'Ivoire, Ethiopia, Gabon, Ghana, Guinea, Kenya, Liberia, Madagascar, Malawi, Mali, Mozambique, Namibia, Niger, Nigeria, Rwanda, Senegal, Seychelles, South Africa, Swaziland, Tanzania, Uganda, and Zambia.
³ Includes China, India, Indonesia, Philippines, Malaysia, Singapore, and Thailand.⁴ Includes Australia, Austria, Belgium, Canada, Denmark, Finland, France, Germany, Greece, Iceland, Ireland, Israel, Italy, Japan, Republic of Korea, Luxembourg, Malta, Netherlands, Norway, Portugal, Spain, Sweden, Switzerland, United Kingdom, and United States.
⁵ Includes Bulgaria, Croatia, Estonia, Georgia, Hungary, Latvia, Lithuania, Poland, Romania, Turkey, and Ukraine.⁶ National coverage of poverty headcount (% of population living in households with consumption or income per person below the poverty line of $76 per
month ($2.5 per day)) for all countries .
-4 -3 -2 -1 0 1 2
Advanced Economies⁴
EM Europe⁵
EM Asia³
Sub-Sahara Africa²
LA¹
Change in Gini Index, since 2000(In Gini points)
Inequality by Region (Gini coefficient simple average, 2005-10)
0 20 40 60
Advanced Economies
EM Europe
EM Asia
Sub-Sahara Africa
LA
Poverty rate,⁶ 2010
(Pecent of population)
0 20 40 60 80
EM Europe
LA
EM Asia
Sub-Sahara Africa
Change in Poverty Rate, since 2000(Pecent of population)
-15 -10 -5 0
EM Europe
Sub-Sahara Africa
LA
EM Asia
Figure 2. Developments in Inequality and Poverty since 2000

9
These favorable general trends mask important cross-country disparities (Figure 3).
Honduras and Costa Rica actually experienced rising Gini coefficients over the last decade,
with Honduras also experiencing a rising poverty rate. Klasen and others (2012) suggest that
the increase in inequality and poverty in Honduras is explained by the rise in the dispersion
of labor incomes in rural areas between the tradable and non-tradable sectors (amid
overvalued currency and poor agricultural exports), combined with highly segmented labor
markets and poor overall educational progress. A large informal sector, widening wage gaps
and a large unskilled labor force given the economic crisis of the 1980s that deterred many
people from finishing high school are often cited as the reasons driving the increase in
inequality in Costa Rica (Hidalgo, 2014).
Figure 3 also presents a simple correlation analysis for LA countries which suggests that
there is a conditional convergence in income inequality—countries with higher income
inequality tend to experience larger declines in their Gini coefficient. Similarly, there appears
to be conditional convergence for poverty rates as well.
Sources: SEDLAC; World Bank, World Development Indicators ; and authors' calculations.
¹Latest value versus average Gini value in the 1990s. Countries with at least 3 Gini points
increase.
Change (in Gini points)
Mali -17.5
Peru -13.1
Bolivia -11.6
Kyrgyz Republic -11.5
El Salvador -9.8
Ecuador -9.7
Swaziland -9.2
Burkina Faso -9.0
Armenia -8.9
Nicaragua -8.7
Senegal -7.5
Brazil -7.4
Ukraine -6.7
Malawi -6.4
Central African Rep. -5.0
Kazakhstan -5.0
Mexico -4.9
Tunisia -4.9
Argentina -4.8
Paraguay -4.7
Burundi -4.6
Jordan -4.5
Niger -4.3
Chile -4.2
Thailand -4.0
Russian Federation -3.9
Panama -3.7
Moldova -3.5
Colombia -3.1
Table 1. Countries with large decline in
Income Inequality¹
Change (in Gini points)
Macedonia, FYR 15.4
Indonesia 8.4
Croatia 6.4
China,P.R.: Mainland 6.3
Zambia 5.5
Lithuania 5.5
Albania 5.4
South Africa 5.2
Hungary 4.3
Laos 4.1
Latvia 3.8
Tanzania 3.8
Costa Rica 3.4
Uganda 3.4
Slovak Republic 3.4
Nigeria 3.1
India 3.1
Honduras 3.1
Table 2. Countries with Large Increase in
Income Inequality¹

10
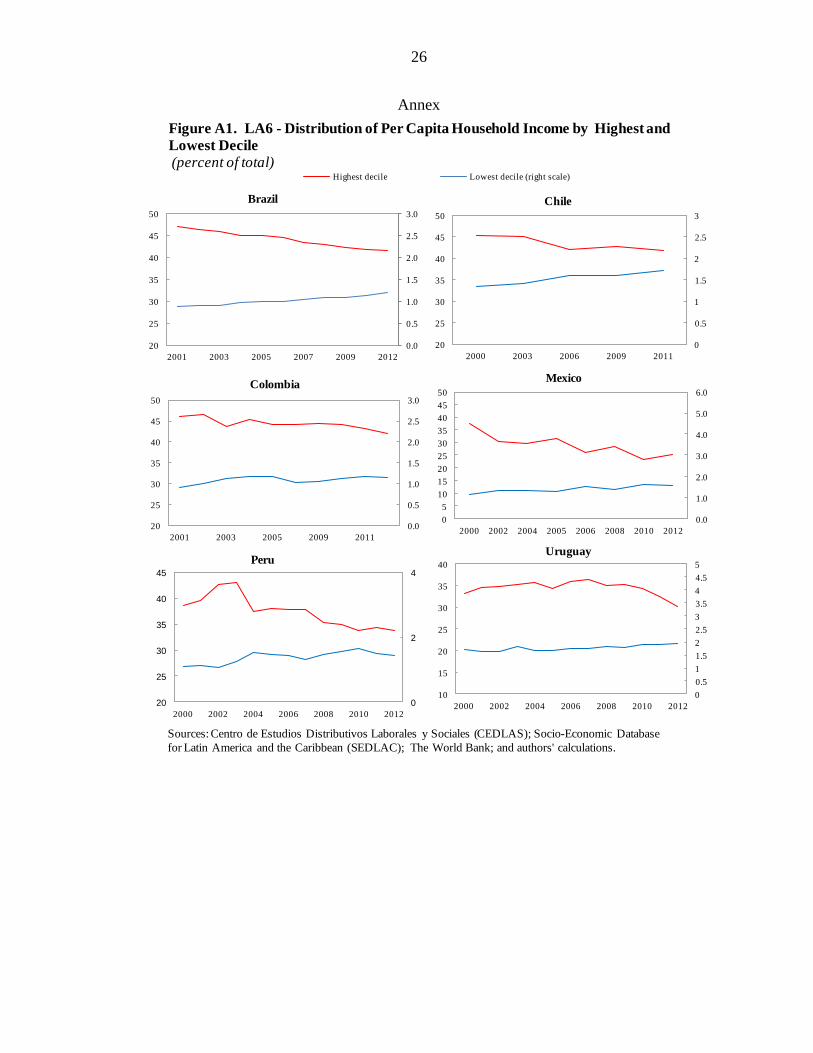
Figures A1–A3 in the Annex show the convergence (narrowing of the income gap) in
households’ per capita income over the last decade by depicting the shares of total income
earned by the highest and lowest earners. These figures, however, also document the rising
inequality in Honduras and Costa Rica over the last decade with the income gap between the
highest and lowest earners rising.
To explore further the decline in income inequality in most Latin American countries in
recent years, we construct growth incidence curves (GIC; Ravallion and Chen, 2003). The
GIC indicates the growth rate in income between two points in time (over the last decade in
our analysis) at each decile of the distribution (Figures A4–A6 in the Annex). If inequality
falls, then the distribution of growth rates must be a decreasing function of the deciles,
meaning that lower-income households enjoy faster growth rates in their income than higher-
income households.
Using data from the Socio-Economic Database for Latin America and the Caribbean
(SEDLAC and The World Bank, 2014), we observe that in most Latin American countries
the distribution of income growth rates is a decreasing function of the deciles, confirming
that inequality has fallen over the last decade (Honduras is a notable exception).
As extensively documented in the literature, declining income inequality in LA coincided
with declining skill premia in most countries over the last decade (Figure 4). In 2012 high-
Bolivia
El Salvador
EcuadorPeruArgentina
BrazilNicaraguaMexicoChile
PanamaParaguay
Dominican Republic Colombia
Uruguay
GuatemalaVenezuelaHonduras
Costa Rica
-16
-12
-8
-4
0
4
8
40 45 50 55 60 65
Ch
an
ge in
Gin
i S
ince 2
000
Initial Gini Value(In 2000)
-14 -12 -10 -8 -6 -4 -2 0 2 4
BoliviaEl Salvador
EcuadorPeru
ArgentinaBrazil
NicaraguaMexico
ChilePanama
ParaguayDominican Republic
ColombiaUruguay
GuatemalaVenezuelaHonduras
Costa Rica
Figure 3. Latin America: Change in Gini Coefficient and Poverty Rates since 2000
Bolivia
ColombiaPeru
NicaraguaEcuadorBrazil
El Salvador
VenezuelaCosta Rica
PanamaParaguay
MexicoArgentinaChile
Dominican Republic
Uruguay
Honduras
-30
-25
-20
-15
-10
-5
0
5
0 20 40 60
Ch
an
ge
in P
ove
rty S
ince
20
00
Initial Poverty Rate (in 2000)
-30 -25 -20 -15 -10 -5 0 5
BoliviaColombia
PeruNicaragua
EcuadorBrazil
El SalvadorVenezuelaCosta Rica
PanamaParaguay
MexicoArgentina
ChileDominican Republic
UruguayHonduras
Sources: Socio-Economic Database for Latin America and the Caribbean; and authors' calculations.¹ The change is calculated as the difference between the latest available observation and the data in 2000.² Poverty headcount refers to the poverty line of US$ 2.5 (PPP) per day.
Poverty ¹,²
Gini¹
Change in Gini since 2000 (In Gini points)
Change in Poverty Rate since 2000 (In percent of popluation)

11
skilled workers earned on average 2.7 times
the wages of low-skilled workers (compared to
4 times more in 2000). Lopez-Calva and Lustig
(2010) and Azevedo et al. (2013) posit that the
most important factor behind the decline in the
returns to education has been an increase in the
relative supply of workers with completed
secondary and tertiary education—resulting
from significant educational upgrading that
took place in the region during the 1990s
(Cruces et al., 2011). The significance of
education spending in explaining the decline of
income inequality will be examined in Section
B. The Bad News: Still a Long Way to Go
The recent improvements in social indicators cannot mask the social challenges of Latin
America. Despite the declining trend in income inequality and, in most cases, the
convergence in incomes, Latin America remains the most unequal region in the world
(Figure 2). Income disparities are staggering—the richest 10 percent of households in Latin
America possess on average 37 percent of the total per capita income while the poorest
10 percent possess a mere 1.5 percent, i.e., the richest households earn 25 times more than
the poorest households (Figure 5). The difference in incomes between the lower- and higher-
income households varies significantly across the region from 55 times more (Honduras) to
15 times more (Uruguay and El Salvador) (Figures A7–A9).
It is also troubling that income
inequality has risen, albeit slightly, in
some countries over the last few
years, possibly reflecting the effects
of the global financial crisis and the
recent growth slowdown (Honduras,
Mexico, Peru), and idiosyncratic
factors (e.g., drought in Paraguay).
Figures A1-A3 document the recent
increase in inequality with a
divergence in the income shares
between the highest- and lowest-
income households. 0
5
10
15
20
25
30
35
40
45
1 2 3 4 5 6 7 8 9 10
Sources: Socio-Economic Database for Latin America and the Caribbean; and authors' calculations.
Figure 5. Latin America: Distribution of Per Capita Household Income (Simple average, by decile)
0
1
2
3
4
5
6
7
AR
G
VE
N
EC
U
BO
L
NIC
PR
Y
UR
Y
PE
R
HO
N
DO
M
PA
N
ES
V
CH
L
CR
I
ME
X
GT
M
BR
A
CO
L
2012 (or latest available date)
2000
Figure 4. Latin America: Skill Premium(Ratio of wages for higher- and lower-skilled workers)
Sources: SEDLAC; and authors' calculations.

12
Latin America is also highly unequal in terms of access to opportunities such as education
and basic services such as sewage and health. In the remaining section we compare Latin
America’s performance vis-à-vis other regional comparators in terms of access to education,
basic services, and health.
Education
The Gini coefficient for the distribution of years of education is high in many countries of the
region, notably in Panama and Ecuador. This implies that years of schooling between high-
and low-income households vary significantly (from 5 years in Argentina to 8½ years in
Panama, Figure 6). The disparities in years of schooling also prevail if one considers gender
differentials. Figure 6 shows that in half of Latin America countries considered, men have
more years of schooling than women (positive difference).
We also find that educational inequality is strongly correlated with income inequality
implying that economies with unequal income distribution also have unequal access to
education. In addition, inequality in education and the region’s low performance in
international test scores might be impacting the skill composition of LA’s labor market
(Figures 7a–7b). According to the Socio-Economic Database in Latin America and the
Caribbean (SEDLAC) in many economies, especially in Central America, around three-
quarters of the population is low-skilled.
Infrastructure
Infrastructure quality is weak for most Latin American countries in international comparisons
(Chile is a notable exception, Figure 7a). There are also large disparities within Latin
0
5
10
15
BRA CHL COL MEX PER URY
1 2 3 4 5LA6
2
3
4
5
6
7
8
9
AR
G
CH
L
HO
N
DO
M
BO
L
EC
U
BR
A
UR
Y
PR
Y
CR
I
ME
X
GU
A
CO
L
PE
R
ES
V
PA
N
Years of schooling(Difference, highest and lowest income group)
0
5
10
15
ARG BOL ECU PRY
Other LA
0
5
10
15
CRI DOM ESV GUA HON
CAPDR
Sources: Socio-Economic Database for Latin America and the Caribbean; and authors' calculations
-1
-0.5
0
0.5
1
1.5
2
UR
Y
VE
N
PA
N
DO
M
BR
A
AR
G
CO
L
CR
I
HO
N
NIC
PR
Y
CH
L
EC
U
ME
X
ES
V
GU
A
PE
R
BO
L
Gender inequality in education(Difference in years of education between men and women
aged 25-65, latest data)
Years of Education by Equivalized Income Quintiles Adults Aged 25 to 65
Figure 6. Latin America: Inequality of Education

13
America in the proportion of the population with access to basic services, such as sewage,
ranging from 10 percent in Paraguay to almost universal coverage in Chile (Figure 8). Within
country disparities also prevail; for example in Peru only 20 percent of the lower-income
households have access to sewage compared to almost 90 percent of the higher-income
households.
Health
While indicators of access to health services are
more favorable in LA than in Sub-Sahara Africa
and emerging Asia, the region lags behind
indicators in emerging Europe. Data from the
World Health Organization (2014) suggest that
skilled physicians often do not attend births in
the least wealthy households, in contrast to the
experience in emerging Europe (Figure 9). In
addition, inequality between rural and urban
regions is much higher in LA than in emerging
Europe in terms of much higher under-five
mortality rate. Other health outcomes, such as
stunting among children, are also less positive in
Latin America that in emerging Europe, despite
similar health spending levels.
Poverty also remains high in LA with almost 85
million people living below $2.5 per day (after
adjusting for purchasing power), according to
World Bank data. Poverty disparities are vast
ranging from 3 percent (Uruguay) to 43 percent
(Nicaragua).
ARG
BRA
CHLCOL
MEXPER
300
350
400
450
500
550
600
2.0 4.0 6.0 8.0
PIS
A: m
ea
n p
erf
orm
an
ce
on
the
m
ath
em
atics s
ca
le²
(Sco
re, 2
01
2 t
est
vin
tag
e)
Public spending on education (Percent of GDP, 2010)
Educational Performance in Mathematics and Public Spending on Education
0
20
40
60
80
100
Ch
ile
Me
xic
o
Uru
gu
ay
Bra
zil
Co
lom
bia
Pe
ru
Ch
ile
Me
xic
o
Uru
gu
ay
Pe
ru
Bra
zil
Co
lom
bia
Structural Performance Indicators, Percentile Ranks¹
Learning outcomes(PISA)
Infrastructure quality(WEF)
Sources: OECD, PISA (2012); World Bank, World Development Indicators; World Economic Forum,Global Competitiveness Report (2013–14); and IMF staff calculations.¹ The scale reflects the percentile distribution in all countries for each respective survey; higher scores reflect higher performance; PISA: Program for International Student Assessment; WEF: World Economic Forum.² PISA: Program for International Student Assessment.
Figure 7a. LA6: Infrastructure Performance and Educational Outcomes
0
20
40
60
80
100
120
Gu
ate
ma
laH
on
du
ras
Nic
ara
gu
aE
l Sa
lva
do
rP
ara
gu
ay
Do
min
ica
n R
ep
ub
licC
ost
a R
ica
Ecu
ad
or
Bo
livia
Co
lom
bia
Bra
zil
Ve
ne
zue
laM
exi
coU
rug
ua
yP
eru
Pa
na
ma
Arg
en
tina
Ch
ile
High skilled Medium skilled Low skilled
LAC: Employment by educational attainment(Percent of total, latest available data)
Education vs. Income Inequality¹
Sources: Socio-Economic Database for Latin America and the Caribbean; and authors' calculations.¹ Latest available value for the education gini coef f icient is plotted against the income gini for the same year.
Income Gini
Yea
r o
f ed
uca
tion
Fig 7b. Latin America: Income, Education Inequality, and Skills Composition
ARG
BOLBRA
CHL
COL
CRI
DOM
ECU
ESVHON
MEX
NIC
PAN
PRY
PER
URY
VEN
15
20
25
30
35
40
45
50
40 45 50 55 60
LA--Income Inequality and Years of Education (Mean)
ARG
BOL
BRA
CHL
COLCRI
DOM
ECU
ESV
HON
MEX
PAN
PRY
PER
URYVEN
4
5
6
7
8
9
10
11
12
40 45 50 55 60
Income Gini
Ed
ucatio
n G
ini

14
0
20
40
60
80
100
BRA CHL COL MEX PER URU
1 2 3 4 5
LA6
0
20
40
60
80
100P
AR
NIC
DM
A
HO
N
GU
A
ES
V
BO
L
ME
X
UR
U
BR
A
EC
U
PE
R
AR
G
VE
N
CO
L
CR
I
CH
L
Latin America (Simple Average)
0
20
40
60
80
100
ARG BOL ECU PRY VEN
Other LA
0
20
40
60
80
100
CRI DOM ESV GUA HON NIC
CAPDR
Figure 8. Infrastructure: Access to Sewage (In percent of population, per income quintile unless otherwise noted)
Sources: Socio-Economic Database for Latin America and the Caribbean; and authors' calculations.

15
III. WHAT DETERMINES INCOME INEQUALITY IN LATIN AMERICA?
In this section, we investigate what could be behind the decline in income inequality in Latin
America using two approaches: simple correlations and panel regression analysis. In the
econometric analysis we investigate the importance of higher GDP and domestic policies in
explaining the decline in Latin America’s income inequality.
Figure 9. Inequality in Health Services and Outcomes, 2005-11(In percent, unless otherwise stated)
0
20
40
60
80
100
120
1 2 3 4 5
Births attended by skilled health personnel by wealth quintile(Mean unless otherwise stated, shaded area shows middle 50 percent of counrtries)
0
5
10
15
20
25
30
Latin America EM Europe
Stunting among children aged 5 or younger
0
10
20
30
40
50
60
Rural Urban
0
5
10
15
Latin America EM Europe
Health spending (% of GDP)
0
10
20
30
40
50
60
Rural Urban
0
20
40
60
80
100
120
1 2 3 4 5
Under-five mortality rate situation by place of residence(Deaths per thousand live births)
Emerging EuropeLatin America
Sources: World Health Organization; and authors' calculations.

16
A. Simple Correlations
We first investigate how the change in Gini coefficient is correlated with various policy
variables changes for our sample of Latin American countries. Our analysis (which does not
indicate causation) is based on visual observations for a small representative set of policy
variables. The variables are chosen based on data availability; these are also variables that
have experienced large changes in recent years and are often discussed by policymakers as
important determinants of changes in income inequality. Thus the list of variables chosen is
not exhaustive (Figure 10). Our observations suggest:
There is a negative correlation between changes in tax revenues (as a share of GDP)
and changes in income inequality, implying that increases in tax revenues are
associated with decreases in income inequality. An increase in tax revenues, if achieved
due to a more progressive tax system, could be associated with lower income inequality
directly since progressive taxes are often designed to collect a greater proportion of
income from the rich relative to the poor. In addition, an increase in tax revenue could be
associated with lower inequality indirectly by allowing the funding of targeted social
transfers and public expenditure on education (Cornia, 2012). We also find that increases
in direct taxes (such as personal and corporate income tax) and property taxes are
negatively correlated with inequality changes. Direct taxes, which are low in LA in cross
country comparisons, possibly due to its large informal sector, are typically progressive.
Similarly, property taxes which are also extremely low in LA, are also largely levied to
richer households who own most of the property (e.g., houses).
Similarly, data suggest a negative correlation between changes in income inequality
and increases in government spending on education (as a share of GDP); such
Argentina
Bolivia
BrazilChile
Colombia
Ecuador
El Salvador
Honduras
Mexico
Nicaragua
Paraguay
Peru
Dominican RepublicUruguay
Venezuela,
-16
-14
-12
-10
-8
-6
-4
-2
0
2
-1 -0.5 0 0.5 1 1.5 2
Figure 10. Latin America: Policy Variables and Income Inequality1/
Sources: SEDLAC; and authors' calculations.*Percentage point change of GINI coefficient and policy variables. Differences reflect change between
2000 and 2011 (or latest available data).
Argentina
Bolivia
Brazil
ChileColombia
EcuadorEl Salvador
Honduras
MexicoNicaragua
Paraguay
Peru
Dominican Republic
UruguayVenezuela
-16
-14
-12
-10
-8
-6
-4
-2
0
2
-2 0 2 4 6
Difference in total tax revenue (percent of GDP)
GIN
I (p
p.
ch
an
ge
)
Argentina
Brazil
Chile Colombia
Ecuador
Mexico
-16
-14
-12
-10
-8
-6
-4
-2
0
2
0 1 2 3 4
GIN
I (p
p.
ch
an
ge
)
Argentina
Bolivia
Brazil
ChileColombia
Ecuador
El Salvador
Honduras
MexicoNicaragua
Paraguay
Peru
Dominican Republic UruguayVenezuela
-16
-14
-12
-10
-8
-6
-4
-2
0
2
-4 -2 0 2 4 6
Difference in direct tax revenue (percent of GDP)G
INI (p
p. ch
an
ge
)
Difference in property taxes (percent of GDP) Difference in education spending (percent of GDP)
GIN
I (p
p. c
han
ge
)

17
spending typically disproportionately benefits the most vulnerable groups and thus is
associated with lower inequality.10
In the remaining Section we explore econometrically the importance of GDP growth and
policies in explaining the decline in LA’s income inequality. Our econometric analyses
are based on an expanded sample of emerging market economies (with around half of the
sample comprising LA countries) to enhance the accuracy of our results given data
limitations. Given that our focus is to explain the Gini coefficient changes in LA, we use
country (and time) fixed effects.
B. Does the Kuznets Curve Exist?
Using an unbalanced panel econometric analysis for a group of 44 emerging and developing
countries for the period 1990–2010 we investigate the existence of the Kuznets curve (see the
Appendix for the country list and data description). Formulated by Simon Kuznets in the
mid-1950s, the Kuznet’s hypothesis postulates that there is an inverted U-shaped relationship
between GDP per capita and the Gini coefficient. This implies that economic growth is
associated with rising income inequality up to a certain income level (i.e., turning point);
once the country reaches that income level, then further economic growth is associated with
declining inequality. According to Kuznets, as people move from lower productive
agricultural sectors to higher productive industrial sectors, where average income is higher
and wages are less uniform, income inequality initially rises. Eventually, however, societies
respond to the growing wealth-divide with social-welfare policies that aim to reduce the
urban-rural income gap through transfer payments and social benefits.
The Kuznets hypothesis is a rather controversial concept
with numerous studies finding conflicting results for its
existence. While many studies offer support for the
empirical existence of a Kuznets curve, such as Barro
(2000, 2008), and Acemoglu and Robinson (2002),
others have shown that controlling for country-specific
effects can lead to the rejection of the hypothesis
(Deininger and Squire, 1998; Higgins and Williamson,
1999; Savvides and Stengos, 2000).11 However, most of
these latter studies have been criticized for the
inconsistent income inequality data used.
In this Section, we take a fresh look at this controversial
issue. For the estimation, the left- and right-hand-side
variables are demeaned using country-specific means
(i.e., country fixed effects) in order to focus on within
country changes instead of cross-country level
10 There is an extensive literature discussing the importance of social spending such as conditional cash
transfers in Latin America (e.g., Stampini and Tornarolli, 2012). 11 See Fields (2001) for a review of the empirical literature.
GDP per capita 0.45
(0.06)**
Squared GDP per capita -0.03
(0.00)**
Observations 910
Countries 44
Time period 1990-2010
Adjusted R-square 0.94
Time and country dummies √
Sources: Authors' calculations.
Table 3: Kuznets Specification
(Dependent variable: natural logarithm of Gini)
Notes: Standard errors are in parentheses; **
denotes significance at the 1 percent level. All
explanatory variables are in natural logarithm.

18
differences.12
In addition to country fixed effects, time dummies are included to capture the
impact on inequality of common global shocks such as business cycles, external conditions,
or growth spurts. Following Stern (2004), we estimate the following model, which as is
typically the case, has all variables expressed in their natural logarithm:
Ln(Giniit)= β1 ln(GDPPCit ) + β2 [ln(GDPPCit )]2 + Tt + Ci + ɛit
where Giniit stands for the Gini coefficient of country i at time t, GDPPC stands for real GDP
per capita (PPP), and Tt and Ci are time and country dummies, respectively. The model is
estimated using ordinary least squares with heteroskedasticity-consistent standard errors.
Taking into consideration the inherent limitations of the data set and of cross-country regression
analysis more generally, our results presented in Table 3 confirm the presence of the Kuznets
curve (i.e., β1>0 and β2<0 and are statistically significant). Similar to various studies (e.g.,
Barro (2000)) we find that the Kuznets curve does not explain the bulk of variations in
inequality across countries or over time. Our analysis suggests that only one eight of the
decline in Latin America’s income inequality in the last decade can be associated with the
recent strong growth momentum.
C. Policies to the Rescue
In the remaining section, we investigate the importance of macroeconomic policies in
explaining the decline in income inequality in Latin America using a panel econometric
analysis (with time and fixed effects) for a sample of 38 emerging and developing economies
over the period 2001-2010. We consider the following policies given data availability, their
importance in policymaker’s decision-making and the fact that they have experienced large
changes in recent years:
Government spending on education. We expect that rising education spending (as a
share of GDP) would be negatively associated with changes in the Gini coefficient, as
this spending would be linked to greater access of low-income families to education and
thus to lower skill premium (see also IMF(2014a));
Tax revenue. Higher tax revenues would be associated with lower income inequality if
tax revenues are largely raised through progressive taxation that imposes a larger share of
the tax burden to those with the greatest ability to pay. In addition, higher tax revenues
could lower inequality indirectly by allowing the funding of targeted social transfers and
public expenditure on education (Cornia, 2012).
Foreign Direct Investment. The association between higher FDI and inequality is less
clear; FDI could be associated with lower inequality in countries with abundant supply of
unskilled labor in line with the predictions of the Stolper-Samuelson corollary of the
Heckscher- Ohlin theorem (Cornia, 2012). However, FDI may be linked to skill-specific
12
An additional advantage of focusing on within-country variation is to reduce the risk of omitted variable bias
(Jaumotte, Lall, and Papageorgiou, 2008).
19
technological change and thus higher skill premium (see Willem te Velde (2003) for a
discussion of FDI and inequality in Latin America). Thus, the sign of the coefficient is not
clear apriori.
Exchange rate policies. Depreciating exchange rates are expected to be associated with
lower inequality by shifting production from the comparatively unequal non-tradable
sector to the more unskilled labor intensive tradable sector (Cornia, 2012). Thus, we
would expect a negative coefficient.
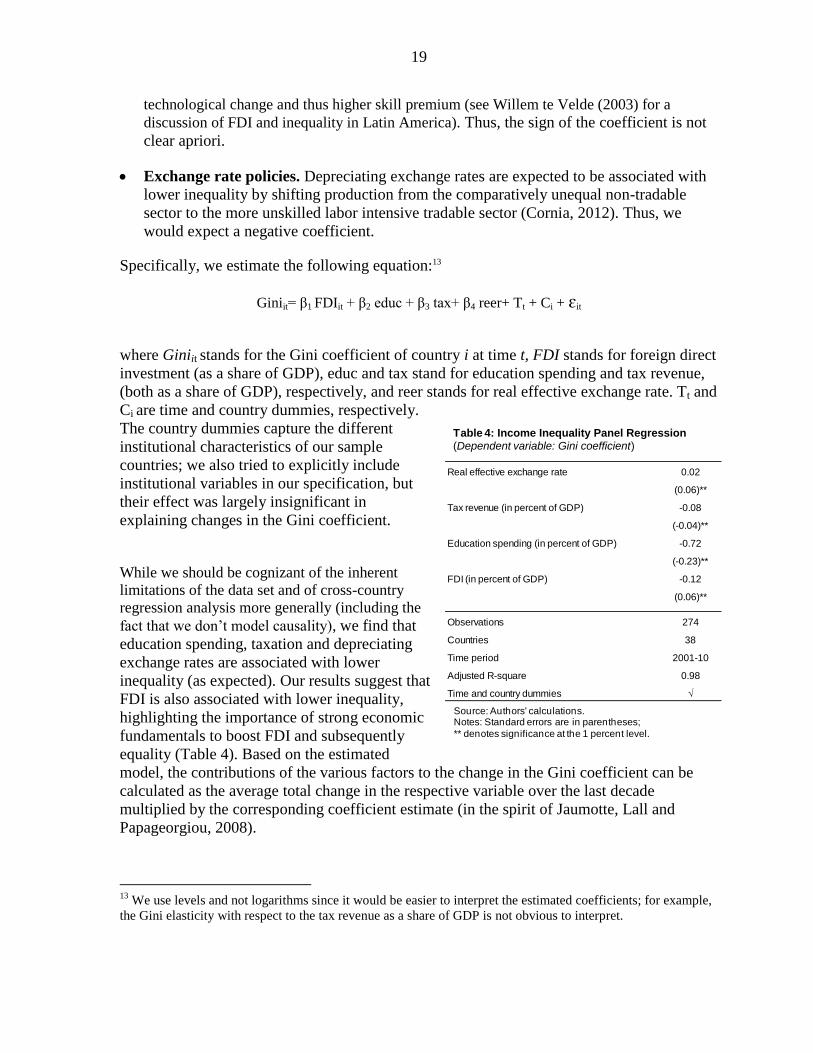
Specifically, we estimate the following equation:13
Giniit= β1 FDIit + β2 educ + β3 tax+ β4 reer+ Tt + Ci + ɛit
where Giniit stands for the Gini coefficient of country i at time t, FDI stands for foreign direct
investment (as a share of GDP), educ and tax stand for education spending and tax revenue,
(both as a share of GDP), respectively, and reer stands for real effective exchange rate. Tt and
Ci are time and country dummies, respectively.
The country dummies capture the different
institutional characteristics of our sample
countries; we also tried to explicitly include
institutional variables in our specification, but
their effect was largely insignificant in
explaining changes in the Gini coefficient.
While we should be cognizant of the inherent
limitations of the data set and of cross-country
regression analysis more generally (including the
fact that we don’t model causality), we find that
education spending, taxation and depreciating
exchange rates are associated with lower
inequality (as expected). Our results suggest that
FDI is also associated with lower inequality,
highlighting the importance of strong economic
fundamentals to boost FDI and subsequently
equality (Table 4). Based on the estimated
model, the contributions of the various factors to the change in the Gini coefficient can be
calculated as the average total change in the respective variable over the last decade
multiplied by the corresponding coefficient estimate (in the spirit of Jaumotte, Lall and
Papageorgiou, 2008).
13
We use levels and not logarithms since it would be easier to interpret the estimated coefficients; for example,
the Gini elasticity with respect to the tax revenue as a share of GDP is not obvious to interpret.
Real effective exchange rate 0.02
(0.06)**
Tax revenue (in percent of GDP) -0.08
(-0.04)**
Education spending (in percent of GDP) -0.72
(-0.23)**
FDI (in percent of GDP) -0.12
(0.06)**
Observations 274
Countries 38
Time period 2001-10
Adjusted R-square 0.98
Time and country dummies √
Table 4: Income Inequality Panel Regression(Dependent variable: Gini coefficient)
Source: Authors' calculations.Notes: Standard errors are in parentheses;
** denotes significance at the 1 percent level.

20
We find that the four policies
considered explain more than half of the
recent decline in income inequality in
Latin America, with higher education
spending explaining almost a fourth of
the overall decline alone (i.e., 0.8 out of
the 3 Gini points). Higher FDI and
higher tax revenue jointly also explain
more than a forth of the total decline in
the Gini coefficient over the last decade.
Exchange rate policies have been
associated with higher inequality in the
region, given that currencies have
appreciated on average in LA over the
last decade. (Figure 11). Common
external factors, proxied by time
dummies in our specification, explain
the remaining change in LA’s Gini coefficient over the last decade.
Our results should be viewed with caution given the inherent limitations involved in data and
cross-country regressions in general. Specifically, our list of policies considered is not
exhaustive (for example, we exclude important inequality determinants such as the
level/effectiveness of social/cash transfers, health spending, quality/types of education,
infrastructure spending and access to basic services). Such variables, which are not included
due to data limitations, could be important. For example, transfers would be very important
in countries with conditional cash transfers (such as Mexico and Brazil). In addition, our
econometric analysis solely looks at the interaction of explanatory variables with the
aggregate income Gini coefficient; future work could also look at other dependent variables
such as disaggregated sources of income as in, Trujillo and Villafañe (2011) and Garcia-
Peñalosa and Orgiazzi (2013), the 90/10 income ratio, the wage dispersion, or the labor
income share. We also interpret the time dummies as common external factors which is a
rather crude measure of modeling other non-policy factors. Last but not least, our regression
analysis does not necessarily imply causality.
IV. CONCLUSIONS AND POLICY IMPLICATIONS
Despite the recent improvement in social indicators, Latin America remains the most unequal
region in the world. We explore the reasons behind LA’s decline in income inequality using a
panel regression analysis. Notwithstanding the limitations involved, we find that well-
designed policies can explain more than half of the decline in income inequality (averaging
around 3 Gini points over the last decade) with education spending explaining almost one
Gini point of the decline. Stronger FDI and tax revenues were also found to be important,
while the impact of strong growth dynamics was less pivotal, in the spirit of the Kuznet’s
hypothesis.
-1 -0.8 -0.6 -0.4 -0.2 0 0.2
REER
GDP growth 1/
Tax revenue
FDI
Education spending
Figure 11. Latin America: Decline in Gini Coefficient Explained by Policies and GDP Growth(Gini points)
Source: Authors' calculations.1/ Based on the Kuznet's specification.

21
As also noted in Ostry, Berg, and Tsangarides (2014), we should of course be cautious about
drawing definitive policy implications from cross-country regression analysis, as different sorts
of policies are likely to have different effects in different countries at different times, and
causality is difficult to establish with full confidence. But, despite these limitations, our
macroeconomic analysis allows us to make some granular assertions of the overall effects . In
particular, our analysis suggests the following:
Improving the access of low-income families to education could be an efficient tool for
boosting equality of opportunity, and over the long run, lower income inequality (see
IMF (2014a) for more details). It is beyond the scope of this paper to analyze the optimal
level of education spending, and which type of education (primary, secondary or tertiary)
is the more effective and has the most immediate impact in lowering inequality. One
thing is certain, strengthening access to quality education would be pivotal, as Latin
America already has relatively high educational spending but rather poor outcomes.
Stronger FDI could also be important in lowering inequality. While part of FDI is driven
by external factors, a lot depends on a country’s strong economic fundamentals to attract
such flows.
Last but not least, raising tax revenue (which is rather low in Latin America in cross
country comparisons) could be associated with declining inequality. For example, tax
revenue (as a share of GDP) was 20 percent in LA versus 34 percent in OECD countries
in 2012. While the paper does not describe the channel behind this relationship, it could
possibly be related to providing more space to finance well-targeted redistributive
policies (see IMF (2014a). The composition of raising tax revenue could also be
important on inequality. Taxes on income and profit which account for just one-fourth of
total tax revenue in LA compared to 35 percent in OECD countries could potentially have
a direct redistributive impact (OECD, 2014). Thus, as suggested in IMF (2014a),
countries could consider making their income tax systems more progressive, such as by
having more tax progression at the top, taking into account the rising risk from tax
evasion. With informality a major problem in Latin America, both fairness and equity
could be enhanced by bringing more informal operators into the personal income tax.
There is also scope to more fully utilize property taxes; only Colombia and Uruguay
collect more than 1 percent of GDP through recurrent property taxes.

22
REFERENCES
Acemoglu, D., and J.A. Robinson, 2002, “The Political Economy of the Kuznets Curve,”
Review of Development Economics, Vol. 6(2), pp. 183–203.
Azevedo, J. P., M. E. Dávalos, C. Diaz-Bonilla, B. Atuesta, and R. A. Castañeda, 2013,
“Fifteen Years of Inequality in Latin America: How Have Labor Markets Helped?”
Policy Research Working Paper 6384 (Washington: The World Bank).
Barro, R. J., 2008, “Inequality and Growth Revisited,” ADB Working Paper on
Regional Economic Integration, No. 11 (Manila: Asian Development Bank).
______, 2000, “Inequality and Growth in a Panel of Countries,” Journal of Economic
Growth, Vol. 5, pp. 5–32.
Berg, A., and J. Ostry, 2011, “Inequality and Unsustainable Growth: Two Sides of the Same
Coin,” IMF Staff Position Note 11/08 (Washington: International Monetary Fund).
Bucheli, M., N. Lustig, M. Rossi, and F. Amábile, 2012, “Social Spending, Taxes and
Income Redistribution in Uruguay,” ECINEQ Working Papers 263 (Verona: Society
for the Study of Economic Inequality).
CEDLAS (Universidad Nacional de La Plata) and The World Bank, SEDLAC: Socio-
Economic Database for Latin America and the Caribbean, available at:
http://sedlac.econo.unlp.edu.ar/eng/
Coble, D., and N. Magud, 2010, “A Note on Terms of Trade Shocks and the Wage Gap,”
IMF Working Paper 10/241(Washington: International Monetary Fund).
Cornia, G., 2012, “Inequality Trends and their Determinants,” UNU-WIDER Working Paper
2012/09 (Helsinki: United Nations University).
Cruces, G., C. Garcia-Domenech, and L. Gasparini, 2011, “Inequality in Education. Evidence
for Latin America,” UNU-WIDER Working Paper No. 2011/93 09 (Helsinki: United
Nations University).
Deininger, K., and L. Squire, 1998, “New Ways of Looking at Old Issues: Inequality and
Growth,” Journal of Development Economics, Elsevier, Vol. 57(2), pp. 259–87.

23
Deaton, A., 2010, “Price Indexes, Inequality, and the Measurement of World Poverty,”
American Economic Review, Vol. 100 (1), pp. 5-34.
Deaton,A. and A. Heston, 2010, “Understanding PPPs and PPP-based National Accounts,”
American Economic Journal: Macroeconomics, Vol. 2(4), pp. 1-35.
Deaton, A., 2013, Reshaping the World, in Measuring the Real Size of the World Economy:
The Framework, Methodology, and Results of the International Comparison Program
(ICP), (World Bank: May).
Fields, G., 2001, Distribution and Development. A New Look at the Developing World
(Cambridge: MIT Press).
Gasparini, L., and G. Cruces, 2010, “A Distribution in Motion: The Case of Argentina,” in
Declining Inequality in Latin America: A Decade of Progress? ed. by López Calva
and N. Lustig, Chapter 5 (Brookings Institution and UNDP).
Gigliarano, C., and P. Muliere, 2012, “Measuring Income Polarization Using an Enlarged
Middle Class,” ECINEQ 2012 – 27.
Goñi, E., H. López, and L. Servén, 2008, “Fiscal Redistribution and Income Inequality in
Latin America,” Policy Research Working Paper 4487 (Washington: The World
Bank).
Hidalgo, J.C., 2014, “Growth without Poverty Reduction: The Case of Costa Rica,”
Economic Development Bulletin, No. 18 (Washington: The Cato Institute).
Higgins, M., J. Williamson, 1999, “Explaining Inequality the World Round: Cohort Size,
Kuznets Curves, and Openness,” NBER Working Paper No. 7224 (Cambridge:
National Bureau of Economic Research).
International Monetary Fund, 2014a, “Fiscal Policy and Income Inequality,” Policy Paper,
(Washington: March).
International Monetary Fund, 2014b, Western Hemisphere—Regional Economic Outlook,
(Washington: April).
Jaumotte, F., S. Lall, and C. Papageorgiou, 2008, “Rising Income Inequality: Technology, or
Trade and Financial Globalization,” IMF Working Paper 08/185 (Washington:
International Monetary Fund).
Klasen, S., T. Otter, and C. Villalobos, 2012, “The Dynamics of Inequality Change in a
Highly Dualistic Economy: Honduras, 1991–2007,” Discussion paper No 215s
(Göttingen: Ibero America Institute for Economic Research).

24
Lopez-Calva, L. F., and N. Lustig, 2010, Declining Inequality in Latin America: A Decade of
Progress? (Washington: Brookings Institution and UNDP).
Milanovic, B., and S. Yitzhaki, 2002, “Decomposing World Income Distribution: Does The
World Have A Middle Class?” The Review of Income and Wealth, Vol. 48(2),
pp. 155–78.
Organisation for Economic Co-operation and Development, 2014, Revenue Statistics in Latin
America 1990–2012, available at http://www.oecd.org/ctp/latin-america-tax-
revenues-continue-to-rise-but-are-low-and-varied-among-countries-according-to-
new-oecd-eclac-ciat-report.htm
Organisation for Economic Co-operation and Development. 2011, “An Overview of
Growing Income Inequalities in OECD Countries: Main Findings,” in Divided We
Stand: Why Inequality Keeps Rising, pp. 21–45 (Paris: OECD Publishing).
Ostry, J.D., A. Berg, and C. G. Tsangarides, 2014, “Redistribution, Inequality, and Growth,”
Staff Discussion Note 14/2, (Washington: International Monetary Fund).
Peñalosa, Garcia Cecilia and Elsa Orgiazzi, 2013. “Factor Components of Inequality: A
Cross-Country Study,” Review of Income and Wealth, International Association for
Research in Income and Wealth, Vol. 59(4), pp. 689-727, December
Ravallion, M., and Chen, S., 2003, “Measuring Pro-poor Growth,” Economic Letters, Vol. 78
(1), pp. 93–99.
Reynolds, L., 1996, “Some Sources of Income Inequality in Latin America,” Journal of
Interamerican Studies and World Affairs, Vol. 38, No. 2/3, pp. 39–46.
Savvides, A., and T. Stengos, 2000, “Income Inequality and Economic Development:
Evidence from the Threshold Regression Model,” Economics Letters, Vol. 69,
pp. 207–12.
Soares, S., R. Guerreiro Osorio, F. Veras Soares, M. Medeiros, and E. Zepeda, 2009,
“Conditional Cash Transfers in Brazil, Chile and Mexico: Impacts Upon Inequality,”
Estudios Economicos, Vol. 0 (Special I), pp. 207–24. (El Colegio de México, Centro
de Estudios Económicos).
Stampini, M., and L. Tornarolli, 2012, “The Growth of Conditional Cash Transfers in Latin
America and the Caribbean: Did They Go Too Far?” Policy Note IDB-DB-185,
(Washington, Inter-American Development Bank).
Stern, D.I., 2004, “The Rise and Fall of the Environmental Kuznets Curve,” World
Development, Vol. 32, No. 8, pp. 1419–39.
Trujillo, L. and S. Villafañe (2011), “Factores asociados a la dinámica distributiva: una
aproximación desde la descomposición por fuentes de ingresos en la Argentina

25
reciente 2002-2010” (Factors Related to Distributive Dynamics: An Approach from
Disaggregation by Sources of Income in Recent Argentina 2022-2010), in Novick, M.
and S. Villafañe (eds.), Distribución del Ingreso. Enfoques y políticas públicas desde
el Sur, (Distribution of Income. Approaches and Public Policies from the South);
Ministry of Labor, Employment and Social Security, and UNDP, Buenos Aires
Willem te Velde, D., 2003, “Foreign Direct Investment and Income Inequality in Latin America.
Experiences and Policy Implications,” (United Kingdom: Overseas Development
Institute).
World Bank, 2011, A Break with History: Fifteen Years of Inequality Reduction in Latin
America (Washington: April).
______, 2014, World Development Indicators, Washington.
World Health Organization, 2014, Health Equity Monitor, available at
http://www.who.int/gho/health_equity/en/
26
Annex
0.0
0.5
1.0
1.5
2.0
2.5
3.0
20
25
30
35
40
45
50
2001 2003 2005 2007 2009 2012
Highest decile Lowest decile (right scale)
Brazil
0
0.5
1
1.5
2
2.5
3
20
25
30
35
40
45
50
2000 2003 2006 2009 2011
Chile
0.0
0.5
1.0
1.5
2.0
2.5
3.0
20
25
30
35
40
45
50
2001 2003 2005 2009 2011
Colombia
0.0
1.0
2.0
3.0
4.0
5.0
6.0
0
5
10
15
20
25
30
35
40
45
50
2000 2002 2004 2005 2006 2008 2010 2012
Mexico
0
2
4
20
25
30
35
40
45
2000 2002 2004 2006 2008 2010 2012
Peru
0
0.5
1
1.5
2
2.5
3
3.5
4
4.5
5
10
15
20
25
30
35
40
2000 2002 2004 2006 2008 2010 2012
Uruguay
Figure A1. LA6 - Distribution of Per Capita Household Income by Highest and
Lowest Decile
(percent of total)
Sources: Centro de Estudios Distributivos Laborales y Sociales (CEDLAS); Socio-Economic Database
for Latin America and the Caribbean (SEDLAC); The World Bank; and authors' calculations.

27
0.0
1.0
2.0
3.0
4.0
5.0
6.0
7.0
8.0
20
25
30
35
40
45
2000 2002 2004 2006 2008 2010 2012
Highest decile Lowest decile (right scale)
Argentina
0
0.5
1
1.5
2
2.5
3
3.5
4
4.5
5
20
25
30
35
40
45
50
2000 2002 2006 2008 2011
Bolivia
0.0
0.5
1.0
1.5
2.0
2.5
3.0
3.5
4.0
4.5
5.0
20
25
30
35
40
45
50
2000 2004 2006 2008 2010 2012
Ecuador
0.0
1.0
2.0
3.0
4.0
5.0
6.0
0
10
20
30
40
50
2001 2003 2005 2007 2009 2011
Paraguay
0
2
4
6
20
22
24
26
28
30
32
34
36
38
2000 2001 2002 2003 2004 2005 2006
Venezuela
Figure A2. OTHER LA- Distribution of Per Capita Household Income by Highest
and Lowest Decile
(percent of total)
Sources: Centro de Estudios Distributivos Laborales y Sociales (CEDLAS); Socio-Economic Database
for Latin America and the Caribbean (SEDLAC); The World Bank; and authors' calculations.

28
0.0
0.5
1.0
1.5
2.0
2.5
3.0
3.5
4.0
4.5
5.0
20
25
30
35
40
45
50
2000 2002 2004 2006 2008 2010 2012
Highest decile Lowest decile (right scale)
Costa Rica
0
0.5
1
1.5
2
2.5
3
3.5
4
20
25
30
35
40
45
2000 2002 2004 2006 2008 2010
Dominican Republic
0.0
0.5
1.0
1.5
2.0
2.5
3.0
3.5
4.0
20
22
24
26
28
30
32
34
36
38
2004 2005 2006 2007 2008 2009 2010 2011 2012
El Salvador
0.0
0.5
1.0
1.5
2.0
2.5
3.0
3.5
4.0
4.5
5.0
30
32
34
36
38
40
42
44
46
48
50
2000 2006 2011
Guatemala
-1
1
3
5
20
25
30
35
40
45
50
2001 2003 2005 2007 2009 2011
Honduras
0
0.5
1
1.5
2
2.5
3
3.5
4
4.5
5
10
15
20
25
30
35
40
45
50
2001 2005 2009
Nicaragua
Figure A3. CAPDR - Distribution of Per Capita Household Income by Highest and
Lowest Decile (percent of total)
Sources: Centro de Estudios Distributivos Laborales y Sociales (CEDLAS); Socio-Economic Database
for Latin America and the Caribbean (SEDLAC); The World Bank; and authors' calculations.
-1
1
3
5
30
32
34
36
38
40
42
44
46
2000 2002 2004 2006 2008 2010 2012
Panama

29
0
2
4
6
8
10
12
14
1 2 3 4 5 6 7 8 9 10
Growth rate for each decile Average growth rate
Brazil
0
2
4
6
8
10
1 2 3 4 5 6 7 8 9 10
Chile
0
2
4
6
8
10
12
14
16
18
20
1 2 3 4 5 6 7 8 9 10
Colombia
0
2
4
6
8
10
12
1 2 3 4 5 6 7 8 9 10
Mexico
0
2
4
6
8
10
1 2 3 4 5 6 7 8 9 10
Peru
0
2
4
6
8
10
12
14
1 2 3 4 5 6 7 8 9 10
Uruguay
Figure A4. LA6Growth Incidence Curves During the Last Decade¹(Rate of annual growth of household per capita income, in percent)
Sources: Centro de Estudios Distributivos Laborales y Sociales (CEDLAS); Socio-Economic Database
for Latin America and the Caribbean (SEDLAC); The World Bank; and authors' calculations.
¹ Growth incidence curves of household per capita income for Brazil, Chile, Colombia, Mexico, Peru and
Uruguay (deciles).The changes are 2004-12 in Brazil, 2000-11 in Chile, 2001-12 in Colombia, 2000-12 in Mexico, 2003-12in Peru, and 2000-12 in Uruguay.

30
0
5
10
15
20
25
30
35
40
1 2 3 4 5 6 7 8 9 10
Growth rate for each decile Average growth rate
Argentina
0
5
10
15
20
25
30
35
1 2 3 4 5 6 7 8 9 10
Bolivia
0
2
4
6
8
10
12
14
16
18
20
22
24
1 2 3 4 5 6 7 8 9 10
Ecuador
0
2
4
6
8
10
12
14
1 2 3 4 5 6 7 8 9 10
Paraguay
14
14.4
14.8
15.2
15.6
16
16.4
1 2 3 4 5 6 7 8 9 10
Venezuela
Figure A5. Other LA - Growth Incidence Curves During the Last Decade¹LAST
DECADE¹
(Rate of annual growth of household per capita income, in percent)
Sources: Centro de Estudios Distributivos Laborales y Sociales (CEDLAS); Socio-Economic Database for
Latin America and the Caribbean (SEDLAC); The World Bank; and authors' calculations.
¹ Growth incidence curves of household per capita income for Argentina, Bolivia, Ecuador, Paraguay, and
Venezuela (deciles).The changes are 2003-13 in Argentina, 2000-12 Boliva, 2003-12 Ecuador, 2001-11 Paraguay, and 2000-06 Venezuela.

31
0
5
10
15
20
25
1 2 3 4 5 6 7 8 9 10
Household per capita income for each decile Average of income per capita growth rates
Costa Rica
0
1
2
3
4
5
6
7
8
9
10
1 2 3 4 5 6 7 8 9 10
El Salvador
0
2
4
6
8
10
12
14
1 2 3 4 5 6 7 8 9 10
Guatemala
0
1
2
3
4
5
6
7
8
9
10
1 2 3 4 5 6 7 8 9 10
Honduras
0
2
4
6
8
10
12
14
16
18
20
1 2 3 4 5 6 7 8 9 10
Dominican Republic
Figure A6. CAPDR - Growth Incidence Curves During the Last Decade¹
(Rate of annual growth, percent)
Sources: Centro de Estudios Distributivos Laborales y Sociales (CEDLAS); Socio-Economic Database
for Latin America and the Caribbean (SEDLAC); The World Bank; and authors' calculations.
¹ Growth incidence curves of household per capita income for Costa Rica, Dominican Republic, El
Salvador, Guatemala, and Honduras. Data for Nicaragua and Panama were not available. The changes are 2001-12 in Costa Rica, 2000-11 in Dominican Republic, 2004-12 in El Salvador, 2000-11 in Guatemala,
and 2001-11 in Honduras.

32
0
5
10
15
20
25
30
35
40
45
1 2 3 4 5 6 7 8 9 10
Brazil
0
5
10
15
20
25
30
35
40
45
1 2 3 4 5 6 7 8 9 10
Chile
0
5
10
15
20
25
30
35
40
45
1 2 3 4 5 6 7 8 9 10
Colombia
0
5
10
15
20
25
30
35
40
45
1 2 3 4 5 6 7 8 9 10
Mexico
0
5
10
15
20
25
30
35
40
1 2 3 4 5 6 7 8 9 10
Peru
0
5
10
15
20
25
30
35
1 2 3 4 5 6 7 8 9 10
Uruguay
Figure A7. LA6: Distribution of Per Capita Household Income(by decile)
Sources: Socio-Economic Database for Latin America and the Caribbean; and authors'
calculations

33
0
5
10
15
20
25
30
35
1 2 3 4 5 6 7 8 9 100
5
10
15
20
25
30
35
40
1 2 3 4 5 6 7 8 9 10
0
5
10
15
20
25
30
35
40
1 2 3 4 5 6 7 8 9 10
0
5
10
15
20
25
30
35
40
45
1 2 3 4 5 6 7 8 9 100
5
10
15
20
25
30
35
1 2 3 4 5 6 7 8 9 10
Figure A8. OTHER LA: Distribution of Per Capita Household Income(by decile)
Argetnina Bolivia
Ecuador
Paraguay Venezuela
0
5
10
15
20
25
30
35
40
45
1 2 3 4 5 6 7 8 9 10
Panama
Sources: Socio-Economic Database for Latin America and the Caribbean; and authors'
calculations

34
0
5
10
15
20
25
30
35
40
1 2 3 4 5 6 7 8 9 10
0
5
10
15
20
25
30
35
1 2 3 4 5 6 7 8 9 10
0
5
10
15
20
25
30
35
40
45
50
1 2 3 4 5 6 7 8 9 10
0
5
10
15
20
25
30
35
40
1 2 3 4 5 6 7 8 9 10
0
5
10
15
20
25
30
35
40
1 2 3 4 5 6 7 8 9 10
0
5
10
15
20
25
30
35
40
45
1 2 3 4 5 6 7 8 9 10
Costa Rica Dominican Republic
El Salvador Guatemala
Honduras Nicaragua
Figure A9. CAPDR: Distribution of per capita household income
(by decile)
Sources: Socio-Economic Database for Latin America and the Caribbean; and authors' calculations.
0
5
10
15
20
25
30
35
40
45
1 2 3 4 5 6 7 8 9 10
Panama
35
APPENDIX: DATA SOURCES AND SAMPLE COUNTRIES
This appendix provides details on the data sources used in this analysis and lists the countries
used in the econometric analysis.
Data Sources: The source for the Gini index data used in the econometric analysis is the
World Bank’s Povcal database, while data on tax revenue and education spending are from
World Development Indicators. The real effective exchange rate was extracted from IMF’s
Information Notice System, and data on real GDP per capita (PPP) and FDI are from IMF’s
World Economic Outlook.
Sample of countries for Kuznets analysis: Argentina, Bangladesh, Belarus, Bolivia, Brazil,
Bulgaria, Chile, China, P.R., Colombia, Costa Rica, Dominican Republic, Ecuador, Egypt, El
Salvador, Estonia, Ghana, Guatemala, Honduras, Hungary, Indonesia, Jamaica, Kazakhstan,
Latvia, Lithuania, Malaysia, Mexico, Nicaragua, Nigeria, Panama, Paraguay, Peru,
Philippines, Poland, Romania, South Africa, Sri Lanka, Thailand, Trinidad and Tobago,
Turkey, Uganda, Ukraine, Uruguay, Venezuela, and Vietnam.
Sample of countries for regression analysis on policies: Argentina, Bangladesh, Belarus,
Bolivia, Brazil, Bulgaria, Chile, Colombia, Costa Rica, Dominican Republic, Ecuador,
Egypt, El Salvador, Estonia, Ghana, Guatemala, Hungary, Indonesia, Jamaica, Kazakhstan,
Latvia, Lithuania, Malaysia, Mexico, Nicaragua, Panama, Paraguay, Peru, Philippines,
Poland, Romania, South Africa, Sri Lanka, Thailand, Turkey, Uganda, Ukraine, and
Vietnam.