what is environmental science? study of the impact of humans on the environment. 3 main focuses...
TRANSCRIPT

What is Environmental Science?
• Study of the impact of humans on the environment.
• 3 main focuses– Conservation and protection of natural
resources– Environmental education and communication– Environmental research

Pollution
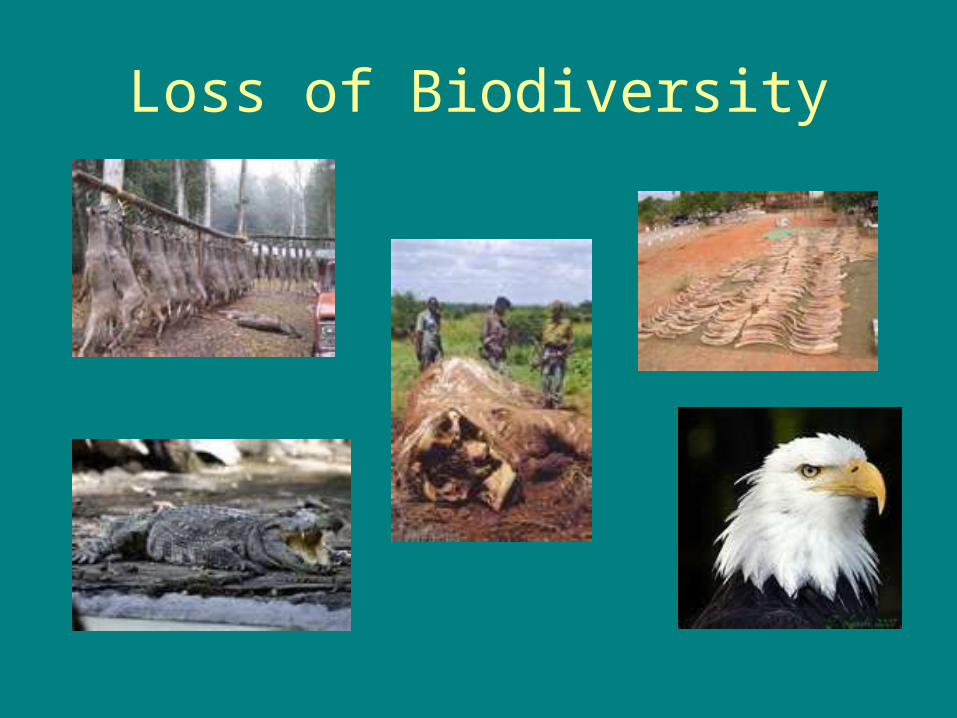
Loss of Biodiversity

Energy Flow in Ecosystems

Biomes

Our Environment Through TimeHunter Gatherers Agricultural
RevolutionIndustrial Revolution
Characteristics
Positive Effects on the Environment
Negative Effects on the environment

Environmental problems• 1. Resource Depletion
– Natural resources• Renewable- can be replaced relatively quickly
– Ex; water, air, soil, trees
• Nonrenewable- forms at a slower rate– Ex: fossil fuels, hardwoods, minerals
• Depleted- when large % is used up

Venn Diagram
Renewable Nonrenewable
Both

Renewable & Nonrenewable Resources
– Ocean waves– Salt– Water– Solar energy– Wheat– Natural Gas– Diesel– Plants– Trees– Wind energy– Hydroelectric power– Gasoline– Leather – fish
• Iron• Air• Sand• Aluminum• Coal• Geothermal energy• Paper• Cows• Soil• Fossil fuels
Create a Venn DiagramClassify the following as either Renewable, Nonrenewable or both

• 2. Pollution- Destroying air, water or soil- 2 main types
- Biodegradable pollutants- can be broken down by natural process
- Ex: human sewage and food wastes- Problem when they are created faster than
can be broken down
- Nondegradable pollutants- can not be broken down
- Ex: mercury, lead, plastics- Problem because they can build up to
dangerous levels in the environment.

• 3. Loss of Biodiversity– Biodiversity refers # and variety of species
that live in an area.– Extinction- last of a species is gone– Mass extinctions

Cholera
• In 1854 a Cholera epidemic broke out in the slums of London.
• Cholera – Severe diarrhea, vomiting and
sweating– Death can results in less than an
hour.
• Dr. John Snow found the source and transmission agent of the 1854 Cholera Epidemic.

Poison Pump Activity Questions
• How did cholera get into the water used by the people who lived on Broad Street?
• Why are we unlikely to contract cholera living in North America?
• What are the symptoms of Cholera?

How do scientists graph/ display data?
• 3 Types of Graphs– 1. Line Graph
• Shows change over time• Show how one thing
changes because of something else
– 2. Bar Graph• Shows how different
things are compared to one another
– 3. Pie Chart• Shows how portions relate
to a whole thing• Must equal 100%
0102030405060708090
1st Qtr 2nd Qtr 3rd Qtr 4th Qtr
East
West
North

Graph Grading Rules
• 1. Did you use whole piece of paper?• 2. Labels?
– X & Y axis– Title– Pieces of a pie graph
• 3. X & Y Axis– Set up correctly?– With numbers spaced correctly
• 4. Are the points/ #s graphed correctly?

Line Graph
• Create a line graph with the following information.
World population (in billions)
Year
.5 1600
1.0 1700
1.5 1800
2.0 1900
5.5 2000

Bar graphs
Country Life expectancy in years
U.S. 77
Japan 81
Mexico 71.5
Indonesia 68
Create a bar graph using the following data.

Pie Chart
Source of Pollution PercentageRunoff from land 51.4 %
Routine Ship maintenance
19.4
Air pollution 13.0
Natural Seeps 8.8
Big Spills 5.2 %
Offshore drilling 2.2
•Create a pie chart using the following information.

• Named in 1968 to represent the concept that any resource that is open to everyone (such as air or parts of the ocean), will eventually be destroyed because everyone can use it but no one is responsible for preserving it.
Tragedy of the Commons

Environment and Society
• Tragedy of the Commons• Economics and the environment
– Supply and demand• The greater the demand of a limited supply, the more its
worth
– Costs and Benefits• We must determine if the benefit of an action is worth its
cost
– Risk Assessment
the chance than human health or the environment will suffer loss.

Developed and Developing Countries• Developed
– Higher average incomes– Slower population growth– Diverse industrial economies– Stronger social support systems
• EX: United States, Canada, Japan
• Developing– Lower average incomes– Simple and agriculture based
economies– Rapid population growth
• EX: Indonesia

• Developing countries have high birth rates because – Many parents will have a lot of children in the expectation
that some will die because of the high infant mortality rate – Large families can help in looking after the farm – The children will be able to look after their parents if they
become old or sick; there may not be a old age pension scheme
– There may be a shortage of family planning facilities and advice
• Developing countries have high death rates because, in many cases, there are – Dirty, unreliable water supplies – Poor housing conditions – Poor access to medical sevices – Endemic disease in some countries – Diets that are short in calories and/or protein

Developing – Africa, South/Central America, Mexico, Indonesia, India, Middle/EastDeveloped – US, Canada, Europe, Russia , Japan

Practice Question
• Which of the following countries would you expect to have the lowest population growth?
• A. Canada
• B. Indonesia
• C. Ethiopia
• D. India
• Over Population Problems– Not enough food– Unsafe drinking water– Poor sanitation– Disease
• Consumption Trends– Developed countries use 75% of worlds
resources but only make up 20% of population

Ecological Footprint – the productive area of Earth needed to support one person
Sustainable World – human needs are met and humans can survive indefinitely

• Developing countries have high population growth because….