what is infogr.am? it’s a great resource for when you need
TRANSCRIPT
|| infogr.am -- getting started
!! Page 1 of 9! 11/8/12
What is infogr.am? It’s a great resource for when you need to visualize data - make simple infographics or make individual charts (bar graphs, pie charts, tables, pictoral charts, etc.). It’s easy, free, quick, and allows you to post your visualizations anywhere online.
Visit the link: infogr.am to check out the website.
We’re going to go over the basics of the application.
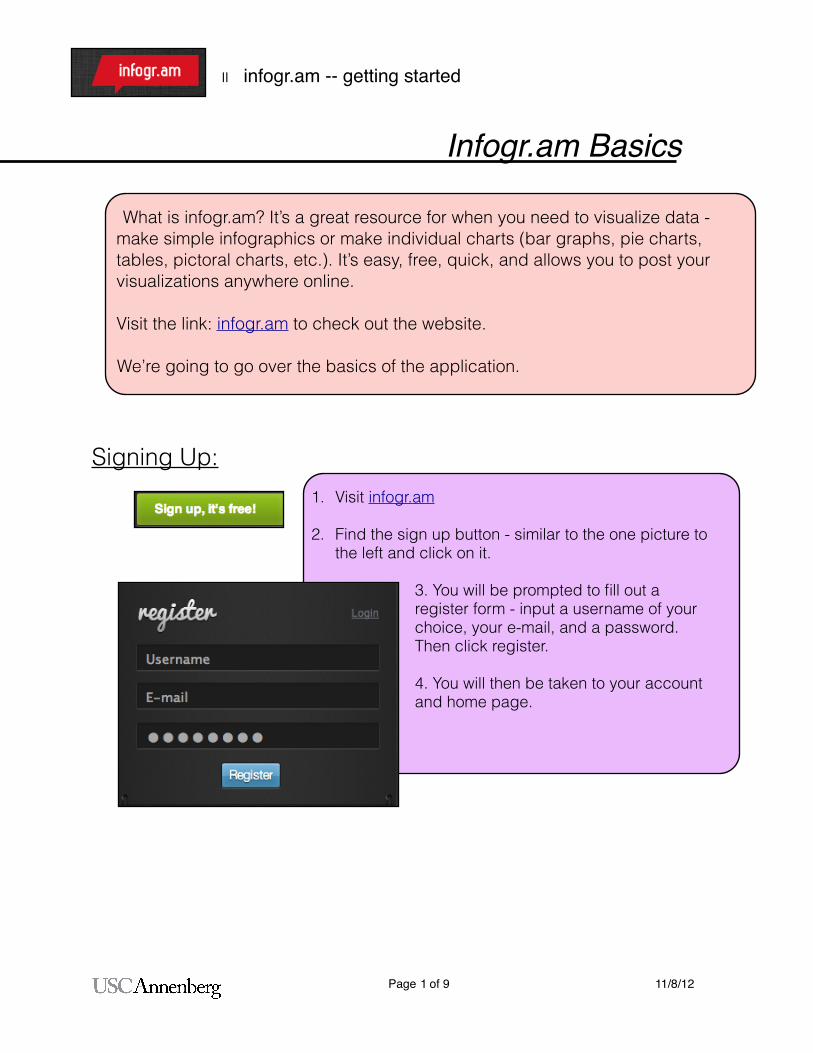
Signing Up:
1. Visit infogr.am
2. Find the sign up button - similar to the one picture to the left and click on it.
3. You will be prompted to fill out a register form - input a username of your choice, your e-mail, and a password. Then click register.
4. You will then be taken to your account and home page.
Infogr.am Basics

|| infogr.am -- getting started
!! Page 2 of 9! 11/8/12
Navigating the Home Page:
Click on this bubble to start working on an infographic.
What is an infographic? It is a graphic visualization of information or data that typically tells a story.
Click on this bubble to start creating a chart. You will have options from bar graphs to pictoral charts.
The Library will be where all your charts and infographics are saved and stored. The blue circle by Library will tell you the number of charts/infographics that are in your library.
The Library:Your library will look
something like this once you’ve started making beautiful charts and infographics! Note that you can make them public or not public - depending on whether you publish them or not.
Through the library, you can also obtain the share/embed code, delete your creations, create duplicates, edit, and preview.
|| infogr.am -- getting started
!! Page 3 of 9! 11/8/12
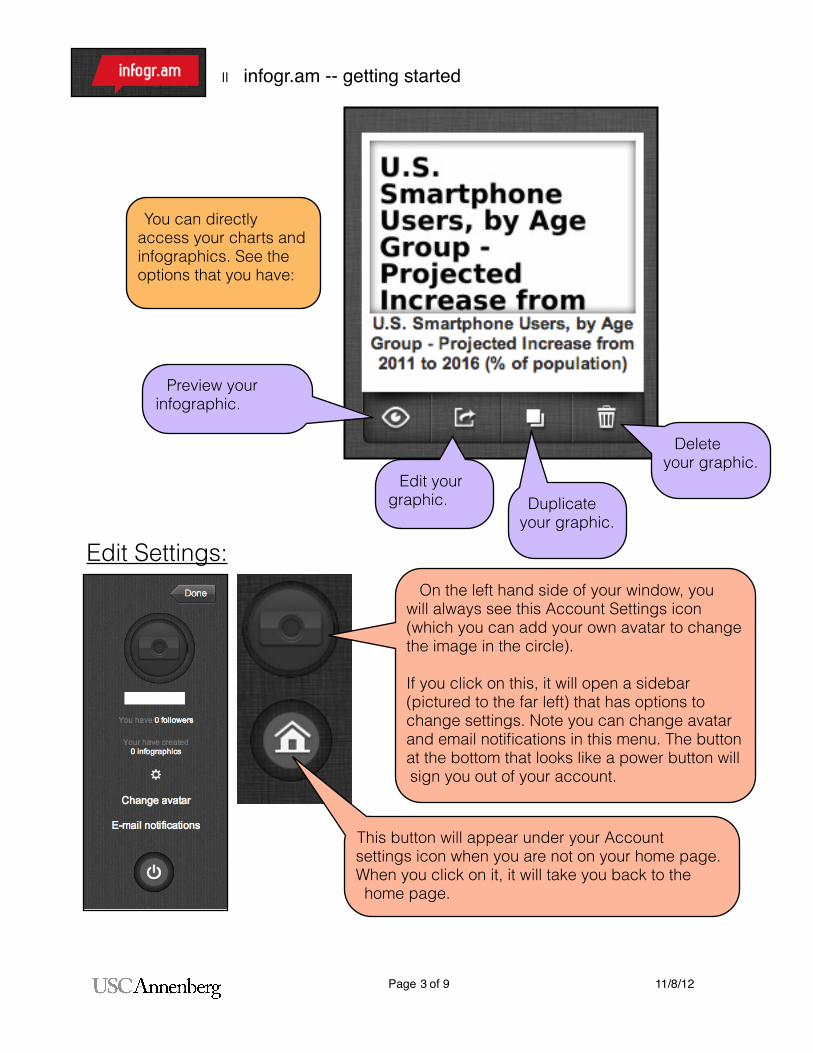
Duplicate your graphic.
Preview your infographic.
Edit your graphic.
Delete your graphic.
You can directly access your charts and infographics. See the options that you have:
On the left hand side of your window, you will always see this Account Settings icon (which you can add your own avatar to change the image in the circle).
If you click on this, it will open a sidebar (pictured to the far left) that has options to change settings. Note you can change avatar and email notifications in this menu. The button at the bottom that looks like a power button will sign you out of your account.
Edit Settings:
This button will appear under your Account settings icon when you are not on your home page. When you click on it, it will take you back to the home page.
|| infogr.am -- getting started
!! Page 4 of 9! 11/8/12
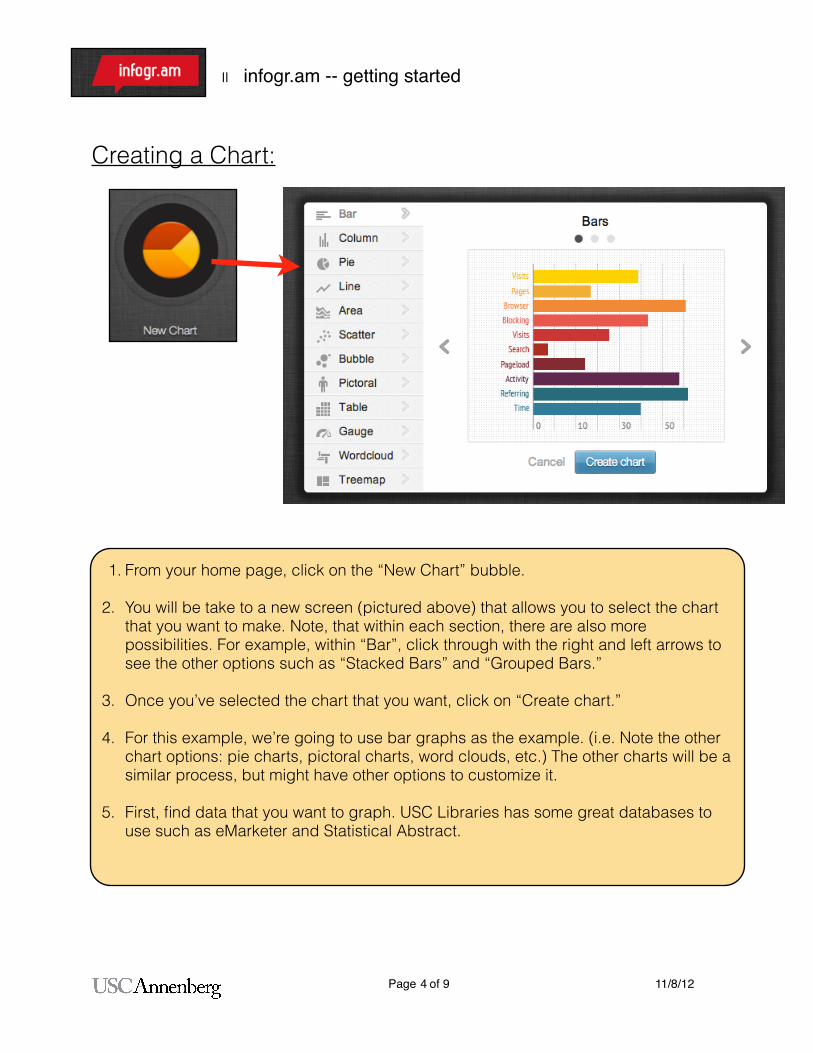
Creating a Chart:
1. From your home page, click on the “New Chart” bubble.
2. You will be take to a new screen (pictured above) that allows you to select the chart that you want to make. Note, that within each section, there are also more possibilities. For example, within “Bar”, click through with the right and left arrows to see the other options such as “Stacked Bars” and “Grouped Bars.”
3. Once you’ve selected the chart that you want, click on “Create chart.”
4. For this example, we’re going to use bar graphs as the example. (i.e. Note the other chart options: pie charts, pictoral charts, word clouds, etc.) The other charts will be a similar process, but might have other options to customize it.
5. First, find data that you want to graph. USC Libraries has some great databases to use such as eMarketer and Statistical Abstract.
|| infogr.am -- getting started
!! Page 5 of 9! 11/8/12
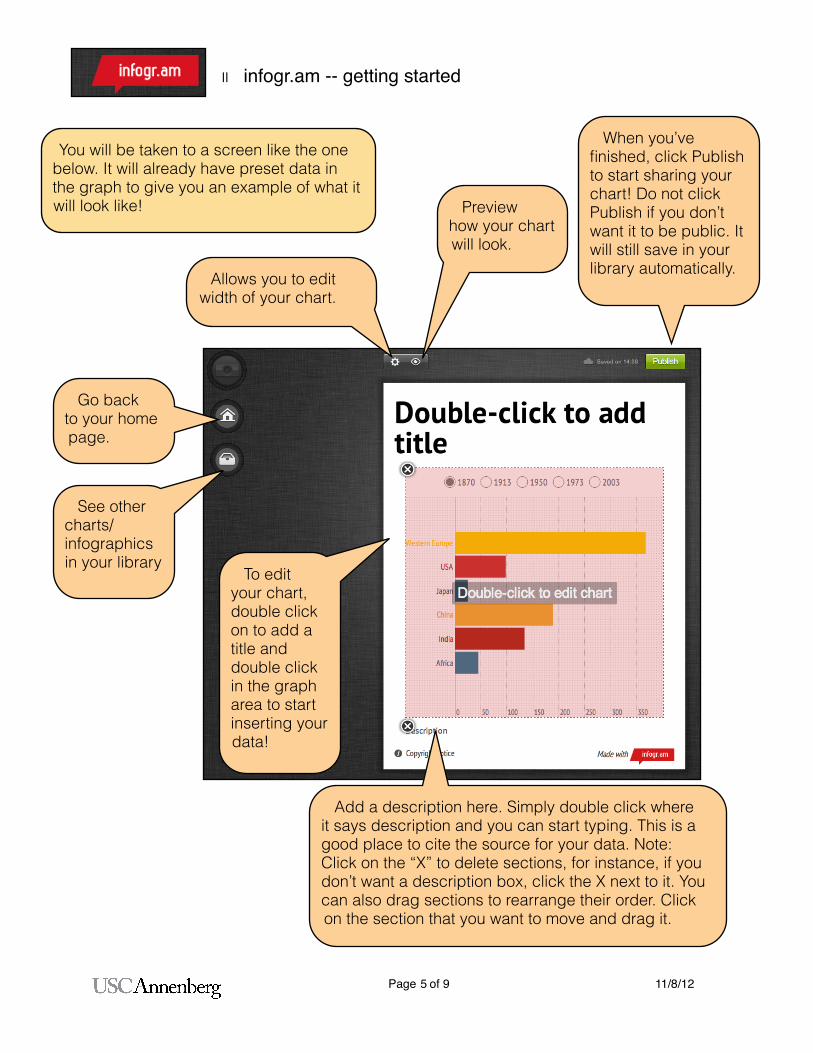
You will be taken to a screen like the one below. It will already have preset data in the graph to give you an example of what it will look like!
When you’ve finished, click Publish to start sharing your chart! Do not click Publish if you don’t want it to be public. It will still save in your library automatically.
Preview how your chart will look.
Allows you to edit width of your chart.
Go back to your home page.
See other charts/infographics in your library
To edit your chart, double click on to add a title and double click in the graph area to start inserting your data!
Add a description here. Simply double click where it says description and you can start typing. This is a good place to cite the source for your data. Note: Click on the “X” to delete sections, for instance, if you don’t want a description box, click the X next to it. You can also drag sections to rearrange their order. Click on the section that you want to move and drag it.
|| infogr.am -- getting started
!! Page 6 of 9! 11/8/12
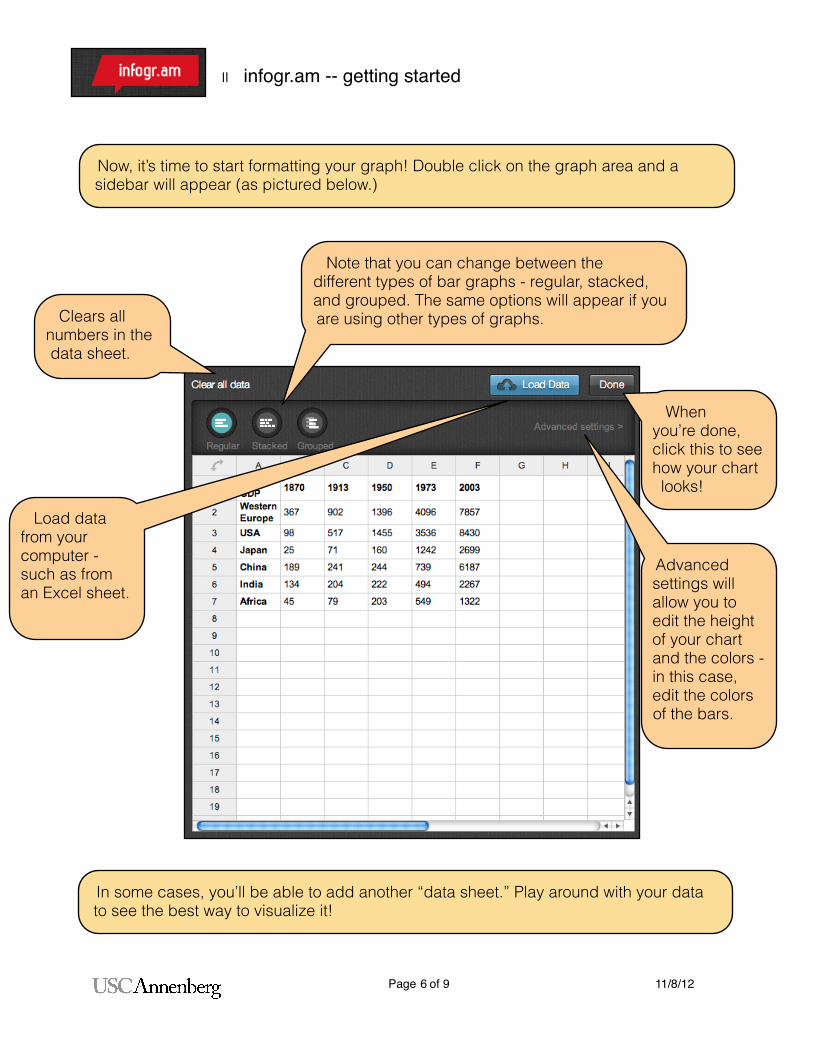
Now, it’s time to start formatting your graph! Double click on the graph area and a sidebar will appear (as pictured below.)
Note that you can change between the different types of bar graphs - regular, stacked, and grouped. The same options will appear if you are using other types of graphs. Clears all
numbers in the data sheet.
Load data from your computer - such as from an Excel sheet.
When you’re done, click this to see how your chart looks!
Advanced settings will allow you to edit the height of your chart and the colors - in this case, edit the colors of the bars.
In some cases, you’ll be able to add another “data sheet.” Play around with your data to see the best way to visualize it!

|| infogr.am -- getting started
!! Page 7 of 9! 11/8/12
Examples:

|| infogr.am -- getting started
!! Page 8 of 9! 11/8/12
Creating an Infographic:
1. From your home page, click on the “New Infographic” bubble.
2. You will be take to a new screen (pictured above) that allows you to select the infographic template that you like. Click left and right to see all of the options. You can also use the arrow keys on your keyboard to sort through them.
3. Once you’ve selected the infographic template you like, click “Use it. “ We’ve selected the one pictured to the right.
Note: An infographic will allow you to tell a story with charts, maps, text, pictures, videos, etc.
|| infogr.am -- getting started
!! Page 9 of 9! 11/8/12
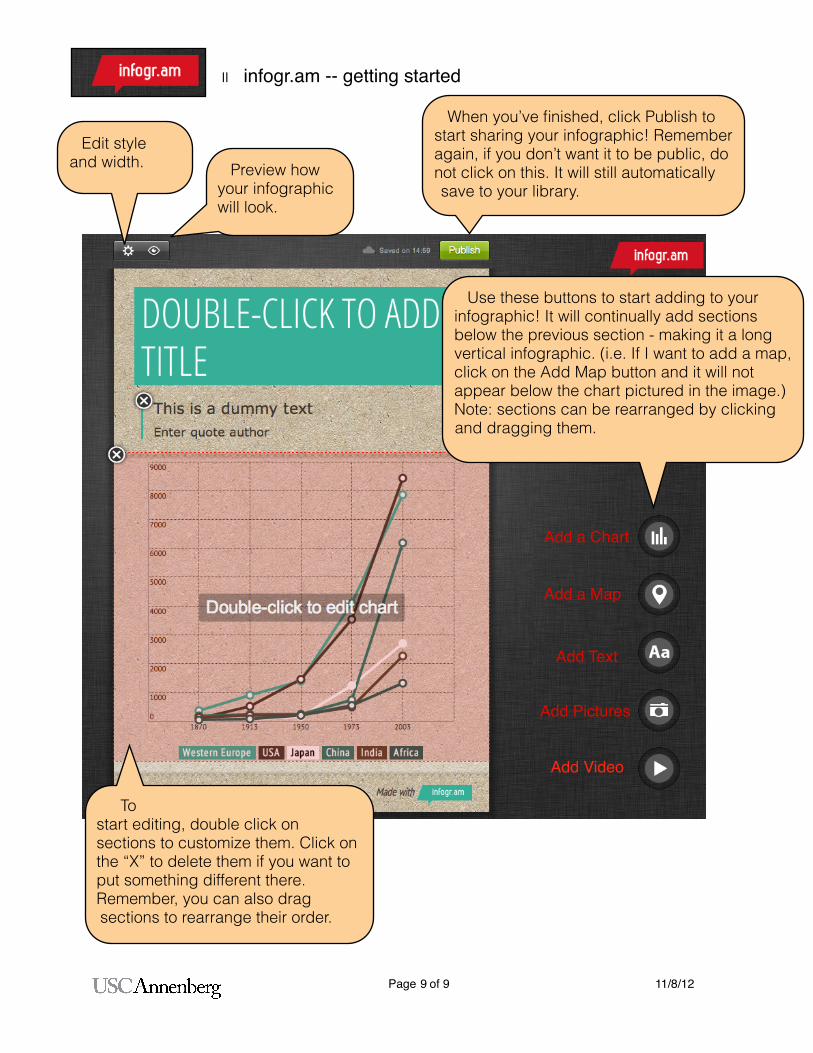
Edit style and width.
When you’ve finished, click Publish to start sharing your infographic! Remember again, if you don’t want it to be public, do not click on this. It will still automatically save to your library.
Preview how your infographic will look.
To start editing, double click on sections to customize them. Click on the “X” to delete them if you want to put something different there. Remember, you can also drag sections to rearrange their order.
Add a Chart
Add a Map
Add Text
Add Pictures
Add Video
Use these buttons to start adding to your infographic! It will continually add sections below the previous section - making it a long vertical infographic. (i.e. If I want to add a map, click on the Add Map button and it will not appear below the chart pictured in the image.) Note: sections can be rearranged by clicking and dragging them.