what is nuclear power? - esi-africa.com kenny.pdf · what is nuclear power? andrew kenny ......
TRANSCRIPT

The Nuclear Force• There are three main forces in nature (practically):
• 1. Gravity: The Weakest
– All mass attracts all other mass, star formation
• 2. Electric: Intermediate
– Chemical reactions, combustion, life
• 3. Nuclear: The strongest
– Holds nucleus together, short range
• The nuclear force is the strongest in nature.
• This means that a small amount of material can provide a large amount of energy, very reliably, causing the least disruption to the environment.
• The nuclear force is a gift from nature and we should use this gift for the good of mankind and our planet.

E = mc2
• Einstein showed that for all mass, m, there is an associated energy, mc2
– Where c is the speed of light.
• This means that each kilogram of mass has the potential to release huge amounts of energy.
• Einstein first believed that man could never exploit the nuclear force to release some of this energy.
• He was wrong.


fissionfusion

Fission & Fusion
• Fusion releases nuclear energy by forcing together small nuclei:– 1. Stars (including the Sun)
– 2. Hydrogen bombs
• Fission releases nuclear energy by splitting large nuclei:– 1. Atomic bombs (Hiroshima & Nagasaki)
– 2. Nuclear power

ERC
Nuclear Fission
Nuclear Fission
• To support a nuclear fission chain reaction, you must have:
• 1. Fissile material:– Uranium 235 (0.7% of natural uranium)
– Plutonium 239 (scarce in nature, made in nuclear reactors)
– Others, perhaps important in future
• 2. Critical mass:– A large enough mass of fissile material (to prevent too
many neutrons leaking out)

Three Elements of a Nuclear Power Reactor
• 1. Fuel– Usually enriched uranium (4% for Koeberg)
– Could be plutonium 239 or thorium 233
• 2. Coolant: takes heat from reactor to turbines to drive generator to make electricity
– Light water or normal water (Koeberg)
– Heavy water (containing deuterium)
– Carbon dioxide
– Helium
• 3. Moderator : slows neutrons, encouraging fission
– Light water (Koeberg)
– Heavy water
– Carbon (graphite)
History of Power Reactors• Russia
� 1954: Obninsk� Graphite moderator, water coolant� 1986: Chernobyl !
� Britain� 1956: Calder Hall, Magnox (still running)� Graphite moderator, CO2 coolant� 1970s: Advanced Gas-cooled Reactors (AGRs)
� USA� 1954: Nautilis, Nuclear Submarine� Water moderator, water coolant� Pressurised Water Reactor (PWR)� 1957: Shippingport: PWR

BASIC PLANT OVERVIEWof Pressurised Water Reactor (PWR), like Koeberg’s

Pressurised Water Reactors (PWRs)� They generate 58 % of world nuclear power
(including Koeberg)� Advantages:
� Reliable� Excellent safety record
� Disadvantages:� High power density� Complicated� Safety comes at the high cost of expensive, ACTIVE
safety systems
� The world is waiting for a better reactor

SA’s Pebble Bed Modular Reactor(PBMR)

The Full Energy Cycle
• When comparing energy technologies it is essential always to consider the full energy cycle: construction, fuel extraction & preparation, operation, waste disposal and decommissioning, including– Processing of nuclear fuel
– Manufacture of solar panels

Advantages of Nuclear Power
• Safety.– By far the best safety record of any large scale source
of electricity (full energy cycle: cradle to grave)• Waste.
– Waste is small, solid, stable and easy to store so that it presents no danger to man or the environment
• Economics.– Among the cheapest, if not the cheapest, source of
electricity in Europe, Japan and the USA• Sustainability.
– Enough uranium & thorium in the crust & sea to power humanity for the life of our planet

Advantages of Nuclear Power (continued)
• Security of Fuel Supply.– Long term storage easy.
• Siting:– Can be sited wherever you want. (Fuel cheap & easy to
transport).• Reliable & Despatchable
– When you want the power, you can have it (unlike wind & solar)
– High load factors• Greenhouse Emissions:
– Among the lowest, if not the lowest, greenhouse emissions per unit of electricity of any source of energy (full energy cycle: cradle to grave)
Nuclear Safety

Number of Energy Accidents from 1969 to 1996 with at least 5 Fatalities (full energy cycle)
(Paul Scherrer Institut, "Severe Accidents in the Energy Sector“)
187
334
86
9 10
50
100
150
200
250
300
350
400
Coal Oil Natural gas Hydropower Nuclear
Nu
mb
er o
f Acc
iden
ts

Some Recent Energy Accidents• Natural Gas Well Burst: China, Chongqing, December 2003
– Toxic fumes of natural gas and sulphurated hydrogen– At least 233 people diedsoon after– About 42,000 people were evacuated– A total of 10,175 people were either hospitalized or treated and discharged– (Reuters News Service 30 Dec 2003)
• * Natural Gas Plant Explosion, Algeria, Skikda, Jan 2004– 20 people killedsoon after– 74 injured (IOL Website 20 Jan 2004)
• * Russian mine blast, Tiazhina pit, Kemerovo region, Siberia, Apr 04– 47 miners died(BBC News, 13 April 04)
• * Belgium gas blast, near Brussels, Jul 2004– At least 14 dead, 200 injured (BBC, 30 Jul 2004)
• China coal mine blast, Daping Mine, city of Xinmi, Henan province, Oct 2004– 148 dead(BBC News, 21 Oct 2004)
• * China coal mine blast, Chenjiashan mine, Shaanxi province, central China, Dec 04– 166 dead(BBC News, 1 Dec 2004)
• * Texas oil refinery explosion, Mar 2005– At least 14 peoplekilled– At least 70 injured (BBC News 5 Mar 2005)
• (All immediate deaths. Long term deaths not included)

Nuclear Safety Since 1996
• In the last 12 years since 1996, the safety record of nuclear energy compared with all other energy sources has continued to improve.
• This is not because nuclear engineers are any cleverer than engineers in coal, gas, hydro or wind but because nuclear power by its nature lends itself to inherent safety.

But what if ... ?
• But what if the worst accident happened at a Western nuclear power station?
• Surely the consequences would be catastrophic?
• The worst did happened in the USA in 1979.
• The accident is still cited by anti-nuclear activists.

The Worst Nuclear Accident at a Nuclear Power Station in the West
� In over 45 years of operating nuclear power station in the Western world, the worst nuclear accident was at Three Mile Island (Harrisburg) in the USA in 1979. It was a partial meltdown.
� The consequences of the accident were these:
� deaths: 0
� injuries: 0
� health aftermath: 0 � (Pennsylvania Dept of Health Study)

CHERNOBYL
• Primary Reason for Accident– Bad reactor design
• Secondary Reasons for Accident– Safety systems deliberately switched off
– Violation of operating procedures

HEALTH EFFECTS OF CHERNOBYL ACCIDENT
The United Nations Scientific Committee on the Effects of Atomic Radiation (UNSCEAR) 2000 Report."According to the Committee's scientific assessments, there have been about 1,800 cases of thyroid cancer in children who were exposed at the time of the accident, and if the current trend continues, there may be more cases during the next decades. Apart from this increase, there is no evidence of a major public health impact attributable to radiation exposure 14 years after the accident. There is no scientific evidence of increases in overall cancer incidence or mortality in non-malignant disorders that could be related to radiation exposure.The risk of leukaemia, one of the main concerns owing to its short latency time, does not appear to be elevated, not even among the recovery operation workers. Although those most high exposed individuals are at an increased risk of radiation-associated effects, the great majority of the population are not likely to experience serious health consequences from radiation from the Chernobyl accident".
The 2005 Chernobyl Forum.600-page report and incorporating the work of hundreds of scientists, economists and health experts, assesses the 20-year impact of the largest nuclear accident in history. The Forum is made up of 8 UN specialized agencies, including the International Atomic Energy Agency (IAEA), World Health Organization (WHO), United Nations Development Programme (UNDP), Food and Agriculture Organization (FAO), United Nations Environment Programme (UNEP), United Nations Office for the Coordination of Humanitarian Affairs (UN-OCHA), United Nations Scientific Committee on the Effects of Atomic Radiation (UNSCEAR), and the World Bank, as well as the governments of Belarus, the Russian Federation and Ukraine.
Overall just over 50 people were killed or have subsequently died, including the 9 children from thyroid cancer - which could have been avoided"apart from this [thyroid cancer] increase, there is no evidence of a major public health impact attributable to radiation exposure 14 years after the accident. There is no scientific evidence of increases in overall cancer incidence or mortality or in non-malignant disorders that could be related to radiation exposure." As yet there is little evidence of any increase in leukaemia, even among clean-up workers where it might be most expected. However, these workers remain at increased risk of cancer in the long term.

Chernobyl compared to Paraffin
• Every year approximately 5000 South Africans die from fires caused by paraffin and from paraffin poisoning (PASASA).
• This means more people are killed in South Africa every week by paraffin than died from the Chernobyl accident after 20 years.
• The death toll from burning wood and coal in the townships and squatter camps is far higher.

NuclearWaste

Deadly and Long-Lived• QUESTION: What is deadly and lasts for millions of years?
• ANSWER: Almost everything.
• Examples:
• Nitrogen– two breaths of pure nitrogen and you drop down dead
– It lasts forever (not billions of years but forever)
– But the nitrogen in this room is NOT a threat to you or future generations
• Lead– Deadly poison, causes permanent brain damage esp in children
– It lasts forever (not billions of years but forever)
– But your car battery is NOT a threat to future generations
• Materials used in solar photovoltaic power units– Cadmium, arsenic, lead etc are deadly toxins that last forever
– But solar wastes are NOT a threat to future generations
• Nuclear waste– Strongly radioactive waste lasts a short time; weakly radioactive lasts a long time
– Some weakly radioactive waste can last for thousands of years
– But nuclear waste is NOT a threat to us now or in the future
• (But Coal waste is a threat to us: sulphur and nitrogen oxides, heavy metal toxins like mercury etc)

Radiation

Features of Radiation� Radiation is part of nature
� All living things get radiation every second of their lives� hundreds of times greater than they would get
from a nuclear power station.
� Radiation is well understood, highly predictable and can be accurately measured.
� The longer the half-life, the less radioactive (a candle and a stick of dynamite)

Radiation Dose/Year to UK PublicUK National Radiological Protection Board
0102030405060708090
%
Natural
MedicalBombs
Air travel
OccupNuclear


Nuclear is Sustainable

Conventional Nuclear Fuel Reserves
• 2005 demand for uranium: 68 thousand tons• “Reasonably assured” reserves (thousand tons)
– <$40/kg: 1,947 – <$80/kg: 2,643 – <$130/kg: 3,297– total: 7,887 (116 years at present consumption)
• With “Inferred”, “Prognosticated” & “Speculative” reserves, this brings the total to 14,798 thousand tons (218 years at present consumption)
• (World Energy Outlook 2006. NEA/IAEA)

Beyond Conventional Reserves• The sea contains about 5 billion tons of uranium. This is
constantly being replenished from rivers. For practical purposes, uranium is a renewable resource. The Japanese have already extracted uranium from the sea in pilot plants.
• There is at least twice as much thorium as uranium in the world.
• Fast breeder reactors would multiply the effective uranium reserves 50x and be able to use the thorium.
• Faster breeders have already been operated (SuperPhoenix, Dounreay, Beloyarskiy)
• Nuclear power can provide mankind with all of its electricity until the Sun turns into a red giant (about 5 billion years time)

Global Warming

Nuclear Power & Global Warming• If you do want to reduce CO2 emissions, nuclear power is by far
the best technology.• Nuclear power OVER THE FULL ENERGY CYCLE releases
among the lowest greenhouse gases per kilowatt-hour of electricity produced of any energy source.– Uranium can be enriched using electricity from nuclear power,
with low greenhouse emissions

Greenhouse emissions for Full Energy Chain of different Generation Technologies
J F van de Vate. Elsevier. Energy Policy. Vol 25 No1 1997
0 100 200 300 400 500 600 700gCeq / kWh
Nuclear
Wind
Biomass
Hydro
Solar PV
Nat gas
Oil
Coal
Lignite

Nuclear is Economic

Electricity Costs• USA Production Costs, NEI from Electric Utility Cost Group (EUCG),2004 in 2004 US
cents/kWh (excludes capital costs)– Nuclear: 1.68
– Coal: 1.92
– Gas: 5.87
– Oil: 5.39
• Royal Academy of Engineering, 2004: (p/kWh): total levelised costs
Without standby gen With standby gen gas, CCGT 2.2 nuclear 2.3 coal, PF 2.5 coal, fluidised bed 2.6 on shore wind 3.7 5.4 off shore wind 5.5 7.2 poultry, fluidised bed 6.8 6.8

Nuclear has a Small Footprint

Copper Required for Different Energy OptionsAlfred Voß, Ulrich Fahl, University of Stuttgart
0
50
100
150
200
250
300
Coal Lignite Gas CC Nuclear Solar PV Wind Hydro
kg /
GW
he

Bauxite Required for Different Energy OptionsAlfred Voß, Ulrich Fahl, University of Stuttgart
0
500
1000
1500
2000
2500
3000
Coal Lignite Gas CC Nuclear Solar PV Wind Hydro
kg /
GW
he

Iron Required for Different Energy OptionsAlfred Voß, Ulrich Fahl, University of Stuttgart
0
1000
2000
3000
4000
5000
6000
7000
Coal Lignite Gas CC Nuclear Solar PV Wind Hydro
kg /
GW
he
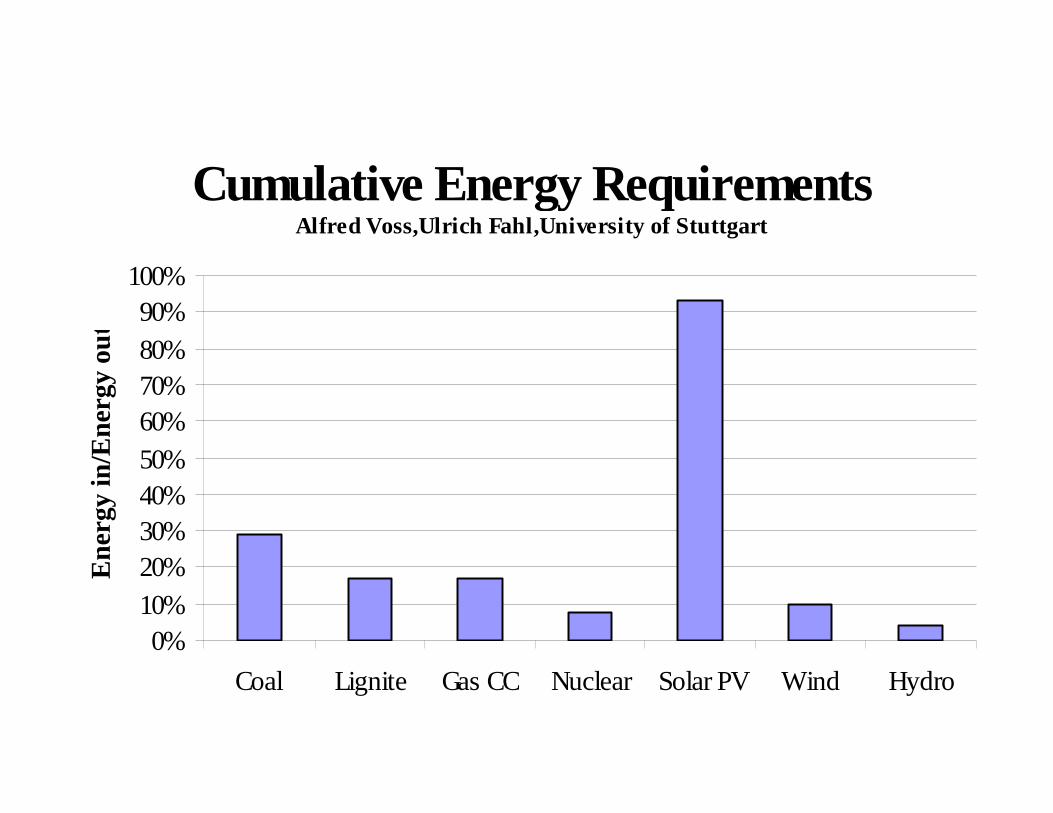
Cumulative Energy Requirements Alfred Voss,Ulrich Fahl,University of Stuttgart
0%10%20%30%40%50%60%70%80%90%
100%
Coal Lignite Gas CC Nuclear Solar PV Wind Hydro
Ene
rgy
in/E
nerg
y ou
t
Nuclear Weapons Proliferation

Nuclear Weapons Proliferation• This is a very serious problem.
• But it is a political problem, which has little to do with nuclear power.
– Israel has nuclear weapons but no nuclear power station.
– Sweden, Finland, Japan, Switzerland etc have nuclear power stations but no nuclear weapons.
• The only solution to this problem is by honest political commitment and by reforming the Non-Proliferation Treaty (NPT).
• The more countries that have legitimate nuclear electricity the less will be the danger of weapons proliferation (inspection and understanding)

Nuclear Power Today & Tomorrow• 50 years ago there were no nuclear power
stations.
• Today nuclear power provides 17% of the world’s electricity (over 75% in France, biggest single source in the EU, etc)
• Nuclear power is on the verge of a huge increase all around the world, including South Africa.
• Those who want the best for mankind and the environment should welcome this.

South Africa’s Pebble Bed Modular Reactor (PBMR)
• Safe• Simple• Small• Economic• Quick to build• Very good for process heat
– Desalination– Hydrogen production– Winning oil from tar sands– Chemicals production– Synfuels

Fundamental Design Philosophy of PBMR
• The fundamental design philosophy is inherent safety.
• No human error or equipment failure can cause an accident that endangers the public. This includes total loss of cooling at 100% power.
• There are no safety systems. Safety is built in.
• The control rods and small absorber spheres can shut the reactor down quickly but are not necessary for safety. They are operating systems.
• Simple, small, cheap design. Low capital costs. Quick construction time.

Pebble Fuel

New Single Shaft Layout for PBMR

Why Dangerous Nuclear Accidents are Impossible for the PBMR
• 1. Uncontrolled Reactivity (Chernobyl)
– Impossible because good physics ensures that the reactor is always under control at all power ranges and for all transients.
• 2. Fuel Damage by Overheating (Three Mile Island)
– Impossible because the small design ensures even in the worst accident (total loss of coolant at 100% power) sufficient heat will be naturally dissipated to keep fuel temperatures below the level at which they begin to sustain damage.

THANK YOU

Features of PBMR (power unit)• Coolant: helium (inert chemically and radiologically)• Moderator: graphite• Fuel: enriched uranium (about 9.5%) • Configuration: Fuel pellets embedded in graphite spheres
(“pebbles”)• Power cycle: Brayton (heated helium drives gas turbine)• Power density: about 6 kW/l (PWR: 50 kW/l +)• Unit Size: about 165 MWe (400 MWt)
– size limited so that surface area/mass always sufficient to ensure enough loss of radiant heat to prevent dangerous temperatures
• Highest coolant temperature: about 900°C• Highest coolant pressure: about 90 bar• Efficiency: 41% +

Fuel Performance
1E-06
1E-05
1E-04
1E-03
1E-02
1E-01
1E+00
1000 1200 1400 1600 1800 2000 2200 2400 2600
Fuel Temperatures [°C]
Fai
lure
Fra
ctio
n

Thermo Hydraulic Layout
HPCHPCHPCHPC LPCLPCLPCLPC PTPTPTPT
RECRECRECREC
1111
6666
7777
5555
4444
3333 2222
7777
8888
1111
6666
5555
4444
3333
22228888
7777
S
T

Solar & Wind Power

Renewables: Solar & Wind
• Solar & Wind power are the least important of the “renewable” energy sources
– Most important: hydro & wood
• They are very good for small scale applications
– Especially solar water heating
• They are hopelessly expensive & unreliable for bulk electricity
– Wind turbines have been a economic & environmental failure in Europe

Fundamental Weakness ofSolar & Wind
• The energy sources are:– Dilute
– Intermittent
– Usually unpredictable
• This means– you have to build huge structures to produce a
reasonable amount of electricity (the exact opposite of nuclear)
– The electricity is very expensive
– You need back-up generators

Features of Solar & Wind Electricity• Huge Subsidies
– Guaranteed prices in Germany (feed-in tariffs):
• 385 cents SA/kWh for solar
• 59 cents SA/kWh for wind
• (about 25 cents SA/kWh for nuclear)
• Coercion
– In Germany you are compelled to buy wind and solar electricity whether you want it or not
• Highly Centralised
• Gigantic Intrusion into Nature
– Enormous wind turbines blighting the countryside (killing birds&lowering property values
• Very Low Load Factors
• A Transfer of Wealth from the Poor to the Rich
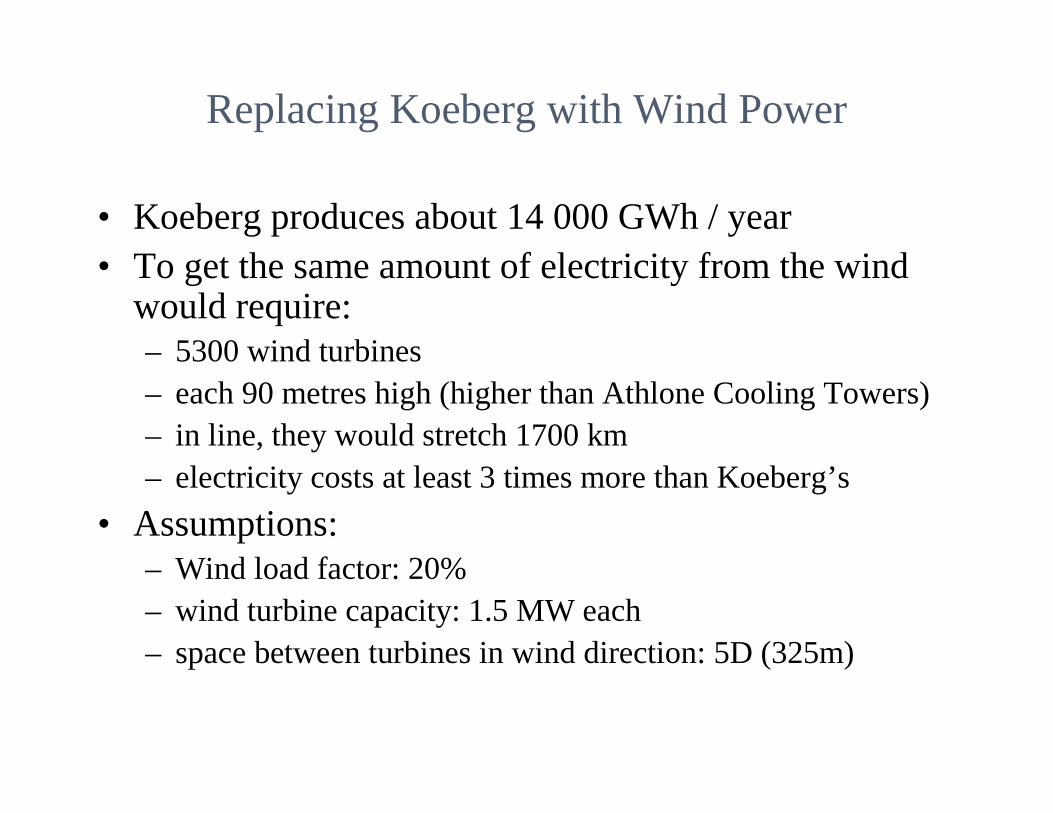
Replacing Koeberg with Wind Power
• Koeberg produces about 14 000 GWh / year• To get the same amount of electricity from the wind
would require:– 5300 wind turbines– each 90 metres high (higher than Athlone Cooling Towers)– in line, they would stretch 1700 km– electricity costs at least 3 times more than Koeberg’s
• Assumptions:– Wind load factor: 20%– wind turbine capacity: 1.5 MW each– space between turbines in wind direction: 5D (325m)

Friendly energyOn a human scale?
(Simulated But to scale)

Conclusions
• SA has moderate conditions for wind & very good conditions for solar.
• However, wind & solar are only useful for small scale applications.
• The only two present sources of energy for bulk electricity are coal & nuclear.
• Nuclear is our best option for clean, safe, economic, sustainable energy.

HAZARDS
Properties of hazardous gases used in the production of solar cells. Compiled from Lewis (1992) and Moskowitz et.aL (1986-87) (Anne-Marie Tillman, Technical Environment Planning, Chalmers Univ of Technology, Goteborg, Sweden, from Energy and
Environment, Vol 6 1995, Issue 1 ISSN 0958-305X) Cell
Gas
Fire hazard
Toxicity
c-Si
SiHCI3 trichlorosilane POCI3 phosphorus oxychloride
Severe fire hazard when exposed to heat, flame or air. Potentially explosive reaction with water.
Moderately toxic after ingestion and inhalation Toxic after ingestion and inhalation.
a-Si SiH4 silane
PH3 phosphine B2H6 diborane
Easily ignited in air. May self-explode Spontaneous ignition in air. Severe fire hazard by spontaneous chemical reaction Reacts violently with air. Reacts with water to give explosive hydrogen.
Mildly toxic after inhalation Very toxic. Highly toxic
CIS
SeH2 hydrogen selenide Dangerous fire hazard when exposed to heat or flame. Forms explosive mixtures with air.
Extremely toxic

Country YearCapacity Production Load Load Load
GW TWh Factor GW % of TWh % of Factor GW % of TWh % of Factor% total total % total total %
Denmark 2003 13.0 46.2 40.5 3.1 24.0 5.56 12.020.3Denmark 2004 12.7 40.5 36.3 3.1 24.5 6.58 16.224.1
France 2003 109.6 566.9 59.1 63.4 57.8 441.1 77.879.5 0.2 0.2 0.4 0.1 20.8France 2004 109.7 572.2 59.5 63.4 57.8 448.2 78.380.8 0.4 0.3 0.6 0.1 19.0
Germany 2003 114.7 600.8 59.8 21.4 18.7 165.1 27.587.9 14.6 12.7 19.2 3.2 15.0Germany 2004 114.2 616.8 61.6 20.6 18.0 167.1 27.192.8 16.6 14.6 26.1 4.2 17.9
Spain 2003 62.4 260.7 47.7 7.6 12.1 59.5 22.889.6 6.0 9.5 12 4.6 23.0Spain 2004 69.4 280 46.0 7.6 10.9 61.2 21.992.2 8.2 11.8 15.5 5.5 21.5
Sweden 2003 32.3 135.4 47.8 9.4 29.2 67.4 49.881.5 0.4 1.2 0.7 0.5 20.0Sweden 2004 32.7 151.7 52.9 9.5 29.0 77.5 51.193.4 0.5 1.4 0.9 0.6 22.8
UK 2003 71.8 398.7 63.4 12.1 16.9 88.7 22.283.7 1.3 0.3UK 2004 73.3 395.9 61.6 11.9 16.2 80 20.277.1 1.9 0.5
USA 2003 998.2 4081.5 46.7 105.4 10.6 787.8 19.385.3 6.1 0.6 11.3 0.3 21.1USA 2004 1016.8 4174.5 46.9 105.6 10.4 813.3 19.588.0 6.5 0.6 14.3 0.3 25.0
Total Electricity Nuclear WindCapacity Capacity ProductionProduction
Load Factors for Wind & Nuclear in Europe & USA

Fissile materials: Bombs & Reactors
• A fissilematerial can sustain a nuclear fission chain reaction.• Two most important:
– Uranium-235 (natural)– Plutonium-239 (mostly manmade)
• Natural uranium, found almost everywhere, contains:– 99.3% Uranium-238 (not fissile)– 0.7% Uranium-235 (fissile)
• To make a bomb you need either over 90%– Uranium-235: from enrichment (highly enriched uranium) – Plutonium-239: from production reactor and separation
• Nuclear power reactors have uranium enriched to less than 10%– Koeberg: 3.5% – PBMR: about 9.5%
• It is physically impossible for a power reactor to explode like an atomic bomb. • Waste from Koeberg or PBMR is effectively useless for making atomic bombs.

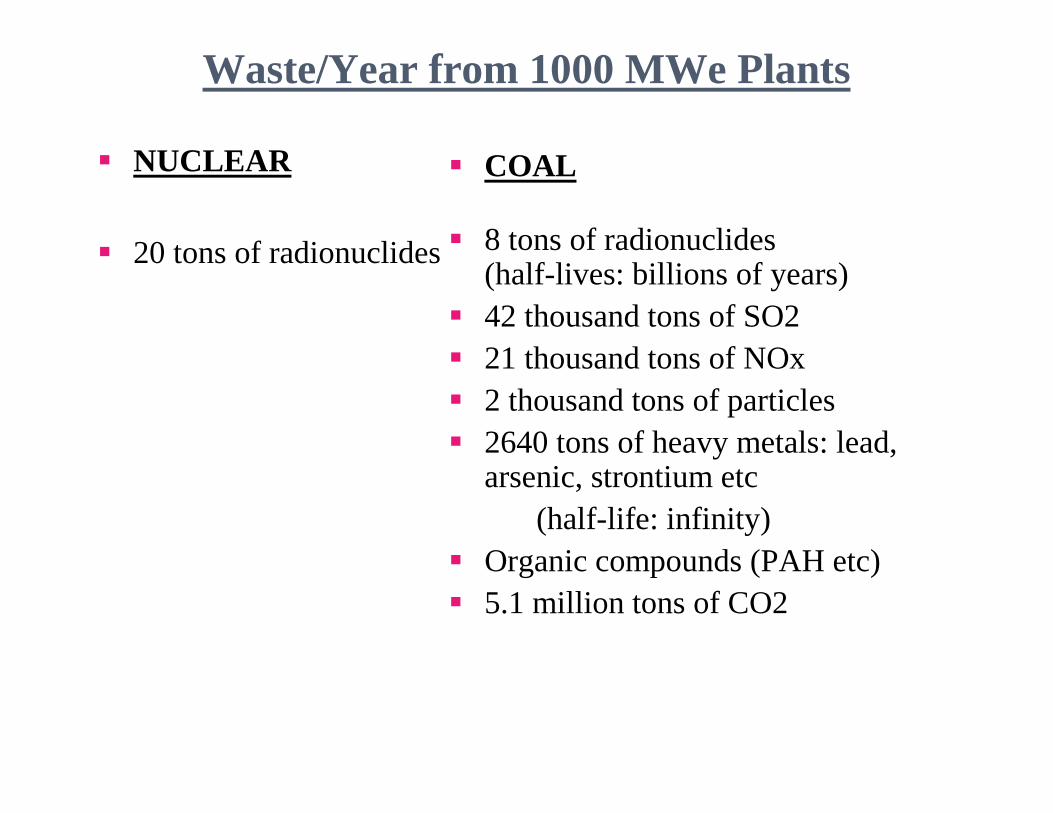
Waste/Year from 1000 MWe Plants
� NUCLEAR
� 20 tons of radionuclides
� COAL
� 8 tons of radionuclides (half-lives: billions of years)
� 42 thousand tons of SO2� 21 thousand tons of NOx� 2 thousand tons of particles� 2640 tons of heavy metals: lead,
arsenic, strontium etc(half-life: infinity)
� Organic compounds (PAH etc)� 5.1 million tons of CO2

Disposal of Nuclear & Coal Waste• Nuclear:
– Waste is small, solid, stable, already collected
– Stored at power station for ten years (when 90% of the radiation has gone)
– Then stored in casks on site or at a special waste site, such as Vaalputs
• Coal– Massive, huge in volume, gaseous and solid,
uncollected
– Poured into the air or dumped on open ash tips
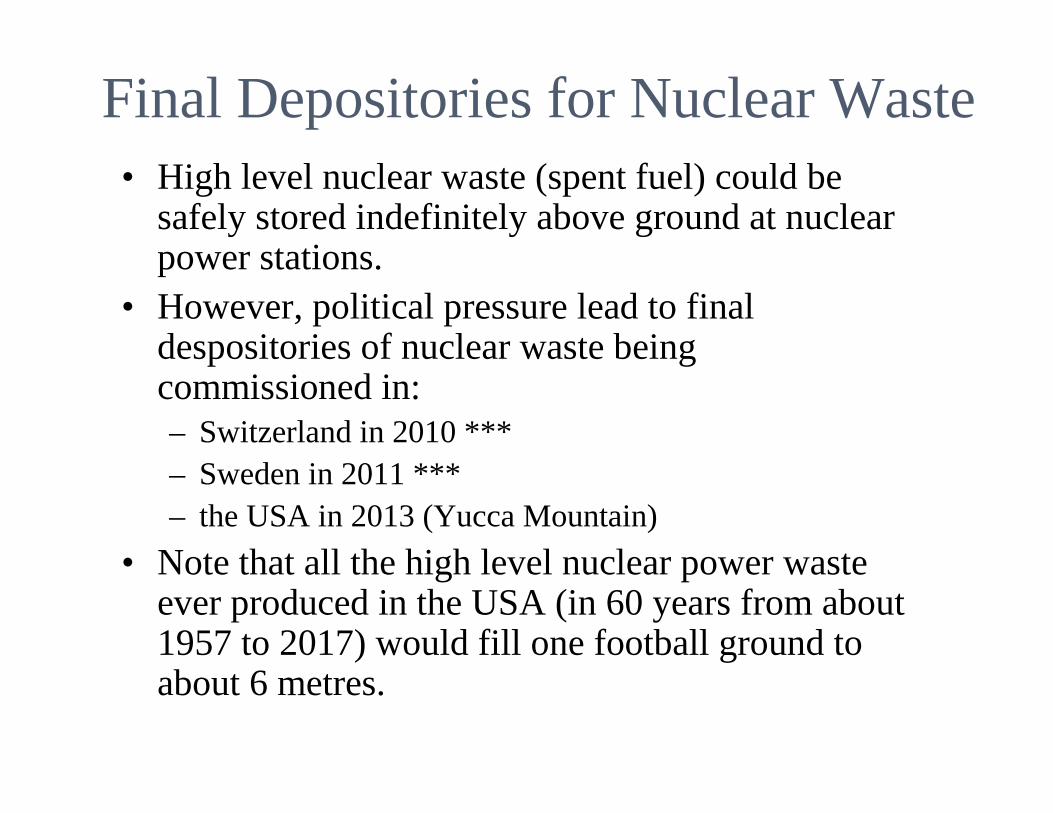
Final Depositories for Nuclear Waste• High level nuclear waste (spent fuel) could be
safely stored indefinitely above ground at nuclear power stations.
• However, political pressure lead to final despositories of nuclear waste being commissioned in:– Switzerland in 2010 ***– Sweden in 2011 ***– the USA in 2013 (Yucca Mountain)
• Note that all the high level nuclear power waste ever produced in the USA (in 60 years from about 1957 to 2017) would fill one football ground to about 6 metres.


Replacing Koeberg with Wind Power
• To get the same amount of electricity from the wind as we now get from Koeberg would require:– 6100 wind turbines– each 90 metres high (higher than Athlone Cooling Towers)– in line, they would stretch 1900 km– electricity costs at least 3 times more than Koeberg
• Assumptions:– load factors: Koeberg 85%, wind 20%– wind turbine capacity: 1.5 MW each– space between turbines in wind direction: 5D (325m)– storage cycle efficiency: 75%

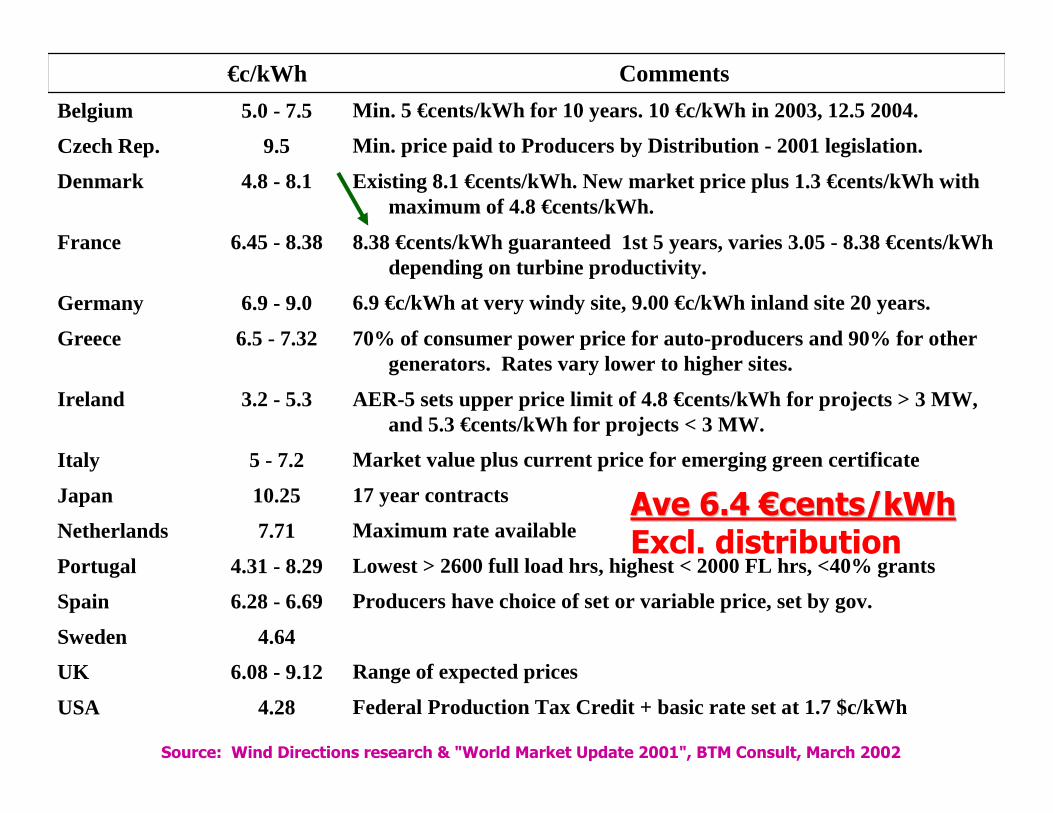
Country €c/kWh Comments
Belgium 5.0 - 7.5 Min. 5 €cents/kWh for 10 years. 10 €c/kWh in 2003, 12.5 2004.
Czech Rep. 9.5 Min. price paid to Producers by Distribution - 2001 legislation.
Denmark 4.8 - 8.1 Existing 8.1 €cents/kWh. New market price plus 1.3 €cents/kWh with maximum of 4.8 €cents/kWh.
France 6.45 - 8.38 8.38 €cents/kWh guaranteed 1st 5 years, varies 3.05 - 8.38 €cents/kWh depending on turbine productivity.
Germany 6.9 - 9.0 6.9 €c/kWh at very windy site, 9.00 €c/kWh inland site 20 years.
Greece 6.5 - 7.32 70% of consumer power price for auto-producers and 90% for other generators. Rates vary lower to higher sites.
Ireland 3.2 - 5.3 AER-5 sets upper price limit of 4.8 €cents/kWh for projects > 3 MW, and 5.3 €cents/kWh for projects < 3 MW.
Italy 5 - 7.2 Market value plus current price for emerging green certificate
Japan 10.25 17 year contracts
Netherlands 7.71 Maximum rate available
Portugal 4.31 - 8.29 Lowest > 2600 full load hrs, highest < 2000 FL hrs, <40% grants
Spain 6.28 - 6.69 Producers have choice of set or variable price, set by gov.
Sweden 4.64
UK 6.08 - 9.12 Range of expected prices
USA 4.28 Federal Production Tax Credit + basic rate set at 1.7 $c/kWh
Source: Wind Directions research & "World Market Update 2001", BTM Consult, March 2002
Ave 6.4 Ave 6.4 €€cents/kWhcents/kWhExcl. distribution

Wind costs (cont)
• Subsidies on wind power:– German subsidy,2004: 91 Euro / MWh (68 cents
SA/kWh)– UK subsidy,2004: over 50 pounds / MWh (59 cents
SA/kWh) (Climate Change Levy and Renewables Obligation)
– (E.ON Netz Wind Report 20040).• German subsidy is about €4bn/year. If wind power has
made 45000 jobs in Germany, the subsidy is more than €80,000 a job a year (R740,000).– (Oliver Marc Hartwich,Business Day, 23 Aug 06)

Darling Wind Farm
• First phase: 4 x 1.3 MW turbines
• Should be complete in 2007
• Cost: R70 million (capital only)– R13,400/kW
• Likely load factor: 20%?
• Klipheuwel (1.75, 0.66, 0.75 MW) has a load factor of 15.3%

Worst Solar and Nuclear Power Station Accidents in the West
� Worst Nuclear
� Three Mile Island (800 MWe), 1979
� Partial Meltdown
� Nobody killed, nobody injured
� No aftermath (Pennsylvania Dept of Health Study)
� Worst Solar
� LUZ solar thermal station, California (80 MWe), 1989
� Explosion and fire
� 400 workers evacuated
� 2 men hospitalised
� Carcinogenic smoke, 800 m high, 5 hours
� Aftermath? Illness? Deaths?

1st Fundamental Weakness of Solar & Wind
• The energy is very dilute
• So to collect each kWh of electricity you need:– very large machines
– very large amounts of materials, steel, cement, copper, glass fibre etc
– very large land areas
• This makes solar and wind expensive
• It is an inefficient use of resources.

2nd Fundamental Weakness of Solar & Wind
• Solar & wind power are intermittent & unreliable, with low load factors.
• They cannot deliver electricity when you want it and therefore have far less value than power sources than can.
• Wind power gives you energy when it wants to generate not when you want to consume. (Compare with a torch or an engine that only works when it wants to)
• This can be overcome only by:– storage: expensive, big efficiency losses– back up power plants– (but then why have solar & wind in the first place?)
Nuclear Power Today
• 50 years ago there were no nuclear power stations.
• Today nuclear power provides 17% of the world’s electricity (over 75% in France, biggest single source in the EU, etc)

Nuclear Fission

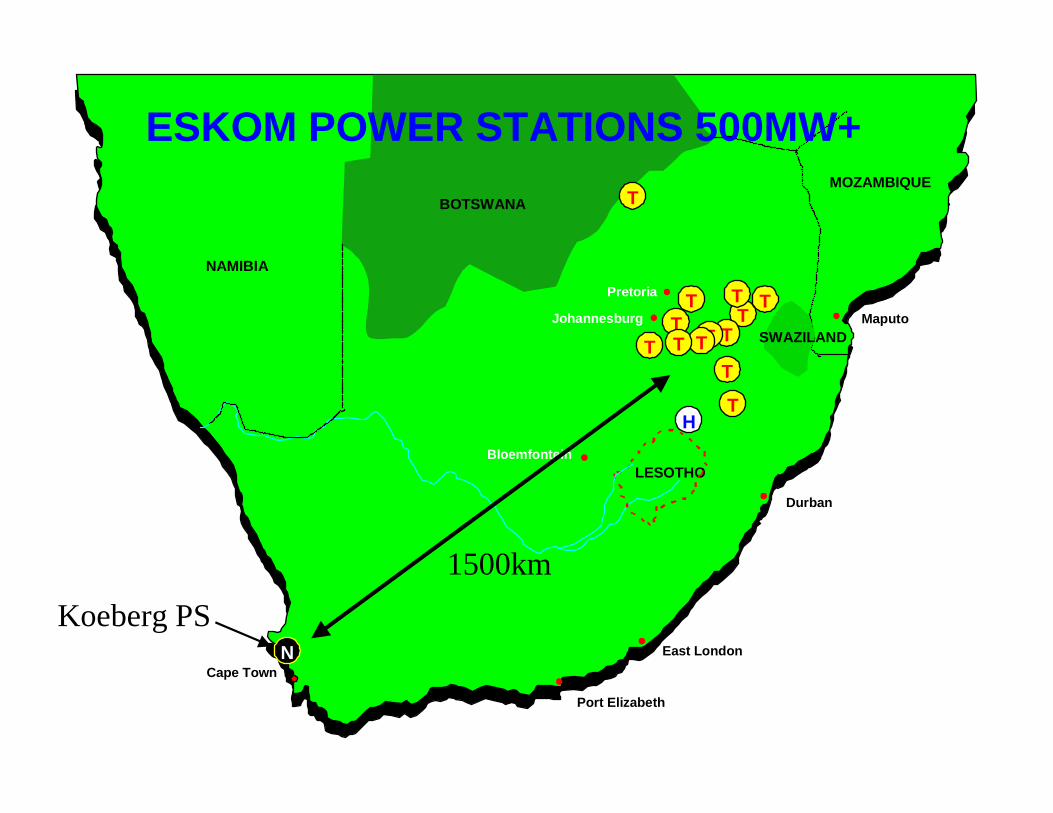
Few Siting Restrictions
• Since the nuclear fuel for a year of plant operation is very small and can be transported easily, nuclear power stations can be sited where you want:– close to centres of load
– close to good cooling (sea, rivers etc)
– (although they can be air cooled, like any heat machine)

Pretoria
Johannesburg
Bloemfontein
Cape Town
East London
Port Elizabeth
Durban
Maputo
MOZAMBIQUE
LESOTHO
NAMIBIA
TT
TTTT
TT
TTT
TH
N
SWAZILAND
BOTSWANA
ESKOM POWER STATIONS 500MW+
T
1500km
Koeberg PS
Solar & Wind
• Both of these are good for small applications, especially solar water heating, and for remote applications.
• But for bulk electricity supply both are hopelessly expensive & unreliable, and are not without environmental problems.
1st Fundamental Weakness of Solar & Wind
• The energy is very dilute
• So to collect each kWh of electricity you need:– very large machines
– very large amounts of materials, steel, cement, copper, glass fibre etc
– very large land areas
• This makes solar and wind expensive
• It is an inefficient use of resources.
2nd Fundamental Weakness of Solar & Wind
• Solar & wind power are intermittent & unreliable, with low load factors.
• They cannot deliver electricity when you want it and therefore have far less value than power sources than can.
• Wind power gives you energy when it wants to generate not when you want to consume. (Compare with a torch or an engine that only works when it wants to)
• This can be overcome only by:– storage: expensive, big efficiency losses– back up power plants– (but then why have solar & wind in the first place?)

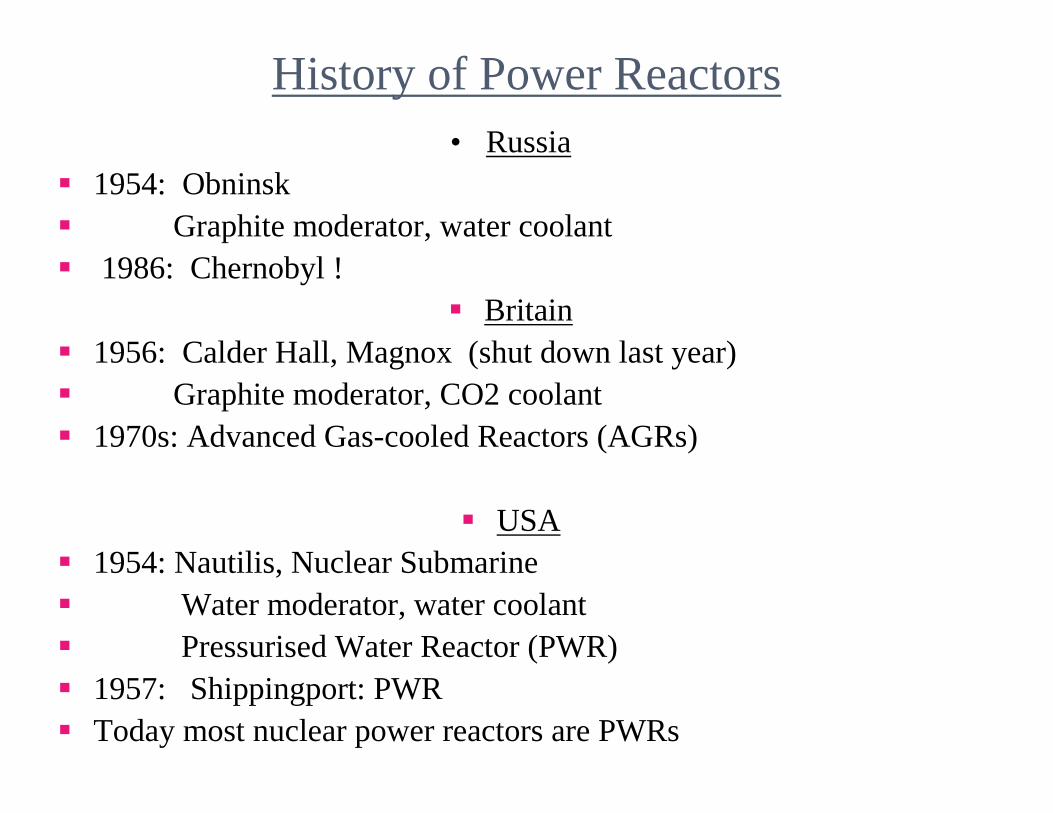
History of Power Reactors• Russia
� 1954: Obninsk� Graphite moderator, water coolant� 1986: Chernobyl !
� Britain� 1956: Calder Hall, Magnox (shut down last year)� Graphite moderator, CO2 coolant� 1970s: Advanced Gas-cooled Reactors (AGRs)
� USA� 1954: Nautilis, Nuclear Submarine� Water moderator, water coolant� Pressurised Water Reactor (PWR)� 1957: Shippingport: PWR� Today most nuclear power reactors are PWRs

Why Dangerous Nuclear Accidents are Impossible for the PBMR
• 1. Uncontrolled Reactivity (Chernobyl)– Impossible because good physics ensures that the reactor is always under
control at all power ranges and for all transients.
• 2. Fuel Damage by Overheating (Three Mile Island)– Impossible because the small design ensures even in the worst accident
(total loss of coolant at 100% power) sufficient heat will be naturally dissipated to keep fuel temperatures below the level at which they begin to sustain damage.
– Normal fuel temperature: 1100ºC
– Worst accident temperature: 1400ºC
– Fuel damage begins slowly at 1600ºC

Cumulative Energy Requirements (CER) and Energy Payback Periods (EPP) For different energy sources
Alfred Voss, Ulrich Fahl, University of Stuttgart
CER EPP(without fuel) monthskWhprim/kWhe
Coal 0.28 - 0.30 3.2 - 3.6Lignite 0.16 - 0.17 2.7 - 3.3Gas CC 0.17 0.8Nuclear 0.07 - 0.08 2.9 - 3.4Solar PV 0.62 - 1.24 71 - 141Wind 0.05 - 0.15 4.6 - 13.7Hydro 0.03 - 0.05 8.2 - 13.7

Wind costs (cont)
• Subsidies on wind power:– German subsidy,2004: 91 Euro / MWh (68 cents
SA/kWh)– UK subsidy,2004: over 50 pounds / MWh (59 cents
SA/kWh) (Climate Change Levy and Renewables Obligation)
– (E.ON Netz Wind Report 20040).• German subsidy is about €4bn/year. If wind power has
made 45000 jobs in Germany, the subsidy is more than €80,000 a job a year (R740,000).– (Oliver Marc Hartwich,Business Day, 23 Aug 06)

Some Recent Energy Accidents• Natural Gas Well Burst: China, Chongqing, December 2003
– Toxic fumes of natural gas and sulphurated hydrogen– At least 233 people diedsoon after– About 42,000 people were evacuated– A total of 10,175 people were either hospitalized or treated and discharged– (Reuters News Service 30 Dec 2003)
• * Natural Gas Plant Explosion, Algeria, Skikda, Jan 2004– 20 people killedsoon after– 74 injured (IOL Website 20 Jan 2004)
• * Russian mine blast, Tiazhina pit, Kemerovo region, Siberia, Apr 04– 47 miners died(BBC News, 13 April 04)
• * Belgium gas blast, near Brussels, Jul 2004– At least 14 dead, 200 injured (BBC, 30 Jul 2004)
• China coal mine blast, Daping Mine, city of Xinmi, Henan province, Oct 2004– 148 dead(BBC News, 21 Oct 2004)
• * China coal mine blast, Chenjiashan mine, Shaanxi province, central China, Dec 04– 166 dead(BBC News, 1 Dec 2004)
• * Texas oil refinery explosion, Mar 2005– At least 14 peoplekilled– At least 70 injured (BBC News 5 Mar 2005)
• (All immediate deaths. Long term deaths not included)

Imagine the reactions to this
• On 21 October 1966, a nuclear waste accident kills 144 people (116 children)
• On 21 Oct 2004, a nuclear accident kills 56 people.
• Imagine the press reaction.
• But this is what has happened in coal power
• Aberfan, Wales, 21 October 1966: 144 people killed as coal dump collapses.
• Daping Mine, China, 21 October 2004: 56 people killed in coal mine explosion
The Most Dangerous Energy
• All of the previous dangers from energy are dwarfed by the most dangerous energy of all, which is right in our midst, right next to us, and which causes death, disease, disfigurement, mutilation and mental retardation on a huge scale.

“The fire started apparently when an unattended candle fell over or a cooker was left burning”

Annual Household Coal Casualties(South Africa)
• About 3 million souls in close proximity
• Asphyxiation by CO. About 500 deaths.
• Brain damage in infants from CO
• Respiratory effects probably shorten lives of 35 000 by 15 years

Annual Household Paraffin Casualties(South Africa)
• For paraffin, largely wick stoves/lamps– Poor design causes fuel to exceed flash point– 100 000 homes destroyed a year– 50 000 second degree or worse burns– 2 000 deaths
• Paraffin poisoning– 145 000 children drink it– 55 000 pneumonias– 4 000 deaths

Sources of Natural Radiation� Either from cosmic radiation
� Or from extremely long-lived radionuclides in ground, rocks, water, living tissue etc such as:� Potassium 40 (half-life: 1,300,000,000 years)
� Uranium 238 (half-life: 4,500,000,000 years)
� Thorium 232 (half-life:14,000,000,000 years)
� In ancient times, the natural radiation was much higher than it is now (3 to 10 times higher at the beginning of life)

Radiation: Medicine vs Nuclear
• Koeberg vs Tygerburg
• Radiation leak on Melkbos Beach
• Koeberg’s release limit vs a single injection for radiotherapy
• Radiation dose from X-rays?
• The public gets a massively greater radiation dose from medicine than nuclear power
• Nuclear power is far, far more careful and responsible with radiation than medicine

Hazards of Radiation� Above 100 Rem/year: Acute Damage
� Radiation sickness� Nausea, hair loss, burning of skin
� 10 to 100 Rem/year: Chronic Damage� 1. Genetic Damage� 2. Cancer (428 excess cancer deaths in Japanese
bomb survivors by 1990)
� Below 10 Rem/year: No damage has ever been observed � Background radiation: 0.25 Rem/year.)� From nuclear industry: less than 0.00025 Rem/year
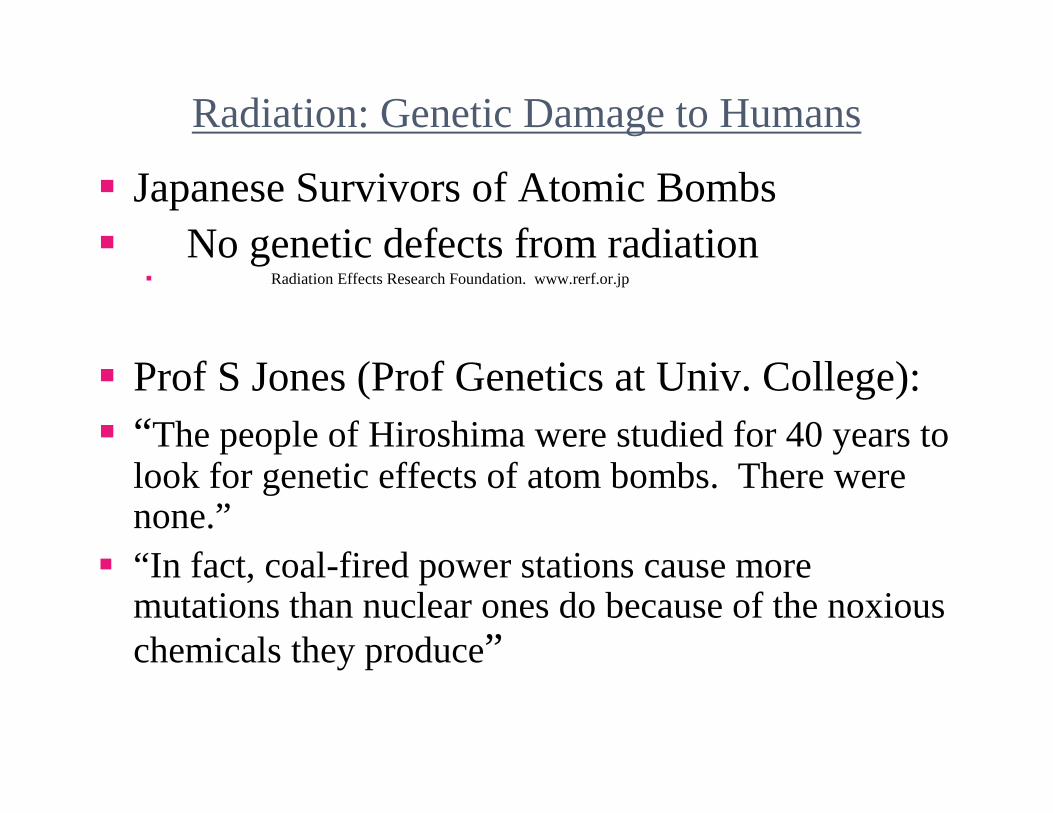
Radiation: Genetic Damage to Humans
� Japanese Survivors of Atomic Bombs� No genetic defects from radiation
� Radiation Effects Research Foundation. www.rerf.or.jp
� Prof S Jones (Prof Genetics at Univ. College):� “The people of Hiroshima were studied for 40 years to
look for genetic effects of atom bombs. There were none.”
� “In fact, coal-fired power stations cause more mutations than nuclear ones do because of the noxious chemicals they produce”

Cancer and Nuclear Sites: Studies� 1. National Cancer Institute, USA. Studied populations living near
62 USA nuclear sites from 1950 to 1984. Found no excess cancers.
� 2. Office of population Censuses and Surveys, UK. Studied populations near nuclear sites in UK from 1959 to 1980. Found no excess cancers.
� 3. Study near former nuclear reprocessing centre in West Valley, New York, commissioned by anti-nuclear Coalition on West Valley Nuclear wastes. Found no excess cancers.
� 4. French study, reported in Nature, of populations near nuclear sites. Found no excess cancers.
� 5. Etc. etc.
� Studies by independent, reputable institutions (not connected to nuclear establishment)

Radiation Exposure in USA (mRem/y)NCRP & EPA
200
40
90
23 2655
207 5 1 1.5 0.030.009
0
50
100
150
200
250
Insid
e bod
y: air
-rado
n
Insid
e bod
y: fo
od &
wate
r
Earth
's cr
ust (
Colorado
)
Earth
's cr
ust (
Atlantic
or G
ulf co
ast)
Cosmic
rays
(sea
leve
l)
Cosmic
rays
(150
0 to
200
0 met
res)
Med
ical X
-ray (
ches
t)
Living
in st
one,
bric
k or
conc
rete
buil
ding
Airline
fligh
t per
600
km
Watch
ing te
levisi
on
Computer
term
inal
Living
with
in 80
km o
f coa
l pow
er sta
tion
Living
with
in 80
km o
f nucle
ar p
ower s
tatio
n
mR
em

A Perspective on radiation levels
Scale: 10 mRem/year = 1 metre
• Radiation seen to do harm:– Above 10,000 mRem : 1,000 metres – height of Table Mountain
• Average exposure to a member of public:– 250 mRem: 25 metres– height of 8 storey building
• Living within 80 km of nuclear power station:– 0.009 mRem: 0.9 millimetre– height of an ant

Cancer & Slightly Raised Radiation
� Studies of populations receiving slightly raisedlevels of radiation show reduced levels of cancer
� Prof John Cameron, in British Journal of Radiology, July 2002, showed:
� British radiologists had a lower death rate from cancer than than other male physicians of the same age
� USA nuclear shipyard workers who received greatest radiation doses had lower cancer death rates than those who received no radiation
� It would be interesting to look at the cancer rate in Paarl (raised radioactity).

Lung cancer mortality rates in males compared with radon concentration in United States homes (Cohen, 1993). Each mean ± one standard deviation includes the number of counties represented.
US Lung Cancer rates vs Radon
Waste/Year from 1000 MWe Plants
� NUCLEAR
� 20 tons of radionuclides
� COAL
� 8 tons of radionuclides (half-lives: billions of years)
� 42 thousand tons of SO2� 21 thousand tons of NOx� 2 thousand tons of particles� 2640 tons of heavy metals: lead,
arsenic, strontium etc(half-life: infinity)
� Organic compounds (PAH etc)� 5.1 million tons of CO2

Disposal of Nuclear & Coal Waste• Nuclear:
– Waste is small, solid, stable, already collected
– Stored at power station for ten years (when 90% of the radiation has gone)
– Then stored in casks on site or at a special waste site, such as Vaalputs
• Coal– Massive, huge in volume, gaseous and solid,
uncollected
– Poured into the air or dumped on open ash tips
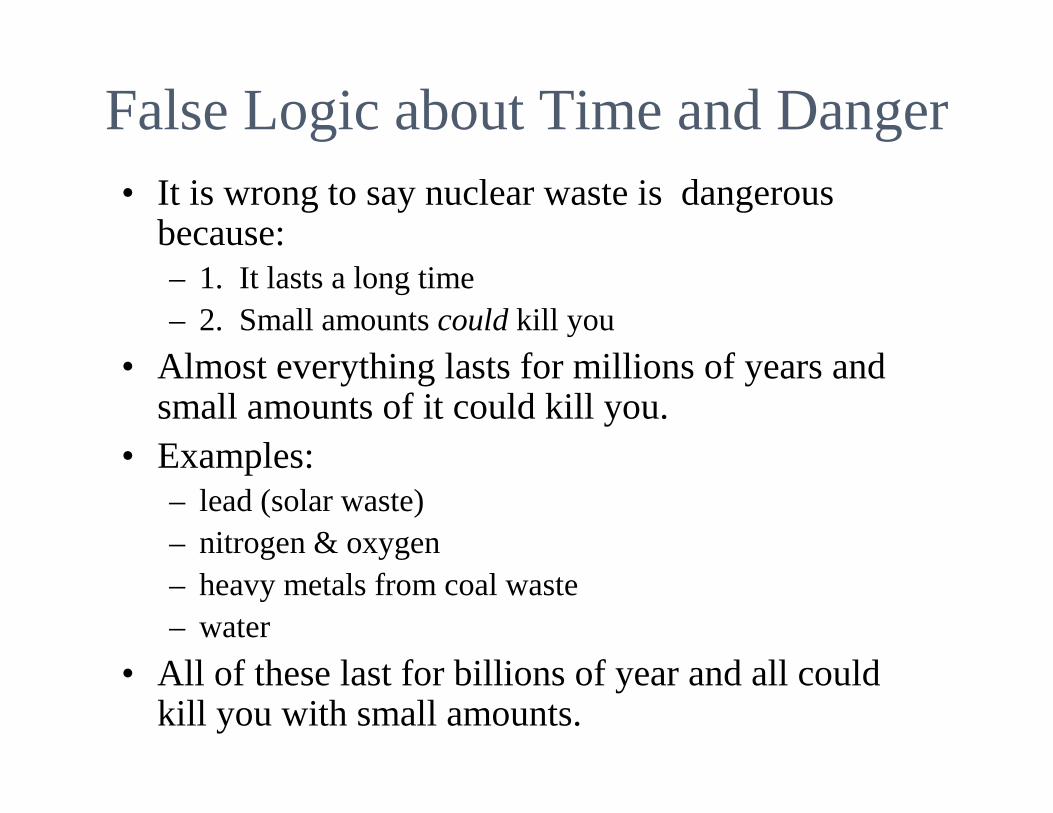
False Logic about Time and Danger• It is wrong to say nuclear waste is dangerous
because:– 1. It lasts a long time– 2. Small amounts could kill you
• Almost everything lasts for millions of years and small amounts of it could kill you.
• Examples: – lead (solar waste)– nitrogen & oxygen– heavy metals from coal waste– water
• All of these last for billions of year and all could kill you with small amounts.

Time and Danger: Logical Approach• Almost every element you see about you will last
forever - not billions of years but forever.
• The fact that a thing lasts a long time does not make it dangerous.
• The key question is this:– What is the chance of this substance causing harm to
man and the environment, now and in future?
• Answers:– For coal & gas waste: some
– For nuclear, solar & wind waste: next to none
Country €c/kWh Comments
Belgium 5.0 - 7.5 Min. 5 €cents/kWh for 10 years. 10 €c/kWh in 2003, 12.5 2004.
Czech Rep. 9.5 Min. price paid to Producers by Distribution - 2001 legislation.
Denmark 4.8 - 8.1 Existing 8.1 €cents/kWh. New market price plus 1.3 €cents/kWh with maximum of 4.8 €cents/kWh.
France 6.45 - 8.38 8.38 €cents/kWh guaranteed 1st 5 years, varies 3.05 - 8.38 €cents/kWh depending on turbine productivity.
Germany 6.9 - 9.0 6.9 €c/kWh at very windy site, 9.00 €c/kWh inland site 20 years.
Greece 6.5 - 7.32 70% of consumer power price for auto-producers and 90% for other generators. Rates vary lower to higher sites.
Ireland 3.2 - 5.3 AER-5 sets upper price limit of 4.8 €cents/kWh for projects > 3 MW, and 5.3 €cents/kWh for projects < 3 MW.
Italy 5 - 7.2 Market value plus current price for emerging green certificate
Japan 10.25 17 year contracts
Netherlands 7.71 Maximum rate available
Portugal 4.31 - 8.29 Lowest > 2600 full load hrs, highest < 2000 FL hrs, <40% grants
Spain 6.28 - 6.69 Producers have choice of set or variable price, set by gov.
Sweden 4.64
UK 6.08 - 9.12 Range of expected prices
USA 4.28 Federal Production Tax Credit + basic rate set at 1.7 $c/kWh
Source: Wind Directions research & "World Market Update 2001", BTM Consult, March 2002
Ave 6.4 Ave 6.4 €€cents/kWhcents/kWhExcl. distribution

Extra Costs from Intermittent Energy Sources
• Wind and solar power are intermittent. They do not produce power all the time or whenever you want it.
• The load factor for wind power is typically below 30%
• Therefore you need standby power capacity to match the wind or solar capacity.
• This greatly increases costs.

Disadvantages of Nuclear Power
• Poor public perceptions
– Contrary to evidence, many people believe nuclear is dangerous and has a major waste problem
• High capital costs
• To a large extent both of these can be blamed on the existing designs of nuclear power reactors

Why Dangerous Nuclear Accidents are Impossible for the PBMR
• 1. Uncontrolled Reactivity (Chernobyl)– Impossible because good physics ensures that the reactor is always under
control at all power ranges and for all transients.
• 2. Fuel Damage by Overheating (Three Mile Island)– Impossible because the small design ensures even in the worst accident
(total loss of coolant at 100% power) sufficient heat will be naturally dissipated to keep fuel temperatures below the level at which they begin to sustain damage.
– Normal fuel temperature: 1100ºC
– Worst accident temperature: 1400ºC
– Fuel damage begins slowly at 1600ºC
History of Power Reactors• Russia
� 1954: Obninsk� Graphite moderator, water coolant� 1986: Chernobyl !
� Britain� 1956: Calder Hall, Magnox (shut down last year)� Graphite moderator, CO2 coolant� 1970s: Advanced Gas-cooled Reactors (AGRs)
� USA� 1954: Nautilis, Nuclear Submarine� Water moderator, water coolant� Pressurised Water Reactor (PWR)� 1957: Shippingport: PWR� Today most nuclear power reactors are PWRs
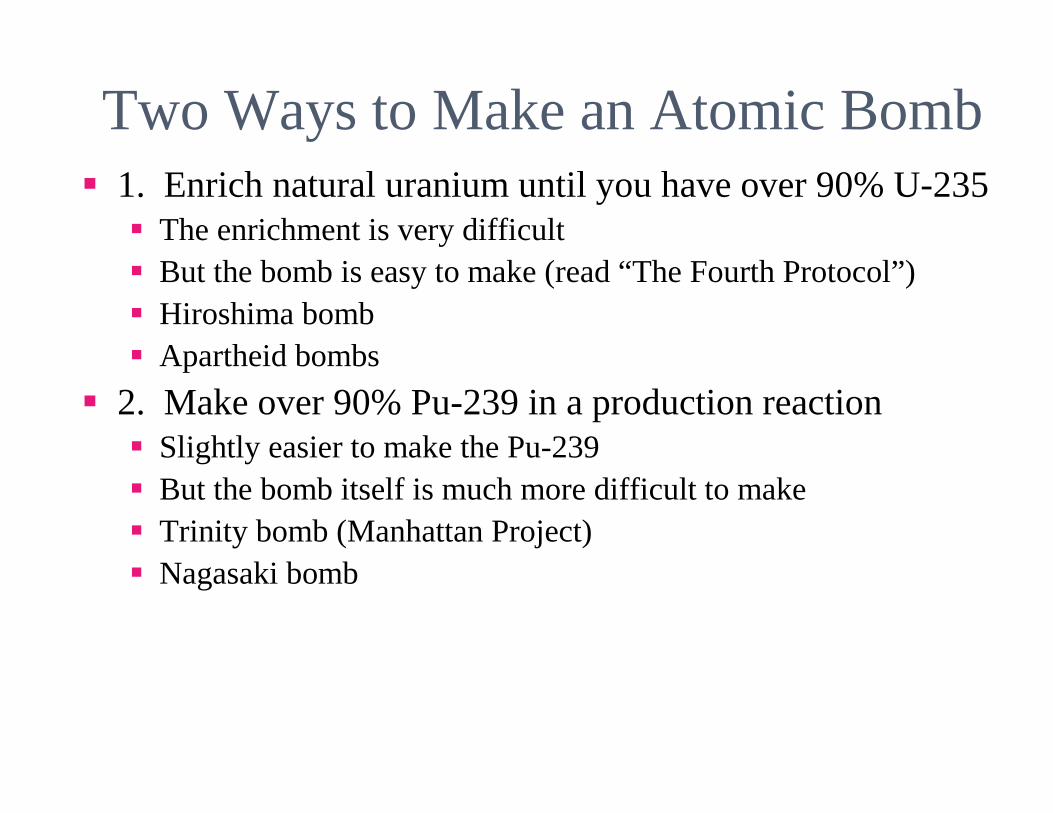
Two Ways to Make an Atomic Bomb� 1. Enrich natural uranium until you have over 90% U-235
� The enrichment is very difficult� But the bomb is easy to make (read “The Fourth Protocol”)� Hiroshima bomb� Apartheid bombs
� 2. Make over 90% Pu-239 in a production reaction� Slightly easier to make the Pu-239� But the bomb itself is much more difficult to make� Trinity bomb (Manhattan Project)� Nagasaki bomb

Cumulative Energy Requirements (CER) and Energy Payback Periods (EPP) For different energy sources
Alfred Voss, Ulrich Fahl, University of Stuttgart
CER EPP(without fuel) monthskWhprim/kWhe
Coal 0.28 - 0.30 3.2 - 3.6Lignite 0.16 - 0.17 2.7 - 3.3Gas CC 0.17 0.8Nuclear 0.07 - 0.08 2.9 - 3.4Solar PV 0.62 - 1.24 71 - 141Wind 0.05 - 0.15 4.6 - 13.7Hydro 0.03 - 0.05 8.2 - 13.7

Thank You
25 kWe Eskom solar stirling generatorat DBSA, Midrand

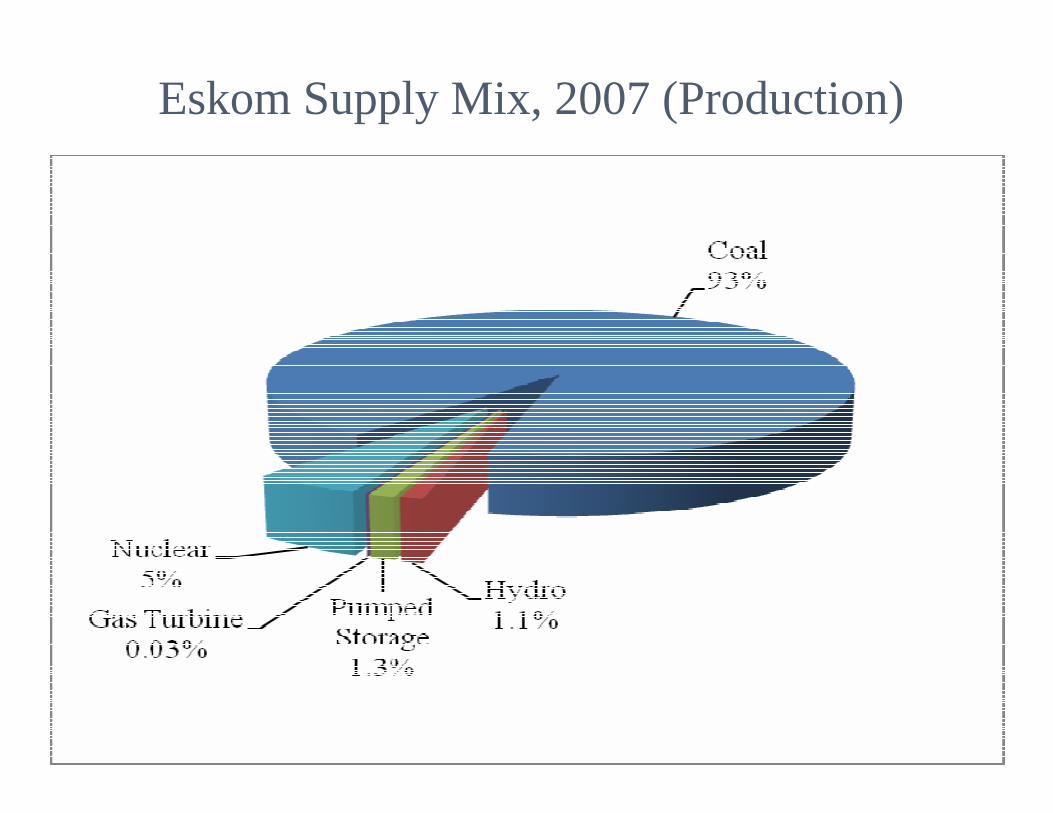
Eskom Supply Mix, 2007 (Production)
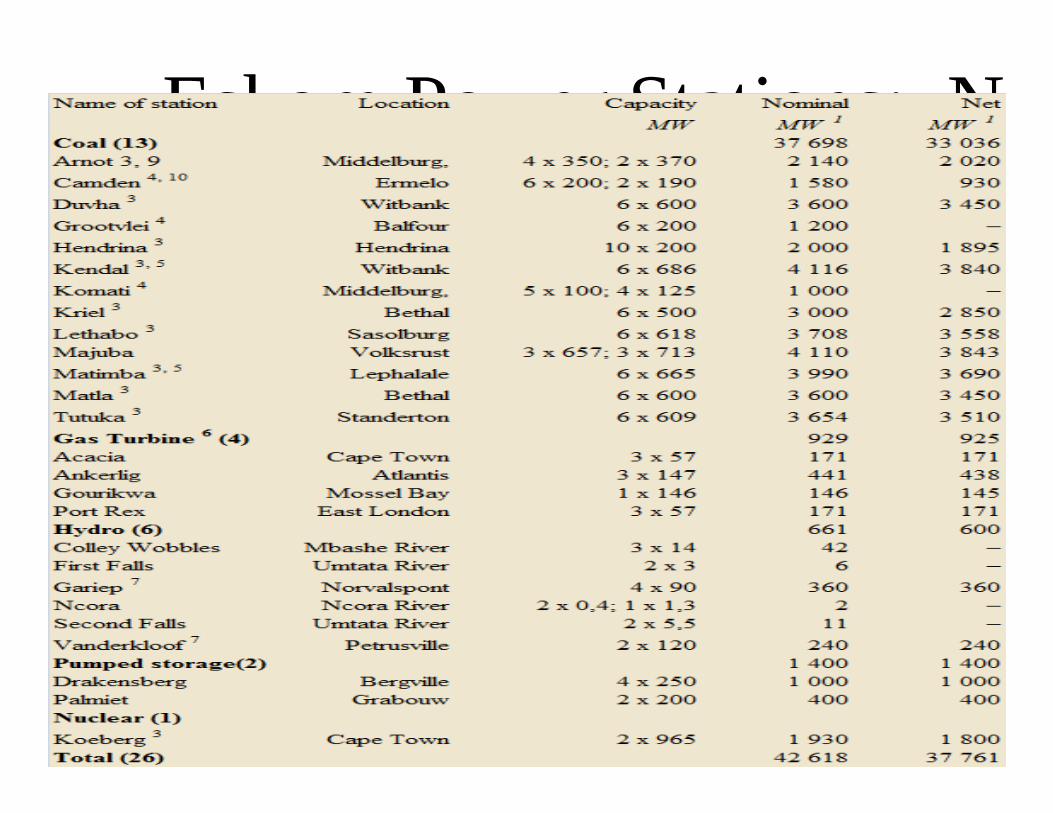
Eskom Power Stations: Nominal & Net Capacity: 2007
Pretoria
Johannesburg
Bloemfontein
Cape Town
East London
Port Elizabeth
Durban
Maputo
MOZAMBIQUE
LESOTHO
NAMIBIA
TT
TTTT
TT
TTT
TH
N
SWAZILAND
BOTSWANA
ESKOM POWER STATIONS 500MW+
T
1500km
Koeberg PS