what is on a demographer’s mind? a worldwide survey · demographic research a free, expedited,...
TRANSCRIPT
Demographic Research a free, expedited, online journal of peer-reviewed research and commentary in the population sciences published by the Max Planck Institute for Demographic Research Konrad-Zuse Str. 1, D-18057 Rostock · GERMANY www.demographic-research.org
DEMOGRAPHIC RESEARCH VOLUME 26, ARTICLE 16, PAGES 363-408 PUBLISHED 3 MAY 2012 http://www.demographic-research.org/Volumes/Vol26/16/ DOI: 10.4054/DemRes.2012.26.16 Research Article
What is on a demographer’s mind? A worldwide survey
Hendrik P. van Dalen
Kène Henkens © 2012 Hendrik P. van Dalen & Kène Henkens. This open-access work is published under the terms of the Creative Commons Attribution NonCommercial License 2.0 Germany, which permits use, reproduction & distribution in any medium for non-commercial purposes, provided the original author(s) and source are given credit. See http:// creativecommons.org/licenses/by-nc/2.0/de/
Table of Contents
1 Introduction 364 2 The survey 366 3 Looking outward: Population issues 368 3.1 Priorities in policy problems 368 3.2 Population policy views 372 3.3 Signs of pro-natalism 374 4 Looking inward: Demography as a science 379 4.1 The most inductive of all scientists? 380 4.2 Scientific interaction: Stale or lively? 382 4.2.1 Exchange between fundamental and applied researchers 385 4.2.2 A dynamic market for demography journals 385 4.3 Inward or outward directed? 386 4.3.1 Reading intensity of population experts 386 4.3.2 Publishing across disciplinary boundaries 388 4.4 Are there unifying scientific leaders? 390 4.4.1 Who has made demography big? 391 4.4.2 Who inspires today’s researchers? 394 5 Conclusion and discussion 395 5.1 Openness and trusted trading partners 397 5.2 Empirical mindset 398 5.3 Unifying power of scientific leaders 398 5.4 Dangers of the “melting pot” 399 6 Acknowledgements 399 References 400 Appendix 406
Demographic Research: Volume 26, Article 16 Research Article
http://www.demographic-research.org 363
What is on a demographer’s mind? A worldwide survey
Hendrik P. van Dalen1,2
Kène Henkens1,3
Abstract BACKGROUND Over the years, the community of demographers has grown in numbers and research interests, and has become increasingly interdisciplinary. The question is whether this process of growth and diversity has led to a fragmented community of demographers.
OBJECTIVE We examine whether or not demographers are characterized by a high level of consensus in approach and outlook. We focus on two issues. The first relates to the level of consensus among demographers on what they perceive to be the most urgent population issues, and what their opinions are about population and fertility developments. The second issue focuses on the question of whether or not there is a common approach or research style among demographers.
METHODS We gain insight into the opinions and attitudes of 970 demographers on the basis of an internet survey among IUSSP members, carried out in 2009.
RESULTS There is a high level of consensus on what is considered the most important population issue: ‘population aging’. With respect to population policy, demographers are greatly divided. There is, however, a high level of consensus on what makes a demographer successful: being highly empirical. Demography seems to be a well integrated discipline, as applied researchers take note of what pure researchers publish and vice versa. Demography has scientific leaders who form a unifying power within the discipline.
1 Netherlands Interdisciplinary Demographic Institute (NIDI), P.O. Box 11650, NL-2502 AR The Hague, The Netherlands, Tel: +3170-3565235, Fax: +3170-3647187. Email: [email protected]. 2 Tilburg University, Department of Economics and CentER, P.O. Box 90153, NL-5000 LE Tilburg, The Netherlands. 3 Tilburg University, Department of Sociology, P.O. Box 90153, NL-5000 LE Tilburg, The Netherlands.
van Dalen & Henkens: What is on a demographer’s mind? A worldwide survey
364 http://www.demographic-research.org
CONCLUSIONS The core of the discipline of demography is to be found in an openness to insights from different disciplines, a commitment to data and empirical research, and well integrated spheres of applied and pure research.
1. Introduction
Demography is a relatively young and small discipline. If we pinpoint the birth of the discipline by the establishment of the Population Association of America in 1931, one can look back on eighty years of history. During these eighty years, demography has encountered successes (cf. Morgan and Lynch 2001) but also endured the growing pains that accompany many scientific endeavors.4 Over the years, the community of demographers has grown in numbers and research interests, and has become increasingly interdisciplinary. Some fear that this process of growth and diversity has led to a fragmented community of demographers. For instance, Lee (2001: 1) laments the tendency among demographers to neglect formal demography and their preoccupation with micro studies: “We are becoming a doughnut of a field, without a center.” Another prominent demographer, McNicoll (2007), makes remarks in a similar vein as he observes that at academic population conferences topics are dealt with that “seem more linked by statistical technology than by an overriding disciplinary vision.” And, finally, Tabutin (2007) is very explicit in stating his concerns about the future of demography. If demography wants to survive as a science it has to strengthen (1) its identity or specificity; (2) its social and political utility; and (3) its public visibility. “If this does not happen, demography is likely to remain what it is now: a fascinating small discipline that is rather isolated and marginalized.” (2007: 27).
Conditional predictions like these are often well-informed by the way the scientific literature evolves, but rarely by what the demographers’ community thinks, or, as Greenhalgh (1996: 29) concludes: “the existing accounts pay insufficient attention to the practices that demographers themselves have undertaken in constructing their discipline.” In that respect, the question is relevant: do demographers share a core set of principles that makes up their identity, and which characteristics makes them stand out from other social scientists?
With these and related questions, we carried out a large internet survey among demographers around the world. We collected responses from 970 demographers on a
4 For uncovering scientific practices among demographers over time one should consult the reviews and overviews by Greenhalgh (1996), Demeny (1988), Caldwell (1996, 2001, 2005), McNicoll (1992, 2007) and Szreter (1993).
Demographic Research: Volume 26, Article 16
http://www.demographic-research.org 365
number of issues that relate to the subject matter of demography and on a set of questions that relate to the issue of how knowledge is produced within demography. The central concept in putting the demographer in perspective is the level of consensus. A priori, it is difficult to say whether the level of consensus will be high or low, as demography is a melting pot of different sciences and corresponding approaches. Demographic research can be both highly quantitative and framed in mathematical language (cf. Le Bras 2008) as well as qualitative, making use of ethnographic methods of research. In other words, the levels of generalization and codification can be high in one corner of the discipline and very low in another corner. As a consequence of this mixed character of demography, one can expect that demographers display both a high level and low level of consensus (Cole 1983) depending the question at hand. One way of discovering this may be to go out and ask demographers their opinion on demography as a science, and as a field of application.
In this paper two issues are examined. The first relates to the level of consensus among demographers on what they perceive to be the most urgent population issues, and what their opinions are about population and fertility developments. The answer to these questions may shed some light on the reigning research agenda of demographers. The second issue that is dealt with concerns the question whether there is a common approach or a research style that forms the common bond among demographers. A number of dimensions of the core approach is assessed: the perceived reward structure in science (or put differently ‘What makes a demographer successful?’), the level of scientific interaction, the level of multidisciplinarity; and the question of whether or not there are unifying scientific leaders in the field of demography.
Throughout the text we use the term “demographer” to denote all those who study population developments in the broad sense of the term. We acknowledge the habit of some to associate and equate demography with the area of “formal demography”, but want to stress that we also encompass those people working inside areas that may be typified as “social demography”, “family demography” or “behavioral demography” (cf. Burch 2003).
Although the goal is to obtain an overall picture, we readily admit that such an ambition is rarely fulfilled with one questionnaire, so trade-offs in topics and number of questions had to be made. What made the study difficult is that on a host of issues there are no previous surveys or studies to fall back on (the French study by Chasteland et al. (2004) being the exception to the rule). In probing the minds of demographers there are numerous other equally challenging topics to pick. Our aim is to try and find out what typifies modern-day demographers as represented by a sample of IUSSP members. We preferred the IUSSP membership database because it has a worldwide coverage. The worldwide focus has the benefit of not only encompassing demographers with American or European ties, but it allows us to obtain an impression of the opinions of

van Dalen & Henkens: What is on a demographer’s mind? A worldwide survey
366 http://www.demographic-research.org
demographers from regions like Africa and South America, which are not often registered.
2. The survey
During the year 2009 we organized a worldwide survey among demographers in cooperation with the IUSSP (International Union for the Scientific Study of Population). Most science studies take a look at local or national practices. This is one of the few studies that takes a survey on a worldwide basis. The underlying assumption for using the membership database of the IUSSP as basis for our sample is that the IUSSP (1) has a worldwide coverage of demographers; (2) has members who are — as Guest (1994) once said — a mixed crowd of both academics and practitioners who are involved in setting up family planning programs, organizing censuses, or who keep account of the state of the national population; (3) encompasses other associations: most IUSSP members are also a member of a national or regional demography associations like PAA or EAPS. The survey was internet-based, and the link was sent out via email through the secretariat of IUSSP to all its members, in April 2009. To obtain a higher response, the survey was set up in the two languages that are used within the IUSSP, English and French; 85 percent of respondents used the English version.5 We sent out two reminders to members and the survey was closed in September 2009.
The overall response rate was 46 percent, which we consider to be a satisfactory rate given that the internet survey was carried out first of all among experts, and secondly on a worldwide scale. In total, 970 demographers responded to the survey out of the total set of 2099 IUSSP members who were registered at the time of the start of the survey, April 2009. It should be noted that not all questions were answered by all respondents. Given that the questionnaire was rather lengthy, covering 35 questions and numerous sub-questions, this non-response was to be expected. Nevertheless 730 respondents completed the questionnaire. Based on those numbers the response rate is 35 percent, well above response rates for similar expert surveys (cf. Klein and Stern 2005).
Figure 1 summarizes the regional background of respondents by country of residence. The response across regions fits more or less the membership list of the IUSSP, thereby suggesting no selective non-response with respect to region of residence. More importantly, the high number of responses within each region allows us to make some comparisons by region. In the appendix (Table A1) to this paper, a
5 Among the respondents of the French questionnaire were of course a large number of French (30), but notably also demographers from Algeria (8), Belgium (7), Burkina Faso (7), Benin (6), Cameroon (6), Canada (13) and Ivory Coast (5).
Demographic Research: Volume 26, Article 16
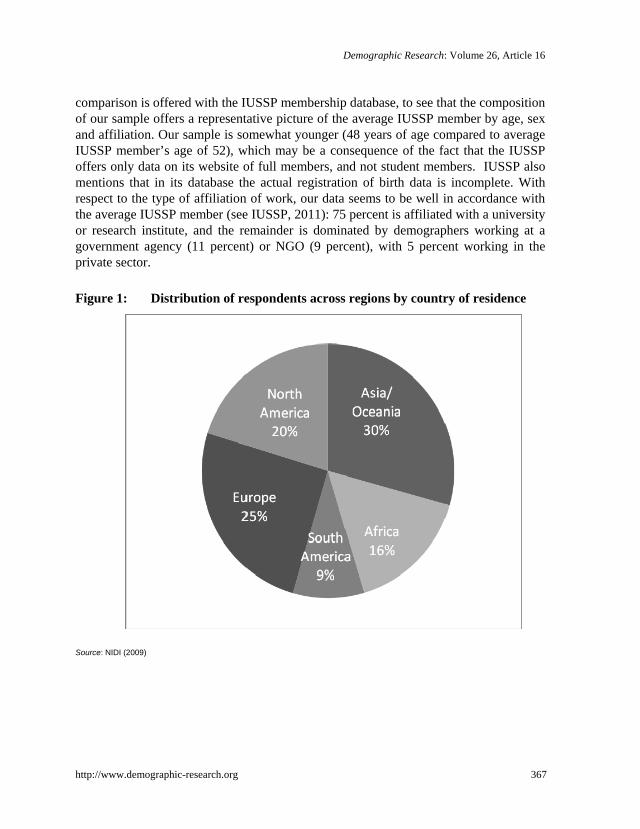
comparison is offered with the IUSSP membership database, to see that the composition of our sample offers a representative picture of the average IUSSP member by age, sex and affiliation. Our sample is somewhat younger (48 years of age compared to average IUSSP member’s age of 52), which may be a consequence of the fact that the IUSSP offers only data on its website of full members, and not student members. IUSSP also mentions that in its database the actual registration of birth data is incomplete. With respect to the type of affiliation of work, our data seems to be well in accordance with the average IUSSP member (see IUSSP, 2011): 75 percent is affiliated with a university or research institute, and the remainder is dominated by demographers working at a government agency (11 percent) or NGO (9 percent), with 5 percent working in the private sector.
Figure 1: Distribution of respondents across regions by country of residence
Source: NIDI (2009)
http://www.demographic-research.org 367

van Dalen & Henkens: What is on a demographer’s mind? A worldwide survey
368 http://www.demographic-research.org
We also asked about some supplementary characteristics that are not registered by IUSSP, and which may shed some additional light on the character of demographers. First of all, the type of work which most respondents practice is of an applied nature (46 percent), whereas only 18 percent claim that their work is more of a fundamental nature, 36 percent takes the middle position. With respect to political orientation, demographers lean towards the left of the political spectrum (49 percent), a fact they seem to share with other social scientists (cf. Lipset 1994, Klein and Stern 2005). Only 15 percent places itself of the right side of the political spectrum. The sample consisted of relatively highly educated respondents, as exactly two-thirds of them hold a PhD. Not everyone is a thoroughbred demographer, though, as 53 percent graduated in demography while the remaining “demographers” come mainly from sociology, economics, geography and mathematics/statistics. Based on this diverse background one would expect different allegiances, but asking the straight question ‘Do you considers yourself a demographer or a population scientist?” 71 percent affirmed this fully, whereas 27 percent considered themselves to be a demographer ‘to some degree’. Only a negligible number of respondents (2 percent) claimed they did not consider themselves to be ‘a demographer’.
3. Looking outward: Population issues
To assess the level of consensus we asked demographers what they perceive to be the most important policy issues and what their opinions are about population and fertility developments. We felt that the ranking of issues might not only shed light on the level of consensus among demographers, it might also give us an impression of their research agenda.
3.1 Priorities in policy problems
As a starting point for our bird’s-eye view of the world of demographers we started with a simple, yet illuminating general question: What do demographers consider the most important population issues in the next twenty years? We asked them to rank a set of eight world population issues, and every respondent could choose at most three issues. In Table 1 we only present the ranking of issues according to what every respondent considered the most important population issue. What becomes evident from this question is that population aging is considered by far the most important issue. At first glance this would hardly surprise any insider, and lay persons may also make the same educated guess, as population aging is often front-cover material in
Demographic Research: Volume 26, Article 16
http://www.demographic-research.org 369
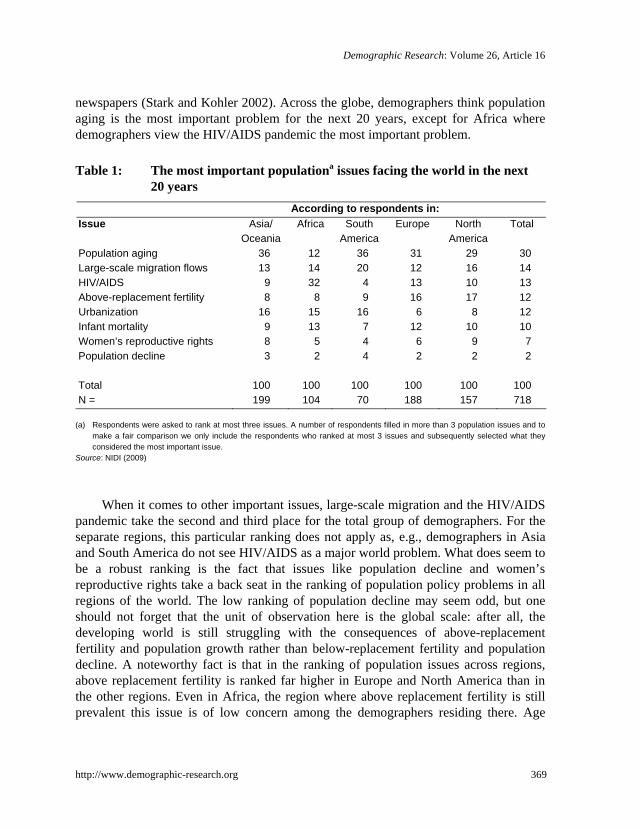
newspapers (Stark and Kohler 2002). Across the globe, demographers think population aging is the most important problem for the next 20 years, except for Africa where demographers view the HIV/AIDS pandemic the most important problem.
Table 1: The most important populationa issues facing the world in the next
20 years According to respondents in: Issue Asia/
Oceania Africa South
America Europe North
America Total
Population aging 36 12 36 31 29 30 Large-scale migration flows 13 14 20 12 16 14 HIV/AIDS 9 32 4 13 10 13 Above-replacement fertility 8 8 9 16 17 12 Urbanization 16 15 16 6 8 12 Infant mortality 9 13 7 12 10 10 Women’s reproductive rights 8 5 4 6 9 7 Population decline 3 2 4 2 2 2 Total 100 100 100 100 100 100 N = 199 104 70 188 157 718
(a) Respondents were asked to rank at most three issues. A number of respondents filled in more than 3 population issues and to
make a fair comparison we only include the respondents who ranked at most 3 issues and subsequently selected what they considered the most important issue.
Source: NIDI (2009)
When it comes to other important issues, large-scale migration and the HIV/AIDS
pandemic take the second and third place for the total group of demographers. For the separate regions, this particular ranking does not apply as, e.g., demographers in Asia and South America do not see HIV/AIDS as a major world problem. What does seem to be a robust ranking is the fact that issues like population decline and women’s reproductive rights take a back seat in the ranking of population policy problems in all regions of the world. The low ranking of population decline may seem odd, but one should not forget that the unit of observation here is the global scale: after all, the developing world is still struggling with the consequences of above-replacement fertility and population growth rather than below-replacement fertility and population decline. A noteworthy fact is that in the ranking of population issues across regions, above replacement fertility is ranked far higher in Europe and North America than in the other regions. Even in Africa, the region where above replacement fertility is still prevalent this issue is of low concern among the demographers residing there. Age
van Dalen & Henkens: What is on a demographer’s mind? A worldwide survey
370 http://www.demographic-research.org
(except for the case of the issue of above replacement fertility - older demographers find this a slightly more important issue than younger demographers -) does not play a role in assigning priorities.6In conclusion, we arrive at the observation that besides obvious world problems such as aging and the perception of population decline as a ‘non-problem’ the consensus on ranking policy issues is not high and seems to be tainted by one’s local perspective.
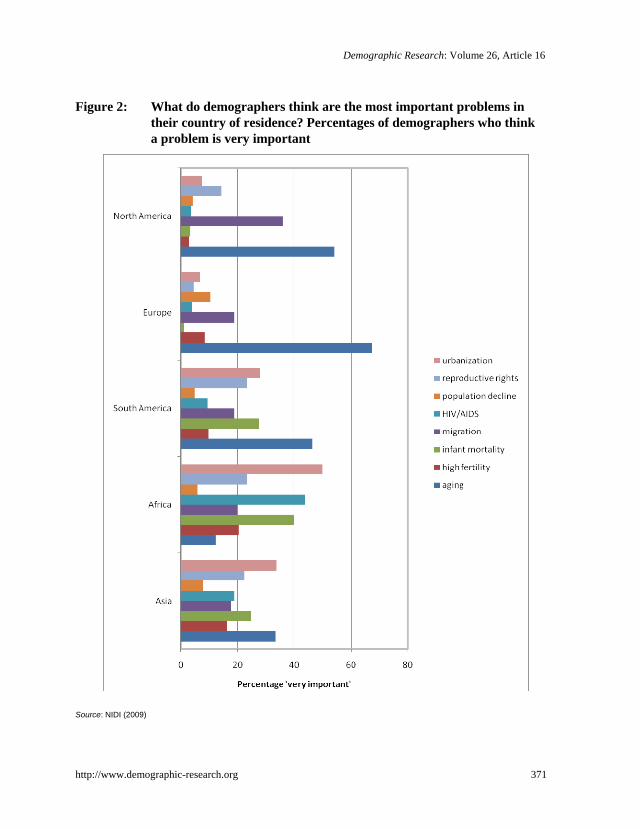
Perhaps this puzzling observation can be resolved by asking respondents to rank the same population issues, only this time for their country of residence. Population aging again is at the forefront of attention: 71 percent of all respondents thinks that this is an “important” to “very important” population issue in their country of residence in the coming 20 years. Large-scale migration flows and urbanization take second place. Of course, these aggregate results are very much tainted by the sample distribution across countries and these disaggregated figures very much reflect the stance as displayed in Table 1. For instance, population decline is an issue of some importance in Eastern Europe, and this is reflected by the demographers who live there: 32 percent considers this issue “very important”. Figure 2 offers an illustration of the diverging views on population issues by region (of residence).
For purposes of brevity, only the percentages of demographers who perceive an issue to be “very important” are presented. 7 As can be seen, population aging is considered to be very important in most regions, except for Africa. The overall impression that one can distill from Figure 2 is the heterogeneity in the “demographic sense of urgency” among demographers when they focus on their country of residence. The differences are quite revealing: European and North American demographers rank population aging and migration highly; in Africa HIV/AIDS, infant mortality and urbanization are considered very important; in South America it is aging, infant mortality and urbanization; and Asian demographers prioritize population aging, infant mortality and urbanization. In short, it appears when American and European demographers think of important issues they clearly identify aging and migration, demographers situating in other regions of the world have a far more diverse policy agenda.
6 Separate multivariate (ordered logit and multinomial logit) analyses have been carried out to check whether there are also additional influences on the priorities of demographers. Besides region of residence we also included age, sex, applied/pure nature of work, and having a PhD and although for a few issues one can trace some influence of these additional factors, in general the region of residence is the dimension which generates the largest differences across all population issues. Estimation results can be obtained upon request from the authors. 7 The overall impression of what demographers (by region) consider important in their country of residence does not change by taking all categories into account. Also other background variables (pure/applied type of work, age, sex) are of no big importance, only in the case of women’s reproductive rights can one trace effects that women find this issue more important than men and older respondents find this issue slight less important than younger respondents.
Demographic Research: Volume 26, Article 16
Figure 2: What do demographers think are the most important problems in their country of residence? Percentages of demographers who think a problem is very important
Source: NIDI (2009)
http://www.demographic-research.org 371
van Dalen & Henkens: What is on a demographer’s mind? A worldwide survey
372 http://www.demographic-research.org
3.2 Population policy views
Population policy issues have been part and parcel of demography right from the inception of demography as a science (Greenhalgh 1996, Caldwell 2005). The question that comes to the foreground is, how do demographers as a community agree on issues of policy and government involvement? We measured their views on these issues by using two types of questions: one asks what the population size should be in their country of residence and in the world as a whole; the other question refers to the critical or threshold level of fertility above and below replacement level at which governments should intervene. Both are related to discussions among demographers when they talk about developments in population and fertility and they certainly are part of the worries which governments have when fertility rises or fall below critical level, as registered for instance by the Population Division of the United Nations in its biannual World Population Policies. By confronting respondents with questions that focus on the direction which population growth should take and threshold levels in fertility we hope to shed light on the consensus among demographers about the state of population, for the world as a whole and for their own countries.
But before we present these outcomes we want to take one step back. Forming an opinion on the desirability of population growth and fertility developments presupposes that one has knowledge about the causes and consequences of population developments. If consensus is high on the body of knowledge (what may be termed ‘positive demography’) underlying policy views, one can expect a corresponding high level of consensus on population policy (correspondingly termed ‘normative demography’). We posed two statements to demographers which might capture their view on population and development. The first is a statement that perhaps goes back to one of the forefathers of demography, the political economist Thomas Malthus. Malthus stated that under certain assumptions “the power of population is indefinitely greater than the power in the earth to produce subsistence for man” (Malthus 1798: chapter 1). Today this theme resounds, namely the question of whether the carrying capacity of Earth is outpaced by the number of persons inhabiting it. There is much to be optimistic about as Lam (2011) demonstrates in his account of the past fifty years of extraordinary demographic history. Looking back, the concerns about the disastrous impact of rapid population growth on food production, resource depletion and poverty proved to be incorrect and showed the power of markets and human ingenuity. But despite these successes, concerns about global warming and pollution remain real, and in that respect there are grounds for pessimism. Demographers are quite divided on this central issue. Approximately 50 percent of the demographers disagree with the statement “The current size of the world population exceeds the carrying capacity of the earth”; 34 percent agree and 26 percent neither agree nor disagree. This outcome may sound surprising but demographers have a long tradition of examining the concept of carrying
Demographic Research: Volume 26, Article 16
http://www.demographic-research.org 373
capacity (see, e.g. Davis 1990). To some extent we could perhaps have suspected such an outcome, because there are numerous projections which show that the number of people on the earth will keep on growing from 7 billion in 2011 to approximately 10 billion during this century. Carrying capacity studies which stay within the bounds of common definitions of the concept display a large amount of uncertainty. Cohen (1995: 342) reports in a meta-study that the median of the highest bounds of carrying capacity studies is 12 billion and the median of the lowest bounds is 7.7 billion.
The second statement concerns the economic consequences of population decline, and is captured by the following line of reasoning: “Population decline will decrease the rate of economic growth.” This thesis is part of the hotly-disputed issue among demographers about the prospect of population decline (Coleman and Rowthorn 2011, Reher 2007). Still, to date the relationship between economic growth and population growth is a complex one and can hardly be considered resolved. However, judging from the responses of demographers, most seem convinced that the thesis that population decline implies a reduction of economic growth should be rejected: 59 percent disagrees with the statement and only 17 percent agrees.
In short, these two statements suggest that knowledge about population and development generates considerable dissent among demographers, even though the nexus between population and development belongs to the core of demography. The subsequent question is whether or not this dissent is reflected in population policy views.
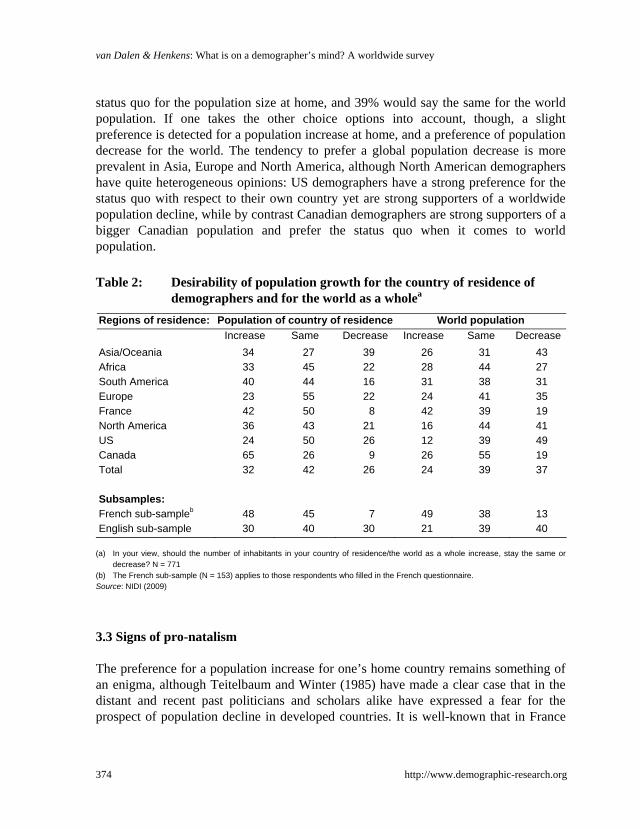
In order to measure their view we posed questions about the desirability of development of population – as measured by responses to the question ‘In your view, should the number of inhabitants in your country of residence/the world as a whole increase, stay the same or decrease?’ - and threshold levels in fertility, to be discussed subsequently. Desirable paths of development for the population of their country of residence and for the world population are presented in Table 2. This Table makes three points succinctly clear: (1) the low level of consensus among demographers; (2) the overall preference for the status quo; and (3) a slight preference for decrease for the world as a whole, but increase for the country of residence. Each characteristic deserves some explanation. Considering the fact that population conferences in the past have been concerned with questions of above replacement rate fertility (Schindlmayer 2004) and efforts to bring actual fertility rates in line with desired fertility rates, one would expect the balance among demographers to tip in favor of population decrease at a global level. However, the distribution across answer categories is more or less balanced, suggesting a relatively low level of consensus.8 If demographers had to make a choice then the modal choice would be the status quo: 42% of respondents prefer the
8 An extreme level of dissent would be a distribution of 50 percent in favor of population decrease and 50 percent in favor of population increase (cf. Tastle and Wierman 2006).
van Dalen & Henkens: What is on a demographer’s mind? A worldwide survey
374 http://www.demographic-research.org
status quo for the population size at home, and 39% would say the same for the world population. If one takes the other choice options into account, though, a slight preference is detected for a population increase at home, and a preference of population decrease for the world. The tendency to prefer a global population decrease is more prevalent in Asia, Europe and North America, although North American demographers have quite heterogeneous opinions: US demographers have a strong preference for the status quo with respect to their own country yet are strong supporters of a worldwide population decline, while by contrast Canadian demographers are strong supporters of a bigger Canadian population and prefer the status quo when it comes to world population.
Table 2: Desirability of population growth for the country of residence of
demographers and for the world as a wholea
Regions of residence: Population of country of residence World population
Increase Same Decrease Increase Same Decrease Asia/Oceania 34 27 39 26 31 43 Africa 33 45 22 28 44 27 South America 40 44 16 31 38 31 Europe 23 55 22 24 41 35 France 42 50 8 42 39 19 North America 36 43 21 16 44 41 US 24 50 26 12 39 49 Canada 65 26 9 26 55 19 Total 32 42 26 24 39 37 Subsamples: French sub-sampleb 48 45 7 49 38 13 English sub-sample 30 40 30 21 39 40
(a) In your view, should the number of inhabitants in your country of residence/the world as a whole increase, stay the same or decrease? N = 771
(b) The French sub-sample (N = 153) applies to those respondents who filled in the French questionnaire. Source: NIDI (2009)
3.3 Signs of pro-natalism
The preference for a population increase for one’s home country remains something of an enigma, although Teitelbaum and Winter (1985) have made a clear case that in the distant and recent past politicians and scholars alike have expressed a fear for the prospect of population decline in developed countries. It is well-known that in France

Demographic Research: Volume 26, Article 16
http://www.demographic-research.org 375
the perception of population decline is associated with a fall in national identity and, at times, geopolitical power. There is a long line of prominent French politicians, philosophers and sociologists who have pondered the consequences of the fall of fertility and who had pro-natalist views (Teitelbaum and Winter 1998, Gauthier 1996, Ogden and Huss 1982). In the French popular press and in policy circles, international relations and economic development are always linked to demographic circumstances. In the words of the French demographer Alfred Sauvy (cited in McIntosh 1983: 44): “The difference between France and other countries, this drying up of the sap at the moment of great expansion, is the most important fact of all her history; it has determined all subsequent development and is still in action today.”
We tried to see whether there is a trace of this French view toward population growth. Table 2 also presents the opinions of demographers situated in three specific countries and France stands out as a country with a clear growth bias: global population growth is even the dominant choice among French demographers (42 percent favor an increase of the world population). The French view was also tested by using the sample of respondents who filled in the French survey. The reason for using this subsample is that those who prefer the French language to converse and think about population problems are also the ones who rely primarily on the French population literature. This sub-sample also brings across the clear preference for a bigger national population. Just to give the plain numbers: 48 percent of those demographers who filled in the French questionnaire prefer a growing nation and 49 percent have a preference for a larger world population.9
Of course, opinions on desirable population growth paths do not necessarily reflect pro-natalism. Population growth is often associated with an increase in number of births, but positive growth can also be established through a decrease in mortality or net immigration. A more refined way to measure pro-natalism is to ask about the desirability of government intervention in matters of fertility, both in the cases of above and below replacement fertility. To start with the question of below replacement fertility, this issue has reinvigorated a policy debate that was put to rest after the Second World War, when the baby boom destroyed all the pessimistic outlooks on population decline. However, many European countries, particularly in Eastern Europe, are
9 We have attempted to trace the sources of this divergence, an obvious candidate for which would have been a simple translation or interpretation problem, but close scrutiny showed this was not the case. The questionnaire was checked by a native-French speaker and the wording of the question was so simple that differences are hard to relate to issues of translation or interpretation. This is also vindicated by taking a closer look at the answers of respondents from France, Canada and Belgium (both by country of birth and country of residence). Some of these respondents filled in the English and some the French questionnaire. For national population size (by country of residence and birth), the differences between those respondents residing in France, Belgium and Canada and those of French, Belgian or Canadian birth are minor. It is only by global population size preference that the English respondents (with French ties) favor a smaller world population size far more than the French respondents.
van Dalen & Henkens: What is on a demographer’s mind? A worldwide survey
376 http://www.demographic-research.org
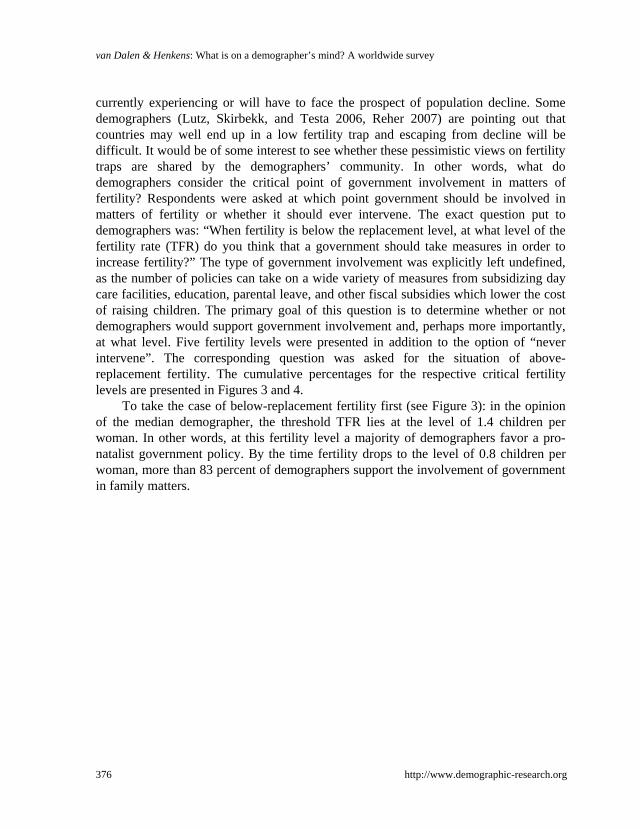
currently experiencing or will have to face the prospect of population decline. Some demographers (Lutz, Skirbekk, and Testa 2006, Reher 2007) are pointing out that countries may well end up in a low fertility trap and escaping from decline will be difficult. It would be of some interest to see whether these pessimistic views on fertility traps are shared by the demographers’ community. In other words, what do demographers consider the critical point of government involvement in matters of fertility? Respondents were asked at which point government should be involved in matters of fertility or whether it should ever intervene. The exact question put to demographers was: “When fertility is below the replacement level, at what level of the fertility rate (TFR) do you think that a government should take measures in order to increase fertility?” The type of government involvement was explicitly left undefined, as the number of policies can take on a wide variety of measures from subsidizing day care facilities, education, parental leave, and other fiscal subsidies which lower the cost of raising children. The primary goal of this question is to determine whether or not demographers would support government involvement and, perhaps more importantly, at what level. Five fertility levels were presented in addition to the option of “never intervene”. The corresponding question was asked for the situation of above-replacement fertility. The cumulative percentages for the respective critical fertility levels are presented in Figures 3 and 4.
To take the case of below-replacement fertility first (see Figure 3): in the opinion of the median demographer, the threshold TFR lies at the level of 1.4 children per woman. In other words, at this fertility level a majority of demographers favor a pro-natalist government policy. By the time fertility drops to the level of 0.8 children per woman, more than 83 percent of demographers support the involvement of government in family matters.

Demographic Research: Volume 26, Article 16
Figure 3: Cumulative percentages of demographers in favor of government intervention by fertility level, below-replacement fertility level
Note: Question posed: “When fertility is below the replacement level, at what level of the fertility rate (TFR) do you think that a
government should take measures in order to stimulate fertility?” The cumulative percentages should be interpreted as follows: at TFR 1.8 (just below-replacement level 2.1) 25 percent of respondents think government should intervene to increase the TFR, 40 percent support intervention at TFR 1.6, etc. and 83 percent support intervention at TFR 0.8 or lower. Hence 17 percent is in favor of non-intervention whatever the TFR level below replacement is.
Source: NIDI (2009)
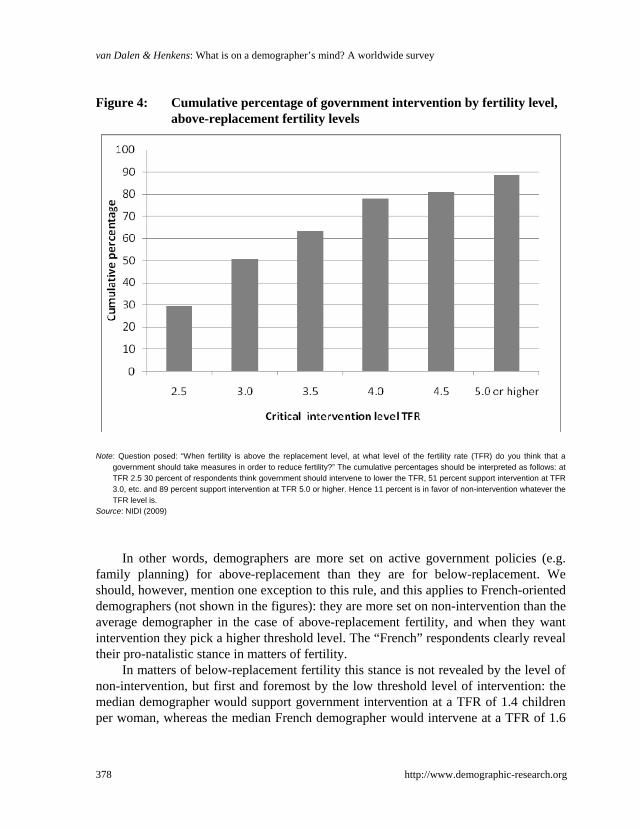
The case of above-replacement fertility (see Figure 4) is the more traditional case,
because it has been the topic of many a population conference in the past. The median demographer in our survey suggests that the threshold level is 3.0 children per woman. At the fertility rate of 5.0 (or higher) children per woman, close to 90 percent of demographers favor government intervention. Furthermore, older demographers are more set on a lower threshold level of government involvement than younger demographers. The percentages of “non-intervention” of government across the two cases of fertility can also be deduced from the figures: 17 percent of demographers do not support government involvement in the case of below-replacement fertility, whereas in the case of above-replacement fertility the corresponding percentage is 11 percent (see Figure 4).
http://www.demographic-research.org 377
van Dalen & Henkens: What is on a demographer’s mind? A worldwide survey
Figure 4: Cumulative percentage of government intervention by fertility level, above-replacement fertility levels
Note: Question posed: “When fertility is above the replacement level, at what level of the fertility rate (TFR) do you think that a
government should take measures in order to reduce fertility?” The cumulative percentages should be interpreted as follows: at TFR 2.5 30 percent of respondents think government should intervene to lower the TFR, 51 percent support intervention at TFR 3.0, etc. and 89 percent support intervention at TFR 5.0 or higher. Hence 11 percent is in favor of non-intervention whatever the TFR level is.
Source: NIDI (2009)
In other words, demographers are more set on active government policies (e.g.
family planning) for above-replacement than they are for below-replacement. We should, however, mention one exception to this rule, and this applies to French-oriented demographers (not shown in the figures): they are more set on non-intervention than the average demographer in the case of above-replacement fertility, and when they want intervention they pick a higher threshold level. The “French” respondents clearly reveal their pro-natalistic stance in matters of fertility.
In matters of below-replacement fertility this stance is not revealed by the level of non-intervention, but first and foremost by the low threshold level of intervention: the median demographer would support government intervention at a TFR of 1.4 children per woman, whereas the median French demographer would intervene at a TFR of 1.6
378 http://www.demographic-research.org

Demographic Research: Volume 26, Article 16
http://www.demographic-research.org 379
per woman a TFR of 1.6 children per woman. Besides the influence of a French background there are no regional differences to be noted in the stance towards below replacement fertility. This is entirely different for the case of above replacement fertility: demographers residing in Asia view the threshold of 3.0 children as critical, whereas the median demographer in Africa and South America find a TFR of 4.0 critical. European and North American demographers take the intermediate position and view a TFR of 3.5 as the critical threshold. Besides the regional difference, one can also detect a slight generational effect in matters of fertility: when it comes to above replacement fertility, older generations are apt to intervene at a slightly lower level of fertility, perhaps an effect of an education during the 1960s and 1970s and the memory of the threat of a ‘population bomb’, whereas the context for today’s newly minted demographers is entirely different. The age effect does not play a role of significance in forming an opinion with respect to below replacement fertility, perhaps because the prospect of population decline is new for all age groups.
In conclusion, the picture we have drawn so far from the questionnaire is that the demographers’ community is far from a homogenous in matters of policy priorities, with respect to the desirability of global and local population developments and the need for government involvement in matters of fertility. The low level of consensus on whether the global population growth is to a large extent related to the view on whether or not world population size has outpaced the carrying capacity of the world. Demographers are quite divided on this issue.
4. Looking inward: Demography as a science
Disagreement in matters of policy and in the assessment of causes and consequences can be viewed as a natural characteristic of scientific discourse. As Solomon (2008) makes succinctly clear, neither consensus nor dissent is intrinsically or generally desirable. The presence of dissent could be a photographic image of both a stale and a lively science. It may offer the impression of staleness when fields of research are disconnected, scholars do not have a unifying identity, research results are hardly taken notice of and experts make claims that pass each other like ships in the night. It could, on the other hand, be a sign of a lively science in which new ideas are put to the test and ideas and alternative tests are exchanged within the scientific community. Cole (1983) shows that dissent is a normal state of affairs at the research frontier, in contrast to a high level of consensus which characterizes the so-called core of a science: “the fully evaluated and universally accepted ideas which serve as the starting points for graduate education”. However, Cole goes on to show that minimal levels of consensus are a necessary condition for the accumulation of knowledge, even at the research frontier.

van Dalen & Henkens: What is on a demographer’s mind? A worldwide survey
380 http://www.demographic-research.org
The state of consensus is not only of concern to scientists, but is also of some concern to the demand side of the market of ideas. Science does not function in isolation from society, which not only values and uses the ideas that are produced and disseminated but also funds scientific research. The credibility of a science to policymakers and to the public at large is generally perceived to be related to the level of consensus.10
With the help of the survey, we will look in this section at whether or not there is a common approach or research style that forms the common bond among demographers. A number of dimensions of the core approach are assessed: the deductive or inductive approach, the level of scientific interaction, the level of multidisciplinarity, and the question of whether or not there are unifying scientific leaders in the field of demography.
4.1 The most inductive of all scientists?
The first distinguishing characteristic that insiders often attribute to demographers is that they have a highly empirical approach to their subject (see Caldwell 1996, 2001; Greenhalgh 1996; and the PAA oral history project 11 ). As Preston once remarked: “…because of their closeness to the data production, demographers are the most inductive of social scientists, focused to a greater extent than other social scientists on careful measurement and cautious interpretation” (1993: 594). Hauser and Duncan (1959) once stated about the culture of demography: “Students of population spend relatively little time debating subtle points in the philosophy of science or in self-criticism at a very general methodological level.” Indeed, the intrinsic joy of collecting and analyzing data is high on the scorecard of demographers. We asked demographers which elements of their work they found rewarding (on a five-point scale), and analyzing data ranked highest at 59 percent, describing it as highly rewarding. “Data analysis” ranks even higher than publishing in peer-reviewed journals (47 percent highly rewarding), being cited by other scholars (40 percent), or the process of collecting data (30 percent). To discover how incentives are perceived within demography, we asked respondents to answer the question: “Which characteristics will most likely place a population scientist on the fast track in their field?” We explicitly made clear to the respondents that we were not asking which characteristics should place scientists at the forefront, but simply how the scientific world actually works.
10 Cf. Kearl et al. (1979), Frey et al. (1984), Whaples (2009) for the case of consensus among economists. 11 See for an overview of interviews with prominent demographers and past presidents of the PAA: http://geography.sdsu.edu/Research/Projects/PAA/oralhistory/oralhistory.html.

Demographic Research: Volume 26, Article 16
http://www.demographic-research.org 381
Table 3 gives an idea of how demographers perceive the success factors for making the grade in demography. By merely looking at the factors demographers find “very important”, things become quite clear: the successful demographer is one who is good at empirical research, is broad-minded, knows his facts and knows how to communicate with the world of policy. Especially, the appreciation for making connections with policymakers is a noteworthy factor, as most other social scientists may have strong opinions about policy but in their day-to-day activities policy-oriented work is mostly held in low esteem (Klamer and Colander 1990). And as Table 3 shows on a separate factor, the writing of policy reports is considered moderately to very important by 75 percent of demographers. Part of this stance may be traced to the history of the discipline in which large organizations like UNFPA or UNAIDS — or even further down the road of history, the Rockefeller and Ford Foundation — have stimulated and funded demographic research, particularly the family-planning “industry” within universities and research centers (cf. Szreter 1993 and Demeny 1988). This has made its participants very perceptive of the need to communicate and accommodate this demand side of the market for demographic ideas.
Table 3: The reward system in demography, factors of perceived success* Characteristics Unimportant Moderately
important Very
important Don’t know
Being good at empirical research 1 17 81 1 Broad knowledge of the scientific literature 4 32 62 2 Having published in top-rank journals 6 32 59 3 Ability to communicate with policymakers 9 29 59 4 Knowing population facts and figures 8 32 57 3 Ability to make connections with prominent scholars
7 37 52 4
Being highly specialized 15 42 39 4 Regularly writing policy reports 21 42 33 4 Being good at solving mathematical puzzles 24 50 20 6 Excellence in mathematics 18 60 19 3
* Question posed: “Which characteristics will most likely place a population scientist on the fast track in their field?” (Note: We are not asking which characteristics should place them at the forefront.) Source: NIDI (2009)
The unique character of demographers becomes even more apparent by putting it
in perspective with that of one of their neighbors, who claim to be the kings of the social sciences: economists. Klamer and Colander (1990) once held interviews and a survey among PhD students of the economics departments of Ivy League universities.
van Dalen & Henkens: What is on a demographer’s mind? A worldwide survey
382 http://www.demographic-research.org
The most cited statistic produced by Klamer and Colander was the fact that those PhD students thought that having thorough knowledge of the economy was not a crucial ingredient in becoming a successful economist: 68 percent considered it unimportant and only 3 percent considered it very important. 12 The characteristics that put an economist on the fast track remain biased toward theory and mathematical modeling and a neglect for knowing your subject. In the Appendix to this paper (Table A2) we compare the opinions of PhD students in demography with PhD students in economics, and it becomes apparent that economists and demographers in-the-making are, for most dimensions, complete antipodes. Mathematical skills and puzzle-solving abilities are highly prized within economics, and having a broad knowledge of the literature and knowing the facts are considered unimportant. The young demographers do not see mathematical skills as very important and perceive that qualities such as knowing the facts and having a broad knowledge of the scientific literature are highly prized.
4.2 Scientific interaction: Stale or lively?
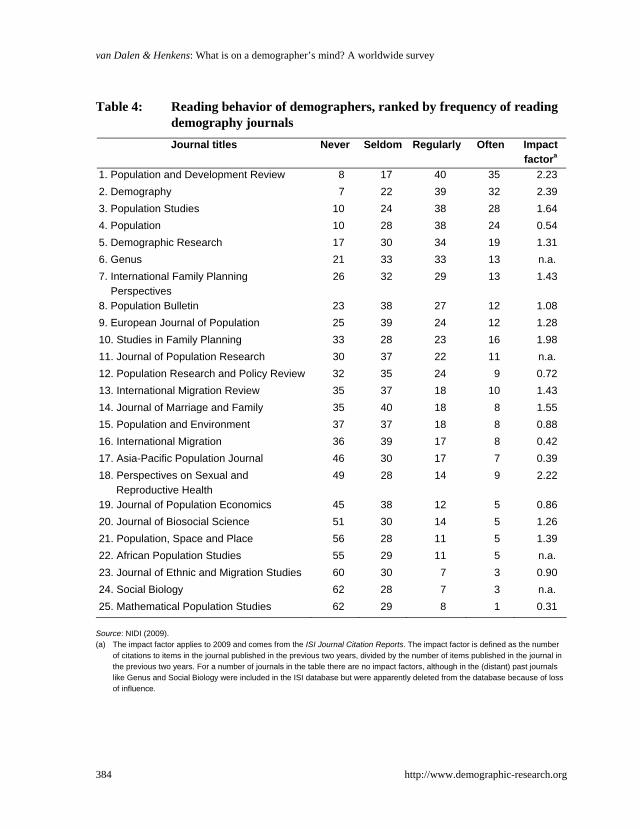
For a science to function properly it is of prime importance that scholars in different research areas be connected and ideas within a community exchanged. To see how intense the interaction is within demography, we consulted the reading behavior of demographers. Table 4 reports the frequency with which demographers read 25 specific demography journals.
To examine reading behavior within demography it is important to understand the hierarchy and network of journals (Klamer and Van Dalen 2002, Van Dalen and Henkens 1999). Most sciences -- and demography is no exception-- are structured along the lines of core journals to which most scholarly attention goes and where top-tier authors submit their papers. Core journals not only constitute the focal point within a discipline, they are also the “super-highway” to other journals. Keyfitz (1993: 539) once summarized the importance of this fact: “When someone asks the question ‘What is demography today?’ the simplest and clearest answer is ‘The research published in Demography’”. Demography may perhaps still be a very influential journal, but judging from the reading behavior of demographers in Table 4 it has to share this status with more journals than it did in the past. The three most-frequently cited core journals, according to the Institute of Scientific Information (ISI) – Population and Development Review, Demography and Population Studies – are also the journals that are consulted by the large majority of demographers. However, this ranking based on reading
12 Recently Colander (2007) updated this study to see whether the practice of economists and the incentives they face inside universities has changed. And indeed things have changed a bit, but by and large the bias toward mathematical skills and the disrespect for facts is still there.
Demographic Research: Volume 26, Article 16
http://www.demographic-research.org 383
behavior also has some notable differences compared to the familiar rankings based on citations (Van Dalen and Henkens 1999, 2004). The set of core journals is larger than one might deduce from citations and impact factors (see last column in Table 4 for the impact scores in 2009) one comes across in most rankings: the French-based journal Population, and the internet-cum-print journal Demographic Research are regularly consulted by demographers.13
To a certain extent the divergence between the impact scores and reading scores may appear puzzling to an outsider. High impact journals can be found at the top but also at the bottom. This may be partly explained by the fact that specialized journals may cater to the needs of equally specialized scholars (e.g. migration) whose group size is relatively small within demography. An alternative explanation is that citation practices differ across the specializations. Demographers publishing in reproductive health journals to some extent take on the publishing and citation practices that are common in epidemiology or medicine where citation frequency is far higher than in social sciences like economics, history or sociology. Specialized journals cater to the needs of a sub-group and serve their function like any specialization in human activity. The science of demography functions in a similar manner: clusters of specialized journals (family planning, migration, social biology) can be noted and each is in contact with the set of core journals, like Population and Development Review and Demography.14
13 The fact that Population and Genus are frequently consulted may be a result of the attention IUSSP gives to these journals. Genus is a journal that IUSSP members can subscribe to at a discount. 14 As it turns out, the science of demography as measured by the reading behavior of its participants functions in a similar manner: clusters of specialized journals can be noted and each is in contact with the set of core journals. We have examined the structure of demography journals by means of principal components analysis, a technique that allows conversion of distinct groups of variables into a multitude of variables. Within the group listed in Table 4 we can distinguish six groups: (1) the biggest group consisting of general-purpose, core journals; (2) reproductive health journals; (3) migration journals (International Migration Review, International Migration, Journal of Ethnic and Migration Studies); (4) more formal demography journals (Journal of Population Research, Mathematical Population Studies and Journal of Population Economics); (5) social biology journals (Social Biology and Journal of Biosocial Sciences); (6) environmental journal (only one journal present: Population and Environment).
van Dalen & Henkens: What is on a demographer’s mind? A worldwide survey
384 http://www.demographic-research.org
Table 4: Reading behavior of demographers, ranked by frequency of reading demography journals Journal titles Never Seldom Regularly Often Impact
factora
1. Population and Development Review 8 17 40 35 2.23 2. Demography 7 22 39 32 2.39 3. Population Studies 10 24 38 28 1.64 4. Population 10 28 38 24 0.54 5. Demographic Research 17 30 34 19 1.31 6. Genus 21 33 33 13 n.a. 7. International Family Planning
Perspectives 26 32 29 13 1.43
8. Population Bulletin 23 38 27 12 1.08 9. European Journal of Population 25 39 24 12 1.28 10. Studies in Family Planning 33 28 23 16 1.98 11. Journal of Population Research 30 37 22 11 n.a. 12. Population Research and Policy Review 32 35 24 9 0.72 13. International Migration Review 35 37 18 10 1.43 14. Journal of Marriage and Family 35 40 18 8 1.55 15. Population and Environment 37 37 18 8 0.88 16. International Migration 36 39 17 8 0.42 17. Asia-Pacific Population Journal 46 30 17 7 0.39 18. Perspectives on Sexual and
Reproductive Health 49 28 14 9 2.22
19. Journal of Population Economics 45 38 12 5 0.86 20. Journal of Biosocial Science 51 30 14 5 1.26 21. Population, Space and Place 56 28 11 5 1.39 22. African Population Studies 55 29 11 5 n.a. 23. Journal of Ethnic and Migration Studies 60 30 7 3 0.90 24. Social Biology 62 28 7 3 n.a. 25. Mathematical Population Studies 62 29 8 1 0.31
Source: NIDI (2009). (a) The impact factor applies to 2009 and comes from the ISI Journal Citation Reports. The impact factor is defined as the number
of citations to items in the journal published in the previous two years, divided by the number of items published in the journal in the previous two years. For a number of journals in the table there are no impact factors, although in the (distant) past journals like Genus and Social Biology were included in the ISI database but were apparently deleted from the database because of loss of influence.

Demographic Research: Volume 26, Article 16
http://www.demographic-research.org 385
4.2.1 Exchange between fundamental and applied researchers
A hotly debated topic in most social sciences is the gap that exists between those who focus on an academic career and those who apply the knowledge produced within academia. Applied policy work is mostly met with some disdain by the academic scholars, whereas those who focus on applied work lament the ivory-tower approach of such academic professionals (see Klamer and Colander 1990). It would be of some interest to see how demography has dealt with this gap. Some have noted how the demographers’ community has been a mixture of applied and academic researchers (Guest 1994, Van de Kaa 1991, Ní Bhrolcháin 2000). We attempted to find out whether there is a large difference in reading between those two types of demographers. Respondents were asked to characterize their work on a sliding scale of applied to fundamental research. Most demographers (46 percent) would characterize their work as applied, 36 percent are more or less divided and 19 percent typify their work as fundamental. It turns out that the differences in reading patterns across journals by applied and fundamental respondents are marginal: those who focus on fundamental research read slightly more than those who do applied work (see Van Dalen and Henkens 2012). The only journals that are read more by applied demographers than their purely academic colleagues are family-planning journals. Considering the relatively high frequency of consultation of demography journals, this suggests that applied researchers take note of what fundamental researchers publish and vice versa.
4.2.2 A dynamic market for demography journals
As a final point, it should be stressed that the flow of demographic ideas is not supplied by a fixed set of established journals. Demographic Research has entered the market for demography journals in 1999 and within ten years time it has become a real competitor for the top-tier demography journals: 53 percent of demographers consult this journal, at least, on a regular basis and close to one in five demographers consult it often. Furthermore, there are journals outside the list of so-called established journals approved by the Institute for Scientific Information (ISI) who cater to the needs of demographers. Journals like Genus, Journal of Population Research, Asia-Pacific Population Journal and African Population Studies are all well read. Some of these even beat the established journals in “popularity” or influence. Of course, many of these journals owe their popularity to a regional focus and this might mean these journals could join the ISI, as regional coverage is a selection criterion. To summarize on those journals with a clear regional orientation: the European Journal of Population is read by 64 percent of European demographers regularly or often; the corresponding

van Dalen & Henkens: What is on a demographer’s mind? A worldwide survey
386 http://www.demographic-research.org
percentage for African Population Studies is 58 percent by African demographers; Asia-Pacific Population Journal is read by 60 percent of Asian demographers; and Population is read regularly or often by 85 percent of European demographers, the Australian based Journal of Population Research is read by 80 percent of the demographers living in Australia and New Zealand.
4.3 Inward or outward directed?
A science that is truly open-minded and perhaps innovative is one that dares to trade ideas with other sciences or at least import ideas produced elsewhere. In other words, are demographers inwardly directed and satisfied with what is produced within the domain of demography journals, or are they outwardly oriented and do they listen to what others outside demography have to say?
To measure the relationship with neighboring sciences we will use two measures: reading and publishing behavior of demographers across disciplinary boundaries.
4.3.1 Reading intensity of population experts
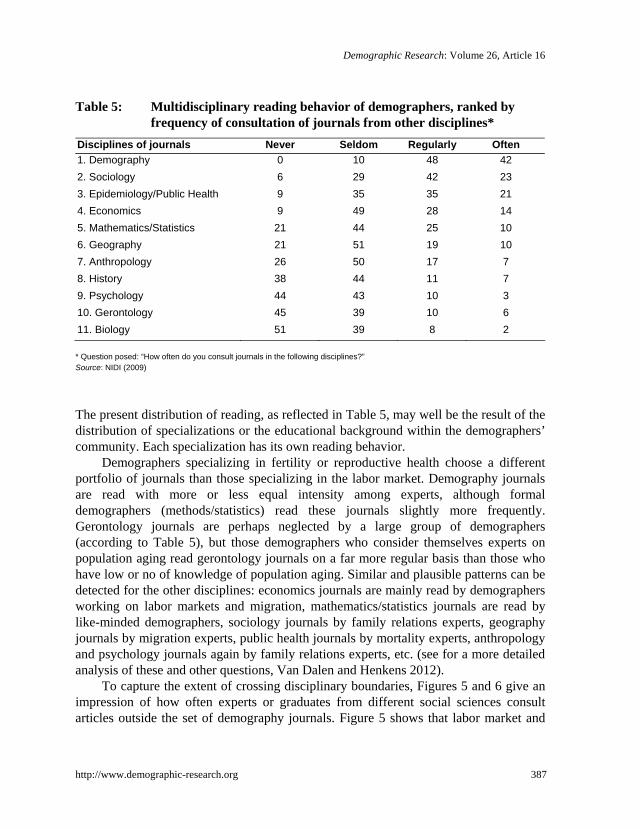
Table 5 gives a straightforward presentation of the frequency with which journals in neighboring disciplines are consulted by “demographers”. It does not come as a surprise that demography journals are consulted with the highest frequency. It is however in the ranking of journals from other disciplines that one can clearly see with which disciplines demographers are most closely aligned. Sociology and epidemiology are quite frequently consulted: 65 percent and 55 percent respectively consult these journals regularly or often.
The disciplines that follow are largely to be expected, yet the bottom three disciplinary fields are not in line with the image of a thoroughly multidisciplinary science. Psychology, gerontology and biology are read by only a very small subgroup of demographers. The neglect of psychology is more difficult to understand, as the ground for application of psychological insights is wide and varied. Hobcraft (2006, 2007) is one of the few who plead for the incorporation of psychology, but apparently this plea has not yet reached the demographers’ community.
Demographic Research: Volume 26, Article 16
http://www.demographic-research.org 387
Table 5: Multidisciplinary reading behavior of demographers, ranked by frequency of consultation of journals from other disciplines*
Disciplines of journals Never Seldom Regularly Often 1. Demography 0 10 48 42 2. Sociology 6 29 42 23 3. Epidemiology/Public Health 9 35 35 21 4. Economics 9 49 28 14 5. Mathematics/Statistics 21 44 25 10 6. Geography 21 51 19 10 7. Anthropology 26 50 17 7 8. History 38 44 11 7 9. Psychology 44 43 10 3 10. Gerontology 45 39 10 6 11. Biology 51 39 8 2 * Question posed: “How often do you consult journals in the following disciplines?” Source: NIDI (2009)
The present distribution of reading, as reflected in Table 5, may well be the result of the distribution of specializations or the educational background within the demographers’ community. Each specialization has its own reading behavior.
Demographers specializing in fertility or reproductive health choose a different portfolio of journals than those specializing in the labor market. Demography journals are read with more or less equal intensity among experts, although formal demographers (methods/statistics) read these journals slightly more frequently. Gerontology journals are perhaps neglected by a large group of demographers (according to Table 5), but those demographers who consider themselves experts on population aging read gerontology journals on a far more regular basis than those who have low or no of knowledge of population aging. Similar and plausible patterns can be detected for the other disciplines: economics journals are mainly read by demographers working on labor markets and migration, mathematics/statistics journals are read by like-minded demographers, sociology journals by family relations experts, geography journals by migration experts, public health journals by mortality experts, anthropology and psychology journals again by family relations experts, etc. (see for a more detailed analysis of these and other questions, Van Dalen and Henkens 2012).
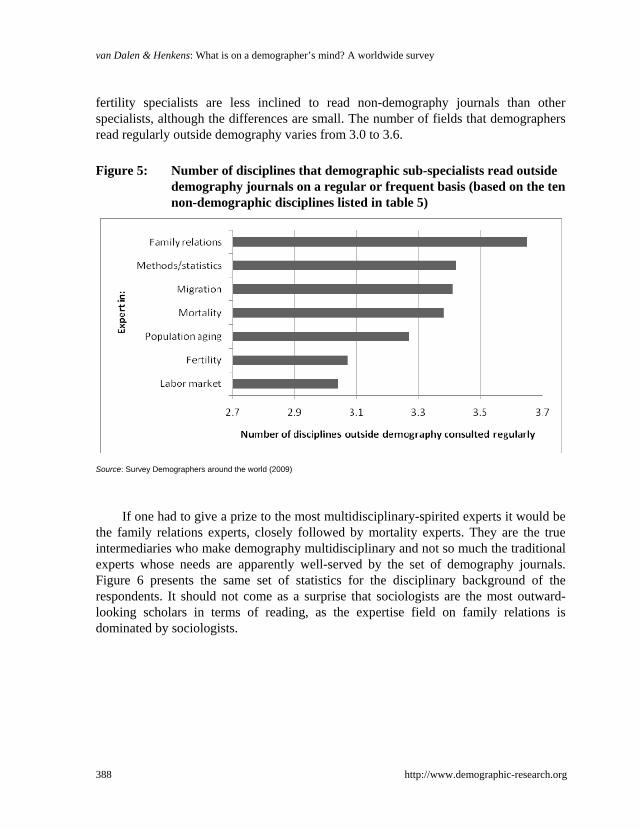
To capture the extent of crossing disciplinary boundaries, Figures 5 and 6 give an impression of how often experts or graduates from different social sciences consult articles outside the set of demography journals. Figure 5 shows that labor market and
van Dalen & Henkens: What is on a demographer’s mind? A worldwide survey
fertility specialists are less inclined to read non-demography journals than other specialists, although the differences are small. The number of fields that demographers read regularly outside demography varies from 3.0 to 3.6.
Figure 5: Number of disciplines that demographic sub-specialists read outside
demography journals on a regular or frequent basis (based on the ten non-demographic disciplines listed in table 5)
Source: Survey Demographers around the world (2009)
If one had to give a prize to the most multidisciplinary-spirited experts it would be
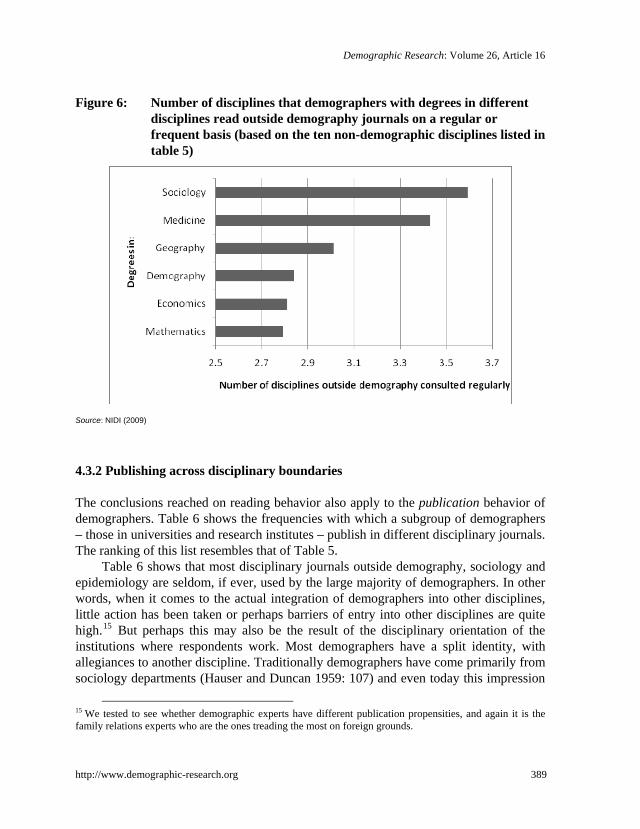
the family relations experts, closely followed by mortality experts. They are the true intermediaries who make demography multidisciplinary and not so much the traditional experts whose needs are apparently well-served by the set of demography journals. Figure 6 presents the same set of statistics for the disciplinary background of the respondents. It should not come as a surprise that sociologists are the most outward-looking scholars in terms of reading, as the expertise field on family relations is dominated by sociologists.
388 http://www.demographic-research.org
Demographic Research: Volume 26, Article 16
Figure 6: Number of disciplines that demographers with degrees in different disciplines read outside demography journals on a regular or frequent basis (based on the ten non-demographic disciplines listed in table 5)
Source: NIDI (2009)
4.3.2 Publishing across disciplinary boundaries
The conclusions reached on reading behavior also apply to the publication behavior of demographers. Table 6 shows the frequencies with which a subgroup of demographers – those in universities and research institutes – publish in different disciplinary journals. The ranking of this list resembles that of Table 5.
Table 6 shows that most disciplinary journals outside demography, sociology and epidemiology are seldom, if ever, used by the large majority of demographers. In other words, when it comes to the actual integration of demographers into other disciplines, little action has been taken or perhaps barriers of entry into other disciplines are quite high.15 But perhaps this may also be the result of the disciplinary orientation of the institutions where respondents work. Most demographers have a split identity, with allegiances to another discipline. Traditionally demographers have come primarily from sociology departments (Hauser and Duncan 1959: 107) and even today this impression
15 We tested to see whether demographic experts have different publication propensities, and again it is the family relations experts who are the ones treading the most on foreign grounds.
http://www.demographic-research.org 389

van Dalen & Henkens: What is on a demographer’s mind? A worldwide survey
390 http://www.demographic-research.org
remains true, a development which may have been stimulated by the expansion of ‘family demography’. This institutional pattern almost certainly influences the respondents’ work habits, as they have to appear as both demographers and as e.g., an economist or a sociologist, but one should also remember that most have their networks in part outside the world of demographers.
Table 6: Multidisciplinary publication behavior of demographers, ranked by
frequency of publication in journals from other disciplines* Disciplines Never Seldom Regularly Often 1. Demography 13 29 41 17 2. Sociology 39 35 20 6 3. Epidemiology/Public Health 49 28 17 6 4. Geography 70 18 9 3 5. Economics 69 22 7 2 6. Mathematics/Statistics 77 18 4 1 7. Gerontology 80 12 6 2 8. History 82 12 4 2 9. Anthropology 82 13 4 1 10. Biology 88 9 2 1 11. Psychology 92 5 2 1
* Question posed: “How often do you publish your work in journals in the following disciplines?” Source: NIDI (2009)
4.4 Are there unifying scientific leaders?
Another binding factor in a science represents the presence of star scientists, as they often can connect different disciplines and steer a science in a certain direction (Goyal, Van der Leij and Moraga-Gonzalez 2006). A final measure we therefore consider is the demographer who serves as a role model or instructor for the demographers’ community. This measure is of interest for two reasons. First, it sheds light on the question of who demographers listen to, who they respect and who has been influential in their day-to-day research. Is it the pure formal demographer highly specialized in one topic, or is the more eclectic social scientist covering the entire range of demographic topics? Second, it gives an impression of the level of consensus within the demographers’ community on the significance of individual contributions (Cole 1983, Lipset 1994).

Demographic Research: Volume 26, Article 16
http://www.demographic-research.org 391
We pose two questions about scientific leaders: (1) Which scholars – alive or deceased – have been the most important in making demography what it is today?; and (2) Which scholars have been most important for your own work? Respondents were asked to name a maximum of three scholars per question and they could choose from a list of names of 250 social scientists working in the field of demography or, if their preferred name was not among the 250 listed “demographers”, they could write down the name of their choice. The list was constructed based on earlier citation research (Van Dalen and Henkens 2001, 2004, 2005), the classic names were listed in the Encyclopedia of Population by Demeny and McNicoll (2003), and a final check was performed on most cited scholars in core demography journals in the Web of Science.16
4.4.1 Who has made demography big?
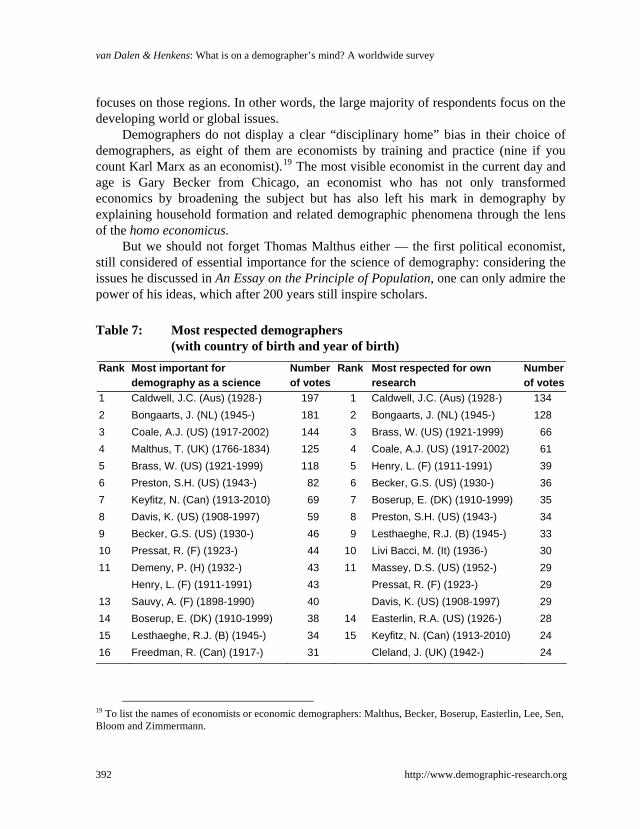
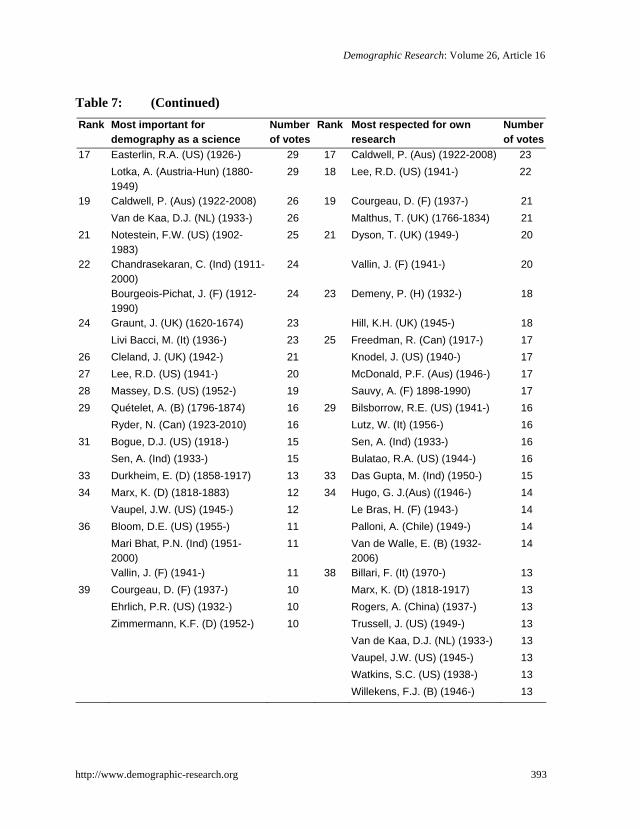
Table 7 (left-hand column) sums up the top-40 of most important demographers as viewed by demographers. The respondents named a total of 244 different names. Caldwell and Bongaarts are considered by far the most respected demographers. The top 5 most respected demographers receive 35 percent of the total number of votes casted by the respondents. In other words, approximately one in three demographers mention one of the “big five” demographers. This level of consensus is comparable to the measured level of consensus in other sciences (see Cole 1983: 120), in particular in sociology (36 percent).17 The ranking of the most important demographers is however more informative if one pays attention to who is mentioned (and who is left out).
What is most striking about the top demographers is that they have covered (or are still covering) a wide range of topics throughout their career, and that many of them have studied and published on global issues or issues of developing countries. Caldwell, Bongaarts and Coale18 are demographers who have written on a wide range of topics, often with a focus on regions outside their own country of residence. In a way this outward focus fits the profile of the group of respondents: even though 45 percent of respondents resides in Europe and North America, only 23 percent say that their work
16 This survey strategy was chosen not only to prevent respondents from misspelling certain names and leaving out first names, but was also done to jog the memory of respondents: such open questions may have left respondents at a loss, and when probing for spontaneous answers the names chosen may simply have been an exercise in recalling famous names instead of pondering the question that is at stake. 17 One should however take into account that the question in Cole (1983) refers to “Which scientists have contributed most to the science in question?” The question that is the focus of attention in our paper refers to scientists who have contributed to the making of a science and is thereby far broader. 18 It should be noted that Ansley Coale is ranked third, while he was considered the most important demographer in an earlier French survey (see Chasteland et al. 2004). Part of the explanation may well be that the respondents of the French survey were allowed to list up to five names.
van Dalen & Henkens: What is on a demographer’s mind? A worldwide survey
392 http://www.demographic-research.org
focuses on those regions. In other words, the large majority of respondents focus on the developing world or global issues.
Demographers do not display a clear “disciplinary home” bias in their choice of demographers, as eight of them are economists by training and practice (nine if you count Karl Marx as an economist).19 The most visible economist in the current day and age is Gary Becker from Chicago, an economist who has not only transformed economics by broadening the subject but has also left his mark in demography by explaining household formation and related demographic phenomena through the lens of the homo economicus.
But we should not forget Thomas Malthus either — the first political economist, still considered of essential importance for the science of demography: considering the issues he discussed in An Essay on the Principle of Population, one can only admire the power of his ideas, which after 200 years still inspire scholars. Table 7: Most respected demographers
(with country of birth and year of birth) Rank Most important for
demography as a science Number of votes
Rank Most respected for own research
Number of votes
1 Caldwell, J.C. (Aus) (1928-) 197 1 Caldwell, J.C. (Aus) (1928-) 134 2 Bongaarts, J. (NL) (1945-) 181 2 Bongaarts, J. (NL) (1945-) 128 3 Coale, A.J. (US) (1917-2002) 144 3 Brass, W. (US) (1921-1999) 66 4 Malthus, T. (UK) (1766-1834) 125 4 Coale, A.J. (US) (1917-2002) 61 5 Brass, W. (US) (1921-1999) 118 5 Henry, L. (F) (1911-1991) 39 6 Preston, S.H. (US) (1943-) 82 6 Becker, G.S. (US) (1930-) 36 7 Keyfitz, N. (Can) (1913-2010) 69 7 Boserup, E. (DK) (1910-1999) 35 8 Davis, K. (US) (1908-1997) 59 8 Preston, S.H. (US) (1943-) 34 9 Becker, G.S. (US) (1930-) 46 9 Lesthaeghe, R.J. (B) (1945-) 33 10 Pressat, R. (F) (1923-) 44 10 Livi Bacci, M. (It) (1936-) 30 11 Demeny, P. (H) (1932-) 43 11 Massey, D.S. (US) (1952-) 29 Henry, L. (F) (1911-1991) 43 Pressat, R. (F) (1923-) 29 13 Sauvy, A. (F) (1898-1990) 40 Davis, K. (US) (1908-1997) 29 14 Boserup, E. (DK) (1910-1999) 38 14 Easterlin, R.A. (US) (1926-) 28 15 Lesthaeghe, R.J. (B) (1945-) 34 15 Keyfitz, N. (Can) (1913-2010) 24 16 Freedman, R. (Can) (1917-) 31 Cleland, J. (UK) (1942-) 24
19 To list the names of economists or economic demographers: Malthus, Becker, Boserup, Easterlin, Lee, Sen, Bloom and Zimmermann.
Demographic Research: Volume 26, Article 16
http://www.demographic-research.org 393
Table 7: (Continued) Rank Most important for
demography as a science Number of votes
Rank Most respected for own research
Number of votes
17 Easterlin, R.A. (US) (1926-) 29 17 Caldwell, P. (Aus) (1922-2008) 23 Lotka, A. (Austria-Hun) (1880-
1949) 29 18 Lee, R.D. (US) (1941-) 22
19 Caldwell, P. (Aus) (1922-2008) 26 19 Courgeau, D. (F) (1937-) 21 Van de Kaa, D.J. (NL) (1933-) 26 Malthus, T. (UK) (1766-1834) 21 21 Notestein, F.W. (US) (1902-
1983) 25 21 Dyson, T. (UK) (1949-) 20
22 Chandrasekaran, C. (Ind) (1911-2000)
24 Vallin, J. (F) (1941-) 20
Bourgeois-Pichat, J. (F) (1912-1990)
24 23 Demeny, P. (H) (1932-) 18
24 Graunt, J. (UK) (1620-1674) 23 Hill, K.H. (UK) (1945-) 18 Livi Bacci, M. (It) (1936-) 23 25 Freedman, R. (Can) (1917-) 17 26 Cleland, J. (UK) (1942-) 21 Knodel, J. (US) (1940-) 17 27 Lee, R.D. (US) (1941-) 20 McDonald, P.F. (Aus) (1946-) 17 28 Massey, D.S. (US) (1952-) 19 Sauvy, A. (F) 1898-1990) 17 29 Quételet, A. (B) (1796-1874) 16 29 Bilsborrow, R.E. (US) (1941-) 16 Ryder, N. (Can) (1923-2010) 16 Lutz, W. (It) (1956-) 16 31 Bogue, D.J. (US) (1918-) 15 Sen, A. (Ind) (1933-) 16 Sen, A. (Ind) (1933-) 15 Bulatao, R.A. (US) (1944-) 16 33 Durkheim, E. (D) (1858-1917) 13 33 Das Gupta, M. (Ind) (1950-) 15 34 Marx, K. (D) (1818-1883) 12 34 Hugo, G. J.(Aus) ((1946-) 14 Vaupel, J.W. (US) (1945-) 12 Le Bras, H. (F) (1943-) 14 36 Bloom, D.E. (US) (1955-) 11 Palloni, A. (Chile) (1949-) 14 Mari Bhat, P.N. (Ind) (1951-
2000) 11 Van de Walle, E. (B) (1932-
2006) 14
Vallin, J. (F) (1941-) 11 38 Billari, F. (It) (1970-) 13 39 Courgeau, D. (F) (1937-) 10 Marx, K. (D) (1818-1917) 13 Ehrlich, P.R. (US) (1932-) 10 Rogers, A. (China) (1937-) 13 Zimmermann, K.F. (D) (1952-) 10 Trussell, J. (US) (1949-) 13 Van de Kaa, D.J. (NL) (1933-) 13 Vaupel, J.W. (US) (1945-) 13 Watkins, S.C. (US) (1938-) 13 Willekens, F.J. (B) (1946-) 13
van Dalen & Henkens: What is on a demographer’s mind? A worldwide survey
394 http://www.demographic-research.org
A clear “geographical home” bias in respected demographers is also lacking when one looks at the region of residence of respondents (see Table A3 in the appendix). In each region the names Caldwell, Bongaarts and Coale pop up, and to lesser extent Malthus and Brass. Each region has its specific number one, but the fact that these names are consistently mentioned suggests that the community of demographers is quite homogenous across the globe. This picture emerges also when one looks at different cohorts of demographers (see Table A4). Bongaarts, Caldwell and Coale are again often mentioned. Of course, generational differences are present: Ansley Coale is clearly the number one favorite among respondents of 60 years and older, whereas the young (35 or younger) favor Bongaarts and those respondents belonging to the middle age group (age 36-59) choose Caldwell as the most important demographer. With some imagination one would be tempted to say that the age plays a role in picking heroes, but looking at the top 5 it seems that young and old have more or less the same big names in mind when they think of who has made demography big. Again this suggests that the consensus of whose ideas have been important is very stable across regions and ages.
The list also gives an impression of what is lacking. First of all, female demographers are not well represented. In the top-40 of most important demographers only two women are mentioned: Ester Boserup, the Danish economist, and Pat Caldwell, the Australian demographer and partner of John Caldwell. Secondly, in this list of classic demographers one misses the classic names of people like Peter Laslett (1915-2001) and David Glass (1911-1978). And finally, what is also lacking is the presence of migration scholars, a fact which again underscores the earlier observation that migration is “the stepchild of demography” (Kirk 1960). The only true migration specialists among demographers are Daniel Courgeau and Douglas Massey. Highly specialized demographers tend not to be mentioned often. For instance, Jim Vaupel, whose longevity studies are path-breaking and widely cited20, barely reaches the top-40.
4.4.2 Who inspires today’s researchers?
The most respected demographers are the classic demographers with a broad overview of the subject of demography. But what about those scholars whose work has been important for today’s research of demographers? At this point we would expect more specialists to appear in the ranking, as the age of modern science favors specialists. In the right-hand column of Table 7 we present the ranking of those demographers who have been important for the respondents. They named in total 385 different names.
20 In the set of core journals (PDR, Population Studies, Demography, Population Bulletin and Population Index) over the period 1950-2010 (source: ISI Web of Science), Vaupel, Manton and Stallard (1979) is the most-often cited article with 579 citations.

Demographic Research: Volume 26, Article 16
http://www.demographic-research.org 395
A number of observations can be made with respect to the ranking of Table 7. First, the private value of star demographers and their work for the everyday activities of researchers yields winners and losers compared to the all-time-rankings as listed in the left-hand column. The names of Henry, Boserup, Lesthaeghe, Livi Bacci and Massey belong to the winners as they move up in the hierarchy, whereas scholars like Malthus, Keyfitz, Davis and Bourgeois-Pichat are losing ground in affecting the day-to-day research of the modern demographer. Second, although the top-20 is dominated by the same “classic” names, the bottom of the list reveals younger (the Italian demographer Billari being the youngest) and slightly more specialized demographers. Especially the lack of bright ‘young’ men or women in this ranking of demographers is noteworthy: only three demographers in the top 40 is younger than 60 years of age. It may be a tell-tale sign that demography is not a field that can be characterized fast-moving and highly codified like physics (Cole 1983, Collins 1994). 21 Third, the neglected participants in the science of demography seem to be winning some ground: Susan Watkins and Monica Das Gupta increase the number of top female demographers to four, and Graeme Hugo, Andrei Rogers and Richard Bilsborrow bring the number of migration experts to five. Still, it remains somewhat of a mystery why authors like Larry Bumpass, Geoffrey McNicoll or Harriet Presser receive so few votes – authors who based on their citation and publication track record would seem to belong to the top-40.
As a final note it should be mentioned that the ranking is more or less robust to the age of the respondent. This suggests great stability in the demography community and clarity about who the giants in science are. Demographers aged 35 years or younger list the same names and a similar ranking as in Table 7 (see appendix Table A4), and the difference between Bongaarts and Caldwell is for quite a number of demographers “too close to call” either one a winner. It is only when one looks at the geographical origin of respondents (Table A3) that each region has its own specific masters: in Asia and Africa Caldwell is number one, in South America, Brass, in Europe Henry (closely followed by Livi Bacci and Lesthaeghe) and in North America Bongaarts are the demographers who have been most influential in the everyday working life of demographers.
5. Conclusion and discussion
Demography is what demographers do. This old quip may sound like a cliché, but it goes to the heart of Thomas Kuhn’s (1970) idea that ‘normal’ science is made by
21 One could also read too much into these rankings or remark that demographers have a fine sense of and respect for history.
van Dalen & Henkens: What is on a demographer’s mind? A worldwide survey
396 http://www.demographic-research.org
communities. The disciplinary communities define the standards of solution, tools, concepts and problems that would be regarded as valid in a particular field. It is the power of outstanding individual scholars who bring forward the fundamental changes in a science, but as Kuhn (1970: 94) makes clear to see how scientific revolutions are effected “there is no standard higher than the assent of the relevant community”. Demography is a particular interesting case because it seems to function like a “melting pot” for members who come from a wide variety of disciplines. Perhaps outsiders still depict demographers as census-takers, accountants, actuaries or family planners, but whoever reads the pages of Demography or Population and Development Review can see that demography is thoroughly intertwined with the societal issues of our day: population aging, migration, a multicultural society, pensions and retirement, infectious diseases. The commitment to the subject of population makes the community quite coherent and cohesive. In spite of the different backgrounds and the fact that most academic demographers must have allegiances to another discipline, this paper shows that the members of the demographers’ community have a clear idea of “what makes a demographer”.
The high level of consensus disappears when one assesses the opinions of demographers on core policy issues of demography: desirable population developments, government involvement in matters of fertility. Such a low level of consensus is not worrisome as long as its members exchange ideas and read and publish beyond their own disciplinary boundaries. Neither consensus nor dissent is intrinsically or generally desirable in science, and the only condition one would like to impose is that the intellectual exchange be real and vibrant. Like many social sciences, demography is pluralist and it therefore matters that intellectual exchange takes place in order to make the best of the comparative advantages of scholars of different sub-disciplines. The functioning of a science – and demography is no exception – depends on its core, a set of principles, values and a language that will make exchange possible and unify the separate achievements. In other words, a discipline is in need of certain standards in order to make the “melting pot” work, just like societies need language in order to interact and benefit from cultural diversity. The success of demography seems to lie to a large extent in the development and application of methods and the gathering of data in a systematic and uniform manner by means of censuses and surveys (cf. Morgan and Lynch 2001).
At this point, some prominent demographers worry about the prospect of demography becoming marginalized as a science, because the standards that make a demographer are being eroded. For instance, Lee (2001: 1) laments the tendency in the demographers’ community to neglect formal demography: “Demographers nowadays are preoccupied with micro-research and have neglected or not mastered the “language” and art of (macro) demography.” McNicoll (2007) observes that demography “seems to
Demographic Research: Volume 26, Article 16
http://www.demographic-research.org 397
be advancing into vagueness. The PAA’s (Population Association of America) annual meetings and in Europe the biennial European Population Conferences of EAPS (European Association for Population Studies) grow ever larger, but their topics seem more linked by statistical technology than by an overriding disciplinary vision.” And finally, Coleman (2000: 27) notes the eclectic and multidisciplinary approach of demography in explaining population phenomena. However, despite the unifying force of the object of science, the hardness of data and the attention paid to accuracy of measurement and of estimation it seems to be missing a unique core, which inspired Coleman to characterize demography as “A subject in search of a home”.
What light can our survey among demographers shed on this critique and related worries? What demographers say and perceive is, of course, no substitute for the substantive arguments made by Lee and others or the historical accounts of the making of demography as a scientific discipline (Greenhalgh 1996).22 However, a survey can shed some light on the character of the demographers’ community and discover unique features that other social sciences do not capture and which may perhaps alleviate some of the worries of leading demographers. The insights and lessons derived from the survey are listed below.
5.1 Openness and trusted trading partners
More than other scientists, demographers seem to be raised by different traditions, and because of this mixed heritage their openness to “outside” voices comes naturally. For instance, economists and sociologists can stay within the narrow bands that define their discipline for their entire career and each can think their science is the queen of social sciences. Demographers, perhaps for love of their subject, have come to share a set of norms that makes them stand out from sociologists or economists, who are more theoretically oriented. In a manner of speaking, demography offers a meeting ground amongst the social sciences to discuss and analyze population issues from a variety of viewpoints, as demographers not only come undiluted from the few “pure demography” graduate schools, but also from neighboring disciplines like sociology, economics, geography and public health. Reflecting on the intermediary function of demography, Coleman once stated “Demography is the Swiss franc of the social sciences, and
22 Using the framework of a survey among IUSSP members is fraught with dangers according to some because it may not reflect how demographers think who are working at the research frontier. A round of interviews with leading scholars would have been more suitable to cover that particular caveat. However, the IUSSP sample offers the opportunity to see how place of work may be relevant for opinions on population matters but also for discovering different scientific practices. The price of carrying out a global survey is that a lot of issues (and questions) have to be kept quite general in order to be applicable to demographers in the various countries of the world.
van Dalen & Henkens: What is on a demographer’s mind? A worldwide survey
398 http://www.demographic-research.org
demographers are its merchant bankers” (Coleman 2000: 28). In that respect, the openness and ability to trade ideas should not be seen as a weakness (as it may invite competition in its own turf) but as a strength.
5.2 Empirical mindset
A second characteristic of demographers is their commitment to data and empirical research, and this empirical focus is present for every subfield within demography. The norm among demographers is to stay close to the data. This focus may be one of the strongholds of demography, and makes it stand out from other social sciences (Morgan 1995). The empirical mindset may well turn out to be an open one because scholars whose minds are struggling with one unifying theoretical vision of the world often have closed minds. The political scientist Tetlock (2005) has used the metaphor of Isaiah Berlin about the hedgehog and the fox: “The fox knows many things, but the hedgehog knows one big thing” (Berlin 1953). For evaluating the predictive power of experts Tetlock contends that the fox – the thinker who knows many little things, draws from an eclectic array of traditions and is better able to improvise in response to changing events – is more successful in predicting the future than the hedgehog, who knows one big thing, is fascinated by one single tradition and imposes formulaic solutions on ill-defined problems. In that respect, through their drive for realism demographers seem to be more adapted to the life of foxes and not hedgehogs.
5.3 Unifying power of scientific leaders
Specialization is the mark of all sciences and has enabled scientists to push the frontiers of their discipline outward. However, when specialization makes subfields disconnected from the core of a science it could be counterproductive. Star scientists are of considerable importance to unify findings of specialized fields within a science, not only in terms of tying together diverse subfields but also in setting the research agenda. Scientific leaders therefore play a double role: unifying and agenda-setting. Gathering from the ranking of respected or influential demographers, the star scientist who is able to oversee the entire field of demography is praised far more than the specialist demographer. Perhaps the small size of the field of demography helped raise these eminent scholars. Star demographers are able to cover an entire field, whereas star sociologists and economists are often specialists. And as Lipset (1994: 199) argues, sociology is “one of the most internally divided disciplines, if not the most. [And] severe internecine struggles have a long history in the field.” Such counterproductive
Demographic Research: Volume 26, Article 16
http://www.demographic-research.org 399
internal strifes do not seem to be present in demography. In short, demography has a clear and unique identity which makes it stand out, and in that respect one of the conditions Tabutin (2007) formulated for demography to survive has been fulfilled.
With respect to agenda-setting capabilities, it may help to use the “fox and hedgehog” metaphor again. Judging from the respected list of demographers in this paper, the star demographers cannot be accused of being single-minded and can therefore be qualified more as foxes and not so much as hedgehogs. Of course, such qualifications are to some extent a matter of taste, but it may be a telling statistic that demographers do not play a role as public intellectuals (Posner 2001: 215). And they may be right for reasons noted by Posner in his book Decline of the Public Intellectual (2001): public intellectuals are perhaps a joy to listen to but they often shed more heat than light.23
5.4 Dangers of the “melting pot”
In conclusion, demography as a science may be depicted as a well-functioning “melting pot”. But one should be aware of the dangers that lurk behind this model of science. The rules of the melting pot may seem simple: adopt the common culture and the common language, but once the rules are violated the assimilation process stops and so do the benefits of trading ideas within the community (Lazear 1999). If there is one important lesson to derive from the worldwide survey among demographers, it is that their comparative advantage lies not only in technique but on what may very well be a distinct culture that stands out among the social sciences. This intangible comparative advantage may however erode when newcomers refuse to learn the language (as Lee (2001) points out) or adopt the culture. And once this process is under way, demography starts becoming a fragmented science in which “anything goes”, no one really talks to one another and the only connection is the subject: population.
6. Acknowledgements
The authors gratefully acknowledge the help of the IUSSP Council and Mary Ellen Zuppan in particular in giving us the opportunity to distribute our survey. Comments by Anne Gauthier, Dick van de Kaa, Nico van Nimwegen, Joop de Beer, Jeroen van Ginneken, Frans Willekens and two anonymous referees are gratefully acknowledged.
23 There are, of course, scholars who may be marked as public intellectuals that deal with population issues, like Julian Simon, Paul Ehrlich, Amartya Sen and Gary Becker — but their “family” ties lie primarily with other disciplines.

van Dalen & Henkens: What is on a demographer’s mind? A worldwide survey
400 http://www.demographic-research.org
References
Berlin, I. (1953). The hedgehog and the fox: An essay on Tolstoy’s view of history. London: Weidenfeld & Nicolson.
Burch, T.K. (2003). Demography in a new key: A theory of population theory. Demographic Research 9(11): 263-284. doi:10.4054/DemRes.2003.9.11.
Caldwell, J.C. (1996). Demography and social science. Population Studies 50(3): 305-333. doi:10.1080/0032472031000149516.
Caldwell, J.C. (2001). Demographers and the study of mortality: Scope, perspectives and theory. Annals New York Academy of Sciences 954: 19-34. doi:10.1111/ j.1749-6632.2001.tb02744.x.
Caldwell, J.C. (2005). Demographers’ involvement in twentieth-century population policy: Continuity or discontinuity? Population Research and Policy Review 24(4): 359-385. doi:10.1007/s11113-005-1290-y.
Chasteland, J.C., Loriaux, M., and Roussel, L. (eds.) (2004). Démographie 2000 – Une enquête internationale par Internet auprès des démographes. Louvain-la-Neuve: Bruylant-Academia.
Cohen, J.E. (1995). Population growth and earth’s human carrying capacity. Science 269(5222): 341-346. doi:10.1126/science.7618100.
Colander, D. (2007). The making of an economist, Redux. Princeton, NJ: Princeton University Press.
Cole, S. (1983). The hierarchy of the sciences? American Journal of Sociology 89(1): 111-139. doi:10.1086/227835.
Coleman, D. (2000). Demography in an intellectual context: A subject in search of a home. In: Pavlík, Z. (ed.). Position of demography among other disciplines. Prague: 27-35.
Coleman, D. and Rowthorn, R. (2011). Who’s afraid of population decline? A critical examination of its consequences. Population and Development Review Supplement 37(S1): 217-248. doi:10.1111/j.1728-4457.2011.00385.x.
Collins, R. (1994). Why the social sciences won’t become high-consensus, rapid-discovery science. Sociological Forum 9(2): 155-177.
Davis, K. (1990). Population and resources: Fact and interpretation. Population and Development Review Supplement 16: 1-21. doi:10.2307/2808060.
Demographic Research: Volume 26, Article 16
http://www.demographic-research.org 401
Demeny, P. (1988). Social science and population policy. Population and Development Review 14(3): 451-479. doi:10.2307/1972198.
Demeny, P. and McNicoll, G. (2003). Encyclopedia of population. New York: Thomson Gale.
Frey, B.S., Pommerehne, W.W., Schneider, F., and Gilbert, G. (1984). Consensus and dissension among economists: An empirical inquiry. American Economic Review 74(5): 986-994.
Gauthier, A.H. (1996). The state and the family – A comparative analysis of family policies in industrialized countries. Oxford: Clarendon Press.
Goyal, S., van der Leij, M., and Moraga-Gonzalez, J.L. (2006). Economics: An emerging small world. Journal of Political Economy 114(2): 403-412. doi:10.1086/500990.
Greenhalgh, S. (1996). The social construction of population science: An intellectual, institutional, and political history of twentieth-century demography. Comparative Studies in Society and History 38(1): 26-66. doi:10.1017/ S0010417500020119.
Guest, A.M. (1994). Gatekeeping among the demographers. In: Simon, R.J. and Fyfe, J.J. (eds.). Editors as gatekeepers – Getting published in the social sciences. Maryland: Rowman & Littefield: 85-106.
Hauser, P.M. and Duncan, O.D. (1959). The study of population – An inventory and appraisal. Chicago: University of Chicago Press.
Hobcraft, J. (2006). The ABC of demographic behaviour: How the interplay of alleles, brains and contexts over the life course should shape research aimed at understanding population processes. Population Studies 60(2): 153-187. doi:10.1080/00324720600646410.
Hobcraft, J. (2007). Towards a scientific understanding of demographic behavior. Population 62(1): 47-51. doi:10.3917/pope.701.0047.
IUSSP (2011). 2010 IUSSP membership survey, Paris: IUSSP.
Kearl, J., Pope, C., Whiting, G., and Wimmer, L. (1979). A confusion of economists? American Economic Review: Papers and Proceedings 69(2): 28-37.
Keyfitz, N. (1993). Thirty years of demography and Demography. Demography 30(4): 533-549. doi:10.2307/2061805.

van Dalen & Henkens: What is on a demographer’s mind? A worldwide survey
402 http://www.demographic-research.org
Kirk, D. (1960). Some reflections on American demography in the nineteen sixties. Population Index 26(4): 305-310. doi:10.2307/2731350.
Klamer, A. and Colander, D. (1990). The making of an economist. Boulder: Westview Press.
Klamer, A. and Van Dalen, H.P. (2002). Attention and the art of scientific publishing. Journal of Economic Methodology 9(3): 289-315. doi:10.1080/1350178022 000015104.
Klein, D.B. and Stern, C. (2005). Professors and their politics: The policy views of social scientists. Critical Review 17(3-4): 257-303. doi:10.1080/0891381 0508443640.
Kuhn, T.S. (1970). The structure of scientific revolutions, 2nd edition enlarged. Chicago: University of Chicago Press.
Lam, D. (2011). How the world survived the population bomb: Lessons from 50 years of extraordinary demographic history. Demography 48(4): 1231-1262. doi:10.1007/s13524-011-0070-z.
Lazear, E.P. (1999). Culture and language. Journal of Political Economy 107(S6): S95-S126. doi:10.1086/250105.
Le Bras, H. (2008). The nature of demography. New Jersey: Princeton University Press.
Lee, R.D. (2001). Demography abandons its core. Remarks made at panel discussion on Micro-Macro Issues at the annual meetings of the Population Association of America in 2001.
Lipset, S.M. (1994). The state of American sociology. Sociological Forum 9(2): 199-220.
Lutz, W., Skirbekk, V., and Testa, M.R. (2006). The low-fertility trap hypothesis: Forces that may lead to further postponement and fewer births. Vienna Yearbook of Population Research 167-192.
Malthus, T.R. (1798). An essay on the principle of population. Middlesex: Penguin Books.
McIntosh, C.A. (1983). Population policy in Western Europe – Responses to low fertility in France, Sweden and West Germany. New York: M.E. Sharpe, Inc.
McNicoll, G. (1992). The agenda of population studies: A commentary and complaint. Population and Development Review 18(3): 399- 420. doi:10.2307/1973652.
Demographic Research: Volume 26, Article 16
http://www.demographic-research.org 403
McNicoll, G. (2007). Taking stock of population studies: A review essay. Population and Development Review 33(3): 607-615.
Morgan, S.P. and Lynch, S. (2001). Success and future of demography. Annals of the New York Academy of Sciences 954: 35-51. doi:10.1111/j.1749-6632.2001. tb02745.x.
Morgan, T. (1995). Theory versus empiricism in academic economics. Challenge 38(6): 46-51.
Ní Bhrolcháin, M. (2000). The education and professional experience of demographers: Results of an international survey. Southampton: University of Southampton (SSRC Applications and Policy Working Paper A03-11).
NIDI (2009). Demographers around the world [Internet survey]. The Hague: Netherlands Interdisciplinary Demographic Institute.
Ogden, P.E. and Huss, M.M. (1982). Demography and pronatalism in France in the nineteenth and twentieth centuries. Journal of Historical Geography 8(3): 283-298. doi:10.1016/0305-7488(82)90156-6.
Posner, R.A. (2001). Public intellectuals - A study of decline. Cambridge, MA: Harvard University Press.
Preston, S.H. (1993). The contours of demography: Estimates and projections. Demography 30(4): 593-606. doi:10.2307/2061808.
Reher, D.S. (2007). Towards long-term population decline: A discussion of relevant issues. European Journal of Population 23(2): 189-207. doi:10.1007/s10680-007-9120-z.
Schindlmayr, T. (2004). Explicating donor trends for population assistance. Population Research and Policy Review 23(1): 25-54. doi:10.1023/B:POPU.00000 19914.38253.5a.
Solomon, M. (2008). Norms of dissent. [working paper]. London: London School of Economics.
Stark, L. and Kohler, H.-P. (2002). The debate over low fertility in the popular press: A cross national comparison, 1998-1999. Population Research and Policy Review 21(6): 535-574. doi:10.1023/A:1022990205200.
Szreter, S. (1993). The idea of demographic transition and the study of fertility: A critical intellectual history. Population and Development Review 19(4): 659-701. doi:10.2307/2938410.
van Dalen & Henkens: What is on a demographer’s mind? A worldwide survey
404 http://www.demographic-research.org
Tabutin, D. (2007). Whither demography? Strengths and weaknesses of the discipline over fifty years of change. Population 62(1): 15-32. doi:10.3917/pope.701.0015.
Tastle, W.J. and Wierman, M.J. (2006). An information theoretic measure for the evaluation of ordinal scale data. Behavior Research Methods 38 (3): 487-494. doi:10.3758/BF03192803.
Teitelbaum, M.S. and Winter, J.M. (1985). The fear of population decline. New York: Academic Press.
Teitelbaum, M.S. and Winter, J.M. (1998). A question of numbers – High migration, low fertility and the politics of national identity. New York: Hill & Wang.
Tetlock, P.E. (2005). Expert political judgement. Princeton, NJ: Princeton University Press.
Van Dalen, H.P. and Henkens, K. (1999). How influential are demography journals? Population and Development Review 25(2): 229-251. doi:10.1111/j.1728-4457. 1999.00229.x.
Van Dalen, H.P. and Henkens, K. (2001). What makes a scientific article influential? The case of demographers. Scientometrics 50(3): 455-482. doi:10.1023/A:1010 510831718.
Van Dalen, H.P. and Henkens, K. (2004). Demographers and their journals: Who is uncited after ten years? Population and Development Review 30(3): 489-506. doi:10.1111/j.1728-4457.2004.00025.x.
Van Dalen, H.P. and Henkens, K. (2005). Signals in science - On the importance of signaling in gaining attention in science. Scientometrics 64(2): 209-233. doi:10.1007/s11192-005-0248-5.
Van Dalen, H.P. and Henkens, K. (2012). Intended and unintended consequences of a publish-or-perish culture: A worldwide survey. Journal of the American Society for Information Science and Technology. Article first published online: 20 April 2012. doi:10.1002/asi.22636.
Van de Kaa, D. (1991). Emerging issues in demographic research for contemporary Europe. Population Studies Supplement 45(S1): 189-206.
Vaupel, J.W., Manton, K.G., and Stallard, E. (1979). Impact of heterogeneity in individual frailty on the dynamics of mortality. Demography 16(3): 439-454. doi:10.2307/2061224.

Demographic Research: Volume 26, Article 16
http://www.demographic-research.org 405
Whaples, R. (2009). The policy views of American Economic Association members: The results of a new survey. Econ Journal Watch 6(3): 337-348.

van Dalen & Henkens: What is on a demographer’s mind? A worldwide survey
406 http://www.demographic-research.org
Appendix
Table A1: Sample characteristics of respondents of the survey and IUSSP members
IUSSP membersa Respondents survey
Sex Male 61% 64%
Female 39% 36%
Age (in years) 52 48
Region of residence Africa 15% 16%
Asia 22% 27%
Europe 27% 25%
North America 23% 20%
Oceania 3% 3%
South America 10% 9%
Place of workb
University 76%b 50%
Research institute - 25%
Government agency 12% 11%
NGO 8% 9%
Private sector (excl. NGO) 4% 5%
(a) The IUSSP only presented at the time socio-demographic characteristics as place of residence and age for the full members
and not for student members. (b) Calculated from the 2010 IUSSP Membership Survey (IUSSP, 2010) for the categories comparable to our survey. The
membership survey presented university and research institute as one joint category

Demographic Research: Volume 26, Article 16
http://www.demographic-research.org 407
Table A2: Perceptions of success in demography and economics among PhD students (in percentages)a
PhDs Demography PhDs Economicsb
Unimportant Very important Unimportant Very
important Being good at empirical research 2 74 12 30 Knowing population or economic facts 3 64 51 9 Broad knowledge of the scientific literature
4 57 35 11
Ability to make connections with prominent scholars
13 50 19 33
Being good at solving mathematical puzzles
15 38 7 51
Being highly specialized 18 33 15 35 Excellence in mathematics 20 15 14 30
(a) Question posed: Which characteristics will most likely place a population scientist on the fast track in their field? (Note: we are not asking which characteristics should place them at the forefront.) (b) Data for economists are from Colander (2007: 25). Source: NIDI (2009)
Table A3: Top 5 of respected demographers across regions (between brackets the number of votes)a
Asia/Oceania Africa South America Europe North America For demography as a science 1. Bongaarts (74) Caldwell (52) Brass (23) Bongaarts (32) Coale (45) 2 Caldwell (67) Bongaarts (34) Malthus (14) Caldwell (31) Preston (31) 3 Malthus (39) Brass (33) Preston (14) Coale (29) Bongaarts (28) 4 Coale (35) Malthus (22) Caldwell (12) Malthus (27) Caldwell (28) 5 Brass (22) Coale (14) Coale (12) Sauvy (21) Keyfitz (23) For own research/work 1. Caldwell (51) Caldwell, J. (35) Brass (18) Henry (23) Bongaarts (23) 2 Bongaarts (45) Bongaarts (32) Bongaarts (9) Livi Bacci (18) Caldwell (22) 3 Coale (19) Brass (22) Livi Bacci (8) Lesthaeghe (17) Coale (15) 4 Preston (12) Caldwell, P. (12) Becker (7) Caldwell (16) Davis (13) 5 Davis (11) Boserup (9) Caldwell (7) Bongaarts (15) Preston (10) N = 195 117 65 171 137
(a) In case two scholars receive an equal number of votes in the three options to name a scholar, the author with the most votes as
a first mention is placed higher.
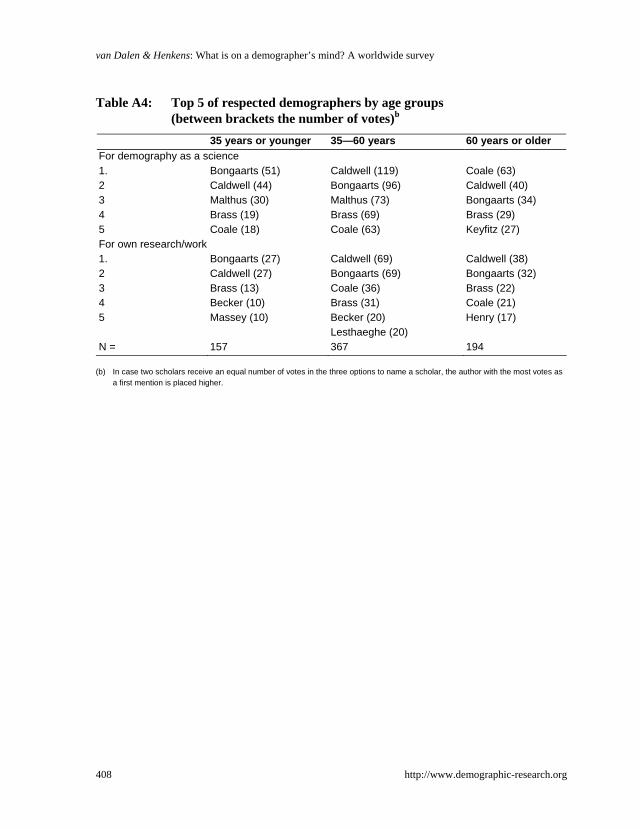
van Dalen & Henkens: What is on a demographer’s mind? A worldwide survey
408 http://www.demographic-research.org
Table A4: Top 5 of respected demographers by age groups (between brackets the number of votes)b
35 years or younger 35—60 years 60 years or older For demography as a science 1. Bongaarts (51) Caldwell (119) Coale (63) 2 Caldwell (44) Bongaarts (96) Caldwell (40) 3 Malthus (30) Malthus (73) Bongaarts (34) 4 Brass (19) Brass (69) Brass (29) 5 Coale (18) Coale (63) Keyfitz (27) For own research/work 1. Bongaarts (27) Caldwell (69) Caldwell (38) 2 Caldwell (27) Bongaarts (69) Bongaarts (32) 3 Brass (13) Coale (36) Brass (22) 4 Becker (10) Brass (31) Coale (21) 5 Massey (10) Becker (20) Henry (17) Lesthaeghe (20) N = 157 367 194
(b) In case two scholars receive an equal number of votes in the three options to name a scholar, the author with the most votes as
a first mention is placed higher.