what is the biological function of uric acid? an antioxidant for...
TRANSCRIPT
Research ArticleWhat Is the Biological Function of Uric Acid? An Antioxidant forNeural Protection or a Biomarker for Cell Death
Dequan Liu,1 Yu Yun,1,2 Dechun Yang,1 Xinyu Hu,1 Xianxiang Dong,1 Nan Zhang,1
Lumei Zhang,2 Hua Yin,2 and Weigang Duan 2
1The Third Affiliated Hospital and School of Basic Medicine, Kunming Medical University, Kunming 650500, China2Key Laboratory of Molecular Biology for Sinomedicine, Yunnan University of Traditional Chinese Medicine,Kunming 650500, China
Correspondence should be addressed to Weigang Duan; [email protected]
Received 22 May 2018; Accepted 18 December 2018; Published 10 January 2019
Academic Editor: Olav Lapaire
Copyright © 2019 Dequan Liu et al. This is an open access article distributed under the Creative Commons Attribution License,which permits unrestricted use, distribution, and reproduction in any medium, provided the original work is properly cited.
The main aim of the present study was to investigate the biological function of uric acid. The level of uric acid in different organs innormal male rats was determined with uric acid assay kits, and the expression level of genes in the organs was determined by RNAquantitative sequencing. The correlation analysis between uric acid in the organs and gene expression (measured by FPKM value)was made. Serum uric acid (SUA) in patients with breast cancer or with breast benign tumor was assayed when the diagnosis wasmade, and SUA in patients with breast cancer was also assayed just after chemotherapy. There were 1937 mRNAs whose expressionlevel significantly correlated with the level of uric acid, and most of which were associated with purine or nucleoside metabolism,cellular metabolism, cell cycles, and cell death pathways. Further analysis showed that the level of uric acid was highly correlatedwith cell death rather than cell viability. The level of SUA in patients with breast cancer was higher than that in patients withbreast benign tumor, and the SUA increased after chemotherapy. All the results suggested that uric acid was mainly synthesizedfrom local nucleosides degraded from dead cells, and uric acid could be an important biomarker for cell death rather than anantioxidant for neural protection.
1. Introduction
Hyperuricemia is an old topic in the field of metabolicdisorders and a common fundamental disease for gout, renaldysfunction, and other cardiovascular diseases [1]. Thedisease is attracting more and more eyes of biologists andmedical scientists because of the high morbidity and eco-nomic burden [2]. Hyperuricemia has a male dominanceand can be diagnosed by the level of serum uric acid (SUA)above 420μM (70μg/ml) [2].
The direction cause of hyperuricemia is the accumulationof uric acid in the body. Uric acid is the final product ofpurine nucleoside metabolism, synthesized by xanthinedehydrogenase (Xdh) in humans though it can be furthertransformed into allantoin by uricase (Uox) in other animalsexcept some birds and reptiles [3]. Uric acid can be found incells, tissues, and organs, and the level of uric acid is different
from organ to organ. It was supposed that the liver was themost important organ to generate uric acid [4, 5], butstrangely, not the organ with the highest level of uric acid[6]. The dominant source of uric acid (about 2/3 or more)is generated from endogenous purines, and the rest fromthe exogenous [4]. It is certain that two-thirds or more uricacid is excreted through the kidney, and the rest throughfeces [4]. Although there were systematic data about thedistribution of uric acid in rats [6], the significance of uricacid in different organs was poorly understood.
It was believed that uric acid was a metabolic waste ofnucleosides just like urea for proteins, since there was almostno functional disturbance if the level of serum uric acid waslowered deeply by Uox, say rasburicase [7]. However, somereports declared that uric acid played roles in some physio-logic functions and should not be eliminated thoroughly[8, 9]. Due to its antioxidant activity, uric acid was thought
HindawiDisease MarkersVolume 2019, Article ID 4081962, 9 pageshttps://doi.org/10.1155/2019/4081962

to protect neuronal cells, consequently facilitating brainevolution or development [8, 10, 11], and also play a role inmaintaining the blood pressure [8]. However, the antioxidantactivity of uric acid is not powerful than either hydrophilicvitamin C or hydrophobic vitamin E according to its chemi-cal structure. The effects resulted from the antioxidantactivity can be easily substituted by intake of the two vitamins[12, 13] and other foods containing reducing chemicals [14].Therefore, its antioxidant activity is not as important aspreviously supposed. So, the function of uric acid in theorgans is still unclear. In the present study, uric acid in differ-ent rat organs and their mRNA expression level would bedetermined, and the relationship between them would beanalyzed to find its function.
2. Materials and Methods
2.1. Materials. Male Sprague-Dawley (SD) rats aged 2months and weighing 180-220 g were obtained fromKunming Medical University, Kunming, China. Rats werehoused at 22°C temperature, at 45-55% humidity-controlledconditions, and under natural light. Clinical data were col-lected from the Third Affiliated Hospital, Kunming MedicalUniversity. This project was approved by the ExperimentalAnimal Committee of Kunming Medical University and theMedical Ethics Committee of Kunming Medical University.
Uric acid was purchased from Tokyo Into Industrial Co.Ltd. (Tokyo, Japan). Uric acid assay kits of the phosphotung-stic acid method and protein assay kits of the BCA (bicinch-oninic acid) method were purchased fromNanjing JianchengBioengineering Institute (Nanjing, China). TRIzol PlusRNA Purification Kit was purchased from Invitrogen(Carlsbad, CA, USA). Ultrapure water was obtained fromthe Milli-Q water purification system manufactured by theEMD Millipore Group (Darmstadt, Germany). The Nano-Drop ND-1000 spectrophotometer was manufactured byPeqLab, Erlangen, Germany. The multimicroplate readerof Infinite 200 PRO was manufactured by Tecan Group(Männedorf, Switzerland). Other instruments or reagentsused in the present study were made in China.
2.2. Animal Treatment and Uric Acid Assay. Animal treat-ment followed the methods of Yun et al. [6]. Briefly, SD ratswere fasted for 36 h before sacrificing. The rats were intra-peritoneally anaesthetized with urethane (1.0 g/kg). Theabdomen of the rat was opened, blood samples weredrawn via the abdominal aorta, and organs including theliver, spleen, lung, bladder, pancreas, kidney, testicle, brain,heart, ectogluteus, duodenum (5 cm), and the last 5 cm ofthe ileum were harvested. The intestinal tract was openedand the inner wall was cleaned with a cotton swab andwas rinsed with 1ml normal saline twice. The sample ofthe organs was frozen at -40°C for use or homogenizedon ice immediately.
The concentration of uric acid (μg/ml) in the serumsamples and the supernatant of the tissue homogenate wasassayed with uric acid assay kits according to the standardoperation procedure (SOP) provided by the manufacturer.
The protein in all the samples was assayed with proteinassay kits.
2.3. mRNA Quantitative Sequencing. After the organs of therats including the brain, kidney, lung, liver, heart, stomach,duodenum, and terminal ileum were harvested, about200mg tissue was sampled. The sample was frozen withliquid nitrogen and ground to powder. The total RNA inthe powder was extracted and purified by TRIzol Plus RNAPurification Kit. RNA quantity and quality were measuredby the NanoDrop ND-1000 spectrophotometer. RNAintegrity was assessed by standard denaturing agarose gelelectrophoresis [15, 16].
Double-stranded cDNA (ds-cDNA) was synthesizedfrom the total RNA using an Invitrogen SuperScriptds-cDNA synthesis kit in the presence of 100 pmol/l oligodT primers. The cDNA was sequenced by Sangon Biotech(Shanghai, China). The expected value of FPKM (fragmentsper kilobase of transcript sequence per million base pairssequenced) was used for expression normalization [17, 18].The relationship analysis of the FPKM value of a genebetween different organs and the pathway analysis associatedwith related genes [15] were also made by Sangon Biotech.
2.4. Clinical Data. Clinical data including 203 cases of breastcancer (aged 24-80) and 100 cases of benign breast tumor(aged 28-61) were provided by the Third Affiliated Hospital,Kunming Medical University. All the cases were from femalepatients and confirmed by pathological diagnosis. Cases withsevere hepatic and renal dysfunction or complicated withother tumors were excluded. SUA was assayed with uric acidassay kits of uricase methods, and the Ki67 antigen in cancertissue was assayed with ELISA kits by the clinical laboratoryof the hospital.
2.5. Statistical Analysis. Values were expressed as mean ± SD(standard deviation). Student’s t-test was performed to com-pare means between different groups. Bivariate correlationsof Pearson’s method (two-tailed) were performed to findthe relationship between the level of uric acid and the FPKMvalues of the organs. Statistical significance was acceptedat P < 0 05.
3. Results
3.1. Distribution of Uric Acid in Different Organs in NormalRats. The distribution of uric acid in different organs wasshowed in Figure 1. The organ with the highest level ofuric acid was the duodenum, then the ileum and liver,belonging to the alimentary system [6] and suggested thatthe alimentary system was a dominant place for uric aciddistribution.
In neonatal rats (less than 2 hours after birth), uricacid in the intestinal tract was similar to that in normalrats. However, uric acid in the heart and liver, unlike thatin normal rats, was very low, different from that in normalrats (Figure 2).
3.2. Relationship between the Level of Uric Acid and Pathwaysin Different Organs. The results of mRNA quantitative
2 Disease Markers

sequencing showed that there were 32,662mRNAs sequencedin every organ. The correlation between uric acid and theFPKM value was performed to find the relationship. SincemRNAs with multiple zero values of FPKM were unsuitableto perform correlation analysis, only 7604 mRNAs weretaken into account, and 1937 mRNAs with a P value below0.05 were selected. The pathways they could be involved inwere also analyzed; 56 pathways with significance (P < 0 05)were screened out (Table S1), and the top 20 were showedin Table 1. Most pathways were associated with purine ornucleoside metabolism, cellular metabolism, cell cycles, andcell death.
3.3. Relationship between the Level of Uric Acid and GeneExpression in Different Organs. Uric acid is directly pro-duced from xanthine by Xdh, while Ada (adenosine deami-nase) is an important assistant to the kinase [19]. Their
expression levels were both upregulated in organs where uricacid was high [6, 19]. However, as for Uox, there was nosignificant correlation between its expression level and uricacid (Table 2).
ATP is generated mainly by the Krebs cycle in themitochondria and is a key fuel to drive cellular function.ATP is a polar molecule with negative charges, unlikelyprovided by neighbor cells or cells faraway. The increaseof ATP will be associated with the upregulation of ATPsynthase. However, there was no significant correlationbetween the level of uric acid and ATP synthase expres-sion, though ATPases were upregulated in the brain andheart (both of Atpaf1 and Atpaf2, Table 3). On the otherhand, Na+-K+-ATPase, a key enzyme concluding 8 subunitsto maintain cellular polarization, is highly associated with cellviability; only one of the subunits was merely, but negatively,correlated with the level of uric acid (Table 3).
The main way of physiological cell death is regulated celldeath (RCD); among which, caspase 3 (Casp3) is an executorto directly cause cell death [20, 21]. Of course, there was agood correlation between the level of uric acid and theenzyme (Table 3).
MKi67 is a cell cycle and tumor growth marker present-ing only in the nuclei of cycling cells and upregulated incycling cells [22, 23]. In Table 3, there was also a good corre-lation between the expression level of MKi67 and the level ofuric acid, though the correlation coefficient (R = 0 7768) wassmaller than that of Casp3 (R = 0 9045).
3.4. SUA in Breast Cancer. Figure 3(a) shows that the level ofSUA in patients with breast cancer was higher than that inpatients with benign breast tumor. Ki67 is a factor for tumorgrowth in human [22, 23]. However, there was no correlationbetween the level of SUA and Ki67 (Figure S1) in the patientswith breast cancer. The patients that suffered with breast
0
Duo
denu
mIle
umLi
ver
Sple
enCo
lon
Lung
Blad
der
Stom
ach
Panc
reas
Kidn
eyTe
sticl
eBr
ain
Bloo
dH
eart
Skel
etal
mus
cle
Seru
m
200
400
600
800
1000
1200
1400
1600U
ric ac
id (�휇
g/g
tissu
e)
(a)
Duo
denu
mIle
umLi
ver
Sple
enCo
lon
Lung
Blad
der
Stom
ach
Panc
reas
Kidn
eyTe
sticl
eBr
ain
Bloo
dH
eart
Skel
etal
mus
cle
Seru
m
0
5
10
15
20
25
Uric
acid
(�휇g/
mg
prot
ein)
(b)
Figure 1: Distribution of uric acid in male rat’s organs (mean + SD, n = 10, data cited from our previous study [6]). Ileum: the last 5 cm of theileum; skeletal muscle: the ectogluteus.
0
600
1200
1800
Up- Mid- End-intestinal tract
Liver Heart
Uric
acid
(�휇g/
g tis
sue)
Figure 2: Distribution of uric acid in neonatal rats (mean + SD,n = 3).
3Disease Markers

cancer were treated with chemotherapeutics, and when atreatment course was ended, the level of SUA increased tosome extent (Figure 3(b)).
4. Discussion
The function of uric acid in the body was a hot topic. Somestudies believe that uric acid might play some roles in physi-ological activities, like to protect neurons from oxidativedamage and to maintain blood pressure [8, 24]. However,there was an opposite opinion that regarded the metabolitejust as a waste [25, 26].
4.1. Uric Acid Synthesized from Local Degraded Nucleosides.In all the organs the present study involved, the expressionlevel of Xdh was highly correlated with the level of uric acid(Table 1), and so was Ada, an enzyme indirectly associatedwith uric acid synthesis. The results suggested that uric acidwas locally synthesized from the degraded nucleosides. Asfor the urate destroyer, Uox was highly expressed only in
the liver (Table 1). The results suggested that uric acidwas almost a final product of purines in the extrahepaticorgans in rats and can be transported to the liver forfurther degradation.
4.2. Uric Acid Unlikely to Play an Important Role to ProtectNeurons or Maintain Blood Pressure. Neurons predomi-nantly distribute in the brain. According to the knownunderstandings, the rat brain is about 0.4 percent of the bodyweight but consumes 10-20 percent of the cardiac output.Because the brain has to consume massive oxygen to main-tain its complicated function, genes directly associated withATP synthesis should be expressed at a high level. Unsurpris-ingly, the expression level of the genes was overall higherthan that in other organs (Table 3). Theoretically, in theprocess of biological oxidation, many oxygen radicals willbe also generated and then could damage neurons. Basedon knowledge, some reports even deduced that uric acidplayed a role in neuroprotection [8] and Uox deficiency, afactor facilitating uric acid increase, was considered as a big
Table 1: Top 20 pathways with significance could be associated with the level of uric acid in different organs.
ID Description Significant Annotated P value Q value Positive num. Negative num.
ko03010 Ribosome 184/1937 288/7604 1.26E-44 3.37E-42 172 12
ko04141 Protein processing in the endoplasmic reticulum 89/1937 172/7604 8.09E-14 1.09E-11 62 27
ko00240 Pyrimidine metabolism 50/1937 106/7604 9.93E-07 8.89E-05 36 14
ko04975 Fat digestion and absorption 24/1937 39/7604 1.99E-06 0.000134 21 3
ko00520 Amino sugar and nucleotide sugar metabolism 27/1937 49/7604 8.96E-06 0.000481 19 8
ko05110 Vibrio cholerae infection 28/1937 52/7604 1.11E-05 0.000494 14 14
ko00230 Purine metabolism 68/1937 170/7604 1.88E-05 0.000721 38 30
ko00480 Glutathione metabolism 28/1937 54/7604 2.80E-05 0.000941 21 7
ko00983 Drug metabolism (other enzymes) 22/1937 39/7604 3.73E-05 0.001011 19 3
ko03460 Fanconi anemia pathway 27/1937 52/7604 3.77E-05 0.001011 18 9
ko03008 Ribosome biogenesis in eukaryotes 37/1937 81/7604 5.99E-05 0.001462 25 12
ko00620 Pyruvate metabolism 23/1937 43/7604 7.72E-05 0.001727 10 13
ko00330 Arginine and proline metabolism 28/1937 59/7604 0.000209 0.004278 17 11
ko00500 Starch and sucrose metabolism 21/1937 40/7604 0.000223 0.004278 12 9
ko03030 DNA replication 20/1937 38/7604 0.000301 0.00538 16 4
ko00900 Terpenoid backbone biosynthesis 14/1937 23/7604 0.000342 0.005742 10 4
ko00561 Glycerolipid metabolism 26/1937 56/7604 0.000534 0.008435 19 7
ko04972 Pancreatic secretion 40/1937 98/7604 0.000587 0.008748 33 7
ko04113 Meiosis (yeast) 26/1937 59/7604 0.001403 0.019819 19 7
ko04111 Cell cycle (yeast) 29/1937 70/7604 0.002443 0.032791 24 5
ko00970 Aminoacyl-tRNA biosynthesis 21/1937 47/7604 0.003207 0.03985 12 9
ko00510 N-Glycan biosynthesis 22/1937 50/7604 0.003266 0.03985 19 3
ko02020 Two-component system 10/1937 17/7604 0.003564 0.041593 6 4
ko04110 Cell cycle 45/1937 123/7604 0.003905 0.043679 42 3
ko04210 Apoptosis 33/1937 85/7604 0.004440 0.045337 21 12
ko03440 Homologous recombination 14/1937 28/7604 0.004476 0.045337 10 4
ko00100 Steroid biosynthesis 11/1937 20/7604 0.004560 0.045337 11 0
ko04910 Insulin signaling pathway 48/1937 134/7604 0.004738 0.045421 19 29
ko00564 Glycerophospholipid metabolism 35/1937 92/7604 0.005061 0.046841 23 12
ko03060 Protein export 12/1937 23/7604 0.005410 0.048403 8 4
4 Disease Markers

Table2:FP
KM
ofgenesmainlyassociated
withuratemetabolism
anditscorrelationwiththelevelo
furicacid
indifferentratorgans
(mean±
SD,n
=3).
Gene
Brain
Kidney
Lung
Liver
Heart
Stom
ach
Duo
denu
mTerminalileum
RP
Xdh
257±
019
3545
±379
6610
±11
0132
08±173
2676
±13
9018
94±588
2818
8±15
5989
74±14
300.9279
6.776E
-11
Ada
162±
085
959
±200
1959
±484
315
±061
783
±017
468
±110
1471
86±7033
52253
3±75
400.8874
3.79E-08
Uox
014
±015
003
±006
009
±008
3845
8±79
500±
0008
±0 0
700
2±00
30084±
007
0.1128
0.5999
5Disease Markers
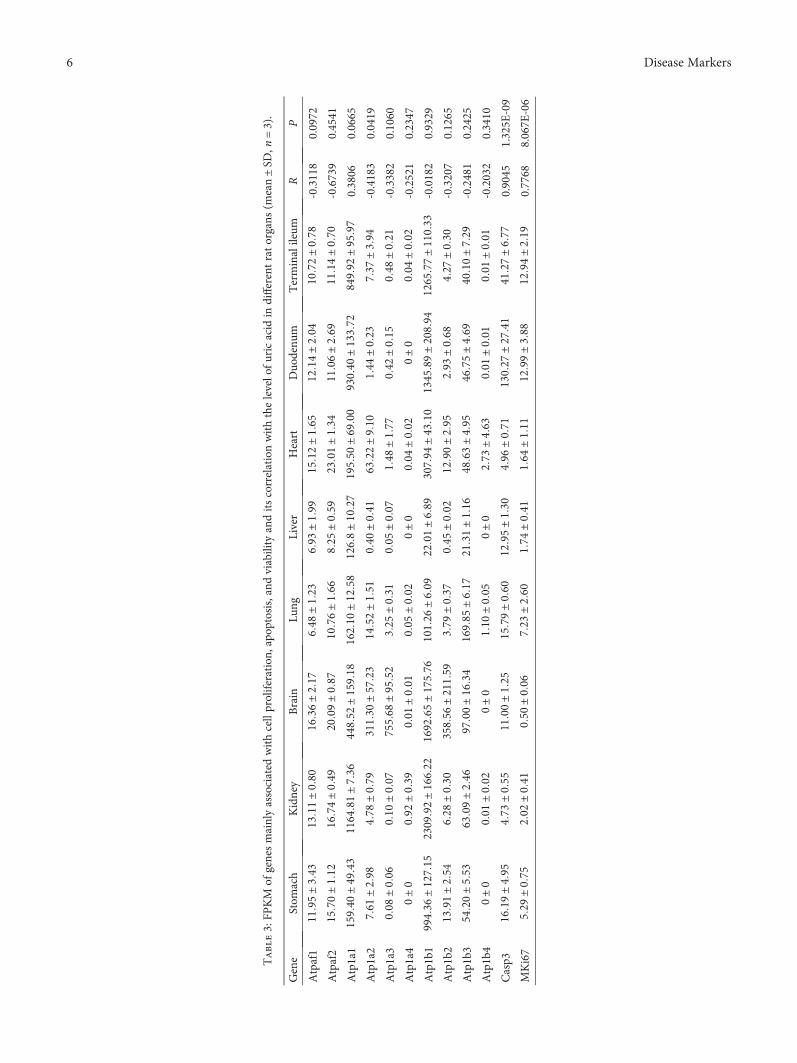
Table3:FP
KM
ofgenesmainlyassociated
withcellproliferation
,apo
ptosis,and
viability
anditscorrelationwiththelevelo
furicacid
indifferentratorgans
(mean±
SD,n
=3).
Gene
Stom
ach
Kidney
Brain
Lung
Liver
Heart
Duo
denu
mTerminalileum
RP
Atpaf1
1195
±343
1311
±080
1636
±217
648
±123
693
±199
1512
±165
1214
±204
1072
±078
-0.3118
0.0972
Atpaf2
1570
±112
1674
±049
2009
±087
1076
±166
825
±059
2301
±134
1106
±269
1114
±070
-0.6739
0.4541
Atp1a1
1594
0±49
431164
81±736
4485
2±1591
81621
0±12
581268
±10
271955
0±69
009304
0±1337
28499
2±95
970.3806
0.0665
Atp1a2
761
±298
478
±079
3113
0±57
2314
52±151
040
±041
6322
±910
144
±023
737
±394
-0.4183
0.0419
Atp1a3
008±
006
010
±007
7556
8±95
52325
±031
005
±007
148
±177
042
±015
048
±021
-0.3382
0.1060
Atp1a4
0±0
092±
039
001
±001
005
±002
0±0
004
±00
20±
0004
±002
-0.2521
0.2347
Atp1b1
9943
6±1271
52309
92±1662
21692
65±1757
61012
6±609
2201
±689
3079
4±43
101345
89±2089
41265
77±1103
3-0.0182
0.9329
Atp1b2
1391
±254
628
±030
3585
6±2115
9379
±037
045
±002
1290
±295
293
±068
427
±030
-0.3207
0.1265
Atp1b3
5420
±553
6309
±246
9700
±16
341698
5±617
2131
±116
4863
±49
546
75±469
4010
±729
-0.2481
0.2425
Atp1b4
0±0
001
±002
0±0
110
±005
0±0
273
±463
001
±001
001
±001
-0.2032
0.3410
Casp3
1619
±495
473
±055
1100
±125
1579
±060
1295
±130
496
±071
1302
7±27
4141
27±677
0.9045
1.325E
-09
MKi67
529
±075
202
±041
050
±006
723
±260
174
±041
164
±111
1299
±388
1294
±21
90.7768
8.067E
-06
6 Disease Markers

step for human brain evolution and development [10, 11].However, Uox deficiency is a common phenomenon in loweranimals like birds and reptiles [3]. On the other hand, theheart is the second organ with a high level of energy metabo-lism. Unfortunately, the level of uric acid in the organ wasalso low (Figure 1). Similarly, the duodenum was the organwith the highest level of uric acid, but there were no reportsthat believed that the intestinal tract was an organ with highenergy consumption. Therefore, the present study provedthat uric acid was unlikely to play an important role inprotecting neurons by quenching oxygen radicals, at least ina physiological state, though it is a real reductive substance.
Epidemic data suggested that hyperuricemia highlycorrelated with hypertension [27]. However, the relationshipbetween uric acid and blood pressure was concomitant ratherthan causal. Both diseases are age-dependent, and therewere rare concrete experimental evidences supporting thehypothesis that hyperuricemia could result in hypertensionand vice versa. Further, there were almost no clues in uricacid-lowering drugs associated with blood pressure lowering[7]. From the analysis, uric acid was unlikely to play animportant role in maintaining blood pressure either.
4.3. Uric Acid Was an Indicator for Cell Death. Uric acid wasa metabolite from purines, while purines in the body camemainly from endogenously degraded nucleosides and partlyfrom diet. Nucleosides might come from used DNA orRNA. A cell in a vigorous metabolism state needs manymRNAs to synthesize protein, and the used mRNAs will bedegraded. Then, a part of them will be recycled to synthesizenew mRNAs and a part will be transformed to uric acid.However, when a cell dies, the whole nucleus where abun-dant DNAs are located, along with the RNA in the cyto-plasm, could be degraded, and many of which would betransformed to uric acid rather than recycled. Since thenucleus contains even more amount of nucleotides than the
cytoplasm, a dead cell would result in more uric acid. Bycontrast with the yield of nucleosides from the nucleus, theyield of nucleosides from the cytoplasm meant nothing. So,there was no significant correlation between uric acid andenergy metabolism. RCD is the main physiological way of celldeath, and Casp3 is the main executor for RCD pathways[21]. Since uric acid in an organ was highly correlated tothe expression level of the gene (Table 3), the resultssupported that uric acid was mainly resulted from dead cells.However, in a physiological state, dead cells are oftenreplaced by regenerated cells, a process which is associatedwith Ki67 activation, an important nuclear protein [22, 23].Results in Table 3 supported the deduction but with a smallerR value than Casp3. Since cell proliferation in the heart andliver was the main process in neonatal rats, there could bealmost no cell death in the two neonatal organs (Figure 2).However, the intestinal tract both in neonatal rats andnormal rats might be associated with many cell deaths andregeneration to remodel itself (Figures 1 and 2).
In the clinic, advanced cancer growth often couples withtumor cell death, and so does breast cancer. The degradednucleosides in the dead tumor cells would be transformedinto uric acid and caused an SUA increase (Figure 3(a)).Surprisingly, there was no significant correlation betweenKi67 and SUA in patients with breast cancer but with a veryslight tendency (P > 0 05, Figure S1). This phenomenon wasdifferent from that in normal rats. The reason might beassociated with cell death inducing cell regeneration innormal rats, while tumor cell proliferation resulting in cellnecrosis in patients with cancer. When breast cancer istreated with chemotherapeutics, many tumor cells would bekilled. The nucleosides in the cells would be transformedinto uric acid and caused an SUA increase (Figure 3(b)).Indeed, an SUA increase, including hyperuricemia and evengout, was widely regarded as an important marker fortumor lysis syndrome (TLS) [7, 28].
⁎
0
100
200
300
400
500
600
BenignMalignant
Seru
m u
ric ac
id (�휇
M)
(a)
⁎
0
100
200
300
400
500
600
Before chemotherapyAfter chemotherapy
Seru
m u
ric ac
id (�휇
M)
(b)
Figure 3: Serum uric acid (SUA) in patients with breast tumors (mean ± SD). The level of SUA before treatment in patients with malignantbreast tumor (breast cancer) was higher than that in patients with benign breast tumor. (a) Benign group (n = 100) and malignant group(n = 203), P ≤ 0 001, independent samples t-test. When patients with breast cancer are treated with chemotherapeutics, the level of SUAfurther increased. (b) n = 203, P ≤ 0 001, paired t-test.
7Disease Markers
5. Conclusion
In summary, the dead cell was the main source for degradednucleosides, and purines from the nucleosides would betransformed into uric acid locally. The uric acid would betransported to the blood and eventually would be excretedthrough the kidney or intestinal tract or deposited locally tocause tissue damage. The level of uric acid can be used as areliable, though not sensitive sometimes, marker to evaluatecell death.
Data Availability
The data used to support the findings of this study areavailable from the corresponding author upon request.
Conflicts of Interest
The authors declare that they have no conflicts of interest.
Authors’ Contributions
Dequan Liu and Yu Yun contributed equally to this work.
Acknowledgments
This work was supported by the Foundation for ScientificResearch provided by the Yunnan Province EducationDepartment (2018JS153) and by the National NaturalScience Foundation of China (81860162).
Supplementary Materials
Table S1: pathways with significance associated with the levelof uric acid in different organs (n = 3). Figure S1: the relation-ship between SUA and Ki67 in patients with breast cancer(n = 203). (Supplementary Materials)
References
[1] M. C. Cleophas, L. A. Joosten, L. K. Stamp, N. Dalbeth, O. M.Woodward, and T. R. Merriman, “ABCG2 polymorphismsin gout: insights into disease susceptibility and treatmentapproaches,” Pharmacogenomics and Personalized Medicine,vol. 10, pp. 129–142, 2017.
[2] K. H. Yu, D. Y. Chen, J. H. Chen et al., “Management of goutand hyperuricemia: multidisciplinary consensus in Taiwan,”International Journal of Rheumatic Diseases, vol. 21, no. 4,pp. 772–787, 2018.
[3] A. C. Keebaugh and J. W. Thomas, “The evolutionary fate ofthe genes encoding the purine catabolic enzymes in homi-noids, birds, and reptiles,” Molecular Biology and Evolution,vol. 27, no. 6, pp. 1359–1369, 2010.
[4] A. Basseville and S. Bates, “Gout, genetics and ABC trans-porters,” F1000 Biology Reports, vol. 3, p. 23, 2011.
[5] J. Maiuolo, F. Oppedisano, S. Gratteri, C. Muscoli, andV. Mollace, “Regulation of uric acid metabolism andexcretion,” International Journal of Cardiology, vol. 213,pp. 8–14, 2016.
[6] Y. Yun, H. Yin, Z. Gao et al., “Intestinal tract is an importantorgan for lowering serum uric acid in rats,” PLoS One,vol. 12, no. 12, article e0190194, 2017.
[7] L. Cammalleri and M. Malaguarnera, “Rasburicase representsa new tool for hyperuricemia in tumor lysis syndrome and ingout,” International Journal of Medical Sciences, vol. 4, no. 2,pp. 83–93, 2007.
[8] A. Hosomi, T. Nakanishi, T. Fujita, and I. Tamai, “Extra-renalelimination of uric acid via intestinal efflux transporterBCRP/ABCG2,” PLoS One, vol. 7, no. 2, article e30456, 2012.
[9] L. Góth, “The rasburicase therapy may cause hydrogenperoxide shock,” Orvosi Hetilap, vol. 149, no. 34, pp. 1587–1590, 2008.
[10] B. Alvarez-Lario and J. Macarron-Vicente, “Uric acid and evo-lution,” Rheumatology, vol. 49, no. 11, pp. 2010–2015, 2010.
[11] R. J. Johnson, S. Titte, J. R. Cade, B. A. Rideout, and W. J.Oliver, “Uric acid, evolution and primitive cultures,” Seminarsin Nephrology, vol. 25, no. 1, pp. 3–8, 2005.
[12] H. Tian, X. Ye, X. Hou, X. Yang, J. Yang, and C. Wu, “SVCT2,a potential therapeutic target, protects against oxidative stressduring ethanol-induced neurotoxicity via JNK/p38 MAPKs,NF-κB and miRNA125a-5p,” Free Radical Biology and Medi-cine, vol. 96, pp. 362–373, 2016.
[13] I. Zakharova, T. Sokolova, Y. Vlasova, L. Bayunova,M. Rychkova, and N. Avrova, “α-Tocopherol at nanomolarconcentration protects cortical neurons against oxidativestress,” International Journal of Molecular Sciences, vol. 18,no. 1, p. 216, 2017.
[14] V. Carito, M. Ceccanti, L. Tarani, G. Ferraguti, G. N.Chaldakov, and M. Fiore, “Neurotrophins’ modulation byolive polyphenols,” Current Medicinal Chemistry, vol. 23,no. 28, pp. 3189–3197, 2016.
[15] H. Yin, X. Hou, T. Tao, X. Lv, L. Zhang, and W. Duan,“Neurite outgrowth resistance to rho kinase inhibitors inPC12 Adh cell,” Cell Biology International, vol. 39, no. 5,pp. 563–576, 2015.
[16] H. Chen, G. Cao, D. Q. Chen et al., “Metabolomics insightsinto activated redox signaling and lipid metabolism dysfunc-tion in chronic kidney disease progression,” Redox Biology,vol. 10, pp. 168–178, 2016.
[17] C. Trapnell, B. A. Williams, G. Pertea et al., “Transcriptassembly and quantification by RNA-Seq reveals unannotatedtranscripts and isoform switching during cell differentiation,”Nature Biotechnology, vol. 28, no. 5, pp. 511–515, 2010.
[18] Y. Lin, J. Zhu, Y. Wang, Q. Li, and S. Lin, “Identification ofdifferentially expressed genes through RNA sequencing ingoats (Capra hircus) at different postnatal stages,” PLoS One,vol. 12, no. 8, article e0182602, 2017.
[19] K. A. Mohamedali, O. M. Guicherit, R. E. Kellems, andF. B. Rudolph, “The highest levels of purine catabolicenzymes in mice are present in the proximal small intes-tine,” Journal of Biological Chemistry, vol. 268, no. 31,pp. 23728–23733, 1993.
[20] S. Snigdha, E. D. Smith, G. A. Prieto, and C. W. Cotman,“Caspase-3 activation as a bifurcation point between plasticityand cell death,” Neuroscience Bulletin, vol. 28, no. 1, pp. 14–24, 2012.
[21] L. Galluzzi, I. Vitale, S. A. Aaronson et al., “Molecular mecha-nisms of cell death: recommendations of the NomenclatureCommittee on Cell Death 2018,” Cell Death & Differentiation,vol. 25, no. 3, pp. 486–541, 2018.
8 Disease Markers

[22] Y. Zhou, W. Hu, P. Chen et al., “Ki67 is a biological marker ofmalignant risk of gastrointestinal stromal tumors: a systematicreview and meta-analysis,” Medicine, vol. 96, no. 34, articlee7911, 2017.
[23] Z. Gerring, J. F. Pearson, H. R. Morrin, B. A. Robinson, G. C.Harris, and L. C. Walker, “Phosphohistone H3 outperformsKi67 as a marker of outcome for breast cancer patients,”Histo-pathology, vol. 67, no. 4, pp. 538–547, 2015.
[24] S. Watanabe, D. H. Kang, L. Feng et al., “Uric acid, hominoidevolution, and the pathogenesis of salt-sensitivity,” Hyperten-sion, vol. 40, no. 3, pp. 355–360, 2002.
[25] D. Hyndman, S. Liu, and J. N. Miner, “Urate handling in thehuman body,” Current Rheumatology Reports, vol. 18, no. 6,p. 34, 2016.
[26] A. B. Gutman, “Significance of uric acid as a nitrogenous wastein vertebrate evolution,” Arthritis & Rheumatism, vol. 8, no. 4,pp. 614–626, 1965.
[27] I. Mortada, “Hyperuricemia, type 2 diabetes mellitus, andhypertension: an emerging association,” Current HypertensionReports, vol. 19, no. 9, p. 69, 2017.
[28] A. Koratala, “Tumor lysis syndrome with massive hyperpho-sphatemia and hyperuricemia,” Clinical Case Reports, vol. 5,no. 12, pp. 2158-2159, 2017.
9Disease Markers

Stem Cells International
Hindawiwww.hindawi.com Volume 2018
Hindawiwww.hindawi.com Volume 2018
MEDIATORSINFLAMMATION
of
EndocrinologyInternational Journal of
Hindawiwww.hindawi.com Volume 2018
Hindawiwww.hindawi.com Volume 2018
Disease Markers
Hindawiwww.hindawi.com Volume 2018
BioMed Research International
OncologyJournal of
Hindawiwww.hindawi.com Volume 2013
Hindawiwww.hindawi.com Volume 2018
Oxidative Medicine and Cellular Longevity
Hindawiwww.hindawi.com Volume 2018
PPAR Research
Hindawi Publishing Corporation http://www.hindawi.com Volume 2013Hindawiwww.hindawi.com
The Scientific World Journal
Volume 2018
Immunology ResearchHindawiwww.hindawi.com Volume 2018
Journal of
ObesityJournal of
Hindawiwww.hindawi.com Volume 2018
Hindawiwww.hindawi.com Volume 2018
Computational and Mathematical Methods in Medicine
Hindawiwww.hindawi.com Volume 2018
Behavioural Neurology
OphthalmologyJournal of
Hindawiwww.hindawi.com Volume 2018
Diabetes ResearchJournal of
Hindawiwww.hindawi.com Volume 2018
Hindawiwww.hindawi.com Volume 2018
Research and TreatmentAIDS
Hindawiwww.hindawi.com Volume 2018
Gastroenterology Research and Practice
Hindawiwww.hindawi.com Volume 2018
Parkinson’s Disease
Evidence-Based Complementary andAlternative Medicine
Volume 2018Hindawiwww.hindawi.com
Submit your manuscripts atwww.hindawi.com