what is the cost of producing milk? - european milk board · gedempte schuinesloot 3, nl-7776 ps...
TRANSCRIPT

Calculation of milk production costs based on the Farm Accountancy Data Network (FADN) in Belgium, Denmark, France, Germany, Netherlands
Results for 2016Cost trends and milk price comparison since 2010
What is the cost of producing milk?
2
What is the cost of producing milk?
Milcherzeuger Interessengemeinschaft (MIG) Rue de l‘Eglise 24, B-6280 Villers-Poterie Phone: +32 470 473 340 e-mail: [email protected] www.milcherzeuger.eu
MEG Milch Board Stresemannstraße 24, D-37079 Göttingen Phone: +49 551 507 6490 e-mail: [email protected] www.milch-board.de
Landsforeningen af Danske Mælkeproducenter (LDM) Karetmagervej 9, DK-7000 Fredericia Phone: +45 762 079 63 e-mail: [email protected] www.maelkeproducenter.dk
Association des Producteurs de Lait Indépendants (APLI) 5, Impasse du Maréchal, F-55700 Stenay-France Phone: + 33 679 620 299 e-mail: [email protected] www.apli-nationale.org
Organisation des Producteurs de Lait (OPL) 1, Impasse Marc Chagall, F-32022 Auch Cedex 9 Phone: +33 473 531 089 e-mail: [email protected] www.producteurs-lait.com
France Milk Board (FMB) FMB Grand Ouest 14, rue de Normandie, F-35133 Luitré Phone: +33 680 285 182 e-mail: [email protected]
FMB Bassin Normand Le Bourg, F-14260 Jurques Phone: +33 6 81 01 79 09 email: [email protected]
Dutch Dairymen Board (DDB) Gedempte Schuinesloot 3, NL-7776 PS Slagharen Phone: +31 630 105 890 e-mail: [email protected] www.ddb.nu
EDITOR:
CONTRACTING ENTITY:
PARTICIPATING ORGANISATIONS:
Büro für Agrarsoziologie und Landwirtschaft (BAL), part of the network Die Landforscher Heiligenstädter Str. 2, D-37130 Gleichen Phone: +49 559 292 7567 e-mail: [email protected] www.landforscher.de
SCIENTIFIC ANALYSIS:
All studies and brochures on milk production costs in different EU Member States can be found on the EMB website: www.europeanmilkboard.org/en/milk-production-costs.html
BAL, EMB ©2017
European Milk Board asbl (EMB) Rue de la Loi 155, B-1040 Brussels Phone: +32 2 808 1935 e-mail: [email protected] www.europeanmilkboard.org

3
Introduction . . . . . . . . . . . . . . . . . . . . . . . . . . . . . . . . . . . . . . . . . . . . . . . 4
Synopsis – Milk production costs in 2016 in five European milk-producing countries . . . . . . . . . . . . . . . . . . . . . . . . . . . . . . . . . . . . . . . 5
Details about milk production in 2016 . . . . . . . . . . . . . . . . . . . . . . . . . . . . 6
Forecast . . . . . . . . . . . . . . . . . . . . . . . . . . . . . . . . . . . . . . . . . . . . . . . 8
Milk Production Costs 2016 . . . . . . . . . . . . . . . . . . . . . . . . . . . . . . . . . . . . . 10
Belgium . . . . . . . . . . . . . . . . . . . . . . . . . . . . . . . . . . . . . . . . . . . . . . 11
Denmark . . . . . . . . . . . . . . . . . . . . . . . . . . . . . . . . . . . . . . . . . . . . . 12
France . . . . . . . . . . . . . . . . . . . . . . . . . . . . . . . . . . . . . . . . . . . . . . . 13
Germany . . . . . . . . . . . . . . . . . . . . . . . . . . . . . . . . . . . . . . . . . . . . . 14
Netherlands . . . . . . . . . . . . . . . . . . . . . . . . . . . . . . . . . . . . . . . . . . . 15
Cost study methodology and data . . . . . . . . . . . . . . . . . . . . . . . . . . . . . . . . 16
Timely and regular – the need for information about current costs . . . . . . . . . 16
The labour cost of milk production – sufficient recognition is the need of the day . . . . . . . . . . . . . . . . . . . . . . . . . . . . . . . . . . . . . . 17
How many hours does it take to run a dairy farm? . . . . . . . . . . . . . . . . . . . . 18
Overview of publications on milk production costs in Europe . . . . . . . . . . . . . 22
Table of Contents
4
What is the cost of producing milk?
K nowledge about the evolution of costs in European milk production directly affects how well and how realistically we can represent and understand devel-
opments on the dairy market. The lack of this kind of over-view in the sector sparked the idea of a cost study in 2011, as something that would provide regular updates on cost developments in different European countries and would be available to all stakeholders EU-wide. A further aim of this longitudinal study was to make a contribution to mapping the influence and effect of the Common Agricultural Policy on national and regional structures.
In 2012 and against this backdrop, the dairy farmer associations within the European Milk Board (EMB) commis-sioned the Farm Economics and Rural Studies Office (BAL) of the Die Landforscher network to carry out a regular study of milk production costs. These calculations are based on official representative data for the most important milk-pro-ducing countries in the EU. Dairy farmer associations from seven European countries (Belgium, Denmark, Germany, France, Luxembourg, Italy and the Netherlands) are currently participating in this joint project. The cost of milk production in the respective EU Member States is calculated using a common methodology and is regularly updated on behalf of these associations.
The current and past economic problems faced by milk producers cannot be understood without considering how costs have developed on farms. Evaluating the economic situation on dairy farms by only looking at milk prices is very short-sighted. Regularly updated cost development studies based on universally applicable, representative data can provide transparent insight about the overarching economic situation of milk producers to political decision-makers as well as the public and different economic partners.
Furthermore, the accurate and systematic observation of the evolution of production costs is very useful to farmers, as they can adapt their economic behaviour to dairy market trends and thus strengthen their position: Since the imple-mentation of the EU Milk Package in 2012, dairy farmers can use the option of pooling to form producer organisations, in order to collectively negotiate milk prices with the processing industry. Reliable information about production costs is an important factor in this regard.
As of 2013, the results of the milk production cost studies carried out in different European countries have been reg-ularly published in the BAL’s “What is the cost of producing milk?” reports. These documents include detailed figures and conclusive facts about the situation and evolution of costs on dairy farms of different sizes and in different regions of the EU. For readers interested in a quick overview, the par-ticipating dairy farmer associations also publish brochures with a summary of the most important facts and conclusions, which is complemented by a data sheet published by the EMB that provides a concise synopsis of the figures.
You can find the full list of publications at http://www.europeanmilkboard.org/en/milk-production-costs.html. A comprehensive list of all publications is included on the last page of this report.
Introduction
5
Calculation of milk production costs in Belgium, Denmark, France, Germany, Netherlands
T he cost calculations in the joint report document the minimum farm gate price that must be paid to farmers to ensure that production costs are covered –
including appropriate remuneration for farmers themselves as well as their contributing family members.
An analysis of milk production costs up to 2016 is cur-rently available for five important milk-producing countries – Belgium, Denmark, Germany, France and the Netherlands.
More than half (53%) of the total EU milk volume is pro- duced in these five countries – in 2016, it amounted to more than 80 million tons.
In the same year, milk production costs in these countries were between 39.77 and 42.66 cents per kilogram. The farm gate price, however, was only between 26.70 and 30.18 cents per kilogram. This huge gap between costs and prices led to a shortfall of up to 35%.
Synopsis — Milk production costs in 2016 in five European milk-producing countries
Milk-producing countries: Belgium Denmark France Germany Netherlands
Production costs (end total) 41.37 39.77 41.02 41.17 42.66
Farm gate price 26.70 28.68 30.18 27.93 28.75
Cost shortfall 35% 28% 26% 32% 33%
Table 1: Milk production costs and farm gate prices in 2016 in five European countries in cents per kilogram

6
What is the cost of producing milk?
CountryArea in
hectares Dairy cows Milk yield (kg)Total Annual Work
Units (AWU)Family Annual Work
Units (FAWU)
Belgium 53 70 7,368 1.79 1.75
Denmark 157 165 9,585 2.90 1.19
France 91 59 6,949 1.86 1.65
Germany 72 63 7,590 1.98 1.47
Netherlands 51 91 8,169 1.81 1.54
Milk-producing country Belgium Denmark France Germany Netherlands
Input costs (seeds, fertilizers, plant protection products, bought-in feed, cost of equipment & machine
maintenance and energy) 16.12 17.38 17.75 17.37 16.46
General operating costs (other specific costs for plant and animal production and all non-specific
costs like labour, other general costs, paid wages, rent, interest and taxes in 2015) 16.88 24.86 23.59 20.11 21.59
Incurred production costs in total (paid costs) 33.00 42,24 41.34 37.48 38.05
Revenue from beef production (deduction) -4.07 -4.03 -6.95 -6.44 -2.53
Table 2: Dairy farm structure (average farm in 2015)
Table 3: Composition of milk production costs in cents per kilogram
Details about milk production in 2016The herd size of the surveyed dairy farms varied from an average 59 to a maximum 165 dairy cows on an area of 51 to 157 hectares. Annual milk yields were between 6,949 and 9,585 kilograms.
much higher number of cows. Danish dairy farms show the highest figures in terms of area, herd size and milk yield. The high proportion of hired labour in Denmark stands out.
The average dairy farm in France has a comparatively large area with a smaller dairy herd. The available area on Dutch farms, on the other hand, is very small in relation to the
German and Belgian dairy farms are very similar in terms of milk yield and herd size. However, Belgian dairy farms show a greater number of family farms.
Continue reading on the next page
7
Calculation of milk production costs in Belgium, Denmark, France, Germany, Netherlands
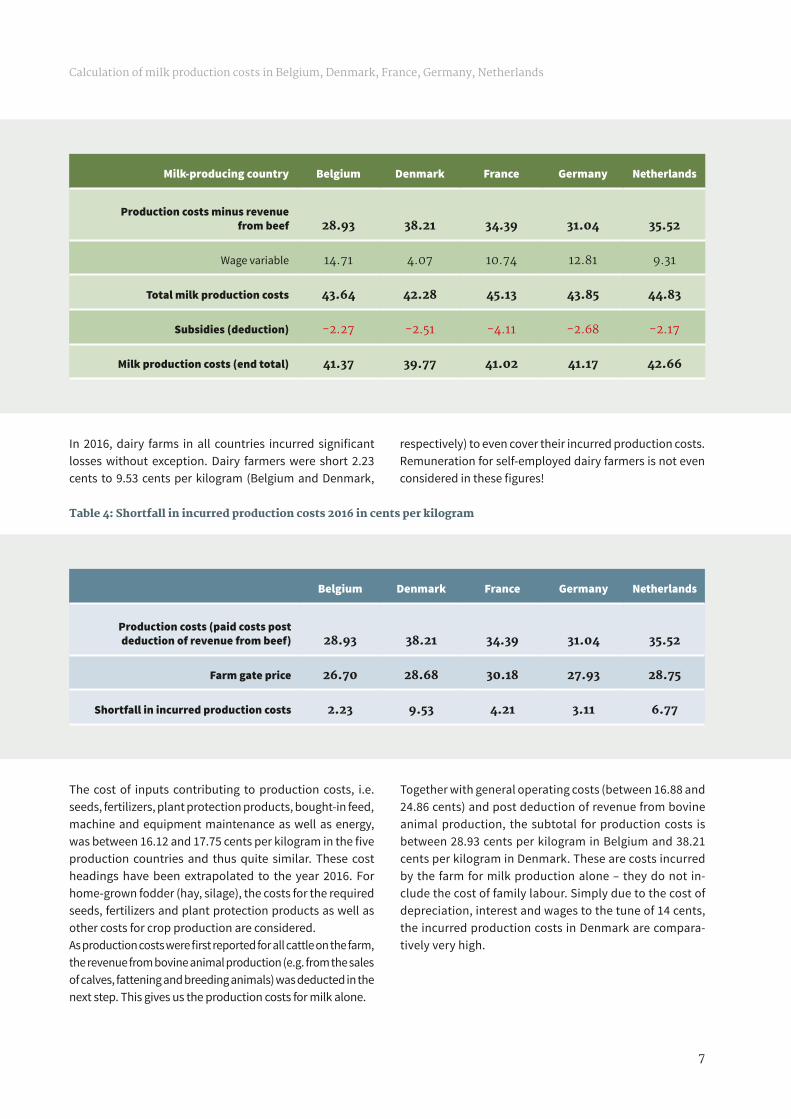
Table 4: Shortfall in incurred production costs 2016 in cents per kilogram
Milk-producing country Belgium Denmark France Germany Netherlands
Production costs minus revenue from beef 28.93 38.21 34.39 31.04 35.52
Wage variable 14.71 4.07 10.74 12.81 9.31
Total milk production costs 43.64 42.28 45.13 43.85 44.83
Subsidies (deduction) -2.27 -2.51 -4.11 -2.68 -2.17
Milk production costs (end total) 41.37 39.77 41.02 41.17 42.66
Belgium Denmark France Germany Netherlands
Production costs (paid costs post deduction of revenue from beef) 28.93 38.21 34.39 31.04 35.52
Farm gate price 26.70 28.68 30.18 27.93 28.75
Shortfall in incurred production costs 2.23 9.53 4.21 3.11 6.77
In 2016, dairy farms in all countries incurred significant losses without exception. Dairy farmers were short 2.23 cents to 9.53 cents per kilogram (Belgium and Denmark,
The cost of inputs contributing to production costs, i.e. seeds, fertilizers, plant protection products, bought-in feed, machine and equipment maintenance as well as energy, was between 16.12 and 17.75 cents per kilogram in the five production countries and thus quite similar. These cost headings have been extrapolated to the year 2016. For home-grown fodder (hay, silage), the costs for the required seeds, fertilizers and plant protection products as well as other costs for crop production are considered.As production costs were first reported for all cattle on the farm, the revenue from bovine animal production (e.g. from the sales of calves, fattening and breeding animals) was deducted in the next step. This gives us the production costs for milk alone.
respectively) to even cover their incurred production costs. Remuneration for self-employed dairy farmers is not even considered in these figures!
Together with general operating costs (between 16.88 and 24.86 cents) and post deduction of revenue from bovine animal production, the subtotal for production costs is between 28.93 cents per kilogram in Belgium and 38.21 cents per kilogram in Denmark. These are costs incurred by the farm for milk production alone – they do not in-clude the cost of family labour. Simply due to the cost of depreciation, interest and wages to the tune of 14 cents, the incurred production costs in Denmark are compara-tively very high.
8
What is the cost of producing milk?
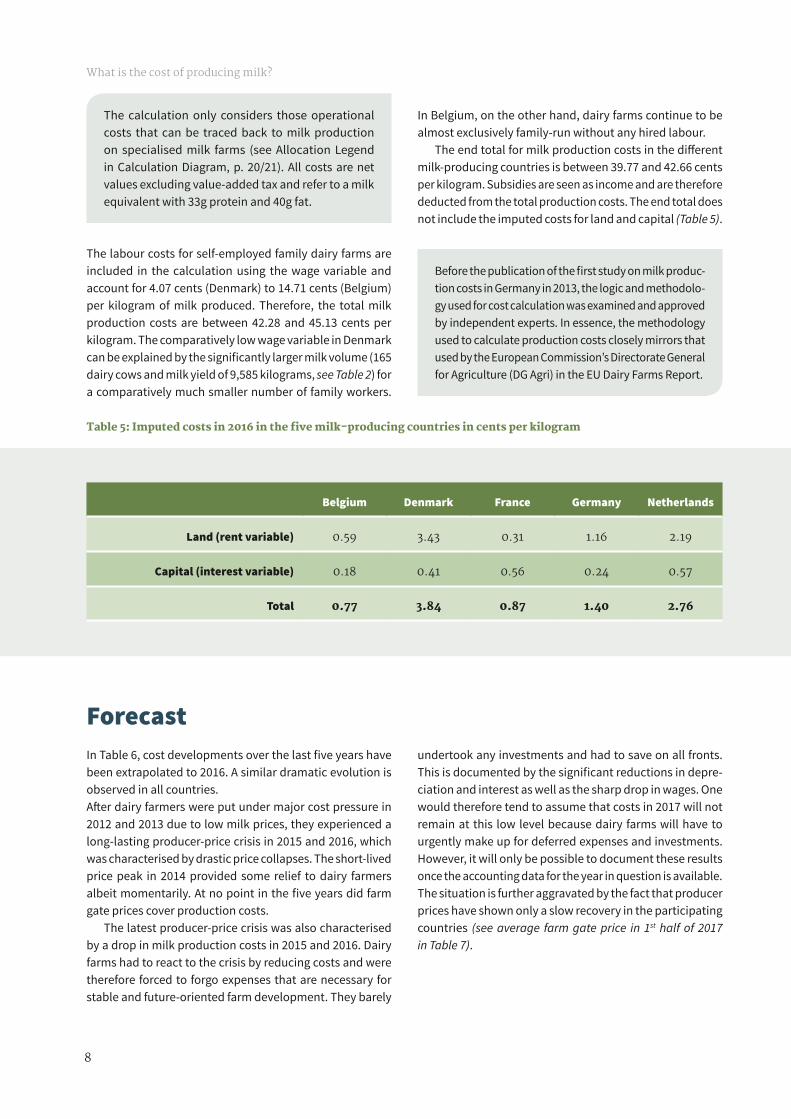
The calculation only considers those operational costs that can be traced back to milk production on specialised milk farms (see Allocation Legend in Calculation Diagram, p. 20/21). All costs are net values excluding value-added tax and refer to a milk equivalent with 33g protein and 40g fat.
The labour costs for self-employed family dairy farms are included in the calculation using the wage variable and account for 4.07 cents (Denmark) to 14.71 cents (Belgium) per kilogram of milk produced. Therefore, the total milk production costs are between 42.28 and 45.13 cents per kilogram. The comparatively low wage variable in Denmark can be explained by the significantly larger milk volume (165 dairy cows and milk yield of 9,585 kilograms, see Table 2) for a comparatively much smaller number of family workers.
Table 5: Imputed costs in 2016 in the five milk-producing countries in cents per kilogram
Forecast In Table 6, cost developments over the last five years have been extrapolated to 2016. A similar dramatic evolution is observed in all countries. After dairy farmers were put under major cost pressure in 2012 and 2013 due to low milk prices, they experienced a long-lasting producer-price crisis in 2015 and 2016, which was characterised by drastic price collapses. The short-lived price peak in 2014 provided some relief to dairy farmers albeit momentarily. At no point in the five years did farm gate prices cover production costs.
The latest producer-price crisis was also characterised by a drop in milk production costs in 2015 and 2016. Dairy farms had to react to the crisis by reducing costs and were therefore forced to forgo expenses that are necessary for stable and future-oriented farm development. They barely
undertook any investments and had to save on all fronts. This is documented by the significant reductions in depre-ciation and interest as well as the sharp drop in wages. One would therefore tend to assume that costs in 2017 will not remain at this low level because dairy farms will have to urgently make up for deferred expenses and investments. However, it will only be possible to document these results once the accounting data for the year in question is available. The situation is further aggravated by the fact that producer prices have shown only a slow recovery in the participating countries (see average farm gate price in 1st half of 2017 in Table 7).
In Belgium, on the other hand, dairy farms continue to be almost exclusively family-run without any hired labour.
The end total for milk production costs in the different milk-producing countries is between 39.77 and 42.66 cents per kilogram. Subsidies are seen as income and are therefore deducted from the total production costs. The end total does not include the imputed costs for land and capital (Table 5).
Before the publication of the first study on milk produc-tion costs in Germany in 2013, the logic and methodolo-gy used for cost calculation was examined and approved by independent experts. In essence, the methodology used to calculate production costs closely mirrors that used by the European Commission’s Directorate General for Agriculture (DG Agri) in the EU Dairy Farms Report.
Belgium Denmark France Germany Netherlands
Land (rent variable) 0.59 3.43 0.31 1.16 2.19
Capital (interest variable) 0.18 0.41 0.56 0.24 0.57
Total 0.77 3.84 0.87 1.40 2.76

9
Calculation of milk production costs in Belgium, Denmark, France, Germany, Netherlands
Table 6: Cost shortfall in the last five years
Year 2012 2013 2014 2015 20165-year
average
Belgium
Milk production costs in cents/kg 40.41 42.78 42.42 40.58 41.37 41.51
Farm gate price in cents/kg1 30.19 37.22 36 27.93 26.7 31.61
Cost shortfall in % 25 13 15 31 35 24
Denmark
Milk production costs in cents/kg 41.94 42.85 42.76 39.75 39.77 41.41
Farm gate price in cents/kg 34.04 38.63 39.67 31.03 28.68 34.41
Cost shortfall in % 19 10 7 22 28 17
France
Milk production costs in cents/kg 40.99 43,73 45.43 42.28 41.02 42.69
Farm gate price in cents/kg 32.58 35.3 37.34 32.29 30.18 33.54
Cost shortfall in % 21 19 18 24 26 21
Germany
Milk production costs in cents/kg 44.08 45.90 44.39 42.13 41.17 43.53
Farm gate price in cents/kg 32.90 38.75 38.78 30.53 27.93 33.78
Cost shortfall in % 25 16 13 28 32 22
Netherlands
Milk production costs in cents/kg 42.96 44.57 46.47 42.46 42.66 43.82
Farm gate price in cents/kg 32.38 37.40 38.90 30.75 28.75 33.64
Cost shortfall in % 25 16 16 28 33 23
1 The stated farm gate prices refer to varying fat and protein content (sources are cited in the country-specific data sheets).

10
What is the cost of producing milk?
Belgium Denmark France Germany Netherlands
33.73 35.58 33.08 33.89 35.71
Table 7: Average farm gate price in 1st half of 2017 in cents per kilogram
(Source: EU MMO, farm gate price for natural fat and protein content)
Thus, the producer-price crisis will be far from over in 2017 as well. The moderate increases in farm gate prices in recent months will not make up for the financial losses incurred over the last five years.
You can find detailed information about the cost developments as well as the used base data and sources in the technical reports published together with these cost calculations. They are available under the common title “What does milk production cost?”, Editions 1-7 on the EMB website. These reports can also be requested from the Farm Economics and Rural Studies Office (BAL).
Milk Production Costs 2016
11
Calculation of milk production costs in Belgium, Denmark, France, Germany, Netherlands
Price/cost ratio (shortfall in per cent)
(Source: trend calculations by the BAL based on Destatis and FADN data)
50
-502010 2011 2012 2013 2014 2015 2016
25
0
-25
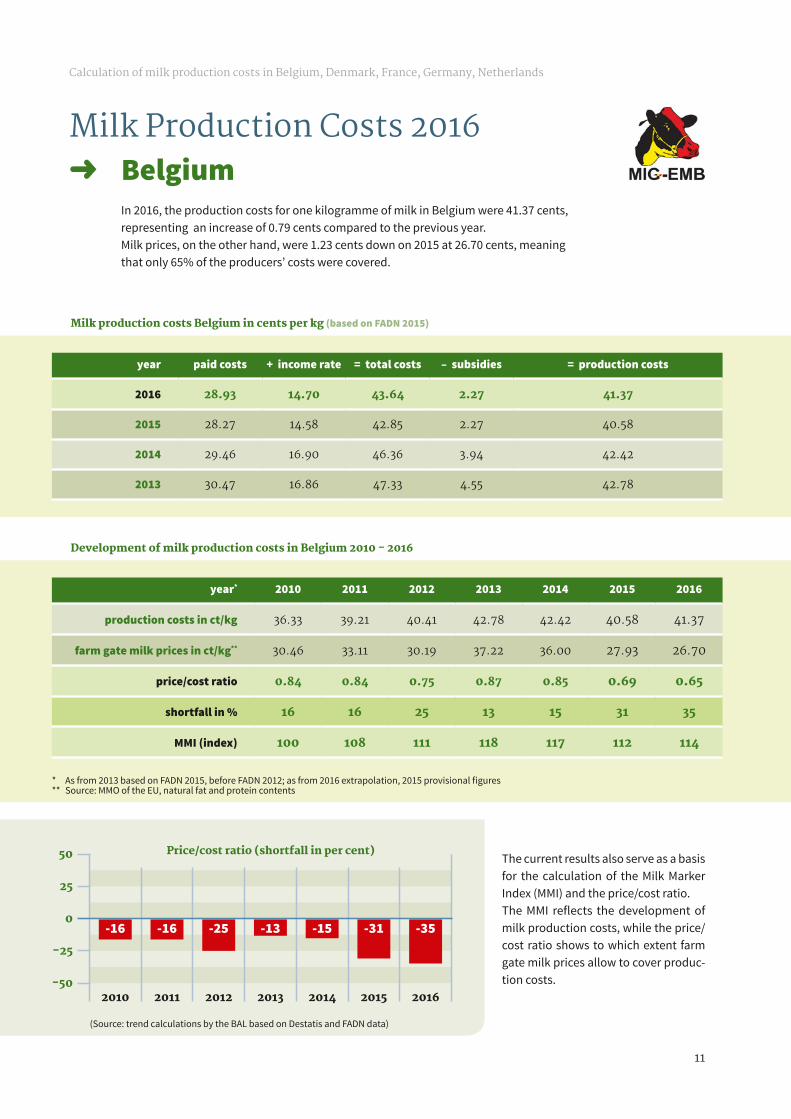
In 2016, the production costs for one kilogramme of milk in Belgium were 41.37 cents, representing an increase of 0.79 cents compared to the previous year.Milk prices, on the other hand, were 1.23 cents down on 2015 at 26.70 cents, meaning that only 65% of the producers’ costs were covered.
Milk Production Costs 2016 ➜ Belgium
year paid costs + income rate = total costs – subsidies = production costs
2016 28.93 14.70 43.64 2.27 41.37
2015 28.27 14.58 42.85 2.27 40.58
2014 29.46 16.90 46.36 3.94 42.42
2013 30.47 16.86 47.33 4.55 42.78
Milk production costs Belgium in cents per kg (based on FADN 2015)
year* 2010 2011 2012 2013 2014 2015 2016
production costs in ct/kg 36.33 39.21 40.41 42.78 42.42 40.58 41.37
farm gate milk prices in ct/kg** 30.46 33.11 30.19 37.22 36.00 27.93 26.70
price/cost ratio 0.84 0.84 0.75 0.87 0.85 0.69 0.65
shortfall in % 16 16 25 13 15 31 35
MMI (index) 100 108 111 118 117 112 114
Development of milk production costs in Belgium 2010 - 2016
The current results also serve as a basis for the calculation of the Milk Marker Index (MMI) and the price/cost ratio.The MMI reflects the development of milk production costs, while the price/cost ratio shows to which extent farm gate milk prices allow to cover produc-tion costs.
* As from 2013 based on FADN 2015, before FADN 2012; as from 2016 extrapolation, 2015 provisional figures ** Source: MMO of the EU, natural fat and protein contents
-16 -16 -25 -13 -15 -31 -35

12
What is the cost of producing milk?
Price/cost ratio (shortfall in per cent)
(Source: trend calculations by the BAL on the basis of FADN 2015)
50
-502010 2011 2012 2013 2014 2015 2016
25
0
-25
In 2016, the production costs for one kilogramme of milk in Denmark were 39.77 cents, representing a slight increase compared to the previous year.Milk prices, on the other hand, were 2.35 cents down on 2015 at 28.68 cents, meaning that only 72% of the producers’ costs were covered.
Milk Production Costs 2016 ➜ Denmark
year paid costs + income rate = total costs – subsidies = production costs
2016 38.21 4.07 42.28 2.51 39.77
2015 38.19 4.07 42.26 2.51 39.75
2014 42.04 4.26 46.3 3.54 42.76
2013 42.09 4.83 46.92 4.07 42.85
Milk production costs in Denmark in cents per kg (based on FADN 2015)
year* 2010 2011 2012 2013 2014 2015 2016
production costs in ct/kg 41.77 42.98 41.94 42.85 42.76 39.75 39.77
farm gate milk prices in ct/kg** 31.94 35.67 34.04 38.63 39.67 31.03 28.68
price/cost ratio 0.76 0.83 0.81 0.90 0.93 0.78 0.72
shortfall in % 24 17 19 10 7 22 28
MMI (index) 100 103 103 106 108 103 98
Development of milk production costs in Denmark 2010 - 2016
The current results also serve as a basis for the calculation of the Milk Marker Index (MMI) and the price/cost ratio.The MMI reflects the development of milk production costs, while the price/cost ratio shows to which extent farm gate milk prices allow to cover produc-tion costs.
* In the publication of October 2017 the provisional values of 2014 and 2015 have been replaced by real costs calculated on the basis of the FADN database 2015** Source: MMO of the EU, natural fat and protein contents
-24 -17 -19-10 -7
-28-22

13
Calculation of milk production costs in Belgium, Denmark, France, Germany, Netherlands
Price/cost ratio (shortfall in per cent)
(Source: trend calculations by the BAL based on Destatis and FADN data)
50
-502010 2011 2012 2013 2014 2015 2016
25
0
-25
In 2016, the production costs for one kilogramme of milk in France were 41.02 cents, representing a slight decrease compared to the previous years studied.Milk prices, on the other hand, were 2.11 cents down on 2015 at 30.18 cents, meaning that only 74% of the producers’ costs were covered.
Milk Production Costs 2016 ➜ France
year paid costs + income rate = total costs – subsidies = production costs
2016 34.39 10.74 45.13 4.11 41.02
2015 35.65 10.74 46.39 4.11 42.28
2014 36.87 14.1 50.97 5.54 45.43
2013 38.27 11.41 49.68 5.95 43.73
Milk production costs in France in cents per kg (based on FADN 2015)
year* 2010 2011 2012 2013 2014 2015 2016
production costs in ct/kg 38.95 39.94 40.99 43,73 45.43 42.28 41.02
farm gate milk prices in ct/kg** 31.55 33.94 32.58 35.3 37.34 32.29 30.18
price/cost ratio 0.81 0.85 0.79 0.81 0.82 0.76 0.74
shortfall in % 19 15 21 19 18 24 26
MMI (index) 100 103 105 112 117 109 105
Development of milk production costs France 2010 - 2016
The current results also serve as a basis for the calculation of the Milk Marker Index (MMI) and the price/cost ratio.The MMI reflects the development of milk production costs, while the price/cost ratio shows to which extent farm gate milk prices allow to cover produc-tion costs.
* All results based on FADN 2015; as from 2016 extrapolation, 2015 provisonal figures** Source: MMO of the EU, natural fat and protein contents
-19 -15 -21 -19 -18 -24 -26

14
What is the cost of producing milk?
Price/cost ratio (shortfall in per cent)
(Source: trend calculations by the BAL based on Destatis and FADN data)
50
-502010 2011 2012 2013 2014 2015 2016
25
0
-25
In 2016, the production costs for one kilogramme of milk in Germany were 41.17 cents, representing a decrease of almost 1 cent compared to the previous year.Milk prices, on the other hand, were 2.9 cents down on 2015 at 27.93 cents, meaning that only 68% of the producers’ costs were covered.
Milk Production Costs 2016 ➜ Germany
year paid costs + income rate = total costs – subsidies = production costs
2016 31.04 12.81 43.85 2.68 41.17
2015 32.00 12.81 44.81 2.68 42.13
2014 35.36 13.30 48.66 4.27 44.39
2013 37.60 13.22 50.82 4.92 45.90
Milk production costs in Germany in cents per kg (based on FADN 2015)
year* 2010 2011 2012 2013 2014 2015 2016
production costs in ct/kg 41.44 42.05 44.08 45.90 44.39 42.13 41.17
farm gate milk prices in ct/kg** 31.89 35.92 32.90 38.75 38.78 30.53 27.93
price/cost ratio 0.77 0.85 0.75 0.84 0.87 0.72 0.68
shortfall in % 23 15 25 16 13 28 32
MMI (index) 100 101 106 110 107 101 99
Development of milk production costs in Germany 2010 - 2016
The current results also serve as a basis for the calculation of the Milk Marker Index (MMI) and the price/cost ratio.The MMI reflects the development of milk production costs, while the price/cost ratio shows to which extent farm gate milk prices allow to cover produc-tion costs.
* As from 2014 new basis for calculations FADN 2015; extrapolation for 2016 updated on the basis of FADN 2015** All milk prices for 4% fat and 3,4% protein, sources: prices of collected raw milk and prices of conventional cow’s milk, in: Statistical yearbook and Statistical monthly reports BMEL, different years, www.bmel-statistik.de, ed. Bundesministerium für Ernährung und Landwirtschaft (Federal Ministry for Food and Agriculture, Germany)
-23 -15 -25 -16 -13 -28 -32
15
Calculation of milk production costs in Belgium, Denmark, France, Germany, Netherlands
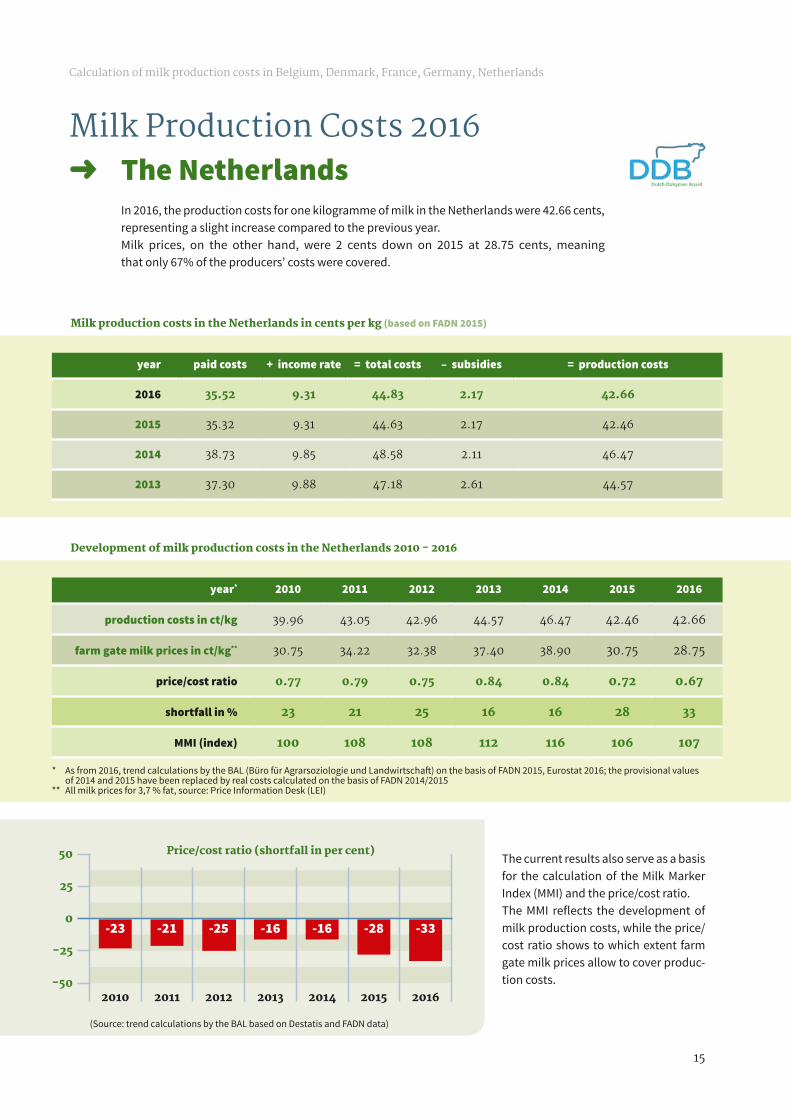
In 2016, the production costs for one kilogramme of milk in the Netherlands were 42.66 cents, representing a slight increase compared to the previous year.Milk prices, on the other hand, were 2 cents down on 2015 at 28.75 cents, meaning that only 67% of the producers’ costs were covered.
Milk Production Costs 2016 ➜ The Netherlands
year paid costs + income rate = total costs – subsidies = production costs
2016 35.52 9.31 44.83 2.17 42.66
2015 35.32 9.31 44.63 2.17 42.46
2014 38.73 9.85 48.58 2.11 46.47
2013 37.30 9.88 47.18 2.61 44.57
Milk production costs in the Netherlands in cents per kg (based on FADN 2015)
year* 2010 2011 2012 2013 2014 2015 2016
production costs in ct/kg 39.96 43.05 42.96 44.57 46.47 42.46 42.66
farm gate milk prices in ct/kg** 30.75 34.22 32.38 37.40 38.90 30.75 28.75
price/cost ratio 0.77 0.79 0.75 0.84 0.84 0.72 0.67
shortfall in % 23 21 25 16 16 28 33
MMI (index) 100 108 108 112 116 106 107
Development of milk production costs in the Netherlands 2010 - 2016
Price/cost ratio (shortfall in per cent)The current results also serve as a basis for the calculation of the Milk Marker Index (MMI) and the price/cost ratio.The MMI reflects the development of milk production costs, while the price/cost ratio shows to which extent farm gate milk prices allow to cover produc-tion costs.
* As from 2016, trend calculations by the BAL (Büro für Agrarsoziologie und Landwirtschaft) on the basis of FADN 2015, Eurostat 2016; the provisional values of 2014 and 2015 have been replaced by real costs calculated on the basis of FADN 2014/2015** All milk prices for 3,7 % fat, source: Price Information Desk (LEI)
(Source: trend calculations by the BAL based on Destatis and FADN data)
50
-502010 2011 2012 2013 2014 2015 2016
25
0
-25
-23 -21 -25 -16 -16 -28 -33

16
What is the cost of producing milk?
Cost study methodology and data
T he data used for the cost calculations is universally applicable. It is official accounting data for special-ised dairy farms included in the surveys carried out
by the EU Farm Accountancy Data Network (FADN). This data is collected and verified by national liaison agencies (usually research institutes of the country’s Ministry of Agriculture) and then forwarded to the European Commission.
The FADN and the sample of agricultural holdings on which it is based is the only representative data source that provides economic and structural figures about commercial agricultural holdings. The calculations commissioned by the EMB are based on the same sources also used by the EU for their agronomic analyses.
The sample holdings included in the FADN are chosen so as to provide a representative picture of the real economic structures of dairy farms. In addition to farm structural characteristics (number of employees, area, herd size, livestock units, etc.), the FADN also includes important figures from the farms’ profit and loss statements. Thus, all key variables from specific and non-specific costs are available and are considered in the cost calculations (see Overview 1, p. 20/21).
The used data is only representative for commercial specialised dairy farms. This means that the evaluation consciously excludes smaller mixed farms focused on milk production as well as part-time farms.
Timely and regular – the need for information about current costsThe availability of timely, regularly-updated data and cross-cutting analyses about cost developments is very important to the dairy farmer associations in the EMB. Only with this kind of information would it be possible for them to take appropriate action at the agro-political level, rather than reacting too late. This information is becoming
increasingly important for active farms to be able to orient their production strategies to the economic reality. If they are part of a producer organisation, this information can help them demand appropriate prices when negotiating with milk buyers.

17
Calculation of milk production costs in Belgium, Denmark, France, Germany, Netherlands
2 European Commission 2016, EU Dairy farms report based on 2013 FADN
Knowledge about production costs is also a fundamental requirement from a business point of view. Furthermore, it must also be possible to base price negotiations on actual costs. However, this is where a major issue lies: Dairies and farmers usually do not decide on prices in advance. For dairy farmers, it is almost impossible to negotiate a price that is actually based on production costs with a dairy. They are ultimately paid whatever pro-cessing facilities can spare. If supply outstrips demand and dairies see their revenues shrink, dairy farmers end up bearing the brunt of these losses. It is also difficult for milk producers to control supply because there are no overarching, common market mechanisms in place.
The EU also publishes data about the cost situation on a yearly basis. The EU Dairy Farms Report published by the European Commission provides information about the EU milk production countries based on FADN data. These analyses serve as an important tool for political institutions in their decision-making as well as strategy development. However, they represent a major shortcoming in terms of timeliness of data. The latest EU report from 2016 is only an evaluation of accounting data from 2013 and provides a very limited analysis of trends in milk production costs that stops at 2014 (European Commission 2016)2 . Considering the highly-volatile developments on the dairy market, these sta-tistical conclusions are therefore outdated. They have very little to do with the current economic reality on dairy farms.
Extrapolating production costs to 2016The EU accounting data in its current form is not enough to provide a real-time cost overview. Until 2016, data was only available for a period dating back three years. While the EU has started providing preliminary data for a more recent pe-riod as of this year (in 2017 for the accounting year 2015), this still does not allow for an up-to-date representation of costs.
In order to provide a timely as well as regularly updated cost calculation, the BAL has developed an extrapolation methodology (analogue methodology). It is based on the
price indices regularly published by Eurostat for the key agricultural inputs in milk production. This includes seeds, fertilizers, plant protection products, bought-in feed, ma-chine and equipment maintenance as well as energy and revenue from beef production. The extrapolation does not simply add or subtract the current price differences. It, in fact, mathematically simulates how dairy farms have modified their spending due to price changes by looking at similar price situations from the past
The labour cost of milk production – sufficient recognition is the need of the dayBeing a dairy farmer today is a demanding task. Not only does this profession require specialised knowledge about animal rearing, farming and fodder cultivation, as well as maintenance of highly technical and sensitive machines and equipment; business management skills are also necessary to be able to run a dairy farm. This profession also comes with the responsibility of producing high-quality milk for consumers and other users. Furthermore, the necessary constant care for animals is very labour-intensive.
value of labour is usually assigned using a generic standard for an hour of work that, nonetheless, does not consider qualifications or actual field of work at all. For example, the European Commission equates the value of an hour of work by a self-employed dairy farmer with that of external labour hired to work on the farm, and thus calculates the farm’s spending in terms of wages and imputed labour costs. However, there is no differentiation between the kind of em-ployment and level of qualification (e.g. seasonal workers, temporary help for simple tasks, etc.) nor field of work. As a result, past experiences have shown that the imputed labour costs in recent years have not even been in line with the minimum wage.
Technical cost studies deal with the reporting of labour costs in milk production in very different ways. There are different approaches to the valuation of labour. However, the chosen methods often do not represent an appropriate benchmark from the point of view of milk producers. The

18
What is the cost of producing milk?
The majority of dairy farms are family-run and the required work is carried out by family members. Therefore, it is important to determine an appropriate benchmark to decide on the value of the work done by them. The labour costs of self-employed dairy farmers are determined in the EMB cost calculation using an in-dependent wage variable. The nationally-applicable collective agreements (agricultural sector) are used as a reference and benchmark to determine the value of an hour of work carried out by the farm manager and the contributing family members.
Employer contributions are also included in the wage variable because dairy farmers would have to bear these social costs if they were to hire someone instead. Such collective agreements lend themselves perfectly to such a differentiated valuation of labour costs on farms on the basis of qualifications and area of responsibility. Not only is the implemented methodology recognised, it also represents standards for the valuation of labour adopted collectively by self-employed farmers in their role as employers with employees.
3 You can find detailed information about this calculation in the national cost reports at: http://www.europeanmilkboard.org/ milk-production-costs.html.
Table 8: Collective references on appropriate monetary valuation of work done on family dairy farms
Country Reference system3
Belgium Wage categories chosen according to the qualification levels of the farm manager and family workers, based on the basic wage of the Joint Committee for the agricultural sector / green sectors, combined with a wage index.
Denmark National collective agreements in the agricultural sector: wage group for managerial functions (farm manager) as well as basic wage for workers (family labour)
France 1.5-times the legal minimum wage (SMIC – salaire minimum interprofessionnel de croissance) Minimum wage committee (Commission n ationale de la négociation collective)
Germany Collective agreements in the agricultural sector in the different Länder: Wage group for managerial functions (farm manager) as well as basic wage for workers (family labour)
Netherlands System of job valuation based on market information about the rate of remuneration of agricultural employees (Employers’ association)
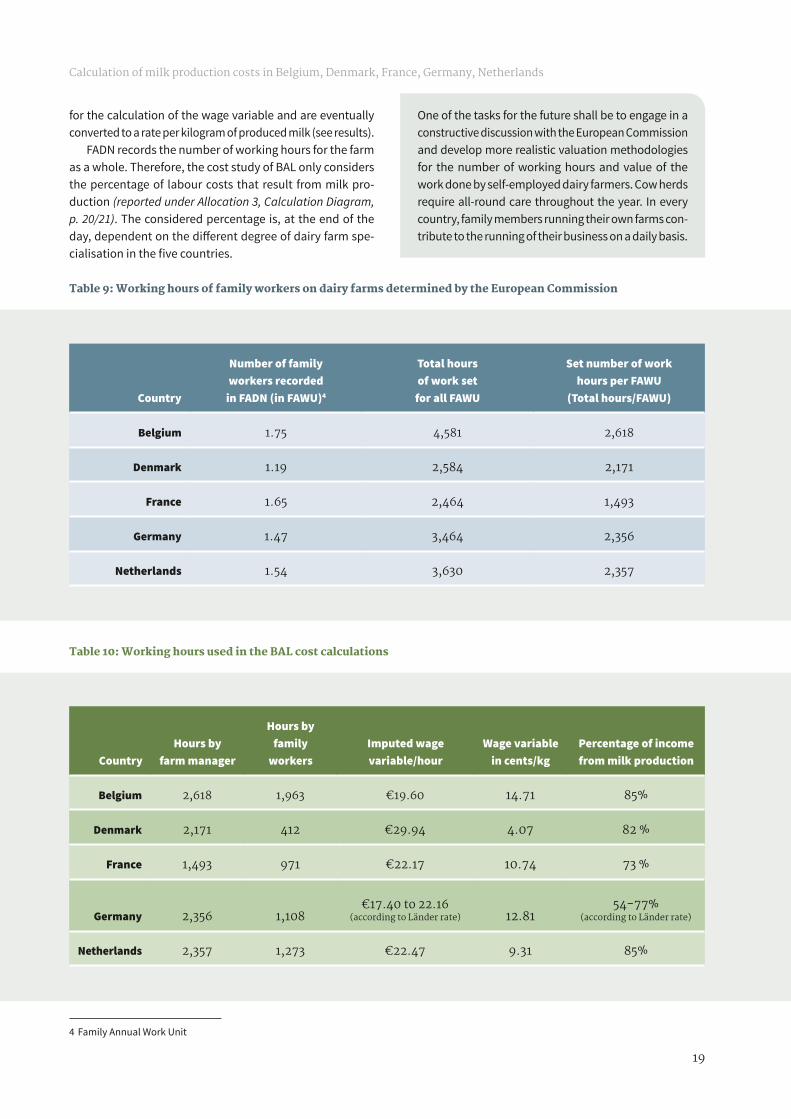
How many hours does it take to run a dairy farm? To answer this question, no appropriate recording of working time is actually available. Therefore, the cost calculations have stuck to the standards set by FADN and the national farm accountancy networks (see Table 9).
These set working hours are not derived from real re-cordings of working times. They are usually based on the nationally-agreed working time per Family Work Unit (FWU).
The reference system chosen by the European Commis-sion provides a very different number of working hours from country to country as the basis to calculate labour costs. A direct comparison of labour costs between countries is, there-
fore, not possible. The number of working hours set for French dairy farmers, in particular, is significantly below that of the other EU countries because the collectively-agreed working time of 35 hours per week is the norm. A family worker in the agricultural sector in France is only assigned about 1,500 hours per year. In comparison, however, many other studies on milk production in France have assigned 2,800 hours of work per family worker. As a result, the wage variable changes from 18.70 cents per kilogram of milk produced (for 2,800 hours/FAWU) to 10.74 cents per kilogram (1,500 hours/FAWU).
The cost calculations of BAL assume that the farm man-ager is a full-time employee on the dairy farm. The additional working hours are assigned to family workers. Calculated using the outlined base rates, the derived hourly wages are presented in Table 10. These hourly rates are the basis
19
Calculation of milk production costs in Belgium, Denmark, France, Germany, Netherlands
for the calculation of the wage variable and are eventually converted to a rate per kilogram of produced milk (see results).
FADN records the number of working hours for the farm as a whole. Therefore, the cost study of BAL only considers the percentage of labour costs that result from milk pro-duction (reported under Allocation 3, Calculation Diagram, p. 20/21). The considered percentage is, at the end of the day, dependent on the different degree of dairy farm spe-cialisation in the five countries.
One of the tasks for the future shall be to engage in a constructive discussion with the European Commission and develop more realistic valuation methodologies for the number of working hours and value of the work done by self-employed dairy farmers. Cow herds require all-round care throughout the year. In every country, family members running their own farms con-tribute to the running of their business on a daily basis.
Table 9: Working hours of family workers on dairy farms determined by the European Commission
Country
Number of family workers recorded
in FADN (in FAWU)4
Total hours of work set
for all FAWU
Set number of work hours per FAWU
(Total hours/FAWU)
Belgium 1.75 4,581 2,618
Denmark 1.19 2,584 2,171
France 1.65 2,464 1,493
Germany 1.47 3,464 2,356
Netherlands 1.54 3,630 2,357
Table 10: Working hours used in the BAL cost calculations
CountryHours by
farm manager
Hours by family
workersImputed wage variable/hour
Wage variable in cents/kg
Percentage of income from milk production
Belgium 2,618 1,963 €19.60 14.71 85%
Denmark 2,171 412 €29.94 4.07 82 %
France 1,493 971 €22.17 10.74 73 %
Germany 2,356 1,108€17.40 to 22.16
(according to Länder rate) 12.8154-77%
(according to Länder rate)
Netherlands 2,357 1,273 €22.47 9.31 85%
4 Family Annual Work Unit
20
Overview 1: Diagram for reporting of milk production costs adjustments to FADN/EU
Cost heading
Specific costs
Bought-in feed for grazing livestock (1)
Home-grown fodder — Seeds — Fertilizers — Plant protection products — Other specific forage
production costs
Non-specific costs
Depreciation
Wages paid, rent paid, interest paid
— Building + machine upkeep — Energy — Wages — Other direct costs — Taxes and other dues
Family labour costs
Subsidies
Land/capital costs
Other specific livestock costs (Veterinary costs, etc.)
Allocation
Specific costs
Percentage of dairy cows + cattle/grazing livestock (2)
Percentage of dairy cows + cattle/ grazing livestock
Percentage of area used for fodder crops/total area (2)
Non-specific costs
Production value of milk + beef/Total production value minus in-house consumption (3)
Production value of milk/Total production value minus
in-house consumption (3)
Percentage of dairy cows + cattle/total livestock units (2)

Adjustments/Legend
1: The cost of bought-in feed is derived from the total costs for grazing live-stock. The EU uses individual figures.
2: The allocation of costs for bought-in feed and home-grown fodder as well as other specific livestock costs refer to all cattle on the farm. The EU refers to the number of dairy cows.
3: The allocation for these cost groups is derived by dividing the production value of milk (and beef) by the total production value minus in-house con-sumption. The EU also includes milk subsidies and total subsidies in this allocation, but does not include beef.
4: The EU system does not deduct complementary revenue from the co-product beef.
5: The costs are calculated for delivered milk and not the farm’s total milk pro-duction (as is done by the EU).
6: Wage variable: This report uses an independent variable to calculate the labour costs of self-employed farmers.
7: The imputed land and capital costs are indicated separately from total milk production costs.
21
Production cost of delivered
milk (5)
Deduction of production value
of beef (4)
Imputed land and capital
costs (7)
Wage variable (6)
Subsidies

CountryCalculation status
Type of publication
Languages available
Belgium
2016Update of the study on milk production costs in Belgium DE, FR
2016 Short version of the study DE, FR
2016 Data sheet of the study DE, EN, FR
2014Study on milk production costs in Belgium DE, FR
2014 Short version of the study FR, NL
Denmark
2016 (forthcoming)
Data sheet on milk production costs in Denmark DE, EN, FR
2015Data sheet on milk production costs in Denmark DE, EN, FR
2014Data sheet on milk production costs in Denmark DE, EN, FR
France
2016 (forthcoming)
Update of the study on milk production costs in France (on the basis of FADN 2014/2015) DE, FR
2013Study on milk production costs in France (on the basis of FADN 2009) DE, FR
2013 Short version of the study FR
Overview of publications on milk production costs in Europe
22
CountryCalculation status
Type of publication
Languages available
Germany
July 2017 Data sheet on milk production costs in Germany DE, EN, FR
April 2017 Data sheet on milk production costs in Germany DE, EN, FR
January 2017 Data sheet on milk production costs in Germany DE, EN, FR
October 2016 Data sheet on milk production costs in Germany DE, EN, FR
July 2016 Data sheet on milk production costs in Germany DE, EN, FR
April 2016 Data sheet on milk production costs in Germany DE, EN, FR
January 2016 Data sheet on milk production costs in Germany DE, EN, FR
2016Update of the study on milk production costs in Germany (on the basis of FADN 2014/2015) DE
2015Update of the study on milk production costs in Germany (on the basis of FADN 2013) DE
2014Update of the study on milk production costs in Germany (on the basis of FADN 2012) DE
2012Study on milk production costs in Germany (on the basis of FADN 2009) DE, EN, FR
2012 Short version of the study DE, EN, FR
Luxembourg
2015 Study on milk production costs in Luxembourg DE
2015 Short version of the study DE
Netherlands
July 2017 (forthcoming)
Data sheet on milk production costs in the Netherlands DE, EN, FR
2016 (forthcoming)
Data sheet on milk production costs in the Netherlands DE, EN, FR
2015 Data sheet on milk production costs in the Netherlands DE, EN, FR
2014 Data sheet on milk production costs in the Netherlands DE, EN, FR
2013 Study on milk production costs in the Netherlands DE, NL

European Milk Board asbl (EMB) Rue de la Loi 155 B-1040 Brussels/Belgium
Phone: +32 (0)2 808 1935 Fax: +32 (0)2 808 8265
[email protected] www.europeanmilkboard.org