what is the di erence between association and...
TRANSCRIPT

What is the difference between association andcausation?
And why should we bother being formal about it?
Rhian Daniel and Bianca De Stavola
ESRC Research Methods Festival, 5th July 2012, 10.00am
Association vs. causation/ESRC Research Methods Festival 2012 1/92
What is the difference between association andcausation?
And why should we bother being formal about it?
Rhian Daniel and Bianca De Stavola
ESRC Research Methods Festival, 5th July 2012, 10.00am
Association vs. causation/ESRC Research Methods Festival 2012 2/92
Introduction Association/causation Building blocks Causal diagrams Why bother? Example Final thoughts
Outline
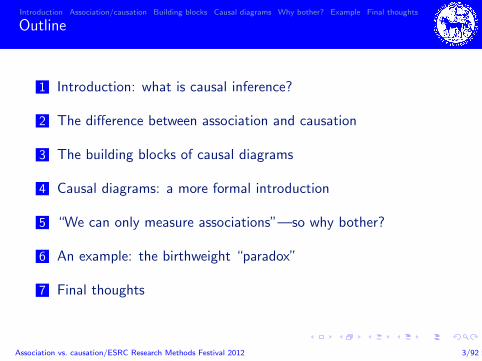
1 Introduction: what is causal inference?
2 The difference between association and causation
3 The building blocks of causal diagrams
4 Causal diagrams: a more formal introduction
5 “We can only measure associations”—so why bother?
6 An example: the birthweight “paradox”
7 Final thoughts
Association vs. causation/ESRC Research Methods Festival 2012 3/92
Introduction Association/causation Building blocks Causal diagrams Why bother? Example Final thoughts
Outline
1 Introduction: what is causal inference?
2 The difference between association and causation
3 The building blocks of causal diagrams
4 Causal diagrams: a more formal introduction
5 “We can only measure associations”—so why bother?
6 An example: the birthweight “paradox”
7 Final thoughts
Association vs. causation/ESRC Research Methods Festival 2012 4/92
Introduction Association/causation Building blocks Causal diagrams Why bother? Example Final thoughts
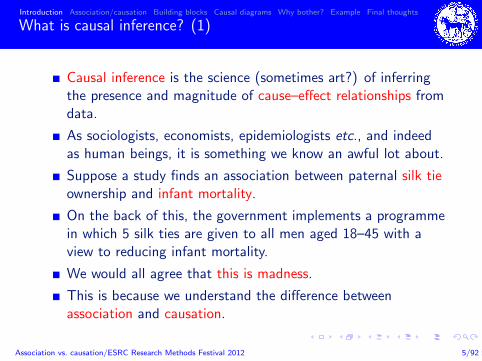
What is causal inference? (1)
Causal inference is the science (sometimes art?) of inferringthe presence and magnitude of cause–effect relationships fromdata.
As sociologists, economists, epidemiologists etc., and indeedas human beings, it is something we know an awful lot about.
Suppose a study finds an association between paternal silk tieownership and infant mortality.
On the back of this, the government implements a programmein which 5 silk ties are given to all men aged 18–45 with aview to reducing infant mortality.
We would all agree that this is madness.
This is because we understand the difference betweenassociation and causation.
Association vs. causation/ESRC Research Methods Festival 2012 5/92
Introduction Association/causation Building blocks Causal diagrams Why bother? Example Final thoughts
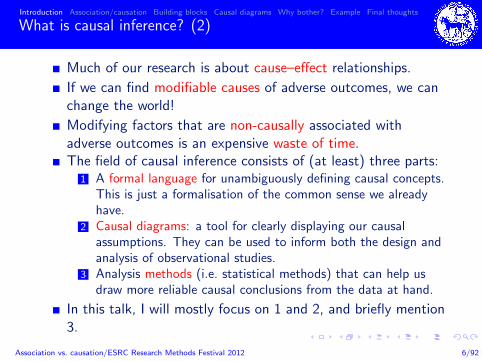
What is causal inference? (2)
Much of our research is about cause–effect relationships.
If we can find modifiable causes of adverse outcomes, we canchange the world!
Modifying factors that are non-causally associated withadverse outcomes is an expensive waste of time.The field of causal inference consists of (at least) three parts:
1 A formal language for unambiguously defining causal concepts.This is just a formalisation of the common sense we alreadyhave.
2 Causal diagrams: a tool for clearly displaying our causalassumptions. They can be used to inform both the design andanalysis of observational studies.
3 Analysis methods (i.e. statistical methods) that can help usdraw more reliable causal conclusions from the data at hand.
In this talk, I will mostly focus on 1 and 2, and briefly mention3.
Association vs. causation/ESRC Research Methods Festival 2012 6/92
Introduction Association/causation Building blocks Causal diagrams Why bother? Example Final thoughts
Outline
1 Introduction: what is causal inference?
2 The difference between association and causation
3 The building blocks of causal diagrams
4 Causal diagrams: a more formal introduction
5 “We can only measure associations”—so why bother?
6 An example: the birthweight “paradox”
7 Final thoughts
Association vs. causation/ESRC Research Methods Festival 2012 7/92
Introduction Association/causation Building blocks Causal diagrams Why bother? Example Final thoughts
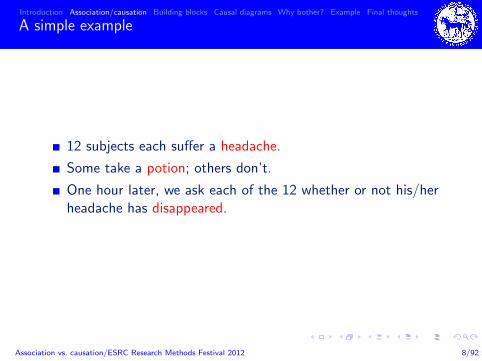
A simple example
12 subjects each suffer a headache.
Some take a potion; others don’t.
One hour later, we ask each of the 12 whether or not his/herheadache has disappeared.
Association vs. causation/ESRC Research Methods Festival 2012 8/92
Introduction Association/causation Building blocks Causal diagrams Why bother? Example Final thoughts
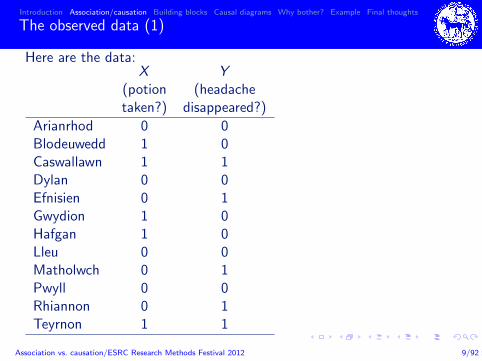
The observed data (1)
Here are the data:X Y
(potion (headachetaken?) disappeared?)
Arianrhod 0 0Blodeuwedd 1 0Caswallawn 1 1Dylan 0 0Efnisien 0 1Gwydion 1 0Hafgan 1 0Lleu 0 0Matholwch 0 1Pwyll 0 0Rhiannon 0 1Teyrnon 1 1
Association vs. causation/ESRC Research Methods Festival 2012 9/92
Introduction Association/causation Building blocks Causal diagrams Why bother? Example Final thoughts
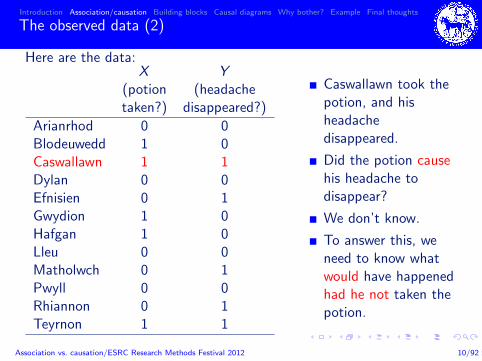
The observed data (2)
Here are the data:X Y
(potion (headachetaken?) disappeared?)
Arianrhod 0 0Blodeuwedd 1 0Caswallawn 1 1Dylan 0 0Efnisien 0 1Gwydion 1 0Hafgan 1 0Lleu 0 0Matholwch 0 1Pwyll 0 0Rhiannon 0 1Teyrnon 1 1
Caswallawn took thepotion, and hisheadachedisappeared.
Did the potion causehis headache todisappear?
We don’t know.
To answer this, weneed to know whatwould have happenedhad he not taken thepotion.
Association vs. causation/ESRC Research Methods Festival 2012 10/92
Introduction Association/causation Building blocks Causal diagrams Why bother? Example Final thoughts
Counterfactuals and potential outcomes
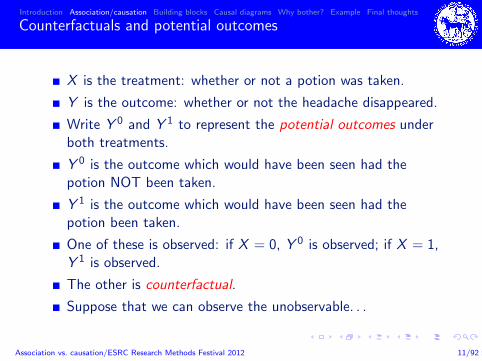
X is the treatment: whether or not a potion was taken.
Y is the outcome: whether or not the headache disappeared.
Write Y 0 and Y 1 to represent the potential outcomes underboth treatments.
Y 0 is the outcome which would have been seen had thepotion NOT been taken.
Y 1 is the outcome which would have been seen had thepotion been taken.
One of these is observed: if X = 0, Y 0 is observed; if X = 1,Y 1 is observed.
The other is counterfactual.
Suppose that we can observe the unobservable. . .
Association vs. causation/ESRC Research Methods Festival 2012 11/92
Introduction Association/causation Building blocks Causal diagrams Why bother? Example Final thoughts
The ideal data (1)
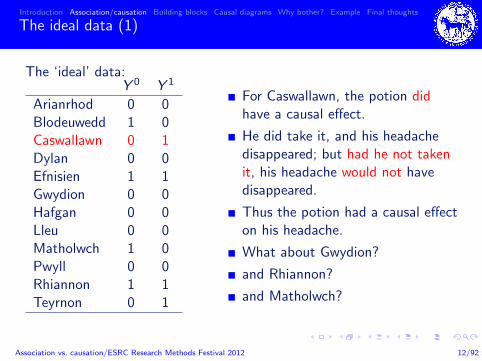
The ‘ideal’ data:Y 0 Y 1
Arianrhod 0 0Blodeuwedd 1 0Caswallawn 0 1Dylan 0 0Efnisien 1 1Gwydion 0 0Hafgan 0 0Lleu 0 0Matholwch 1 0Pwyll 0 0Rhiannon 1 1Teyrnon 0 1
For Caswallawn, the potion didhave a causal effect.
He did take it, and his headachedisappeared; but had he not takenit, his headache would not havedisappeared.
Thus the potion had a causal effecton his headache.
What about Gwydion?
and Rhiannon?
and Matholwch?
Association vs. causation/ESRC Research Methods Festival 2012 12/92
Introduction Association/causation Building blocks Causal diagrams Why bother? Example Final thoughts
The ideal data (2)
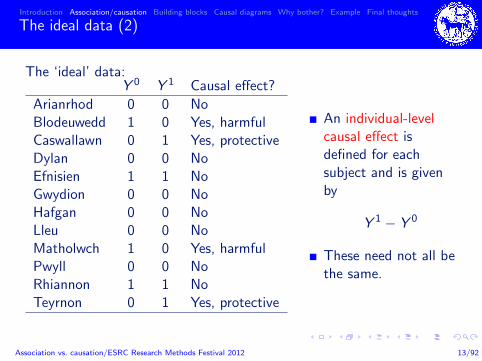
The ‘ideal’ data:Y 0 Y 1 Causal effect?
Arianrhod 0 0 NoBlodeuwedd 1 0 Yes, harmfulCaswallawn 0 1 Yes, protectiveDylan 0 0 NoEfnisien 1 1 NoGwydion 0 0 NoHafgan 0 0 NoLleu 0 0 NoMatholwch 1 0 Yes, harmfulPwyll 0 0 NoRhiannon 1 1 NoTeyrnon 0 1 Yes, protective
An individual-levelcausal effect isdefined for eachsubject and is givenby
Y 1 − Y 0
These need not all bethe same.
Association vs. causation/ESRC Research Methods Festival 2012 13/92

Introduction Association/causation Building blocks Causal diagrams Why bother? Example Final thoughts
The fundamental problem of causal inference
Back to reality. . .Y 0 Y 1 X Y
Arianrhod 0 ? 0 0Blodeuwedd ? 0 1 0Caswallawn ? 1 1 1Dylan 0 ? 0 0Efnisien 1 ? 0 1Gwydion ? 0 1 0Hafgan ? 0 1 0Lleu 0 ? 0 0Matholwch 1 ? 0 1Pwyll 0 ? 0 0Rhiannon 1 ? 0 1Teyrnon ? 1 1 1
In reality, we never observeboth Y 0 and Y 1 on thesame individual.
Sometimes called thefundamental problem ofcausal inference.
It is therefore over-ambitiousto try to infer anythingabout individual-level causaleffects.
Association vs. causation/ESRC Research Methods Festival 2012 14/92
Introduction Association/causation Building blocks Causal diagrams Why bother? Example Final thoughts
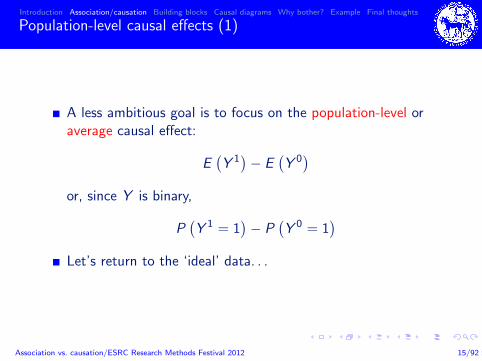
Population-level causal effects (1)
A less ambitious goal is to focus on the population-level oraverage causal effect:
E(Y 1
)− E
(Y 0
)or, since Y is binary,
P(Y 1 = 1
)− P
(Y 0 = 1
)Let’s return to the ‘ideal’ data. . .
Association vs. causation/ESRC Research Methods Festival 2012 15/92
Introduction Association/causation Building blocks Causal diagrams Why bother? Example Final thoughts
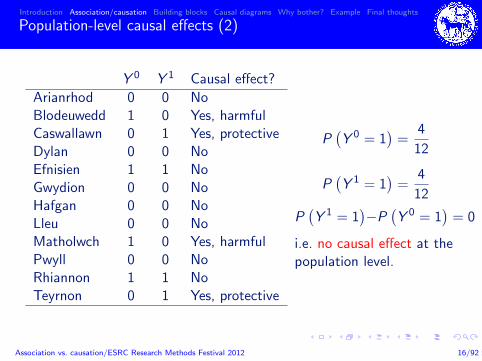
Population-level causal effects (2)
Y 0 Y 1 Causal effect?
Arianrhod 0 0 NoBlodeuwedd 1 0 Yes, harmfulCaswallawn 0 1 Yes, protectiveDylan 0 0 NoEfnisien 1 1 NoGwydion 0 0 NoHafgan 0 0 NoLleu 0 0 NoMatholwch 1 0 Yes, harmfulPwyll 0 0 NoRhiannon 1 1 NoTeyrnon 0 1 Yes, protective
P(Y 0 = 1
)=
4
12
P(Y 1 = 1
)=
4
12
P(Y 1 = 1
)−P
(Y 0 = 1
)= 0
i.e. no causal effect at thepopulation level.
Association vs. causation/ESRC Research Methods Festival 2012 16/92
Introduction Association/causation Building blocks Causal diagrams Why bother? Example Final thoughts
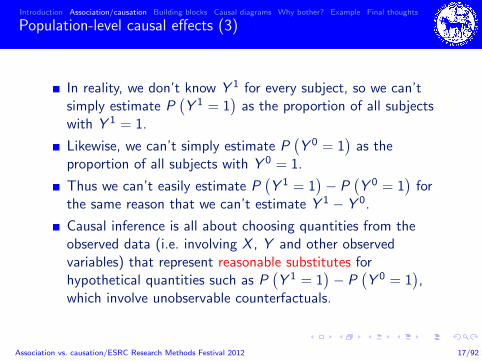
Population-level causal effects (3)
In reality, we don’t know Y 1 for every subject, so we can’tsimply estimate P
(Y 1 = 1
)as the proportion of all subjects
with Y 1 = 1.
Likewise, we can’t simply estimate P(Y 0 = 1
)as the
proportion of all subjects with Y 0 = 1.
Thus we can’t easily estimate P(Y 1 = 1
)− P
(Y 0 = 1
)for
the same reason that we can’t estimate Y 1 − Y 0.
Causal inference is all about choosing quantities from theobserved data (i.e. involving X , Y and other observedvariables) that represent reasonable substitutes forhypothetical quantities such as P
(Y 1 = 1
)− P
(Y 0 = 1
),
which involve unobservable counterfactuals.
Association vs. causation/ESRC Research Methods Festival 2012 17/92

Introduction Association/causation Building blocks Causal diagrams Why bother? Example Final thoughts
When does association = causation? (1)
What might be a good substitute for P(Y 1 = 1
)?
What about P (Y = 1 |X = 1)?
This is the proportion whose headache disappeared amongthose who actually took the potion.
Is this the same as P(Y 1 = 1
)?
Only if those who took the potion are exchangeable withthose who didn’t.
This would be the case if the choice to take the potion wasmade at random.
This is why ideal randomised experiments are the goldstandard for inferring causal effects.
Association vs. causation/ESRC Research Methods Festival 2012 18/92
Introduction Association/causation Building blocks Causal diagrams Why bother? Example Final thoughts
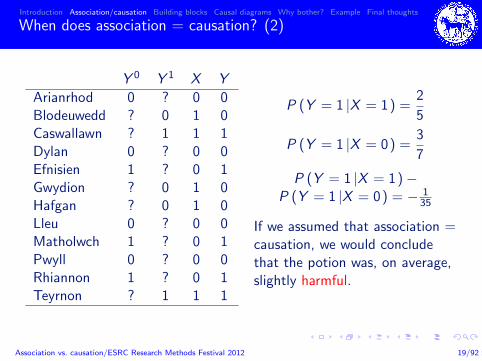
When does association = causation? (2)
Y 0 Y 1 X Y
Arianrhod 0 ? 0 0Blodeuwedd ? 0 1 0Caswallawn ? 1 1 1Dylan 0 ? 0 0Efnisien 1 ? 0 1Gwydion ? 0 1 0Hafgan ? 0 1 0Lleu 0 ? 0 0Matholwch 1 ? 0 1Pwyll 0 ? 0 0Rhiannon 1 ? 0 1Teyrnon ? 1 1 1
P (Y = 1 |X = 1) =2
5
P (Y = 1 |X = 0) =3
7
P (Y = 1 |X = 1)−P (Y = 1 |X = 0) = − 1
35
If we assumed that association =causation, we would concludethat the potion was, on average,slightly harmful.
Association vs. causation/ESRC Research Methods Festival 2012 19/92
Introduction Association/causation Building blocks Causal diagrams Why bother? Example Final thoughts
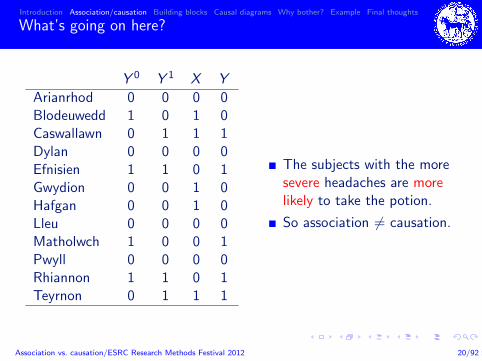
What’s going on here?
Y 0 Y 1 X Y
Arianrhod 0 0 0 0Blodeuwedd 1 0 1 0Caswallawn 0 1 1 1Dylan 0 0 0 0Efnisien 1 1 0 1Gwydion 0 0 1 0Hafgan 0 0 1 0Lleu 0 0 0 0Matholwch 1 0 0 1Pwyll 0 0 0 0Rhiannon 1 1 0 1Teyrnon 0 1 1 1
The subjects with the moresevere headaches are morelikely to take the potion.
So association 6= causation.
Association vs. causation/ESRC Research Methods Festival 2012 20/92
Introduction Association/causation Building blocks Causal diagrams Why bother? Example Final thoughts
Taking severity into account
Suppose we asked each of the 12 subjects at the beginning ofthe study: “is your headache severe?”.
Then, we might propose that, after taking severity intoaccount, the decision as to whether or not to take the potionwas effectively taken at random.
Suppose Z denotes severity. Then, under this assumption,within strata of Z , the exposed and unexposed subjects areexchangeable.
This is called conditional exchangeability (given Z ).
Under conditional exchangeability given Z , association =causation within strata of Z .
Let’s return to the data and look for an association betweenX and Y within strata of Z .
Association vs. causation/ESRC Research Methods Festival 2012 21/92
Introduction Association/causation Building blocks Causal diagrams Why bother? Example Final thoughts
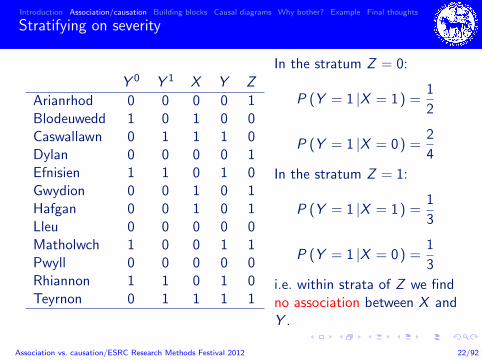
Stratifying on severity
Y 0 Y 1 X Y Z
Arianrhod 0 0 0 0 1Blodeuwedd 1 0 1 0 0Caswallawn 0 1 1 1 0Dylan 0 0 0 0 1Efnisien 1 1 0 1 0Gwydion 0 0 1 0 1Hafgan 0 0 1 0 1Lleu 0 0 0 0 0Matholwch 1 0 0 1 1Pwyll 0 0 0 0 0Rhiannon 1 1 0 1 0Teyrnon 0 1 1 1 1
In the stratum Z = 0:
P (Y = 1 |X = 1) =1
2
P (Y = 1 |X = 0) =2
4
In the stratum Z = 1:
P (Y = 1 |X = 1) =1
3
P (Y = 1 |X = 0) =1
3
i.e. within strata of Z we findno association between X andY .
Association vs. causation/ESRC Research Methods Festival 2012 22/92
Introduction Association/causation Building blocks Causal diagrams Why bother? Example Final thoughts
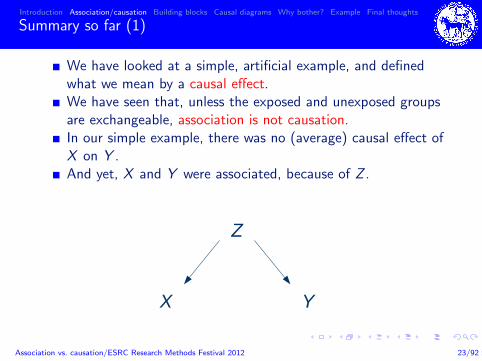
Summary so far (1)
We have looked at a simple, artificial example, and definedwhat we mean by a causal effect.We have seen that, unless the exposed and unexposed groupsare exchangeable, association is not causation.In our simple example, there was no (average) causal effect ofX on Y .And yet, X and Y were associated, because of Z .
X Y
Z
Association vs. causation/ESRC Research Methods Festival 2012 23/92
Introduction Association/causation Building blocks Causal diagrams Why bother? Example Final thoughts
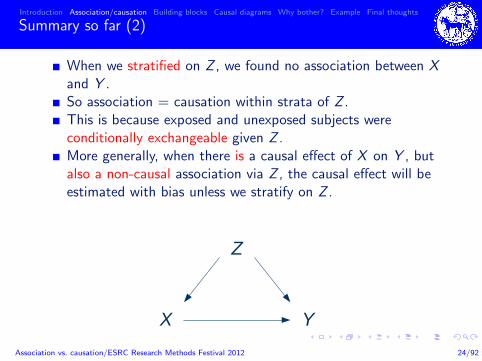
Summary so far (2)
When we stratified on Z , we found no association between Xand Y .So association = causation within strata of Z .This is because exposed and unexposed subjects wereconditionally exchangeable given Z .More generally, when there is a causal effect of X on Y , butalso a non-causal association via Z , the causal effect will beestimated with bias unless we stratify on Z .
X Y
Z
Association vs. causation/ESRC Research Methods Festival 2012 24/92
Introduction Association/causation Building blocks Causal diagrams Why bother? Example Final thoughts
Summary so far (3)
Conditional exchangeability is the key criterion that allows usto make causal statements using observational data.
Thus we need to identify, if possible, a set of variables Z1, Z2,. . . , such that conditional exchangeability holds given these.
In real life, there may be many many candidate Z -variables.
These may be causally inter-related in a very complex way.
Deciding whether or not the exposed and unexposed areconditionally exchangeable given Z1, Z2, . . . requires detailedbackground subject-matter knowledge.
Causal diagrams can help us to use this knowledge todetermine whether or not conditional exchangeability holds.
Association vs. causation/ESRC Research Methods Festival 2012 25/92
Introduction Association/causation Building blocks Causal diagrams Why bother? Example Final thoughts
Outline
1 Introduction: what is causal inference?
2 The difference between association and causation
3 The building blocks of causal diagrams
4 Causal diagrams: a more formal introduction
5 “We can only measure associations”—so why bother?
6 An example: the birthweight “paradox”
7 Final thoughts
Association vs. causation/ESRC Research Methods Festival 2012 26/92

Introduction Association/causation Building blocks Causal diagrams Why bother? Example Final thoughts
How can two variables be associated in the population? (1)
X Y
Two variables X and Y will be associated in the population ifX causes Y .
Association vs. causation/ESRC Research Methods Festival 2012 27/92
Introduction Association/causation Building blocks Causal diagrams Why bother? Example Final thoughts
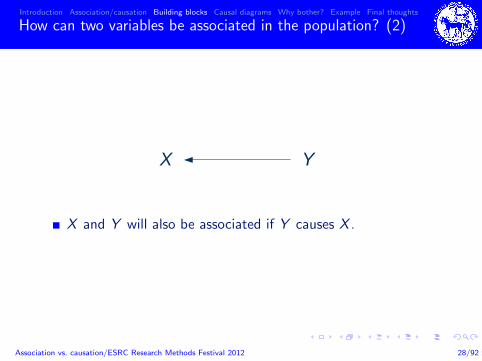
How can two variables be associated in the population? (2)
X Y
X and Y will also be associated if Y causes X .
Association vs. causation/ESRC Research Methods Festival 2012 28/92
Introduction Association/causation Building blocks Causal diagrams Why bother? Example Final thoughts
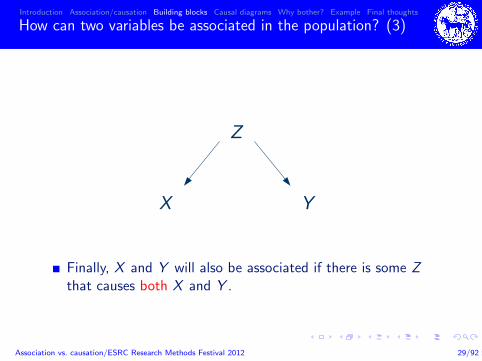
How can two variables be associated in the population? (3)
X Y
Z
Finally, X and Y will also be associated if there is some Zthat causes both X and Y .
Association vs. causation/ESRC Research Methods Festival 2012 29/92
Introduction Association/causation Building blocks Causal diagrams Why bother? Example Final thoughts
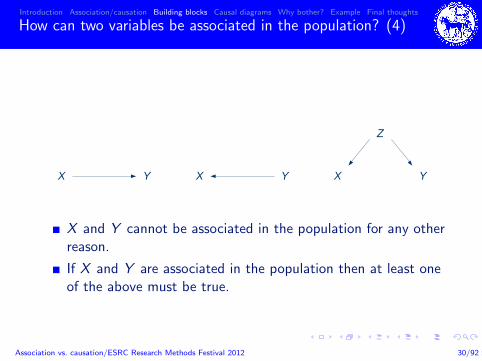
How can two variables be associated in the population? (4)
X Y X Y X Y
Z
X and Y cannot be associated in the population for any otherreason.
If X and Y are associated in the population then at least oneof the above must be true.
Association vs. causation/ESRC Research Methods Festival 2012 30/92
Introduction Association/causation Building blocks Causal diagrams Why bother? Example Final thoughts
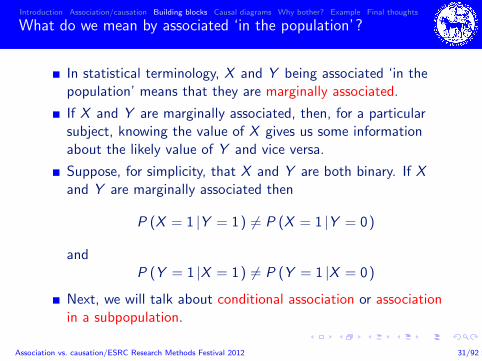
What do we mean by associated ‘in the population’?
In statistical terminology, X and Y being associated ‘in thepopulation’ means that they are marginally associated.
If X and Y are marginally associated, then, for a particularsubject, knowing the value of X gives us some informationabout the likely value of Y and vice versa.
Suppose, for simplicity, that X and Y are both binary. If Xand Y are marginally associated then
P (X = 1 |Y = 1) 6= P (X = 1 |Y = 0)
andP (Y = 1 |X = 1) 6= P (Y = 1 |X = 0)
Next, we will talk about conditional association or associationin a subpopulation.
Association vs. causation/ESRC Research Methods Festival 2012 31/92
Introduction Association/causation Building blocks Causal diagrams Why bother? Example Final thoughts
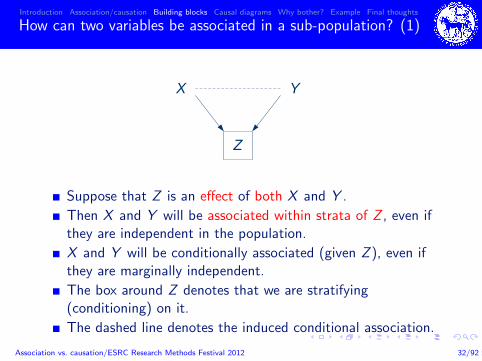
How can two variables be associated in a sub-population? (1)
X Y
Z
Suppose that Z is an effect of both X and Y .
Then X and Y will be associated within strata of Z , even ifthey are independent in the population.
X and Y will be conditionally associated (given Z ), even ifthey are marginally independent.
The box around Z denotes that we are stratifying(conditioning) on it.
The dashed line denotes the induced conditional association.
Association vs. causation/ESRC Research Methods Festival 2012 32/92
Introduction Association/causation Building blocks Causal diagrams Why bother? Example Final thoughts
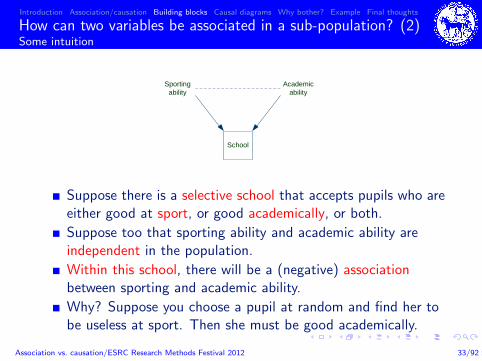
How can two variables be associated in a sub-population? (2)Some intuition
Sportingability
Academicability
School
Suppose there is a selective school that accepts pupils who areeither good at sport, or good academically, or both.
Suppose too that sporting ability and academic ability areindependent in the population.
Within this school, there will be a (negative) associationbetween sporting and academic ability.
Why? Suppose you choose a pupil at random and find her tobe useless at sport. Then she must be good academically.
Association vs. causation/ESRC Research Methods Festival 2012 33/92
Introduction Association/causation Building blocks Causal diagrams Why bother? Example Final thoughts
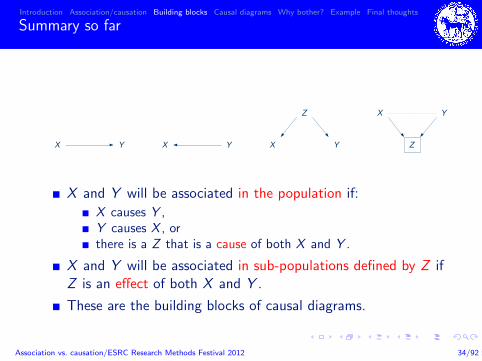
Summary so far
X Y X Y X Y
Z X Y
Z
X and Y will be associated in the population if:
X causes Y ,Y causes X , orthere is a Z that is a cause of both X and Y .
X and Y will be associated in sub-populations defined by Z ifZ is an effect of both X and Y .
These are the building blocks of causal diagrams.
Association vs. causation/ESRC Research Methods Festival 2012 34/92
Introduction Association/causation Building blocks Causal diagrams Why bother? Example Final thoughts
Outline
1 Introduction: what is causal inference?
2 The difference between association and causation
3 The building blocks of causal diagrams
4 Causal diagrams: a more formal introduction
5 “We can only measure associations”—so why bother?
6 An example: the birthweight “paradox”
7 Final thoughts
Association vs. causation/ESRC Research Methods Festival 2012 35/92
Introduction Association/causation Building blocks Causal diagrams Why bother? Example Final thoughts
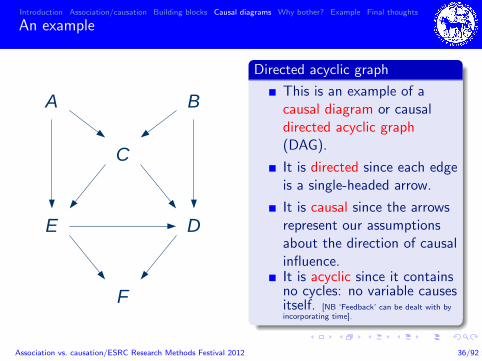
An example
E D
F
C
A B
Directed acyclic graph
This is an example of acausal diagram or causaldirected acyclic graph(DAG).
It is directed since each edgeis a single-headed arrow.
It is causal since the arrowsrepresent our assumptionsabout the direction of causalinfluence.It is acyclic since it containsno cycles: no variable causesitself. [NB ‘Feedback’ can be dealt with byincorporating time].
Association vs. causation/ESRC Research Methods Festival 2012 36/92
Introduction Association/causation Building blocks Causal diagrams Why bother? Example Final thoughts
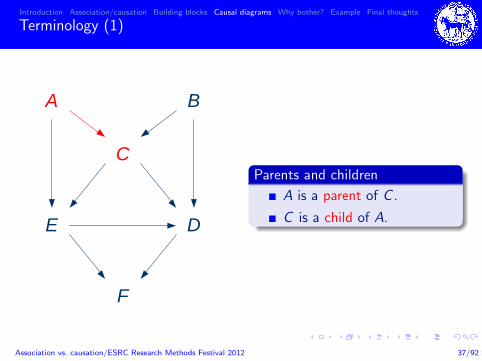
Terminology (1)
E D
F
C
A B
Parents and children
A is a parent of C .
C is a child of A.
Association vs. causation/ESRC Research Methods Festival 2012 37/92
Introduction Association/causation Building blocks Causal diagrams Why bother? Example Final thoughts
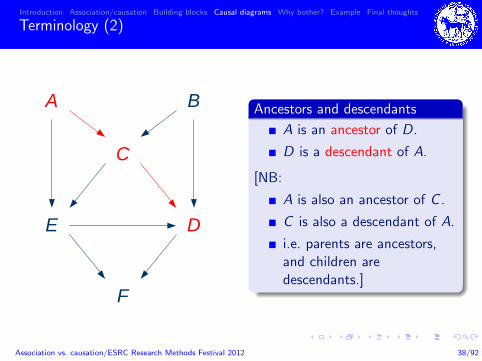
Terminology (2)
E D
F
C
A B Ancestors and descendants
A is an ancestor of D.
D is a descendant of A.
[NB:
A is also an ancestor of C .
C is also a descendant of A.
i.e. parents are ancestors,and children aredescendants.]
Association vs. causation/ESRC Research Methods Festival 2012 38/92
Introduction Association/causation Building blocks Causal diagrams Why bother? Example Final thoughts
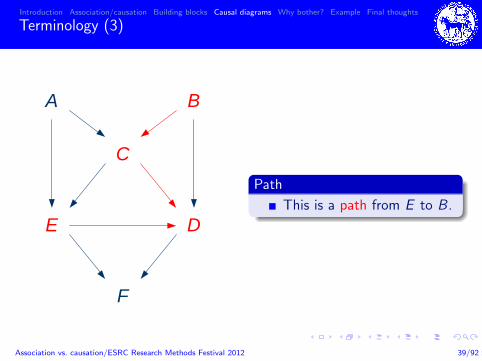
Terminology (3)
E D
F
C
A B
Path
This is a path from E to B.
Association vs. causation/ESRC Research Methods Festival 2012 39/92

Introduction Association/causation Building blocks Causal diagrams Why bother? Example Final thoughts
Terminology (4)
E D
F
C
A B
Directed path
This is a directed path fromA to F (since all arrowspoint ‘forwards’).
Association vs. causation/ESRC Research Methods Festival 2012 40/92

Introduction Association/causation Building blocks Causal diagrams Why bother? Example Final thoughts
Terminology (5)
E D
F
C
A B
Back-door path
This is a back-door pathfrom E to D, since it startswith an arrow into E .
Association vs. causation/ESRC Research Methods Festival 2012 41/92

Introduction Association/causation Building blocks Causal diagrams Why bother? Example Final thoughts
Terminology (6)
E D
F
C
A B
Collider
F is a collider since twoarrow-heads meet at F .
Association vs. causation/ESRC Research Methods Festival 2012 42/92
Introduction Association/causation Building blocks Causal diagrams Why bother? Example Final thoughts
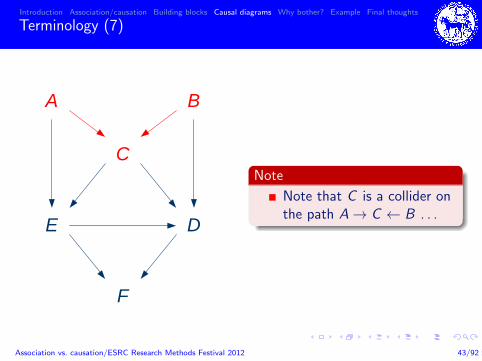
Terminology (7)
E D
F
C
A B
Note
Note that C is a collider onthe path A→ C ← B . . .
Association vs. causation/ESRC Research Methods Festival 2012 43/92
Introduction Association/causation Building blocks Causal diagrams Why bother? Example Final thoughts
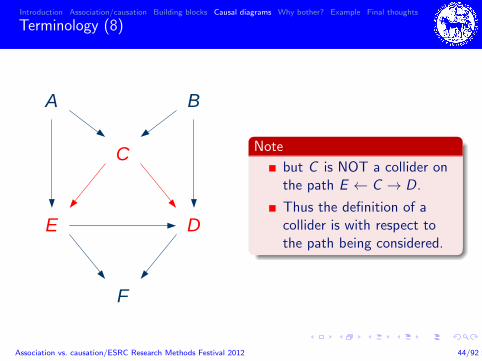
Terminology (8)
E D
F
C
A B
Note
but C is NOT a collider onthe path E ← C → D.
Thus the definition of acollider is with respect tothe path being considered.
Association vs. causation/ESRC Research Methods Festival 2012 44/92
Introduction Association/causation Building blocks Causal diagrams Why bother? Example Final thoughts
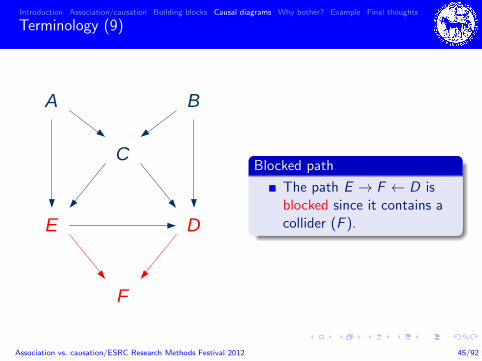
Terminology (9)
E D
F
C
A B
Blocked path
The path E → F ← D isblocked since it contains acollider (F ).
Association vs. causation/ESRC Research Methods Festival 2012 45/92
Introduction Association/causation Building blocks Causal diagrams Why bother? Example Final thoughts
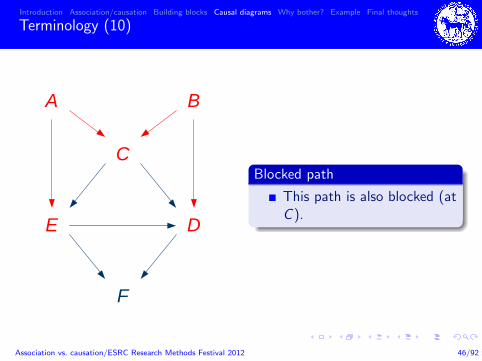
Terminology (10)
E D
F
C
A B
Blocked path
This path is also blocked (atC ).
Association vs. causation/ESRC Research Methods Festival 2012 46/92
Introduction Association/causation Building blocks Causal diagrams Why bother? Example Final thoughts
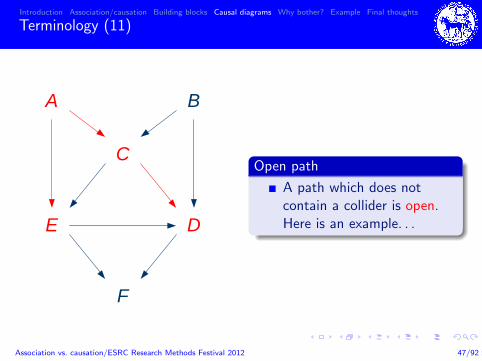
Terminology (11)
E D
F
C
A B
Open path
A path which does notcontain a collider is open.Here is an example. . .
Association vs. causation/ESRC Research Methods Festival 2012 47/92
Introduction Association/causation Building blocks Causal diagrams Why bother? Example Final thoughts
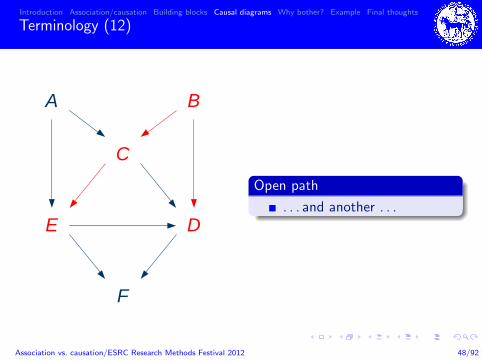
Terminology (12)
E D
F
C
A B
Open path
. . . and another . . .
Association vs. causation/ESRC Research Methods Festival 2012 48/92

Introduction Association/causation Building blocks Causal diagrams Why bother? Example Final thoughts
Terminology (13)
E D
F
C
A B
Open path
. . . and another.
Association vs. causation/ESRC Research Methods Festival 2012 49/92
Introduction Association/causation Building blocks Causal diagrams Why bother? Example Final thoughts
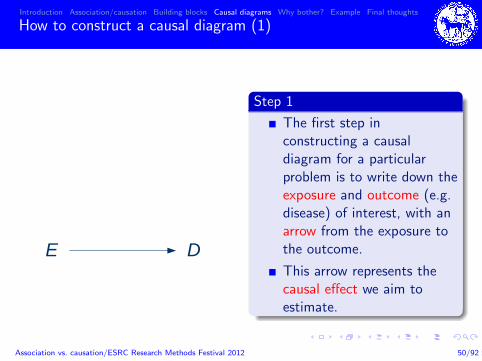
How to construct a causal diagram (1)
E D
Step 1
The first step inconstructing a causaldiagram for a particularproblem is to write down theexposure and outcome (e.g.disease) of interest, with anarrow from the exposure tothe outcome.
This arrow represents thecausal effect we aim toestimate.
Association vs. causation/ESRC Research Methods Festival 2012 50/92
Introduction Association/causation Building blocks Causal diagrams Why bother? Example Final thoughts
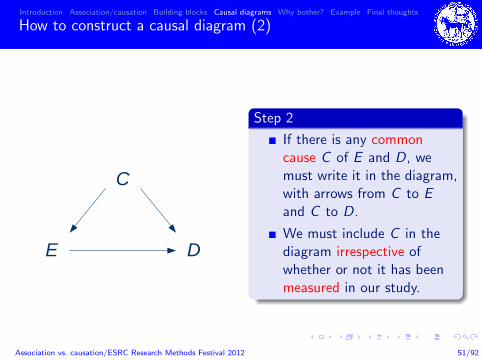
How to construct a causal diagram (2)
E D
C
Step 2
If there is any commoncause C of E and D, wemust write it in the diagram,with arrows from C to Eand C to D.
We must include C in thediagram irrespective ofwhether or not it has beenmeasured in our study.
Association vs. causation/ESRC Research Methods Festival 2012 51/92
Introduction Association/causation Building blocks Causal diagrams Why bother? Example Final thoughts
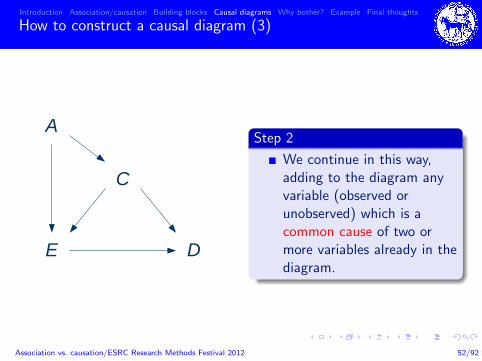
How to construct a causal diagram (3)
E D
C
AStep 2
We continue in this way,adding to the diagram anyvariable (observed orunobserved) which is acommon cause of two ormore variables already in thediagram.
Association vs. causation/ESRC Research Methods Festival 2012 52/92
Introduction Association/causation Building blocks Causal diagrams Why bother? Example Final thoughts
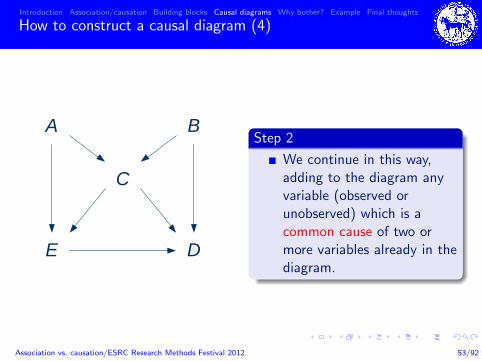
How to construct a causal diagram (4)
E D
C
A BStep 2
We continue in this way,adding to the diagram anyvariable (observed orunobserved) which is acommon cause of two ormore variables already in thediagram.
Association vs. causation/ESRC Research Methods Festival 2012 53/92
Introduction Association/causation Building blocks Causal diagrams Why bother? Example Final thoughts
How to construct a causal diagram (5)
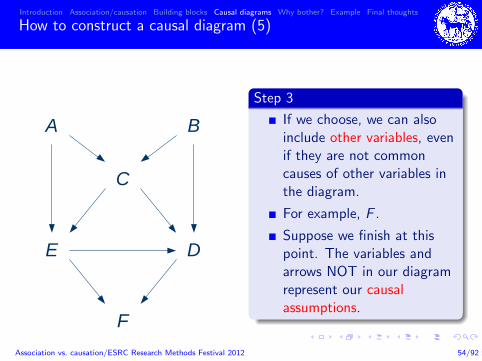
E D
F
C
A BStep 3
If we choose, we can alsoinclude other variables, evenif they are not commoncauses of other variables inthe diagram.
For example, F .
Suppose we finish at thispoint. The variables andarrows NOT in our diagramrepresent our causalassumptions.
Association vs. causation/ESRC Research Methods Festival 2012 54/92
Introduction Association/causation Building blocks Causal diagrams Why bother? Example Final thoughts
How to construct a causal diagram (6)
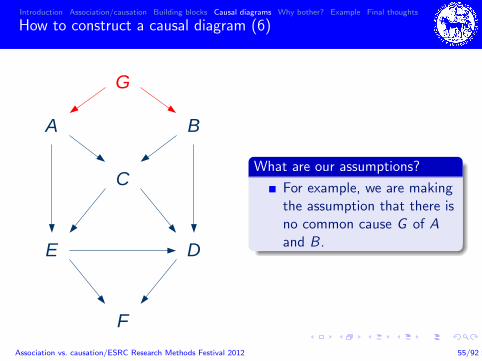
E D
F
C
A B
G
What are our assumptions?
For example, we are makingthe assumption that there isno common cause G of Aand B.
Association vs. causation/ESRC Research Methods Festival 2012 55/92

Introduction Association/causation Building blocks Causal diagrams Why bother? Example Final thoughts
How to construct a causal diagram (7)
E D
F
C
A B
H
What are our assumptions?
And that there is nocommon cause H of A andD.
Association vs. causation/ESRC Research Methods Festival 2012 56/92
Introduction Association/causation Building blocks Causal diagrams Why bother? Example Final thoughts
How to construct a causal diagram (8)
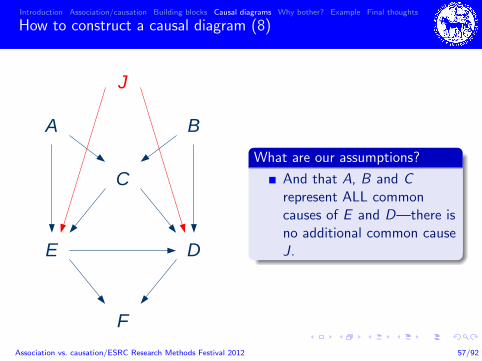
E D
F
C
A B
J
What are our assumptions?
And that A, B and Crepresent ALL commoncauses of E and D—there isno additional common causeJ.
Association vs. causation/ESRC Research Methods Festival 2012 57/92
Introduction Association/causation Building blocks Causal diagrams Why bother? Example Final thoughts
How to construct a causal diagram (9)
E D
F
C
A B
K
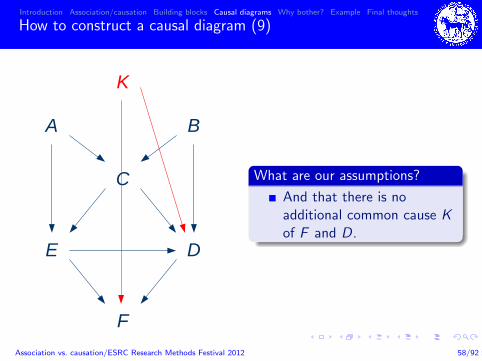
What are our assumptions?
And that there is noadditional common cause Kof F and D.
Association vs. causation/ESRC Research Methods Festival 2012 58/92
Introduction Association/causation Building blocks Causal diagrams Why bother? Example Final thoughts
How to construct a causal diagram (10)
E D
F
C
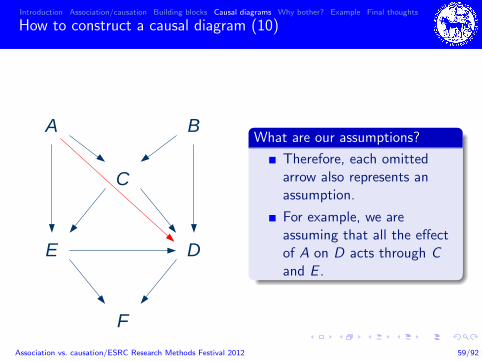
A BWhat are our assumptions?
Therefore, each omittedarrow also represents anassumption.
For example, we areassuming that all the effectof A on D acts through Cand E .
Association vs. causation/ESRC Research Methods Festival 2012 59/92
Introduction Association/causation Building blocks Causal diagrams Why bother? Example Final thoughts
Back-door criterion: is there confounding? (1)
E D
F
C
A B
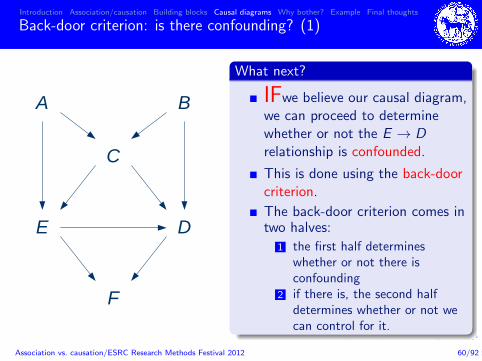
What next?
IFwe believe our causal diagram,we can proceed to determinewhether or not the E → Drelationship is confounded.
This is done using the back-doorcriterion.
The back-door criterion comes intwo halves:
1 the first half determineswhether or not there isconfounding
2 if there is, the second halfdetermines whether or not wecan control for it.
Association vs. causation/ESRC Research Methods Festival 2012 60/92
Introduction Association/causation Building blocks Causal diagrams Why bother? Example Final thoughts
Back-door criterion: is there confounding? (2)
E D
F
C
A B
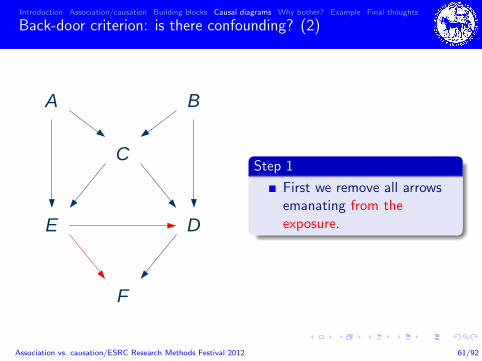
Step 1
First we remove all arrowsemanating from theexposure.
Association vs. causation/ESRC Research Methods Festival 2012 61/92
Introduction Association/causation Building blocks Causal diagrams Why bother? Example Final thoughts
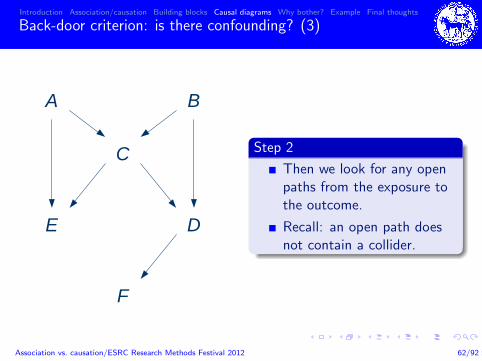
Back-door criterion: is there confounding? (3)
E D
F
C
A B
Step 2
Then we look for any openpaths from the exposure tothe outcome.
Recall: an open path doesnot contain a collider.
Association vs. causation/ESRC Research Methods Festival 2012 62/92
Introduction Association/causation Building blocks Causal diagrams Why bother? Example Final thoughts
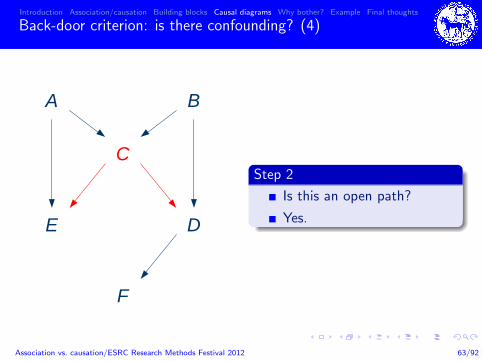
Back-door criterion: is there confounding? (4)
E D
F
C
A B
Step 2
Is this an open path?
Yes.
Association vs. causation/ESRC Research Methods Festival 2012 63/92
Introduction Association/causation Building blocks Causal diagrams Why bother? Example Final thoughts
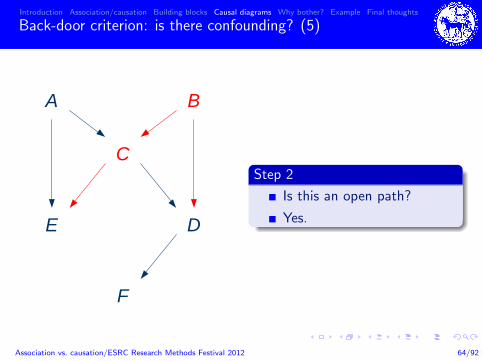
Back-door criterion: is there confounding? (5)
E D
F
C
A B
Step 2
Is this an open path?
Yes.
Association vs. causation/ESRC Research Methods Festival 2012 64/92
Introduction Association/causation Building blocks Causal diagrams Why bother? Example Final thoughts
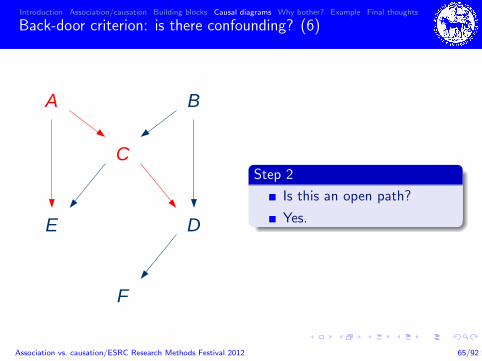
Back-door criterion: is there confounding? (6)
E D
F
C
A B
Step 2
Is this an open path?
Yes.
Association vs. causation/ESRC Research Methods Festival 2012 65/92

Introduction Association/causation Building blocks Causal diagrams Why bother? Example Final thoughts
Back-door criterion: is there confounding? (7)
E D
F
C
A B
Step 2
Is this an open path?
No!
Association vs. causation/ESRC Research Methods Festival 2012 66/92
Introduction Association/causation Building blocks Causal diagrams Why bother? Example Final thoughts
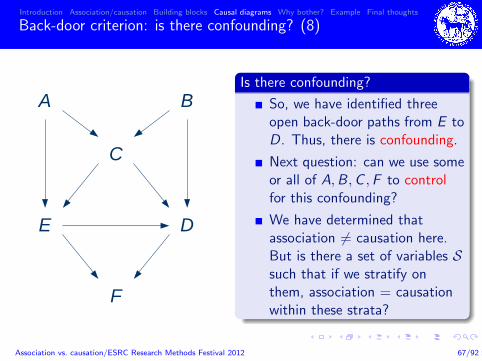
Back-door criterion: is there confounding? (8)
E D
F
C
A BIs there confounding?
So, we have identified threeopen back-door paths from E toD. Thus, there is confounding.
Next question: can we use someor all of A,B,C ,F to controlfor this confounding?
We have determined thatassociation 6= causation here.But is there a set of variables Ssuch that if we stratify onthem, association = causationwithin these strata?
Association vs. causation/ESRC Research Methods Festival 2012 67/92

Introduction Association/causation Building blocks Causal diagrams Why bother? Example Final thoughts
The back-door criterion
The second half of the back-door criterion allows us to determine,based on our causal diagram, whether or not a candidate set ofcovariates is sufficient to control for confounding:
The back-door criterion
(i) First, the candidate set S must not contain any descendantsof the exposure.
(ii) Then, we remove all arrows emanating from the exposure.
(iii) Then, we join with a dotted line any two variables that sharea child which is either itself in S or has a descendant in S.
(iv) Is there an open path from E to D that does not passthrough a member of S?
If NOT, then S is sufficient to control for the confounding.
Let’s try this out on our example.
Association vs. causation/ESRC Research Methods Festival 2012 68/92
Introduction Association/causation Building blocks Causal diagrams Why bother? Example Final thoughts
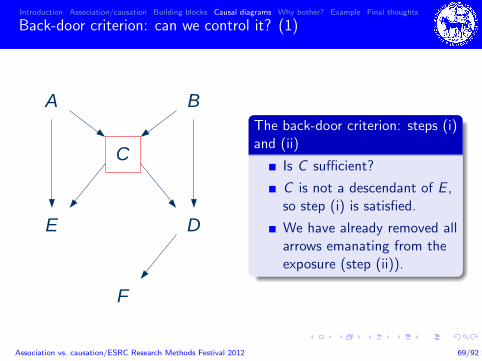
Back-door criterion: can we control it? (1)
E D
F
C
A BThe back-door criterion: steps (i)and (ii)
Is C sufficient?
C is not a descendant of E ,so step (i) is satisfied.
We have already removed allarrows emanating from theexposure (step (ii)).
Association vs. causation/ESRC Research Methods Festival 2012 69/92
Introduction Association/causation Building blocks Causal diagrams Why bother? Example Final thoughts
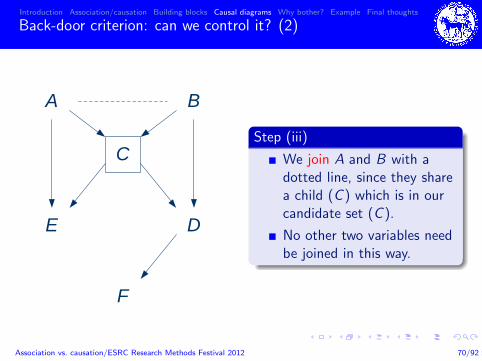
Back-door criterion: can we control it? (2)
E D
F
C
A B
Step (iii)
We join A and B with adotted line, since they sharea child (C ) which is in ourcandidate set (C ).
No other two variables needbe joined in this way.
Association vs. causation/ESRC Research Methods Festival 2012 70/92
Introduction Association/causation Building blocks Causal diagrams Why bother? Example Final thoughts
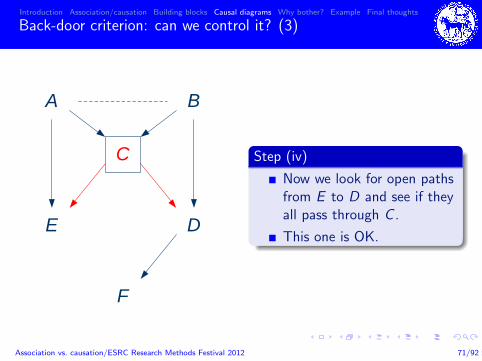
Back-door criterion: can we control it? (3)
E D
F
C
A B
Step (iv)
Now we look for open pathsfrom E to D and see if theyall pass through C .
This one is OK.
Association vs. causation/ESRC Research Methods Festival 2012 71/92

Introduction Association/causation Building blocks Causal diagrams Why bother? Example Final thoughts
Back-door criterion: can we control it? (4)
E D
F
C
A B
Step (iv)
So is this one.
Association vs. causation/ESRC Research Methods Festival 2012 72/92

Introduction Association/causation Building blocks Causal diagrams Why bother? Example Final thoughts
Back-door criterion: can we control it? (5)
E D
F
C
A B
Step (iv)
So is this one.
Association vs. causation/ESRC Research Methods Festival 2012 73/92

Introduction Association/causation Building blocks Causal diagrams Why bother? Example Final thoughts
Back-door criterion: can we control it? (6)
E D
F
C
A B
Step (iv)
BUT, here is an open pathfrom E to D that does NOTpass through C .
So, controlling for C alone isNOT sufficient.
Association vs. causation/ESRC Research Methods Festival 2012 74/92

Introduction Association/causation Building blocks Causal diagrams Why bother? Example Final thoughts
Back-door criterion: can we control it? (7)
E D
F
C
A B
What’s the solution?
We must additionallycontrol for either A. . .
Association vs. causation/ESRC Research Methods Festival 2012 75/92

Introduction Association/causation Building blocks Causal diagrams Why bother? Example Final thoughts
Back-door criterion: can we control it? (8)
E D
F
C
A B
What’s the solution?
. . . or B . . .
Association vs. causation/ESRC Research Methods Festival 2012 76/92
Introduction Association/causation Building blocks Causal diagrams Why bother? Example Final thoughts
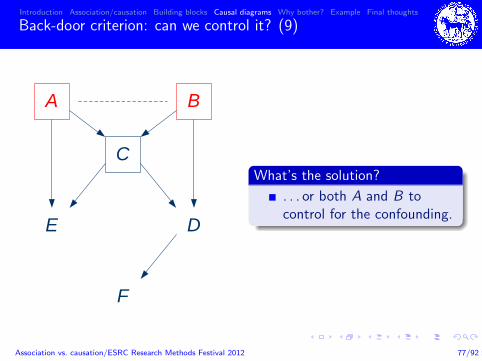
Back-door criterion: can we control it? (9)
E D
F
C
A B
What’s the solution?
. . . or both A and B tocontrol for the confounding.
Association vs. causation/ESRC Research Methods Festival 2012 77/92
Introduction Association/causation Building blocks Causal diagrams Why bother? Example Final thoughts
Outline
1 Introduction: what is causal inference?
2 The difference between association and causation
3 The building blocks of causal diagrams
4 Causal diagrams: a more formal introduction
5 “We can only measure associations”—so why bother?
6 An example: the birthweight “paradox”
7 Final thoughts
Association vs. causation/ESRC Research Methods Festival 2012 78/92
Introduction Association/causation Building blocks Causal diagrams Why bother? Example Final thoughts
Why bother?What has causal inference research (since Rubin 1978) given us? (1)
1 A formal language (counterfactuals, hypotheticalinterventions) so that age-old causal concepts can be naileddown mathematically, eg
causal effectdirect effectindirect effectconfoundingselection biaseffect modification
2 Tools for making explicit the assumptions under which ouranalysis (eg regression) gives estimates that can beinterpreted causally, eg
causal diagrams (DAGs)
Association vs. causation/ESRC Research Methods Festival 2012 79/92

Introduction Association/causation Building blocks Causal diagrams Why bother? Example Final thoughts
Why bother?What has causal inference research (since Rubin 1978) given us? (2)
3 When the assumptions needed for ‘standard’ analyses to becausally-interpretable are too far-fetched, alternative methodshave been proposed that give causally-interpretable estimatesunder a weaker set of assumptions, eg (for problems ofintermediate confounding)
g-computation formulainverse probability weighting of marginal structural modelsg-estimation of structural nested models
[Would this have been possible without 1 & 2?]
4 Sensitivity analyses can be performed to see how robust our(causal) conclusions are to violations of these assumptions[Not possible without explicit assumptions]
Association vs. causation/ESRC Research Methods Festival 2012 80/92

Introduction Association/causation Building blocks Causal diagrams Why bother? Example Final thoughts
Outline
1 Introduction: what is causal inference?
2 The difference between association and causation
3 The building blocks of causal diagrams
4 Causal diagrams: a more formal introduction
5 “We can only measure associations”—so why bother?
6 An example: the birthweight “paradox”
7 Final thoughts
Association vs. causation/ESRC Research Methods Festival 2012 81/92

Introduction Association/causation Building blocks Causal diagrams Why bother? Example Final thoughts
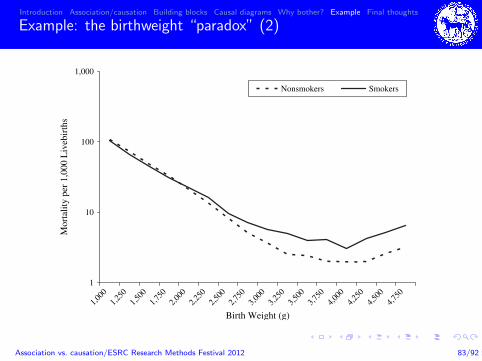
Example: the birthweight “paradox” (1)
Many epidemiological studies from the 1960s onwards foundthat low birthweight (LBW) infants have lower infantmortality in groups in which LBW is most frequent.
“The increase in the incidence of LBW among infants ofsmoking mothers was confirmed. However, a number ofparadoxical findings were observed which raise doubts as tocausation. Thus, no increase in neonatal mortality was noted.Rather, the neonatal mortality rate and the risk of congenitalanomalies of LBW infants were considerably lower for smokingthan for nonsmoking mothers. These favourable resultscannot be explained by differences in gestational age. . . ”(Yerushalmy, AJE 1971)
Association vs. causation/ESRC Research Methods Festival 2012 82/92
Introduction Association/causation Building blocks Causal diagrams Why bother? Example Final thoughts
Example: the birthweight “paradox” (2)
those networks (15, 16), as figure 3 shows. The diagramslink variables (nodes) by arrows (directed edges) that rep-resent direct causal effects (protective or causative) of onevariable on another. DAGs are acyclic because the arrowsnever point from a given variable to any other variable in itspast (i.e., causes precede their effects); thus, one can neverstart from one variable and, following the direction of thearrows, end up at the same variable. The absence of an arrowbetween two variables indicates that the investigator be-lieves there is no direct effect (i.e., a causal effect not me-diated through other variables in the DAG) of one variableon the other (15, 17). In this article, we build upon previouspublications in which investigators used DAGs to show howstandard adjustment (stratification or regression) for vari-ables affected by exposure may create bias by introducinga spurious (noncausal) association between the exposureand the outcome (9, 10, 14).
Figure 3.1 depicts the simplest scenario, in which smok-ing affects mortality solely through a reduction of birthweight. Under this scenario, the crude mortality rate ratiofor smoking would be greater than 1, whereas the adjustedrate ratio and, equivalently, the stratum-specific rate ratiosshould be 1. Therefore, the proposed DAG in figure 3.1 isnot consistent with our findings. Note that there might becommon causes of smoking and infant mortality (e.g., socio-economic factors) that would induce confounding. For sim-plicity, we assume that our analyses are conducted withinlevels of those common causes (i.e., there is complete con-trol for confounding) and thus omit them from the graphs.
Alternatively, smokingmight affect mortality solely throughpathways not mediated by birth weight (figure 3.2). In this
case, the crude and adjusted rate ratios would be the same.Again, this is not consistent with our findings.
Figure 3.3 combines the previous two diagrams: The ef-fect of smoking is only partly mediated by birth weight. Inthis case, the adjusted rate ratio would generally differ fromthe crude rate ratio and from 1 due to the direct (i.e., notmediated by birth weight) effect of smoking on mortality,which is consistent with our findings. Actually, figure 3.3would be consistent with any finding, because figure 3.3 isa complete DAG; that is, it does not impose any restrictionson the values of the stratum-specific rate ratios. As a conse-quence, figure 3.3 is the simplest graphical representationof the theory that there is a qualitative modification of thesmoking effect by birth weight. However, most expertswould agree that figure 3.3 is an overly simplistic represen-tation of nature. In a more realistic yet still naıve causaldiagram (figure 3.4), there would be common causes ofLBW and mortality (e.g., birth defects, malnutrition). Thepresence of these risk factors (U), usually unmeasured bythe investigator, would generally induce a spurious associ-ation between smoking and mortality when the analysis wasstratified on birth weight (10, 14, 18). This (selection) biasmay explain the ‘‘paradox.’’
We now provide a heuristic explanation of why this typeof selection bias arises. To do so, we will use the simplifieddiagram shown in figure 3.5. This new diagram uses birthdefects as the unmeasured variable (U) and includes only thethree arrows that are necessary for the bias to occur: an ar-row from smoking (the exposure) to birth weight (the vari-able that the analysis is being stratified on), an arrow frombirth defects to birth weight, and an arrow from birth defects
1
10
100
1,000
1,000
2,000
3,000
4,000
1,250
2,250
3,250
4,250
1,500
2,500
3,500
4,500
1,750
2,750
3,750
4,750
Birth Weight (g)
Mor
talit
y pe
r 1,
000
Liv
ebir
ths
Nonsmokers Smokers
FIGURE 2. Birth-weight-specific infant mortality curves for infants born to smokers and nonsmokers, United States, 1991 (national linked birth/infant-death data, National Center for Health Statistics).
The Birth Weight ‘‘Paradox’’ 1117
Am J Epidemiol 2006;164:1115–1120
by guest on Septem
ber 28, 2010aje.oxfordjournals.org
Dow
nloaded from
Association vs. causation/ESRC Research Methods Festival 2012 83/92
Introduction Association/causation Building blocks Causal diagrams Why bother? Example Final thoughts
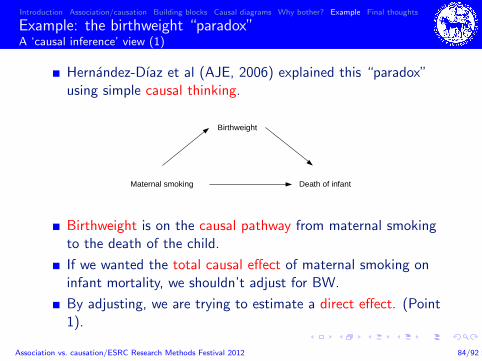
Example: the birthweight “paradox”A ‘causal inference’ view (1)
Hernandez-Dıaz et al (AJE, 2006) explained this “paradox”using simple causal thinking.
Maternal smoking
Birthweight
Death of infant
Birthweight is on the causal pathway from maternal smokingto the death of the child.
If we wanted the total causal effect of maternal smoking oninfant mortality, we shouldn’t adjust for BW.
By adjusting, we are trying to estimate a direct effect. (Point1).
Association vs. causation/ESRC Research Methods Festival 2012 84/92
Introduction Association/causation Building blocks Causal diagrams Why bother? Example Final thoughts
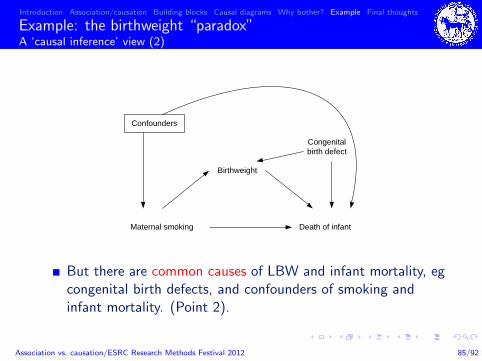
Example: the birthweight “paradox”A ‘causal inference’ view (2)
Maternal smoking
Birthweight
Death of infant
Congenitalbirth defect
Confounders
But there are common causes of LBW and infant mortality, egcongenital birth defects, and confounders of smoking andinfant mortality. (Point 2).
Association vs. causation/ESRC Research Methods Festival 2012 85/92
Introduction Association/causation Building blocks Causal diagrams Why bother? Example Final thoughts
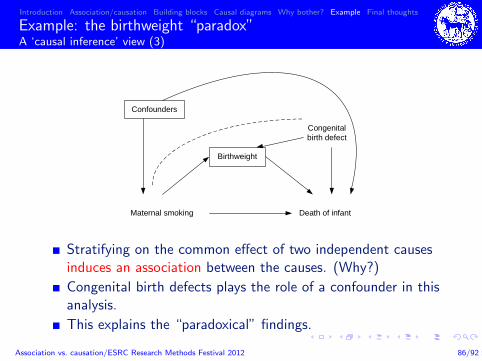
Example: the birthweight “paradox”A ‘causal inference’ view (3)
Maternal smoking
Birthweight
Death of infant
Congenitalbirth defect
Confounders
Stratifying on the common effect of two independent causesinduces an association between the causes. (Why?)
Congenital birth defects plays the role of a confounder in thisanalysis.
This explains the “paradoxical” findings.
Association vs. causation/ESRC Research Methods Festival 2012 86/92
Introduction Association/causation Building blocks Causal diagrams Why bother? Example Final thoughts
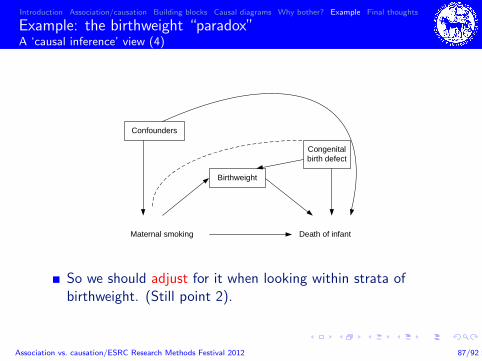
Example: the birthweight “paradox”A ‘causal inference’ view (4)
Maternal smoking
Birthweight
Death of infant
Congenitalbirth defect
Confounders
So we should adjust for it when looking within strata ofbirthweight. (Still point 2).
Association vs. causation/ESRC Research Methods Festival 2012 87/92
Introduction Association/causation Building blocks Causal diagrams Why bother? Example Final thoughts
Example: the birthweight “paradox”A ‘causal inference’ view (5)
Maternal smoking
Birthweight
Death of infant
Congenitalbirth defect
Confounders
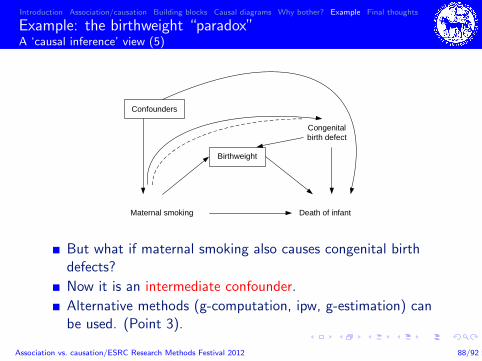
But what if maternal smoking also causes congenital birthdefects?
Now it is an intermediate confounder.
Alternative methods (g-computation, ipw, g-estimation) canbe used. (Point 3).
Association vs. causation/ESRC Research Methods Festival 2012 88/92

Introduction Association/causation Building blocks Causal diagrams Why bother? Example Final thoughts
Example: the birthweight “paradox”A ‘causal inference’ view (6)
Maternal smoking
Birthweight
Death of infant
Congenitalbirth defect
ConfoundersU1
U2
And what if there are other (unmeasured) common causes ofbirthweight and infant mortality?
Sensitivity analyses. (Point 4).
Association vs. causation/ESRC Research Methods Festival 2012 89/92
Introduction Association/causation Building blocks Causal diagrams Why bother? Example Final thoughts
Outline
1 Introduction: what is causal inference?
2 The difference between association and causation
3 The building blocks of causal diagrams
4 Causal diagrams: a more formal introduction
5 “We can only measure associations”—so why bother?
6 An example: the birthweight “paradox”
7 Final thoughts
Association vs. causation/ESRC Research Methods Festival 2012 90/92
Introduction Association/causation Building blocks Causal diagrams Why bother? Example Final thoughts
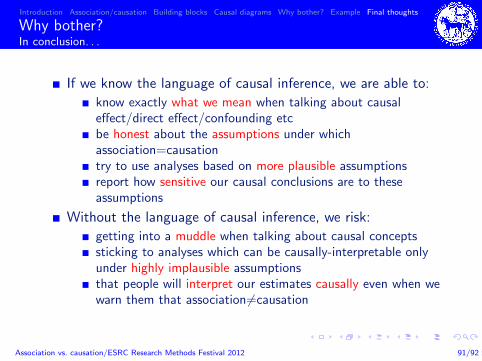
Why bother?In conclusion. . .
If we know the language of causal inference, we are able to:
know exactly what we mean when talking about causaleffect/direct effect/confounding etcbe honest about the assumptions under whichassociation=causationtry to use analyses based on more plausible assumptionsreport how sensitive our causal conclusions are to theseassumptions
Without the language of causal inference, we risk:
getting into a muddle when talking about causal conceptssticking to analyses which can be causally-interpretable onlyunder highly implausible assumptionsthat people will interpret our estimates causally even when wewarn them that association 6=causation
Association vs. causation/ESRC Research Methods Festival 2012 91/92
Introduction Association/causation Building blocks Causal diagrams Why bother? Example Final thoughts
Final thought
Always saying “. . . but association is not causation” islike putting “this product may contain nuts” on allfood packaging.
It’s true and absolves us of all responsibility.
But is it useful? Is it ethical?
Association vs. causation/ESRC Research Methods Festival 2012 92/92