what is the impact of intra-eu migration? are changes to free movement rules needed? wednesday 9...
TRANSCRIPT
What is the impact of intra-EU migration?
Are Changes to Free Movement Rules Needed?
WEDNESDAY 9 SEPTEMBER 2015
Wifi
Account details -
Password -

Chair
Cllr Peter RobinsonLincolnshire County Council
Chair of the East Midlands Strategic Migration Partnership
Other Forms of Migration
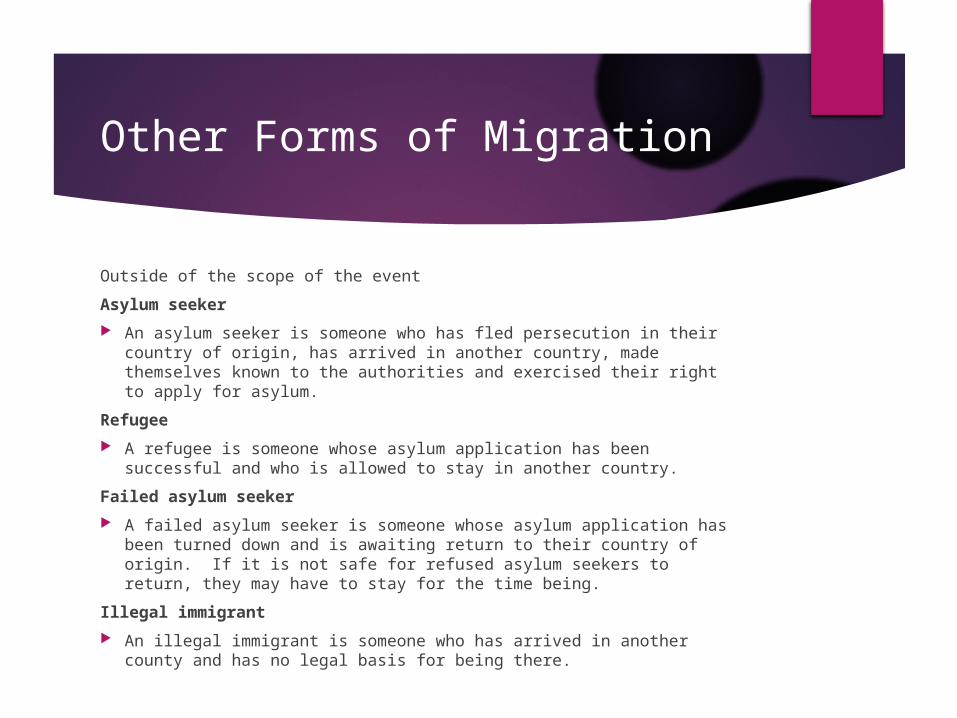
Outside of the scope of the event
Asylum Seeker
An asylum seeker is someone who has fled persecution in their country of origin, has arrived in another country, made themselves known to the authorities and exercised their right to apply for asylum.
Refugee
A refugee is someone whose asylum application has been successful and who is allowed to stay in another country.
Failed asylum seeker
A failed asylum seeker is someone whose asylum application has been turned down and is awaiting return to their country of origin. If it is not safe for refused asylum seekers to return, they may have to stay for the time being.
Illegal Immigrant
An illegal immigrant is someone who has arrived in another country and has no legal basis for being there.
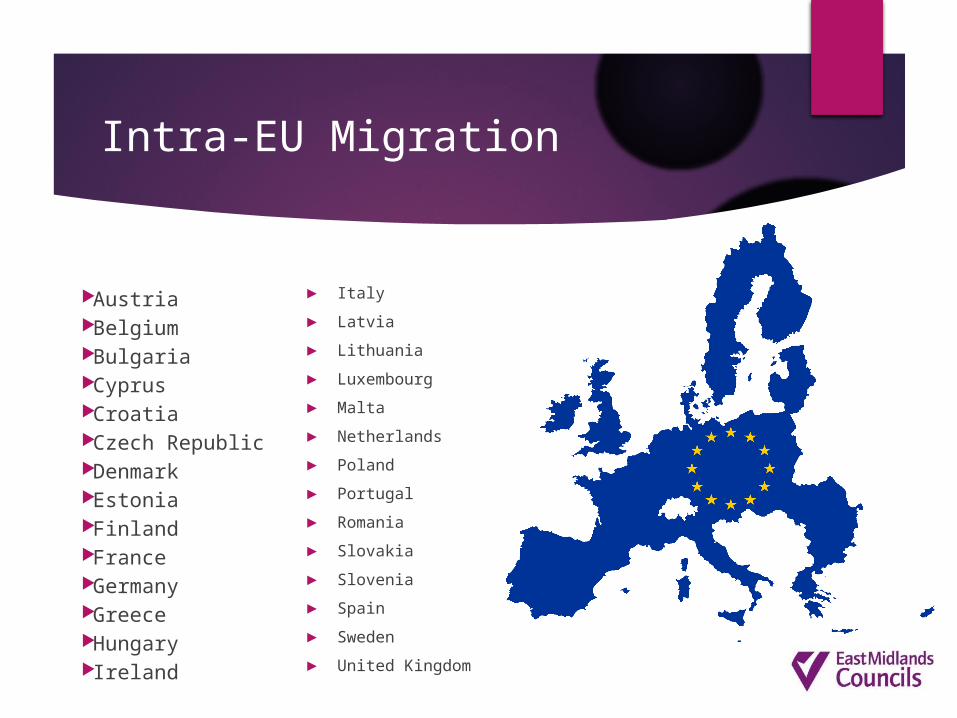
Intra-EU Migration
Austria Belgium Bulgaria Cyprus Croatia Czech Republic Denmark Estonia Finland France Germany Greece Hungary Ireland
► Italy
► Latvia
► Lithuania
► Luxembourg
► Malta
► Netherlands
► Poland
► Portugal
► Romania
► Slovakia
► Slovenia
► Spain
► Sweden
► United Kingdom
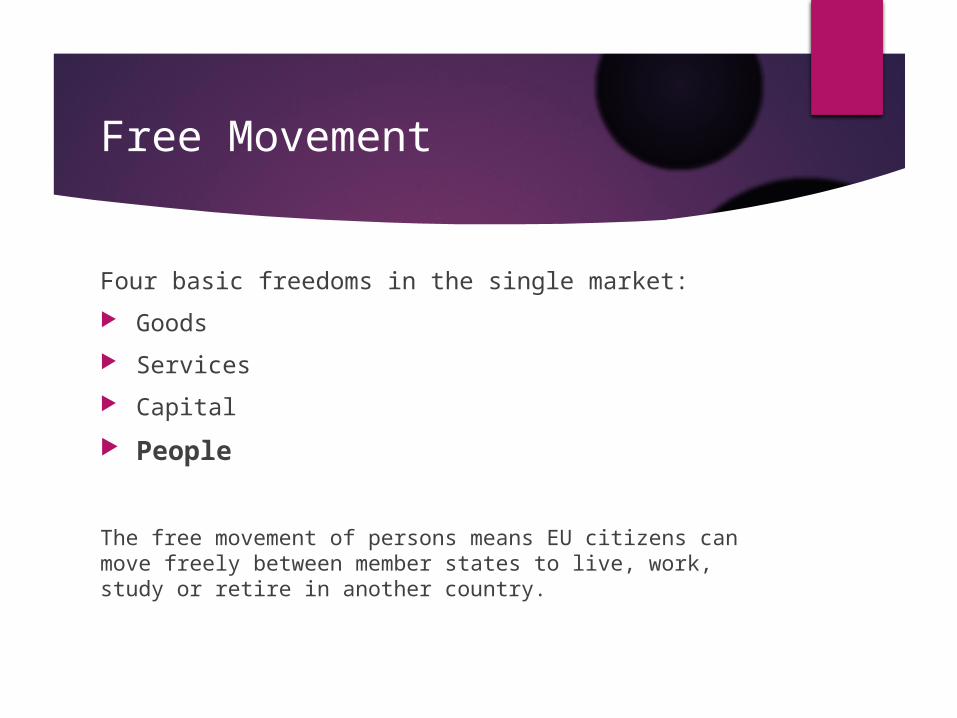
Free Movement
Four basic freedoms in the single market:
Goods
Services
Capital
People
The free movement of persons means EU citizens can move freely between member states to live, work, study or retire in another country.
Other Forms of Migration
Outside of the scope of the event
Asylum seeker
An asylum seeker is someone who has fled persecution in their country of origin, has arrived in another country, made themselves known to the authorities and exercised their right to apply for asylum.
Refugee
A refugee is someone whose asylum application has been successful and who is allowed to stay in another country.
Failed asylum seeker
A failed asylum seeker is someone whose asylum application has been turned down and is awaiting return to their country of origin. If it is not safe for refused asylum seekers to return, they may have to stay for the time being.
Illegal immigrant
An illegal immigrant is someone who has arrived in another county and has no legal basis for being there.
The scale and impact of EU and non-EU migration to the UK and East Midlands
9th September, 2015
Chris LawtonDivision of Economics
Nottingham Business School
Introduction
• ONS migration statistics published on the 27th August indicate a record level of net migration to the UK
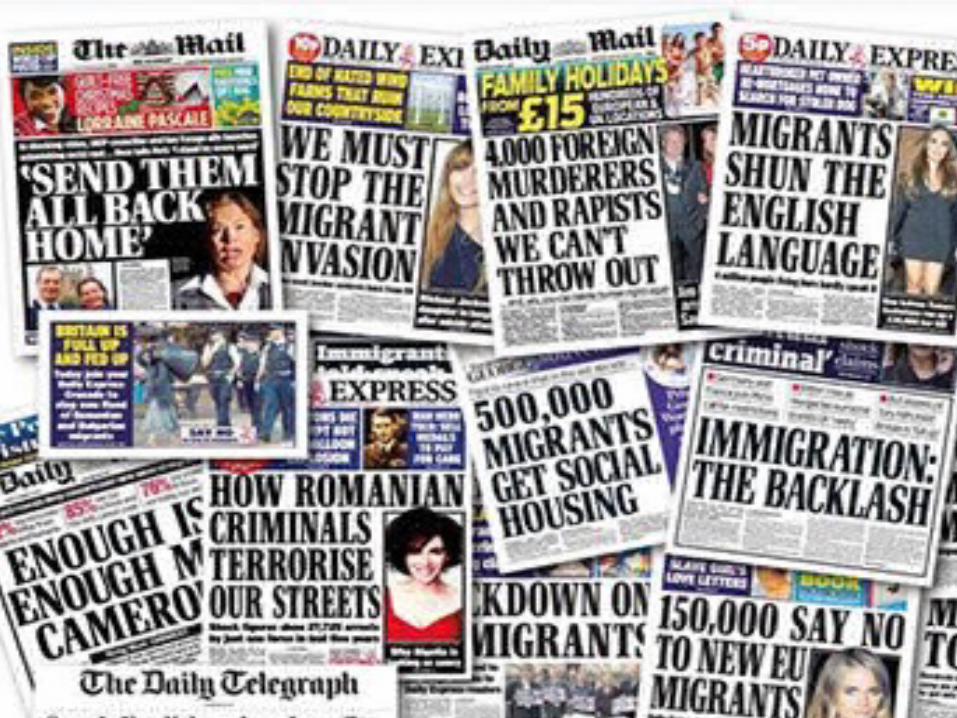
• Media focus on refugee crisis: Calais; the fatalities in the Mediterranean; and cross-EU movements (e.g. Budapest to Munich) - but asylum applications to UK well below 2002 peak
• Refugees/asylum seekers make up a small minority of current immigration inflows and total UK net migration
• Legal precedents, service impacts and economic impacts differ for EU migrants and non-EU economic migrants compared to refugees/asylum seekers

Definitions• Migration: the net balance of immigration less emigration • A migrant is (UN definition): “a person who moves to a country other than
his or her usual residence for a period of at least a year”. Includes:– EU migrants: nationals of an EU Member State are ‘EU citizens’ and thus
have the right of Free Movement within the EU to work, study or retire. Also covers nationals of non-EU member EEA countries (Norway, Iceland and Liechtenstein) and Swiss nationals
– Non-EU migrants: require visas/work permits, allocated on a skill Points Based System (PBS) – Tier 1 (high value); Tier 2 (skilled workers with a job offer); Tier 4 (students). Tier 3 (unskilled) entry routes are not open
– Family members: spouse/children of an EU/EEA citizen who are nationals of a 3rd country or spouse/children of principal visa applicant
– Asylum granted to those applicants who meet the criteria for refugee status in the view of the UK Government (+ other forms of protection)
– Illegal immigrants: illegal migrants will all be from non-EU countries. May subsequently claim asylum. A very small minority of migrants
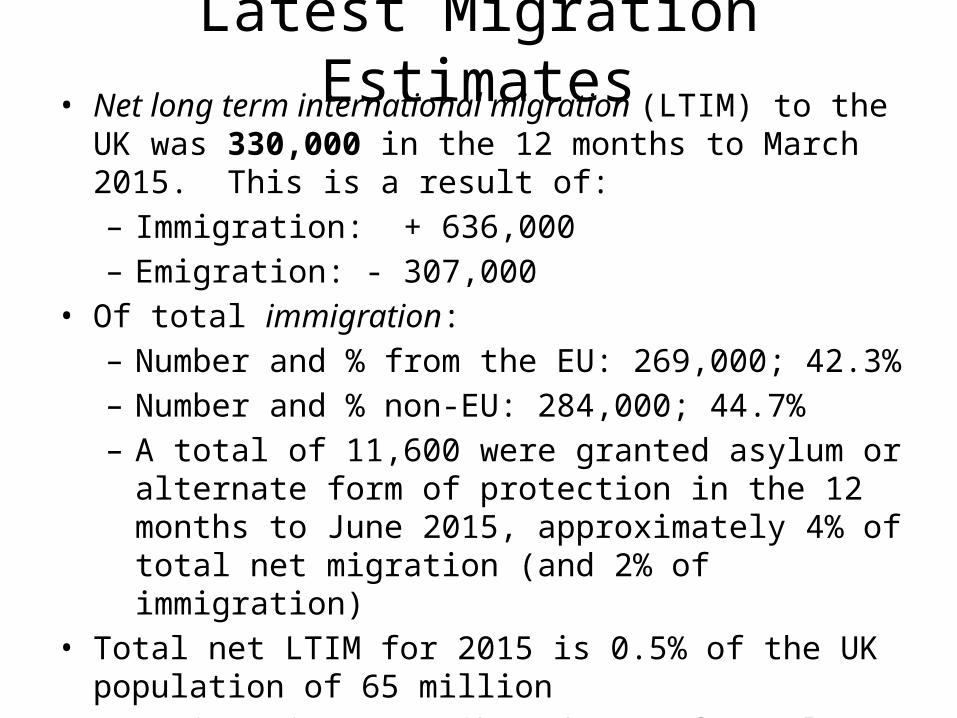
Latest Migration Estimates• Net long term international migration (LTIM) to the UK was
330,000 in the 12 months to March 2015. This is a result of:– Immigration: + 636,000– Emigration: - 307,000
• Of total immigration:– Number and % from the EU: 269,000; 42.3%– Number and % non-EU: 284,000; 44.7%– A total of 11,600 were granted asylum or alternate form of
protection in the 12 months to June 2015, approximately 4% of total net migration (and 2% of immigration)
• Total net LTIM for 2015 is 0.5% of the UK population of 65 million
• Net migration contributed 53% of total UK population growth between mid-2013 and mid-2014 (compared to natural change)
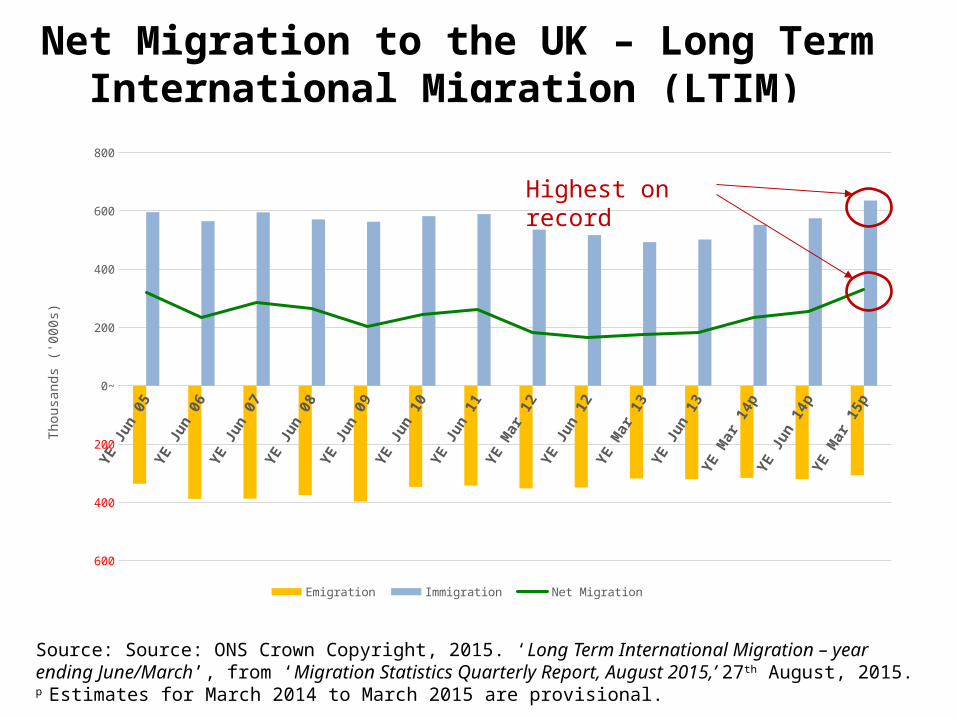
Net Migration to the UK – Long Term International Migration (LTIM)
Source: Source: ONS Crown Copyright, 2015. ‘Long Term International Migration – year ending June/March’, from ‘Migration Statistics Quarterly Report, August 2015,’ 27th August, 2015.p Estimates for March 2014 to March 2015 are provisional.
YE Ju
n 05
YE Ju
n 06
YE Ju
n 07
YE Ju
n 08
YE Ju
n 09
YE Ju
n 10
YE Ju
n 11
YE M
ar 1
2
YE Ju
n 12
YE M
ar 1
3
YE Ju
n 13
YE M
ar 1
4p
YE Ju
n 14
pYE
Mar
15p
600
400
200
0~
200
400
600
800
Emigration Immigration Net Migration
Thou
sand
s ('0
00s)
Highest on record

Mar-12 Jun-12 Sep-12 Dec-12 Mar-13 Jun-13 Sep-13 Dec-13 Mar 14p Jun 14p Sep 14p Dec 14p Mar 15p
- 100
- 50
+ 50
+ 100
+ 150
+ 200
+ 250
+ 300
+ 350
+ 400
Total British EU Total EU15 EU8 Non-EU
Source: Source: ONS Crown Copyright, 2015. ‘Long Term International Net Migration by Citizenship’, from ‘Migration Statistics Quarterly Report, August 2015,’ 27th August, 2015.p Estimates for March 2014 to March 2015 are provisional.
Net LTIM by Citizenship
Highest on record
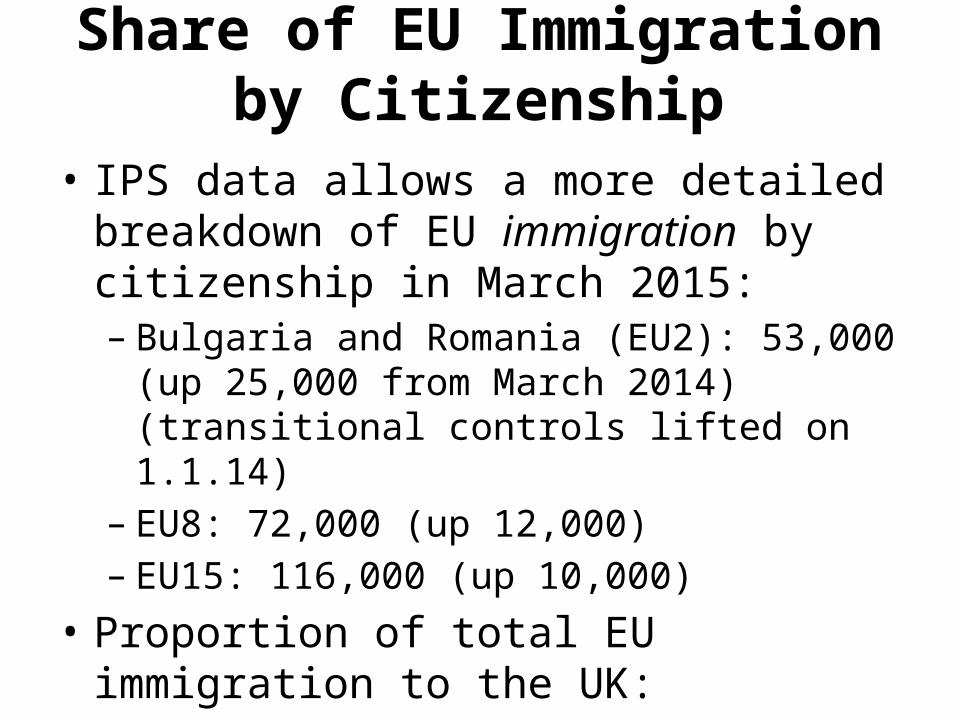
Share of EU Immigration by Citizenship
• IPS data allows a more detailed breakdown of EU immigration by citizenship in March 2015: – Bulgaria and Romania (EU2): 53,000 (up 25,000 from
March 2014) (transitional controls lifted on 1.1.14)– EU8: 72,000 (up 12,000)– EU15: 116,000 (up 10,000)
• Proportion of total EU immigration to the UK:– EU2: 22% (up from 14% in 2014)– EU8: 30% (down from 31%)– EU15: 48% (down from 55%)

Reasons for Migration (Net LTIM)YE
Mar
12
YE Ju
n 12
YE Se
p 12
YE D
ec 1
2
YE M
ar 1
3
YE Ju
n 13
YE Se
p 13
YE D
ec 1
3
YE M
ar 1
4p
YE Ju
n 14
p
YE Se
p 14
p
YE D
ec 1
4p
YE M
ar 1
5p
- 50
+ 50
+ 100
+ 150
+ 200
+ 250
+ 300
+ 350
All Reasons All Work-Related Definite Job Looking for Work Accompany/Join Family Formal Study
Other
Source: Source: ONS Crown Copyright, 2015. ‘Long Term International Net Migration by Main Reason for Migration’, from ‘Migration Statistics Quarterly Report, August 2015’ 27th August, 2015.p Estimates for March 2014 to March 2015 are provisional.
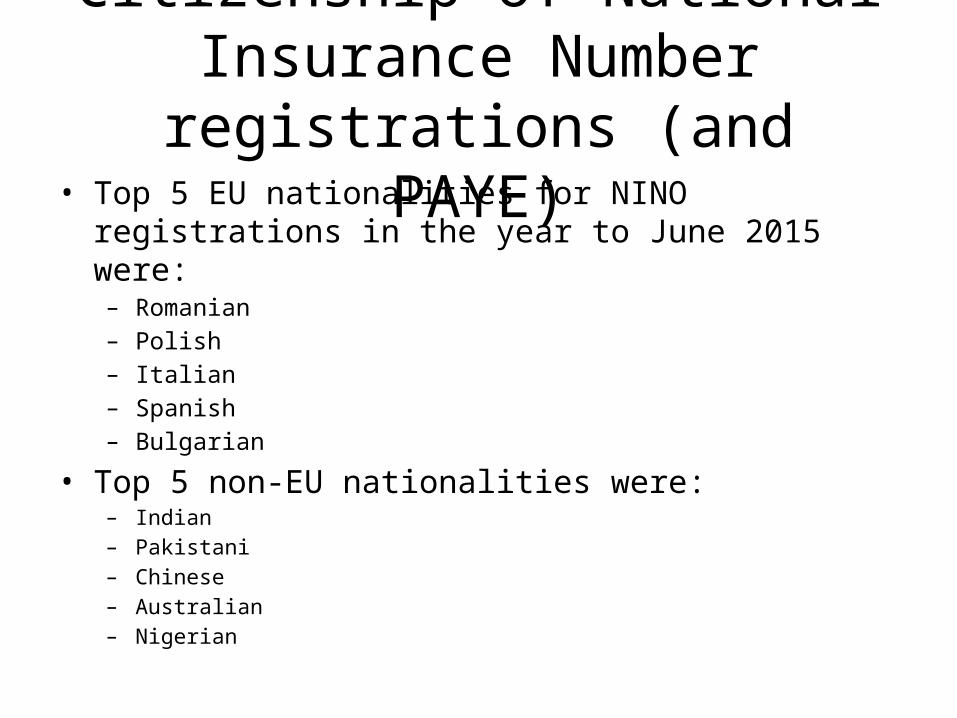
Citizenship of National Insurance Number registrations (and PAYE)
• Top 5 EU nationalities for NINO registrations in the year to June 2015 were:– Romanian– Polish– Italian– Spanish– Bulgarian
• Top 5 non-EU nationalities were: – Indian– Pakistani– Chinese– Australian – Nigerian

Employment Rates
TotalUK
Non-UK
Total EU
EU15EU8
EU2
Total non-EU
Africa
excl. S
A
South Africa
Australia
and New Zealand
India
Pakistan and Bangladesh USA
Rest of t
he World
40
50
60
70
80
90
100
April-June 2013 April-June 2015
% in
em
ploy
men
t, a
ged
16-6
4
Source: ONS Crown Copyright, 2015. ‘Table 8: Employment levels and rates by country of birth and nationality’ from ‘Labour Market Statistics, August 2015’, 12th August, 2015.
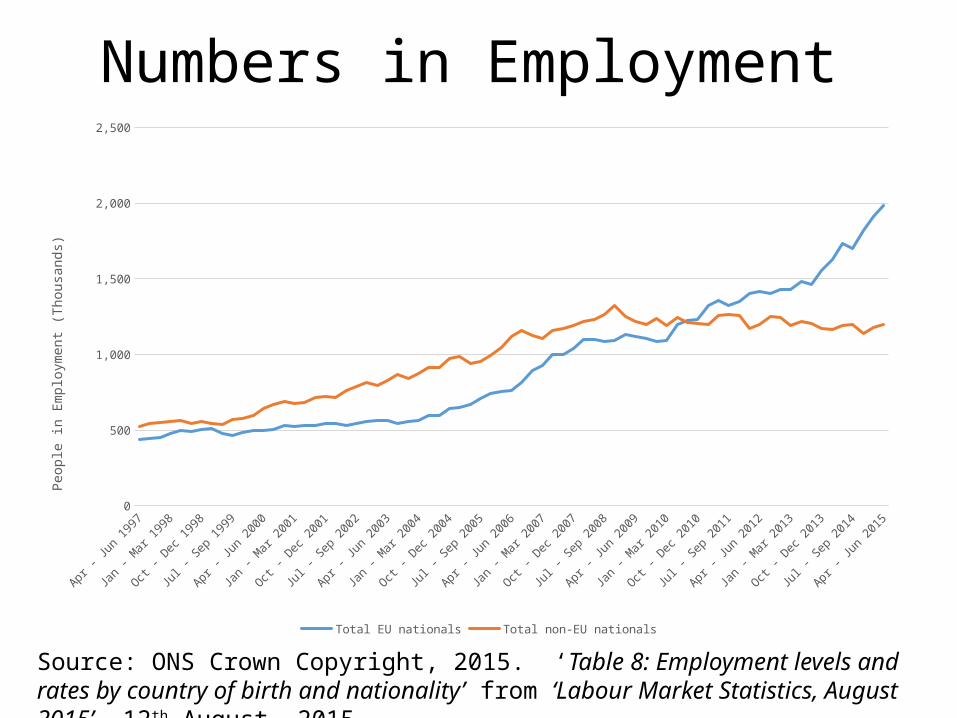
Numbers in Employment
Apr - Ju
n 1997
Oct - D
ec 1997
Apr - Ju
n 1998
Oct - D
ec 1998
Apr - Ju
n 1999
Oct - D
ec 1999
Apr - Ju
n 2000
Oct - D
ec 2000
Apr - Ju
n 2001
Oct - D
ec 2001
Apr - Ju
n 2002
Oct - D
ec 2002
Apr - Ju
n 2003
Oct - D
ec 2003
Apr - Ju
n 2004
Oct - D
ec 2004
Apr - Ju
n 2005
Oct - D
ec 2005
Apr - Ju
n 2006
Oct - D
ec 2006
Apr - Ju
n 2007
Oct - D
ec 2007
Apr - Ju
n 2008
Oct - D
ec 2008
Apr - Ju
n 2009
Oct - D
ec 2009
Apr - Ju
n 2010
Oct - D
ec 2010
Apr - Ju
n 2011
Oct - D
ec 2011
Apr - Ju
n 2012
Oct - D
ec 2012
Apr - Ju
n 2013
Oct - D
ec 2013
Apr - Ju
n 2014
Oct - D
ec 2014
Apr - Ju
n 20150
500
1,000
1,500
2,000
2,500
Total EU nationals Total non-EU nationals
Peop
le in
Em
ploy
men
t (Th
ousa
nds)
Source: ONS Crown Copyright, 2015. ‘Table 8: Employment levels and rates by country of birth and nationality’ from ‘Labour Market Statistics, August 2015’, 12th August, 2015.

Push/Pull factors• To understand migration flows: push/pull factors that encourage an
individual to leave their country of origin (push) and choose a given destination country (pull)
• If work-related reasons account for the largest share of EU immigration, welfare/benefit considerations are unlikely to be the most significant factor
• Post Financial Crisis, big differences in EU labour markets• Eurostat employment rate for Jan-March 2015 in the UK was 72.4%:
– Italy – 55.5%– Spain - 56.4% – Romania – 59.1%– Bulgaria – 61%– Poland – 61.9%
• This is likely to also be reflected in wage differentials• UK demand for labour in certain sectors (skills gaps in health, social care, IT
etc., Higher Education etc.)• Demographic factors: ageing population compared to some origin countries

What is ‘Free Movement’• Right of all EU ‘citizens’ (automatically granted to EU or EEA nationals)• 1992 Treaty of Maastricht formally linked the ideas of EU citizenship to
free movement• One of the key aspects of EU economic integration:
– Free movement of goods and services (as in a trade agreement);– Free movement of the means of production – capital and labour; plus– Service providers and service recipients (e.g. students)
• Equals free movement to work, study or retire• Citizens of new EU member states automatically become EU citizens• Schengen Agreement – common visa policy and free passage across
borders of participating member states (the UK and Ireland opt-out) • In theory, free movement is reciprocal and continent wide: without
significant disparities in push/pull factors, should equal a circular flow or churn within the EU
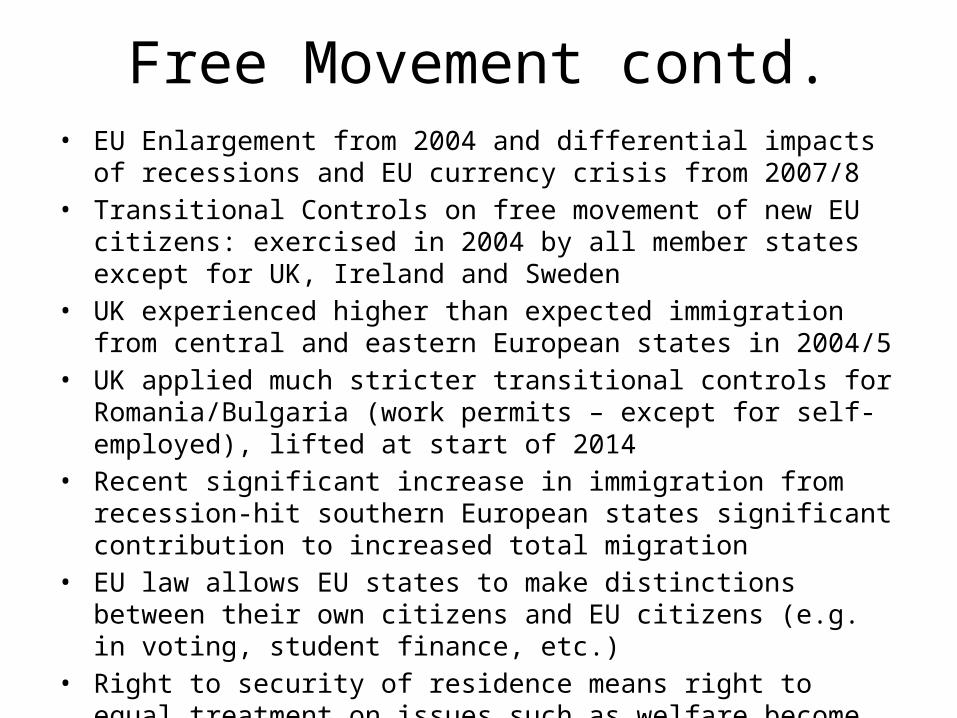
Free Movement contd.• EU Enlargement from 2004 and differential impacts of recessions and EU
currency crisis from 2007/8• Transitional Controls on free movement of new EU citizens: exercised in
2004 by all member states except for UK, Ireland and Sweden• UK experienced higher than expected immigration from central and
eastern European states in 2004/5• UK applied much stricter transitional controls for Romania/Bulgaria (work
permits – except for self-employed), lifted at start of 2014• Recent significant increase in immigration from recession-hit southern
European states significant contribution to increased total migration• EU law allows EU states to make distinctions between their own citizens
and EU citizens (e.g. in voting, student finance, etc.)• Right to security of residence means right to equal treatment on issues
such as welfare become stronger the longer an individual resides in a country. Recent Trend in UK practice of imposing additional barriers may be “skating on thin legal ice” regarding welfare law
Impacts on the East Midlands

Total Population Growth by English Region, 2004-2014 (%)
Source: ONS Crown Copyright, 2015. ‘Mid-year Population Estimates’, 2004-2014, from NOMIS [accessed 8th September, 2015].
0
2
4
6
8
10
12
14
16
%
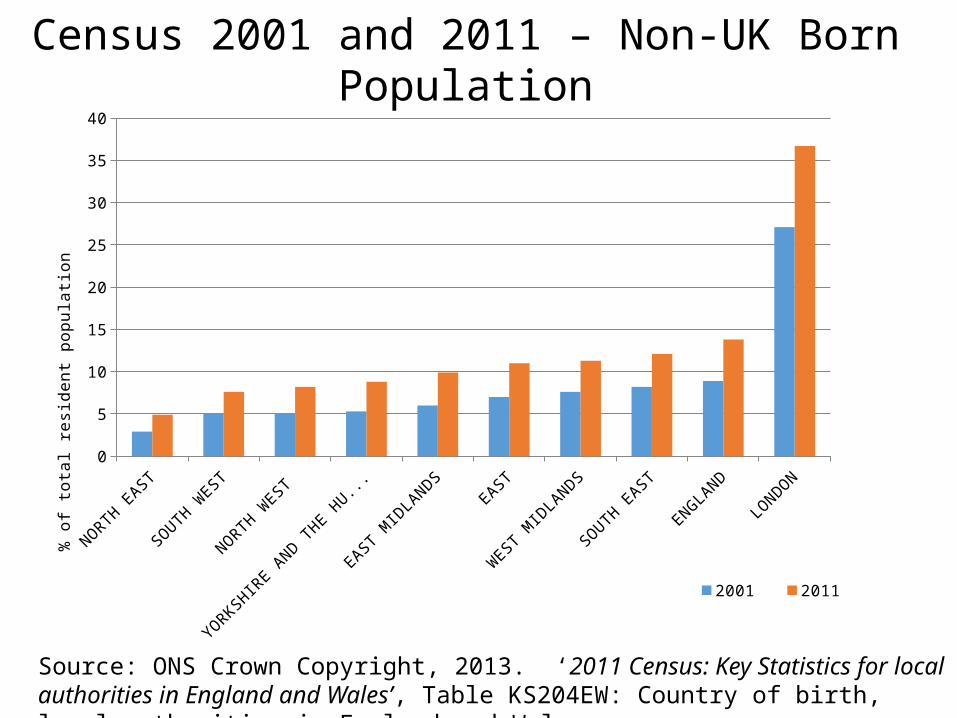
Census 2001 and 2011 – Non-UK Born Population
Source: ONS Crown Copyright, 2013. ‘2011 Census: Key Statistics for local authorities in England and Wales’, Table KS204EW: Country of birth, local authorities in England and Wales.
NORTH EAST
SOUTH W
EST
NORTH WEST
YORKSHIRE AND THE H
UMBER
EAST M
IDLA
NDSEAST
WEST
MID
LANDS
SOUTH EAST
ENGLAND
LONDON
0
5
10
15
20
25
30
35
40
2001 2011
% o
f tot
al r
esid
ent p
opul
ation

Numbers in Employment: East Midlands
Jan 2004-Dec 2004
Jan 2005-Dec 2005
Jan 2006-Dec 2006
Jan 2007-Dec 2007
Jan 2008-Dec 2008
Jan 2009-Dec 2009
Jan 2010-Dec 2010
Jan 2011-Dec 2011
Jan 2012-Dec 2012
Jan 2013-Dec 2013
Jan 2014-Dec 2014
0
20,000
40,000
60,000
80,000
100,000
120,000
140,000
160,000
White not UK national Ethnic minority not UK national
Source: ONS Crown Copyright, 2015. ‘Annual Population Survey’, January-December 2004 to January-December 2014, from NOMIS [accessed 8th September, 2015].
Research on the Impacts of Migration
• Significant body of recent academic and public-sector research exploring:– Fiscal impacts (contributions in taxation less value
of benefits and services)– Labour market impacts• ‘Displacement’ of native workers into unemployment?• ‘Dampening’ of average wages or the wages of UK-born
workers?
– Economic impacts (contribution to GDP)

Fiscal Impacts• Research by Institute for Fiscal Studies (IFS), University College London, and the
Office for Budgetary Responsibility (OBR):– Migrants, having a younger age profile than non-migrants (and less likely to
have dependents) + higher employment rates generally leads to a positive net fiscal contribution;
– The OBR estimates that, without migration, the UK net public sector debt would rise from 74% of GDP in 2012 to 187% in 50 years’ time (above the current national debt of Greece);
– UCL estimate that recent migrants (post-2001) and those from EU-countries were be 45% less likely than non-migrants to receive state benefits or tax credits; and
– Between 2001 and 2011, recent EU migrants contributed 34% more to the fiscal system than they took out in benefits, tax credits and services. UK natives and established non-EU migrants (pre-2001), because of their older age profiles (and greater likelihood of dependents/lower employment rate), contributed 11% less in taxes than the value of the benefits and services they received.

Labour Market Impacts• Research tests the following hypotheses:– According to mainstream economic theory, the labour
market will adjust to an increase in labour supply in the long-run, and will return to equilibrium employment levels and wages
– But different skill levels between migrants compared to non-migrants may, in the short-run, cause non-migrants to be displaced into unemployment and/or average wages to fall
– There is not a fixed number of jobs in the economy: one additional migrant in employment does not necessarily lead to one less job available for a UK native
Labour Market Impacts contd.• Home Office/BIS research (March 2014):
– No evidence of displacement or wage dampening prior to 2008, even following significant increase in net-migration after 2004 EU enlargement. Employment levels of migrants and non-migrants increased
– As the recession impacted on the UK labour market in the latter half of 2008, employment levels for UK-born workers and non-EU migrants fell up to 2012
– Employment levels of EU-migrants recovered from 2009– From 2012, employment levels of UK-born and non-EU migrants began to increase.
Employment levels for UK-born workers grew more strongly than for migrants between 2012 and 2013
– Therefore, the cross-departmental study concluded that:
during periods of overall economic growth, there was little or no evidence of displacement – the labour market adjusted rapidly to any increase in supply;
in periods of recession, if this also coincided with high volumes of net migration, there may be some instances of displacement (both for UK and non-EU workers) – with EU workers being particularly resilient.
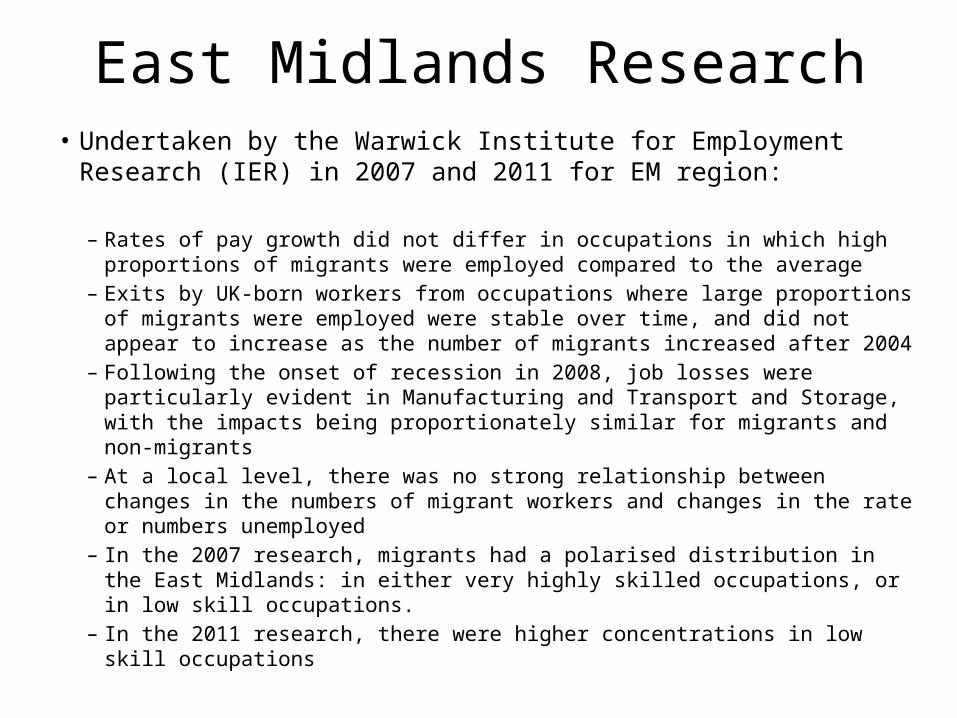
East Midlands Research• Undertaken by the Warwick Institute for Employment Research
(IER) in 2007 and 2011 for EM region:
– Rates of pay growth did not differ in occupations in which high proportions of migrants were employed compared to the average
– Exits by UK-born workers from occupations where large proportions of migrants were employed were stable over time, and did not appear to increase as the number of migrants increased after 2004
– Following the onset of recession in 2008, job losses were particularly evident in Manufacturing and Transport and Storage, with the impacts being proportionately similar for migrants and non-migrants
– At a local level, there was no strong relationship between changes in the numbers of migrant workers and changes in the rate or numbers unemployed
– In the 2007 research, migrants had a polarised distribution in the East Midlands: in either very highly skilled occupations, or in low skill occupations.
– In the 2011 research, there were higher concentrations in low skill occupations
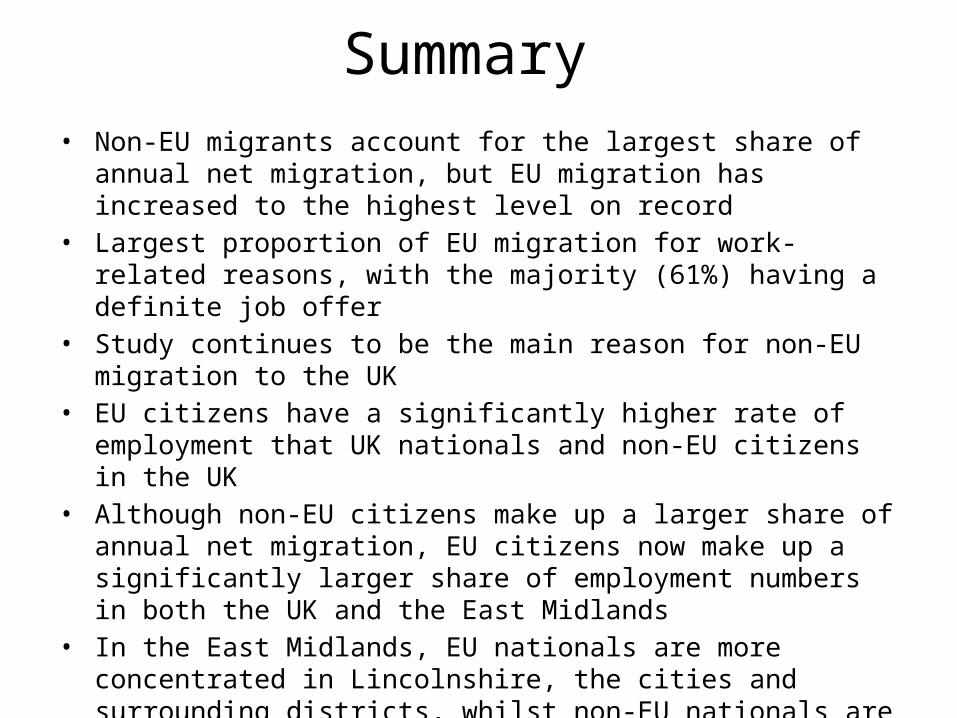
Summary• Non-EU migrants account for the largest share of annual net migration,
but EU migration has increased to the highest level on record• Largest proportion of EU migration for work-related reasons, with the
majority (61%) having a definite job offer• Study continues to be the main reason for non-EU migration to the UK• EU citizens have a significantly higher rate of employment that UK
nationals and non-EU citizens in the UK• Although non-EU citizens make up a larger share of annual net migration,
EU citizens now make up a significantly larger share of employment numbers in both the UK and the East Midlands
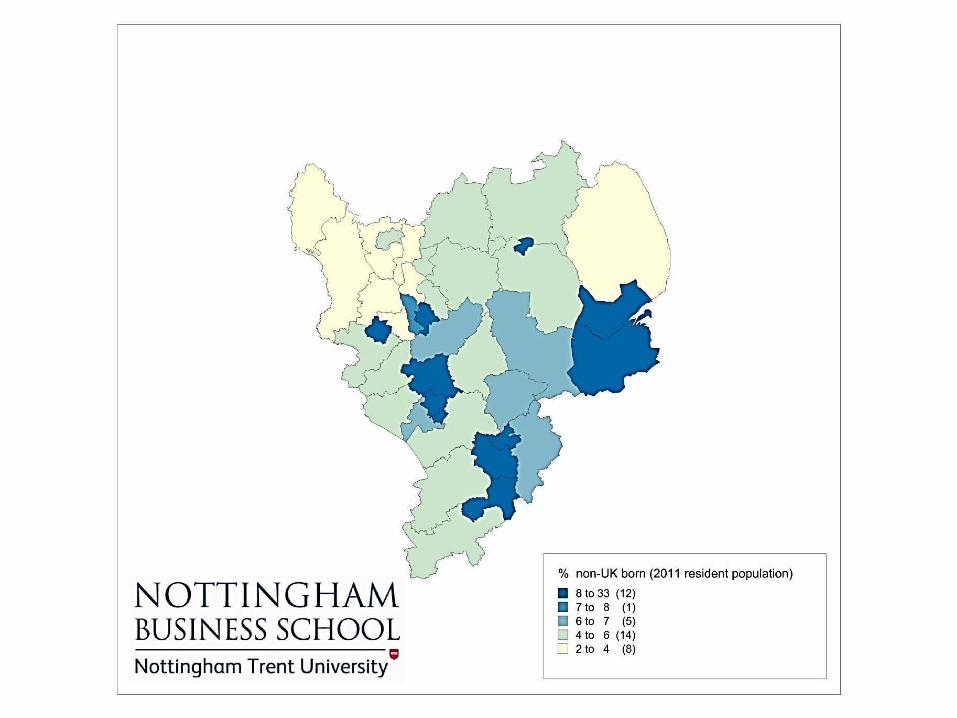
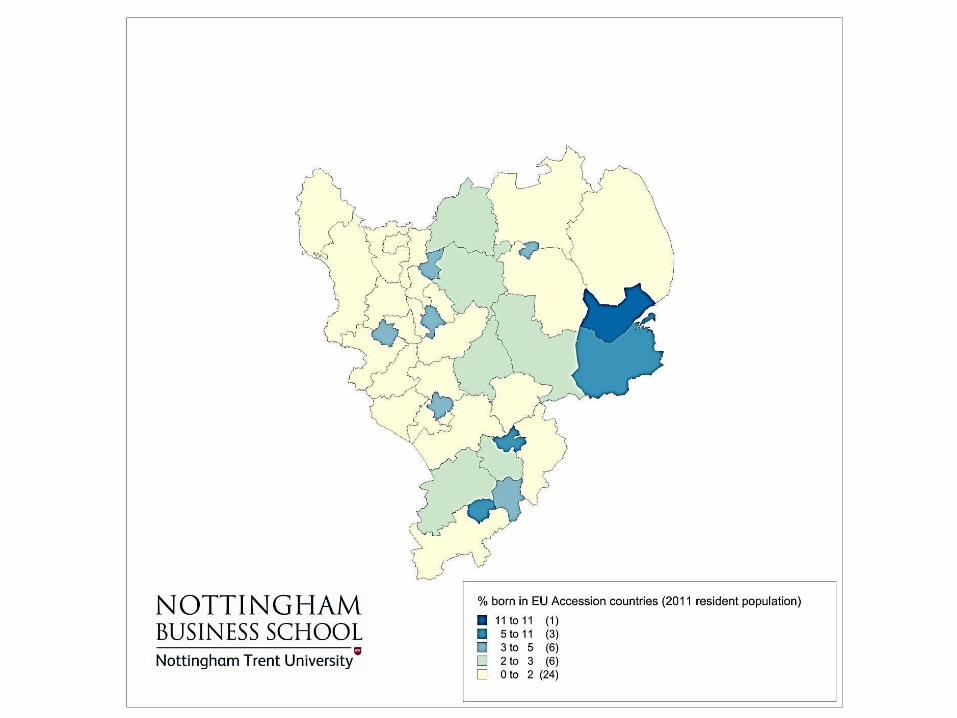
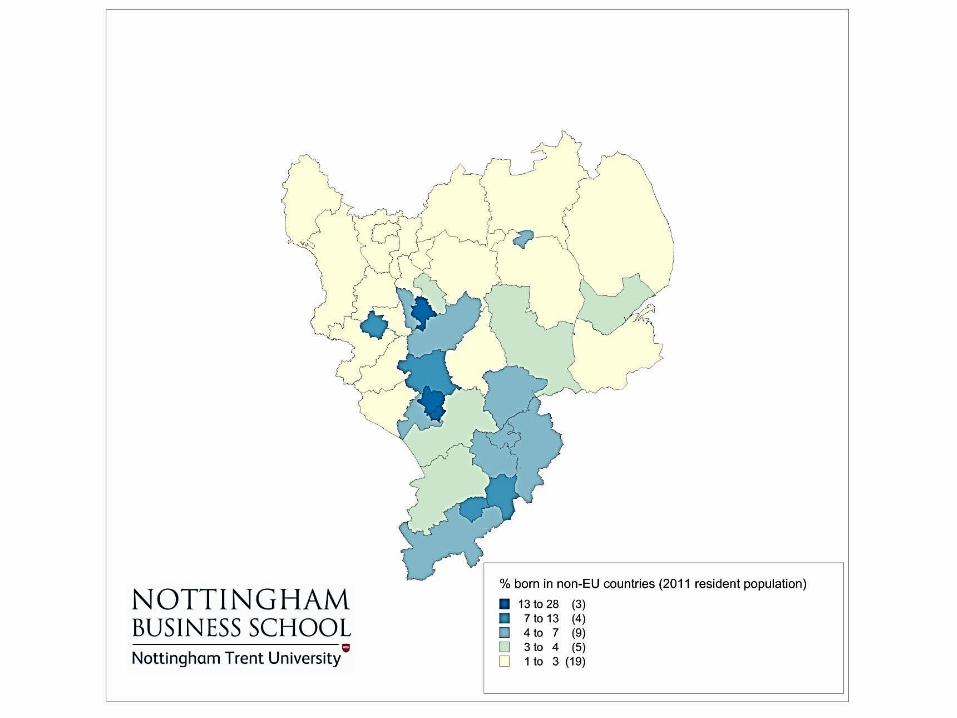
• In the East Midlands, EU nationals are more concentrated in Lincolnshire, the cities and surrounding districts, whilst non-EU nationals are more concentrated in the cities (especially Leicester)
• Research suggests EU migrants make a significant net fiscal contribution • There is little evidence that EU migrants displace non-migrants in the
labour market

www.tuc.org.uk
Employment of Migrant Workers in the Regional Economy
Lee BarronRegional Secretary
TUC Midlands

www.tuc.org.uk
TUC position on migration
• All workers have fundamental rights• Migrant workers must be treated equally
otherwise they will be used by bad employers to undercut local workers - unions have been active in organising migrants to build collective floor level of rigths
• Free Movement is a fundamental right of the EU
• the TUC opposed transitional measures for the accession of the ‘A8’ and ‘A2’ countries to the EU
www.tuc.org.uk
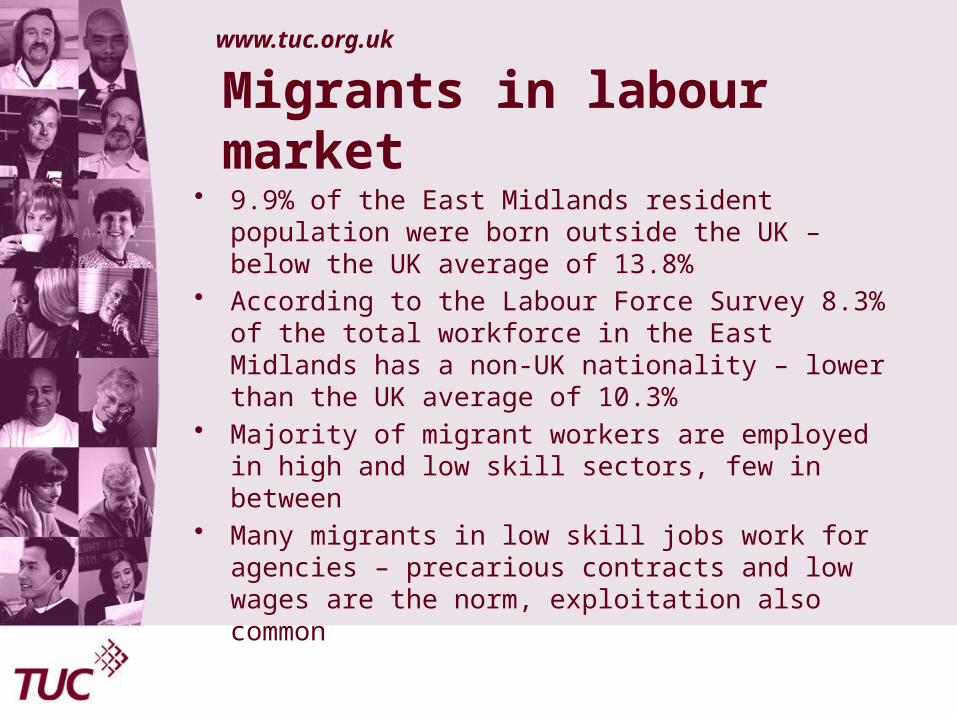
Migrants in labour market
• 9.9% of the East Midlands resident population were born outside the UK – below the UK average of 13.8%
• According to the Labour Force Survey 8.3% of the total workforce in the East Midlands has a non-UK nationality – lower than the UK average of 10.3%
• Majority of migrant workers are employed in high and low skill sectors, few in between
• Many migrants in low skill jobs work for agencies – precarious contracts and low wages are the norm, exploitation also common
www.tuc.org.uk
Wages: Migrants don’t drive down pay – bad employers do. Too many employers use migrants willingness to work for less (as they are often in need of finding work quickly and wages are higher than in their home countries).
Jobs: little evidence of job displacement, however, the growth in precarious work has made more local workers feel insecure. Migrants are being used as scapegoats but are not the cause of insecure jobs – bad employers are. We need more quality jobs for everyone and decent pay.

www.tuc.org.uk
No evidence of ‘benefit tourism’• EU Commission has found no
evidence of benefit tourism in 2013 report
• A8 migrants contribute £22 billion more to the economy than they consumed in services (UCL, 2013)
www.tuc.org.uk
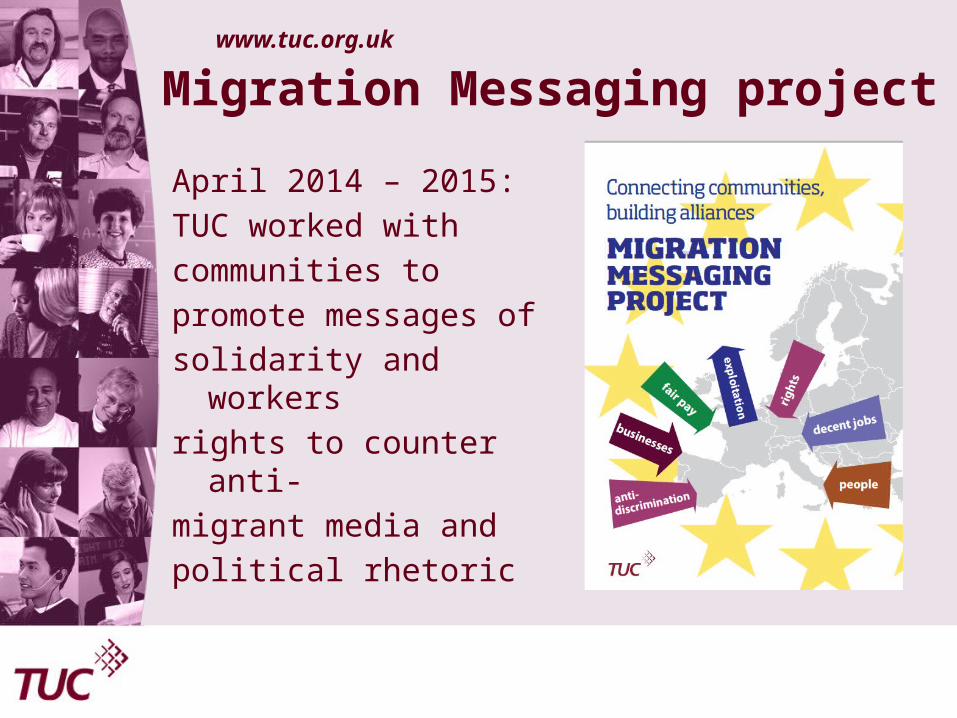
Migration Messaging project
April 2014 – 2015:TUC worked withcommunities to promote messages of solidarity and workers rights to counter anti-migrant media and political rhetoric

www.tuc.org.uk
TUC worked with Corby community, unions and employers to make the film ‘Fairness at Work: Lessons from Corby’
https://www.tuc.org.uk/about-tuc/regions/watch-film-%E2%80%98fairness-work-lessons-corby%E2%80%99
www.tuc.org.uk
TUC Education work on migration
www.tuc.org.uk
TUC work with European partners
1. TUC ran a European Commission funded project ‘Developing information for migrant workers through transnational trade union cooperation’ in 2014– http://www.migrantinfo.eu/
2. This helped to fund the TUC’s ‘Working in the UK’ guide in 13 different languages including Polish, Spanish and Romanian - www.tuc.org.uk/workingintheuk
3. TUC has signed a number of agreements to work in partnership with unions in other countries, eg. Poland, Italy, Portugal
www.tuc.org.uk
European Trade Union ConfederationTUC is part of the European Trade Union Confederation (ETUC)
and part of its ‘UnionMigrantNet’ portal which provides information on employment rights to EU migrants looking to move from one country to another
ETUC actions on EU migration:• European states must treat migrants equally• Inform them of their rights• Counter moves by states such as the UK to limit free
movement• Commission and Member States must provide more
resources to help integrate migrants into communities and to unions to organise migrants so they can claim inform them of their rights. States must do more to enforce employment regulation to prevent migrants being exploited,
• See ETUC Action Plan on migration https://www.etuc.org/documents/action-plan-migration#.VeBGoCVViko

East Midlands Economy and Trends
Ian Bates, East Midlands Chamber
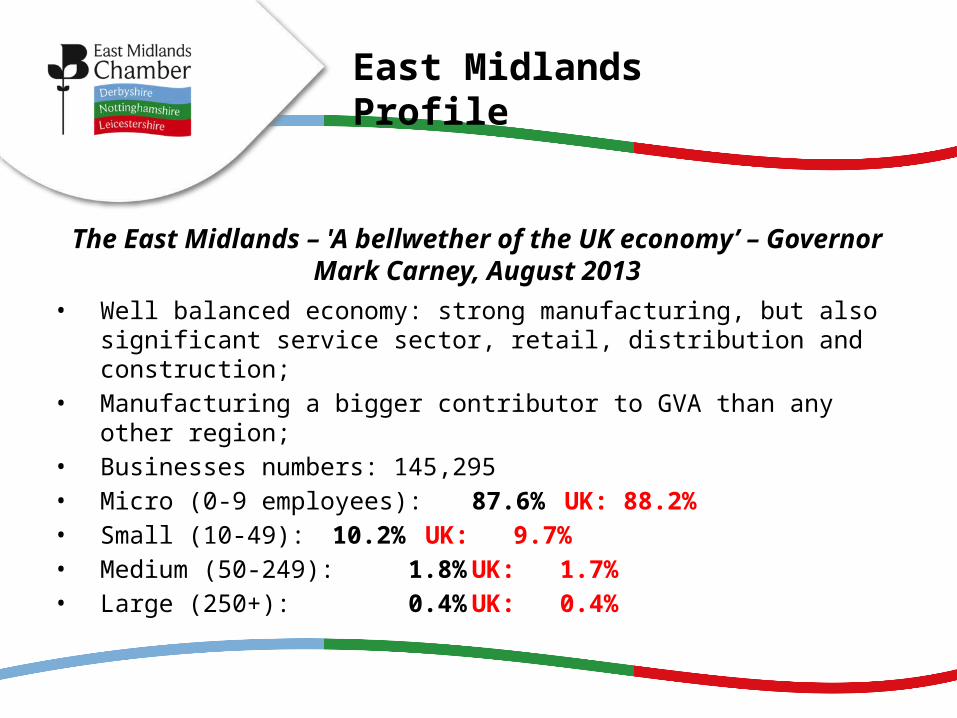
The East Midlands – 'A bellwether of the UK economy’ – Governor Mark Carney, August 2013
• Well balanced economy: strong manufacturing, but also significant service sector, retail, distribution and construction;
• Manufacturing a bigger contributor to GVA than any other region;
• Businesses numbers: 145,295• Micro (0-9 employees): 87.6% UK:
88.2%• Small (10-49): 10.2% UK: 9.7%• Medium (50-249): 1.8% UK: 1.7%• Large (250+): 0.4% UK: 0.4%
East Midlands Profile
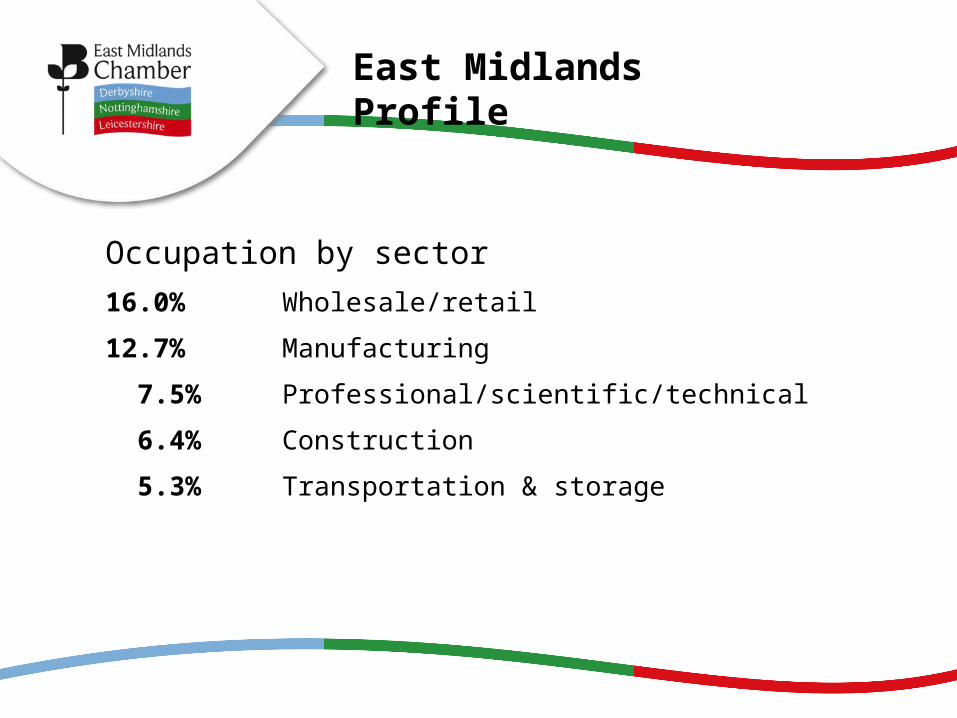
Occupation by sector16.0% Wholesale/retail
12.7% Manufacturing
7.5% Professional/scientific/technical
6.4% Construction
5.3% Transportation & storage
East Midlands Profile

Occupation by job type16.9% Professional
13.0% Technical
10.5% Administrative
11.1% Skilled
9.9% Managers
9.2% Personal Services
7.6% Sales & Customer services
8.5% Plant/Machinery operatives - highest in country
12.8% Elementary (e.g. unskilled, manual) - highest in country
East Midlands Profile
From bellwether to leader
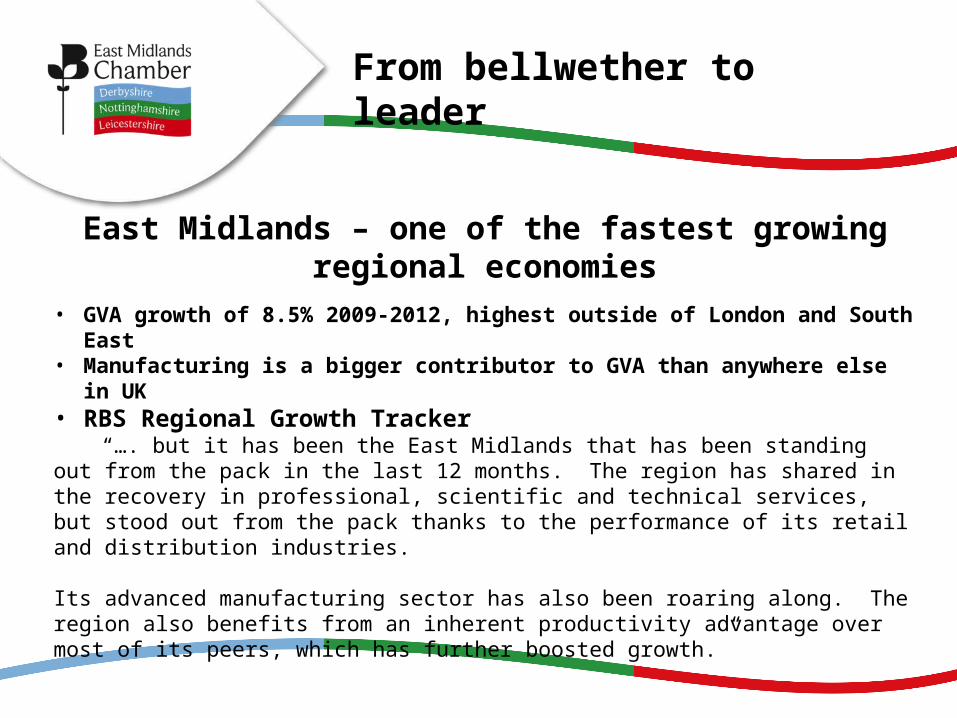
East Midlands – one of the fastest growing regional economies
• GVA growth of 8.5% 2009-2012, highest outside of London and South East
• Manufacturing is a bigger contributor to GVA than anywhere else in UK
• RBS Regional Growth Tracker“…. but it has been the East Midlands that has been standing out from
the pack in the last 12 months. The region has shared in the recovery in professional, scientific and technical services, but stood out from the pack thanks to the performance of its retail and distribution industries.
Its advanced manufacturing sector has also been roaring along. The region also benefits from an inherent productivity advantage over most of its peers, which has further boosted growth.”
From bellwether to leader
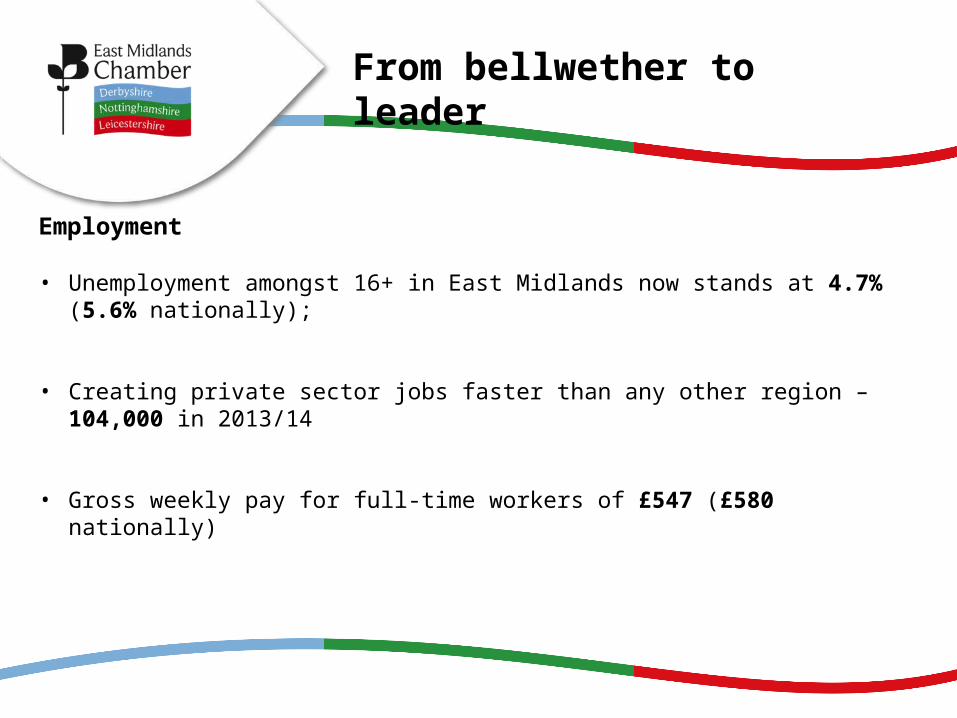
Employment
• Unemployment amongst 16+ in East Midlands now stands at 4.7% (5.6% nationally);
• Creating private sector jobs faster than any other region – 104,000 in 2013/14
• Gross weekly pay for full-time workers of £547 (£580 nationally)

Quarterly economic survey is the largest business survey of its kind – for Derbs, Notts and Leics receives 400+ responses each quarter
Q2 2015Attempted to recruit: 61%Struggled to recruit: 60%Q2 2014:Attempted to recruit: 56%Struggled to recruit: 50%Q2 2013:Attempted to recruit: 40%Struggled to recruit: 42%
What QES tells us about skills

What type of roles?85% are full-time roles80% are permanent roles
What areas do people struggle to fill?
56% report struggles to fill professional/managerial roles45% report struggles to fill skilled manual20% report struggles to fill clerical20% report struggles to fill unskilled/semiskilled roles.
What QES tells us about skills
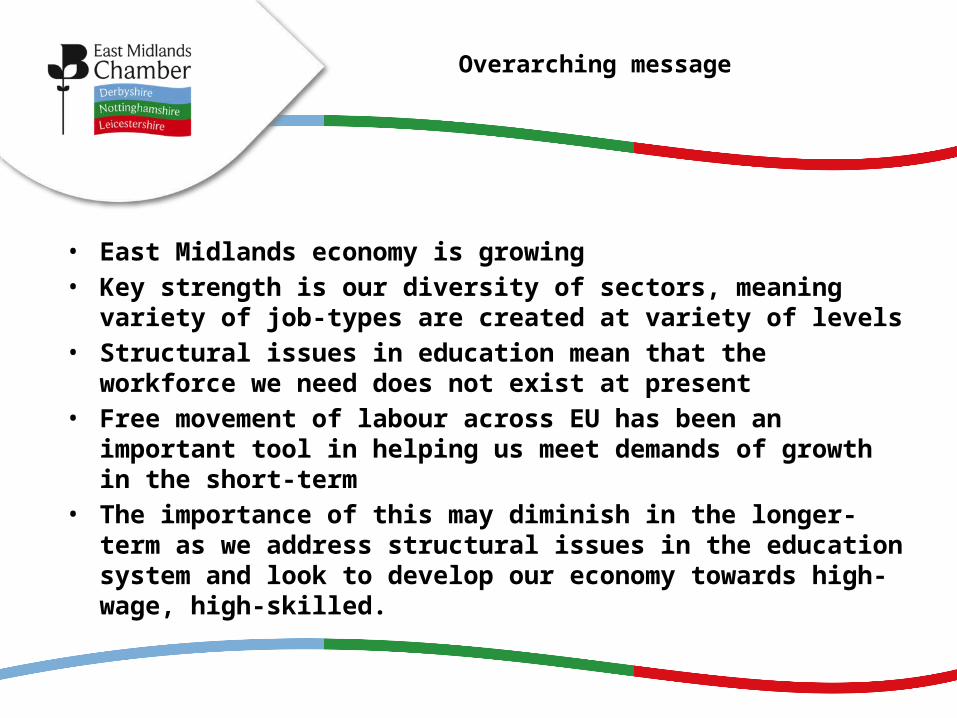
• East Midlands economy is growing• Key strength is our diversity of sectors, meaning variety of job-types are
created at variety of levels• Structural issues in education mean that the workforce we need does not
exist at present• Free movement of labour across EU has been an important tool in
helping us meet demands of growth in the short-term• The importance of this may diminish in the longer-term as we address
structural issues in the education system and look to develop our economy towards high-wage, high-skilled.
Overarching message

Ian Bates, East Midlands Chamber of Commerce
(Derbyshire, Nottinghamshire & Leicestershire)
[email protected] / 0333 320 0333
Facilitated discussion
1. What is the impact of intra-EU migration?
a. Impact on the Labour Market
b. Impact on Public Services
c. Impact on Communities
2. Are changes to free movement rules needed?
If so, what might those changes look like?