what is this plot?
TRANSCRIPT


What is this plot? Why does it matter*?
*Yes, it really does matter!

What is this plot? Average binding energy per nucleon (How tightly nuclei are stuck together by the strong nuclear force
http://en.wikipedia.org/wiki/File:Binding_energy_curve_-_common_isotopes.svg

Why does this plot matter? This is why nuclear fission and fusion release energy
http://en.wikipedia.org/wiki/File:Binding_energy_curve_-_common_isotopes.svg
FISSION

Daily Fuel Requirements for 1000 MW power plant
Material amount Coal 8,000,000 kg 1 train/day Oil 40,000 barrels 1 tanker/week Natural Gas 2,500,000 ft3
Uranium (enriched)
3 kg Fission
2H, 3H ~100g Few liters/month Fusion

Consider a mile long coal train
How much carbon dioxide is produced when the coal is burned?

How much carbon dioxide is produced when the coal is burned?
CO2 = 12C + 2 16O = 12 + 32 = 44 nucleons
= 3.67 mile train equivalent of of C02
44/12 = 3.67
+ + +
Per day for a 1000 MW coal power plant
Global Temperature Increasing…

Early Solar models were challenged as scientists started to realize that the earth was quite old. Chemical burning -> 100,000 year solar lifetime Gravitation collapse-> 1,000,000 year “ “ 1920’s Sir Arthur Eddington realized that mass of 4 protons > Mass of 4He So when 4He was assembled energy would be released! This suggested that fusion could explain how the sun was so old and generated so much energy


Artist’s sketch of the first atomic pile, Stagg Field, University of Chicago Dec 1942
Enrico Fermi 1901-1954 Nobel Prize Physics 1938


Three Mile Island PA March 1979 Accident Level 5 of 7
Chernobyl April 1986 Accident Level 7 of 7
Mechanical Failure Operator Errors Loss of Coolant Confusing control interfaces Containment vessel not compromised
Poorly planned test of safety system Power surge Reactor vessel rupture Ignition of graphite moderator Significant release of radioactive material 31 deaths at plant + 4000(?) eventual
Fukushima Daiichi (Japan) March 2011 Accident Level 7 of 7
Unsafe Site Tsunami disabled primary and backup power Reactors were shutdown Loss of Coolant Core meltdown

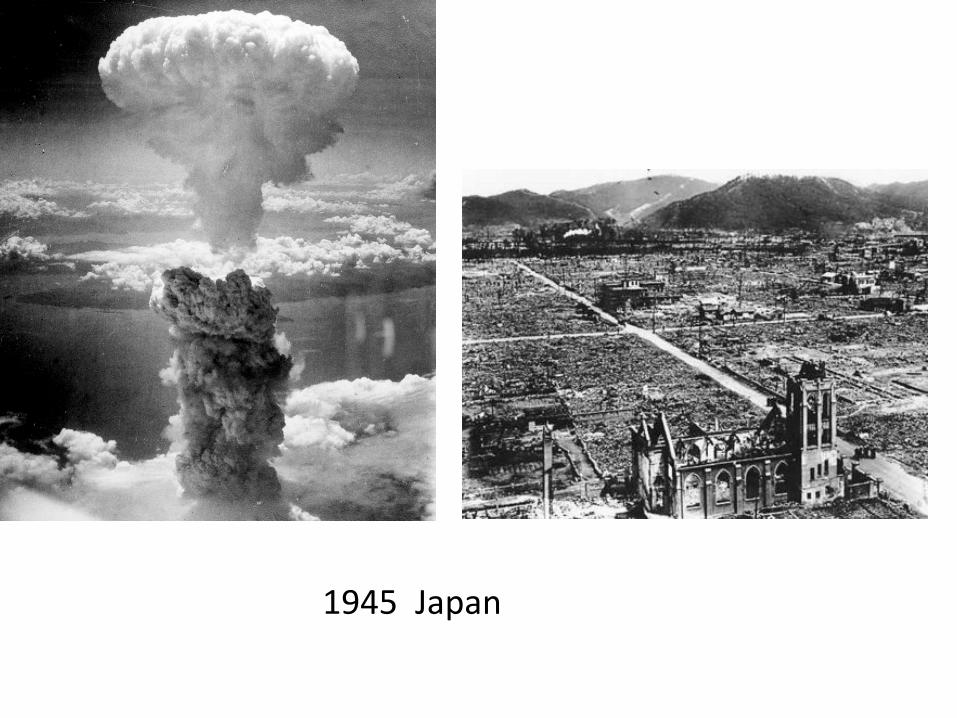
1945 Japan

History of Fission Energy
• Meitner, Hahn, Strassman: fission of Uranium (1939)
• Bohr and Wheeler; Theory of Fission (Phys Rev 56, 426; Sept 1, 1939)
• Fermi: First controlled fission reactor; Chicago 1942
• Oppenheimer; First fission (“atomic”) bomb; New Mexico 1945

Which process was first proposed as a source of energy? Fusion? Fission?

Which process was first proposed as a source of energy? Fusion (probably)

"The helium which we handle must have been put together at some time and some place. We do not argue with the critic who urges that the stars are not hot enough for this process; we tell him to go and find a hotter place." Sir Arthur Stanley Eddington The Internal Constitution of the Stars (1926), 301.
His novel proposal that fusion was the energy mechanism of the sun was not widely for various reasons. Eddington responded …….

Applications to induced fusion
Controlled: Nuclear Fusion Power Plant (projects: tokamaks, laser…) New initiative: ITER project Problem: Ignition !
Uncontrolled: Hydrogen Bomb (H-bomb) requires an A-bomb to ignite fusion !!! Enhanced yield: Hundreds of kilotons Tens of Megatons ! (Hiroshima, 20 kt)
Reading: “Dark Sun” (Richard Rhodes)

http://www.toodlepip.com/tokamak/gallery-int.htm

National Ignition Facility (NIF)

History of fusion energy
• Eddington “The internal constitution of stars” (1926)
• Gamow “ The rate of fusion in stars” (~1930) • Spitzer “Project Matterhorn: a proposed stellarator” (1951)
• Einwetok: First “hydrogen” bomb tested (1952)
• ITER; projected operation; Cadarache, France (2018)?
• National Ignition Facility …. Laser Implosion of fuel

http://www.eia.gov/tools/faqs/faq.cfm?id=427&t=3
• Coal 37% • Natural Gas 30% • Nuclear 19% • Hydropower 7% • Other Renewable 5%
– Biomass 1.42% – Geothermal 0.41% – Solar 0.11% – Wind 3.46%
• Petroleum 1% • Other Gases < 1%
Electricity Generation US 2012