what light does pisa shed on student learning? selected results from pisa 2003 organisation for...
TRANSCRIPT

1111
What light does PISA shed on student learning?
Selected results from PISA 2003
Organisation for Economic Cooperation and Development (OECD)
Paris2 February 2005
Andreas SchleicherHead, Indicators and Analysis Division
Directorate for Education

2222

3333 In the dark, all schools and education systems look the same…
But with a little light….

4444
But with a little light….
…important differences become apparent….

5555 Outline for today
1.1. Learning for tomorrow’s world PISA – a new framework for evaluating the
preparedness of youths for the knowledge society
2.2. Where we are today What PISA 2003 shows about the performance
of education systems
3.3. Where we can be What the best performing countries show can
be achieved
4.4. How we can get there Levers for policy that emerge from international
comparisons, with focus on assessment methods

6666
Learning for Tomorrow’s World
PISA – a new framework for evaluating the preparedness of youths for the knowledge society

7777 PISA - The most comprehensive international assessment of student competencies
Geographic and economic coverage 275,000 15-year-old students randomly sampled 43 countries in 2000, 41 and 2003, 59 in 2006
Subject matter coverage Mathematics, Science, Reading, Cross-curricular
competencies Volume of questions
– 3½ hours of mathematics assessment– 1 hour for each of reading, science and problem solving
Each student– 2 hours on paper-and-pencil tasks (subset of all questions)– ½ hour for questionnaire on background, learning habits,
learning environment, engagement and motivation Variety of task formats
Open-constructed responses, multiple-choice Depths
A total of 7 hours of assessment material Target population: 15-year-olds in school

8888Deciding what to assess...
looking back at what students were expected to have learned
OR
looking ahead to what they can do with what they have learned.
For PISA, the OECD countries chose the latter.

9999 Knowledge based society
What do we expect of key competencies?
Competency Applying psycho-social resources…
– Cognitive, motivational, ethical, volitional, social
…to successfully meet complex demands in varied contexts Key competencies
Apply to multiple areas of life Lead to important and valued individual and social
outcomes Imply the development of a higher level of reflectivity
and mental complexity Build on a combination of cognitive and non-cognitive
psychological resources Can be learned – and taught
Key competencies operate as constellations

10101010 Three broad categories of key competencies
Using “tools” interactively to engage with the
world
Acting autonomously
Interacting in diverse groups
e.g.
Using language, symbols and texts
Interacting with informationCapitalising on the potential
of technologies
e.g.
Relating well to othersCo-operating, working in
teamsManaging and resolving
conflicts
e.g.
Acting within the bigger picture
Learning strategiesTaking responsibility and understanding rights and
limits
To analyse, compare, contrast, and evaluate
To think imaginatively
To apply knowledge in real-life situations
To communicate thoughts and ideas effectively
PISA concept of literacyAccessing, managing, integrating
and evaluating written information in order to develop ones knowledge and potential,
and to participate in, and contribute to, society
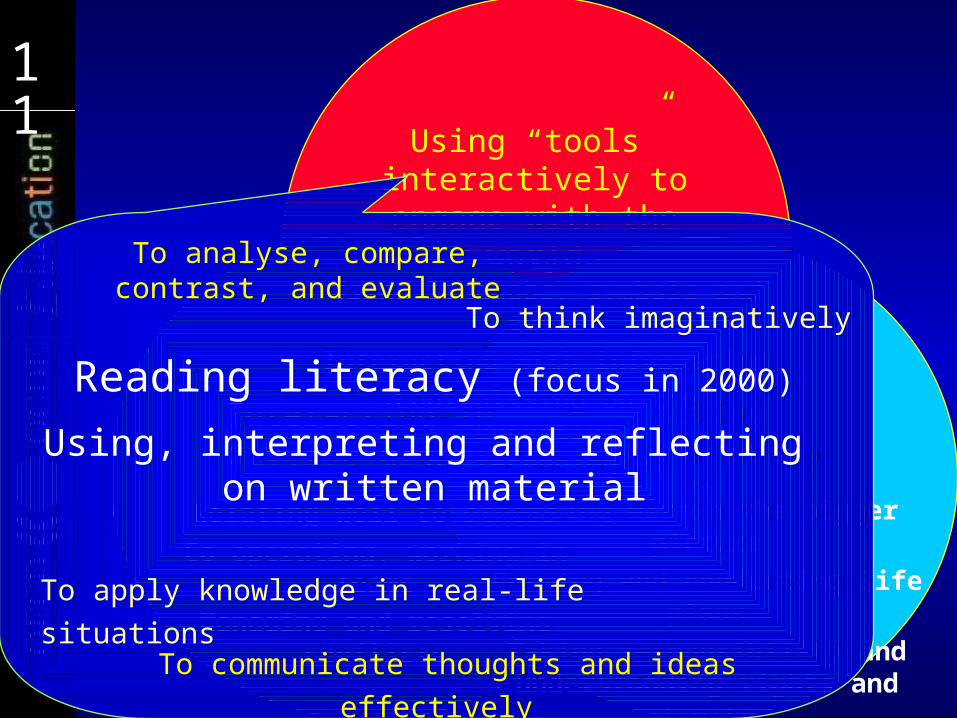
11111111Using “tools”
interactively to engage with the
world
Acting autonomously
Interacting in diverse groups
e.g.
Using language, symbols and texts
Interacting with informationCapitalising on the potential
of technologies
e.g.
Relating well to othersCo-operating, working in
teamsManaging and resolving
conflicts
e.g.
Acting within the bigger picture
Forming and conducting life plans
Taking responsibility and understanding rights and
limits
To analyse, compare, contrast, and evaluate
To think imaginatively
To apply knowledge in real-life situations
To communicate thoughts and ideas effectively
Reading literacy (focus in 2000)
Using, interpreting and reflecting on written material

12121212Using “tools”
interactively to engage with the
world
Acting autonomously
Interacting in diverse groups
e.g.
Using language, symbols and texts
Interacting with informationCapitalising on the potential
of technologies
e.g.
Relating well to othersCo-operating, working in
teamsManaging and resolving
conflicts
e.g.
Acting within the bigger picture
Forming and conducting life plans
Taking responsibility and understanding rights and
limits
To analyse, compare, contrast, and evaluate
To think imaginatively
To apply knowledge in real-life situations
To communicate thoughts and ideas effectively
Scientific literacy (focus in 2006)Using scientific knowledge, identifying scientific
questions, and drawing evidence-based conclusions to understand and make decisions about the natural
world

13131313Using “tools”
interactively to engage with the
world
Acting autonomously
Interacting in diverse groups
e.g.
Using language, symbols and texts
Interacting with informationCapitalising on the potential
of technologies
e.g.
Relating well to othersCo-operating, working in
teamsManaging and resolving
conflicts
e.g.
Acting within the bigger picture
Forming and conducting life plans
Taking responsibility and understanding rights and
limits
To analyse, compare, contrast, and evaluate
To think imaginatively
To apply knowledge in real-life situations
To communicate thoughts and ideas effectively
Mathematical literacy (focus in 2003)Emphasis is on mathematical knowledge put into functional use in a multitude of different
situations in varied, reflective and insight-based ways
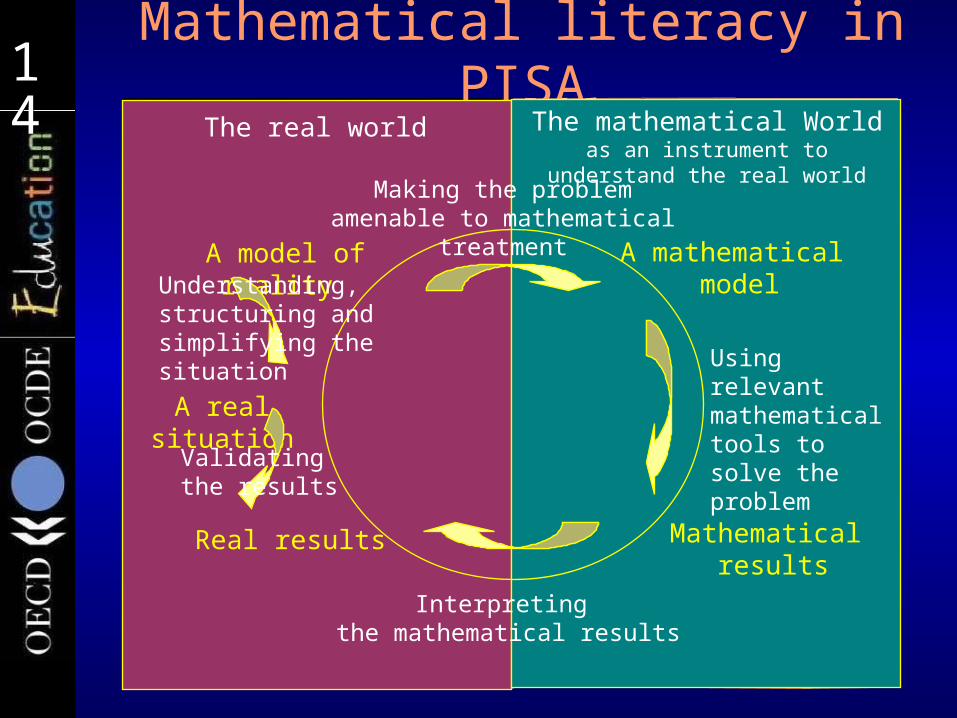
14141414 Mathematical literacy in PISAThe real world The mathematical World
as an instrument to understand the real world
A real situation
A model of reality A mathematical model
Mathematical results
Real results
Understanding, structuring and simplifying the situation
Making the problem amenable to mathematical
treatment
Interpreting the mathematical results
Using relevant mathematical tools to solve the problemValidating
the results

15151515Using “tools”
interactively to engage with the
world
Acting autonomously
Interacting in diverse groups
PISA assessment of – Problem-solving competencies
• Using cognitive processes to resolve real situations where the solution path is not immediately obvious and where the competencies required are not within a single discipline.
• PISA self-reports on:– Dispositions to learning– Learning strategies– Engagement with school– Self-concept

16161616 Development of assessments Frameworks by international experts Assessment materials
submitted by countries developed by research consortium screened for cultural bias
– by countries– by an international expert panel– items with prima facie cultural bias removed at this stage
internationally validated translations trialled to check items working consistently in all countries
Final tests items shown in trial to be culturally biased removed best items chosen for final tests
– balanced to reflect framework– range of difficulties– range of item types (constructed response, multiple choice)

17171717
Securing an equitable distribution of learning opportunities
Measured by the impact students’ and schools’ socio-economic background has on performance –
not merely by the distribution of learning outcomes

18181818 Average performanceof 15-year-olds in mathematics
Low average performance
Large socio-economic disparities
High average performance
Large socio-economic disparities
Low average performance
High social equity
High average performance
High social equity
Strong socio-economic impact
on student performance
Socially equitable distribution of
learning opportunities
High mathematics performance
Low mathematics performanceGreece
Russian Federation
Liechtenstein
Korea
Hong Kong- China
Finland
Netherlands
Canada
Macao- China Switzerland
New Zealand
Belgium
J apan
Australia
I celandCzech Republic
SwedenFranceDenmark
I reland GermanyAustria
Slovak Republic
LuxembourgPoland Hungary
Norway
SpainUnited StatesLatvia
PortugalI taly
440
460
480
500
520
540
61626
There is more to this than national income
Countries with higher national income and better educated adult populations tend to perform better…
… but there are exceptions.
Top-performers Finland remained first in
reading and since 2000 moved further in math and science…
…and is now on a par with the East Asian countries that were previously unmatched in math and science
Also the Netherlands is among the top-performers in math
…though not in reading and science.
As is the Flemish Community of Belgium
Progress Other countries with
improvements in at least two assessment areas were Belgium, the Czech Republic and Germany
…In Belgium and Germany it was the top performers who drove improvements.
A widening gap More improvement at the top
of the scale has widened the gap between the top and bottom performers in the OECD.
Progress Poland raised it’s overall
performance in all four assessment areas
…thanks to big improvements among lower-performing students in the wake of a major reform in 1999.

19191919 Durchschnittliche Schülerleistungen im Bereich Mathematik
Low average performance
Large socio-economic disparities
High average performance
Large socio-economic disparities
Low average performance
High social equity
High average performance
High social equity
Strong socio-economic impact
on student performance
Socially equitable distribution of
learning opportunities
High mathematics performance
Low mathematics performanceGreece
Russian Federation
Liechtenstein
Korea
Hong Kong- China
Finland
Netherlands
Canada
Switzerland
New Zealand
Belgium
J apan
Australia
I celandCzech Republic
SwedenFrance
Denmark
I relandGermanyAustria
Slovak Republic
LuxembourgPolandHungary
Norway
SpainUnited States Latvia
Portugal I taly
440
460
480
500
520
540
61626
Differences in socio-economic background pose major challenges for education systems
Students whose parents have better-paid jobs, are better educated or have more “cultural” possessions in their homes tend to perform better…
… But the performance advantage varies– Australia, Canada, Finland, Iceland and
Japan provide examples showing that it is possible to combine quality and equity
– In contrast, results for Belgium, Germany, Hungary, he Slovak Republic and Turkey reveal large socio-economic inequalities in the distribution of learning opportunities .

20202020
Ensuring consistent performance standards across schools
Between and within-school variation in performance

21212121
0
20
40
60
80
100
120
140
Tur
key
Hun
gary
Jap
an
Bel
gium
Ital
y
Ger
man
y
Aus
tria
Net
her
land
s
Cze
ch R
epub
lic
Kor
ea
Slo
vak
Rep
ublic
Gre
ece
Swit
zerl
and
Luxem
bou
rg
Port
ugal
Mex
ico
Uni
ted S
tate
s
Aus
tral
ia
New
Zea
land
Spa
in
Can
ada
Irel
and
Den
mar
k
Pola
nd
Swed
en
Nor
way
Fin
land
Icel
and
Is it all innate ability?Variation in student performance
OECD (2004), Learning for tomorrow’s world: First results from PISA 2003, Table 4.1a, p.383.

22222222
- 80
- 60
- 40
- 20
0
20
40
60
80
100Tur
key
Hun
gary
Jap
an
Bel
gium
Ital
y
Ger
man
y
Aus
tria
Net
her
land
s
Cze
ch R
epub
lic
Kor
ea
Slo
vak
Rep
ublic
Gre
ece
Swit
zerl
and
Luxem
bou
rg
Port
ugal
Mex
ico
Uni
ted S
tate
s
Aus
tral
ia
New
Zea
land
Spa
in
Can
ada
Irel
and
Den
mar
k
Pola
nd
Swed
en
Nor
way
Fin
land
Icel
and
Variation of performance
between schools
Variation of performance within
schools
Is it all innate ability?Variation in student performance in mathematics
OECD (2004), Learning for tomorrow’s world: First results from PISA 2003, Table 4.1a, p.383.
In some countries, parents can rely on high and consistent standards across schools
In Canada, Denmark, Finland, Iceland and Sweden average student performance is high…
… and largely unrelated to the individual schools in which students are enrolled.
11
114
125

23232323
Bridging the gender gap
Performance, attitudes and motivation
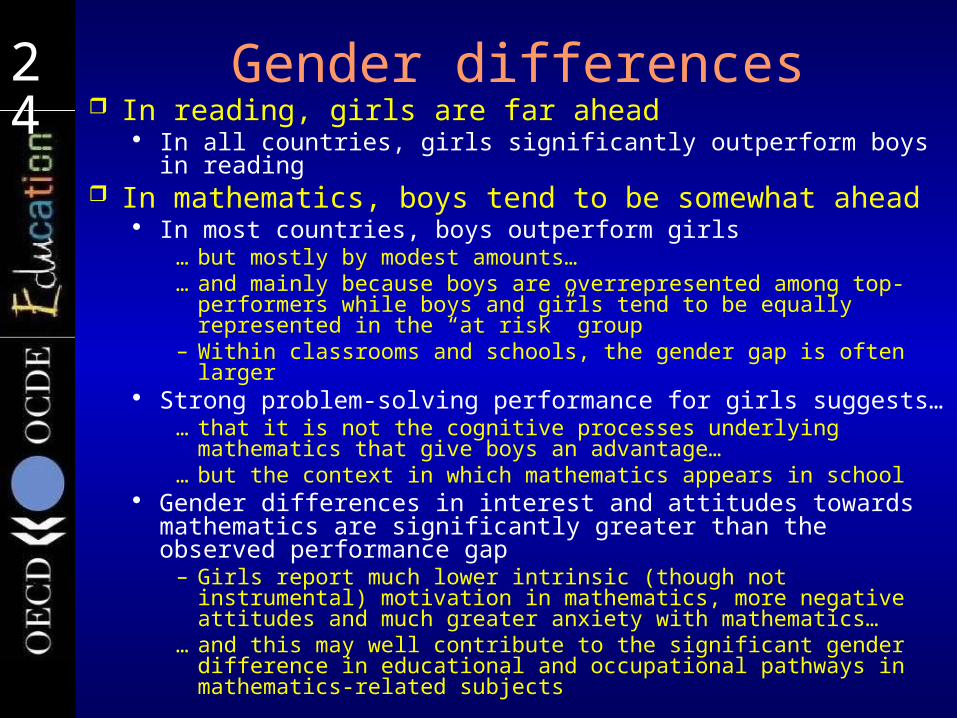
24242424 Gender differences In reading, girls are far ahead
In all countries, girls significantly outperform boys in reading
In mathematics, boys tend to be somewhat ahead In most countries, boys outperform girls
… but mostly by modest amounts…… and mainly because boys are overrepresented
among top-performers while boys and girls tend to be equally represented in the “at risk” group
– Within classrooms and schools, the gender gap is often larger Strong problem-solving performance for girls suggests…
… that it is not the cognitive processes underlying mathematics that give boys an advantage…
… but the context in which mathematics appears in school
Gender differences in interest and attitudes towards mathematics are significantly greater than the observed performance gap
– Girls report much lower intrinsic (though not instrumental) motivation in mathematics, more negative attitudes and much greater anxiety with mathematics…
… and this may well contribute to the significant gender difference in educational and occupational pathways in mathematics-related subjects

25252525
Creating strong foundations for lifelong learning
Performance, attitudes and motivation

26262626 Student approaches to learning
The ability to manage one’s learning is both an important outcome of education and a contributor to student literacy skills at school
Learning strategies, motivation, self-related beliefs, preferred learning styles
Different aspects of students’ learning approaches are closely related
Well-motivated and self-confident students tend to invest in effective learning strategies and this contributes to their literacy skills
Immigrant students tend to be weaker performers… but they do not have weaker characteristics as learners
Boys and girls each have distinctive strengths and weaknesses as learners
Girls stronger in relation to motivation and self-confidence in reading
Boys believing more than girls in their own efficacy as learners and in their mathematical abilities

27272727Control strategies in
mathematics0 20 40 60 80 100
When I study for a mathematics test, I try to work out what
are the most important parts to learn.
When I study mathematics, I make myself check to see if I
remember the work I have already done.
When I study mathematics, I try to figure out which concepts
I still have not understood properly.
When I cannot understand something in mathematics, I always
search for more information to clarify the problem.
When I study mathematics, I start by working out exactly
what I need to learn.
OECD average Austria J apanPercentage of students
OECD (2004), Learning for tomorrow’s world: First results from PISA 2003, Table 3.9, p.375 and Figure 3.9, p.143.
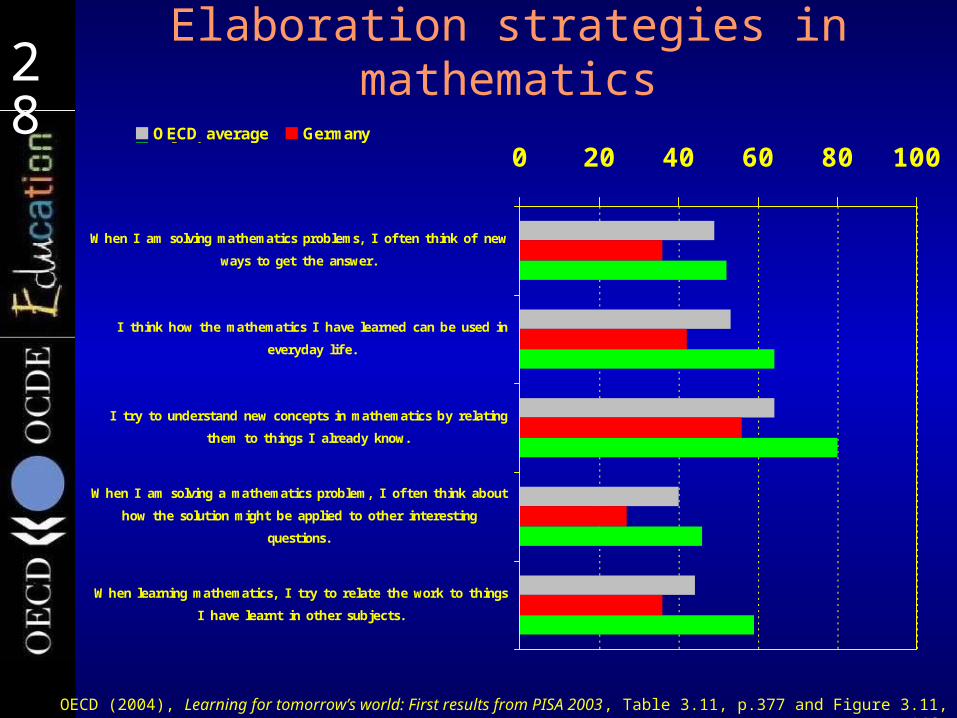
28282828 Elaboration strategies in mathematics
0 20 40 60 80 100
When I am solving mathematics problems, I often think of new
ways to get the answer.
I think how the mathematics I have learned can be used in
everyday life.
I try to understand new concepts in mathematics by relating
them to things I already know.
When I am solving a mathematics problem, I often think about
how the solution might be applied to other interesting
questions.
When learning mathematics, I try to relate the work to things
I have learnt in other subjects.
OECD average GermanyPoland
Percentage of students
OECD (2004), Learning for tomorrow’s world: First results from PISA 2003, Table 3.11, p.377 and Figure 3.11, p.146.

29292929Combined explanatory power of student learning
characteristics on mathematics performance and control strategies
OECD (2004), Learning for tomorrow’s world: First results from PISA 2003, Figure 3.13, p.149.
Percentage of variance in student mathematics performance that is explained by the combined effect of
-interest in and enjoyment of mathematics
-anxiety in mathematics
-control strategies
Percentage of variance in student use of control strategies that is explained by the combined effect of
-interest in and enjoyment of mathematics
-anxiety in mathematics
NorwayDenmarkPolandSwedenFinlandKoreaNew ZealandI celandCanadaSlovak RepublicCzech RepublicUnited StatesPortugalAustraliaI relandGreeceTurkeyUruguayMexicoGermanySwitzerlandLuxembourgSpainHungaryAustriaFranceI talyJ apanBelgiumNetherlandsOECD AverageUnited Kingdom
50 40 30 20 10 0 0 10 20 30 40 50%

30303030
How can we get there?
Levers for policy that emerge from international comparisons

31313131 Sympathy doesn’t raise standards – aspiration does
In many of the best performing countries National research teams report a strong
“culture of performance”– Which drives students, parents, teachers
and the educational administration to high performance standards
PISA shows that students perceived a high degree of teacher support– Which should not be simply equated with
“achievement press”

32323232 Governance of the school system In many of the best performing countries
Decentralised decision-making is combined with devices to ensure a fair distribution of substantive educational opportunities
The provision of standards and curricula at national/subnational levels is combined with advanced evaluation systems
– That are implemented by professional agencies Process-oriented assessments and/or
centralised final examinations are complimented with individual reports and feed-back mechanisms on student learning progress

33333333
Low Performan
ce
HighMathematics performance
Low performance
Low social equity
High performance
Low social equity
Low performance
High social equity
High performance
High social equity
Strong impact of social background on performance
Moderate impact of social
background on performance
I talyPortugal
LatviaUnited StatesSpain
Norway
Hungary PolandLuxembourg
Slovak Republic
AustriaGermany I reland
DenmarkFrance
Sweden
Czech RepublicI celand
Australia
J apan
Belgium
New Zealand
Switzerland Macao- China
Canada
Netherlands
Finland
Hong Kong- China
Korea
Liechtenstein
Russian Federation
Greece
440
460
480
500
520
540
0102030
Formulating the school budget and deciding on budget allocations in schools
High degree of autonomy
Low degree of autonomy
Some notes on Italy:– Only 8% of schools involved in appointing
teachers (OECD 64%)– Only 2% of schools involved in determining
teacher salary increases (OECD 38%)– All schools involved in establishing student
assessment policies (OECD 85%)– 84% of schools involved in determining
course content (OECD 67%)

34343434 Organisation of instruction In many of the best performing countries
Schools and teachers have explicit strategies and approaches for teaching heterogeneous groups of learners
– A high degree of individualised learning processes– Disparities related to socio-economic factors and
migration are recognised as major challenges Students are offered a variety of extra-
curricular activities Schools offer differentiated support
structures for students– E.g. school psychologists or career counsellors
Institutional differentiation is introduced, if at all, at later stages
– Integrated approaches also contributed to reducing the impact of students socio-economic background on outcomes

35353535
Low Performan
ce
HighMathematics performance
Low performance
Low social equity
High performance
Low social equity
Low performance
High social equity
High performance
High social equity
Strong impact of social background on performance
Moderate impact of social
background on performance
I talyPortugal
LatviaUnited StatesSpain
Norway
Hungary PolandLuxembourg
Slovak Republic
AustriaGermany I reland
DenmarkFrance
Sweden
Czech RepublicI celand
Australia
J apan
Belgium
New Zealand
Switzerland Macao- China
Canada
Netherlands
Finland
Hong Kong- China
Korea
Liechtenstein
Russian Federation
Greece
440
460
480
500
520
540
0102030
Early selection and institutional differentiation
High degree of stratification
Low degree of stratification
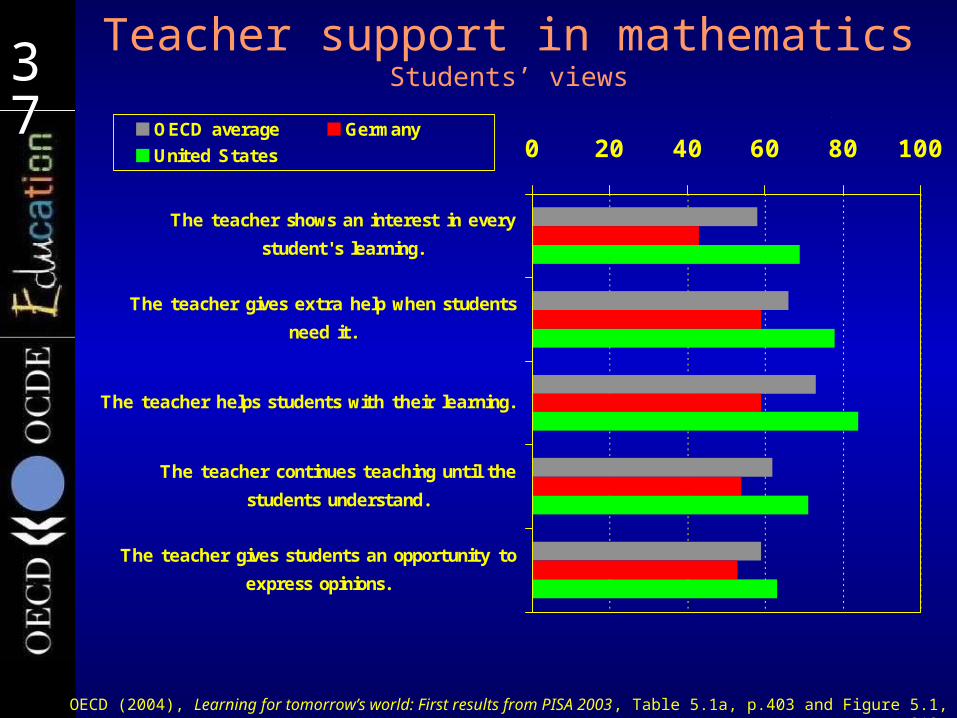
37373737Teacher support in mathematics
Students’ views
0 20 40 60 80 100
The teacher shows an interest in every
student's learning.
The teacher gives extra help when students
need it.
The teacher helps students with their learning.
The teacher continues teaching until the
students understand.
The teacher gives students an opportunity to
express opinions.
OECD average Germany
United States
Percentage of students
OECD (2004), Learning for tomorrow’s world: First results from PISA 2003, Table 5.1a, p.403 and Figure 5.1, p.213.

38383838Student-related factors affecting school
climatePrincipals’ views
0 20 40 60 80 100
Student absenteeism.
Disruption of classes by students.
Students skipping classes.
Students lacking respect for teachers.
Student use of alcohol or illegal drugs.
Students intimidating or bullying other students.
OECD average Korea
Percentage of students
OECD (2004), Learning for tomorrow’s world: First results from PISA 2003, Table 5.2a, p.406 and Figure 5.2, p.216.

39393939Teacher-related factors affecting school
climatePrincipals’ views
0 20 40 60 80 100
Teachers low expectation of students.
Poor student- teacher relations.
Teachers not meeting individual students'
needs.
Teacher absenteeism.
Staff resisting change.
Teachers being too strict with students.
Students not being encouraged to achieve their
full potential.
OECD average Denmark
Percentage of students
OECD (2004), Learning for tomorrow’s world: First results from PISA 2003, Table 5.4a, p.410 and Figure 5.4, p.220.

45454545 Assessment methods in the best-performing PISA countries Standardised tests
0%
20%
40%
60%
80%
100%
Fin
land
Kor
ea
Net
herl
ands
Jap
an
Can
ada
Bel
gium
Swit
zerl
and
Aus
tral
ia
New
Zea
land
Never(%) 1 to 2 times a year(%) 3 to 5 times a year(%) Monthly(%) More once a month(%)

46464646 Assessment methods in the top performing PISA countries Teacher developed tests
0%
20%
40%
60%
80%
100%
Fin
land
Kor
ea
Net
herl
ands
Jap
an
Can
ada
Bel
gium
Swit
zerl
and
Aus
tral
ia
New
Zea
land
Never(%) 1 to 2 times a year(%) 3 to 5 times a year(%) Monthly(%) More once a month(%)

47474747 Assessment methods in the top performing PISA countries Judgemental ratings
0%
20%
40%
60%
80%
100%
Fin
land
Kor
ea
Net
herl
ands
Jap
an
Can
ada
Bel
gium
Swit
zerl
and
Aus
tral
ia
New
Zea
land
Never(%) 1 to 2 times a year(%) 3 to 5 times a year(%) Monthly(%) More once a month(%)

48484848 Assessment methods in the top performing PISA countries Student portfolios
0%
20%
40%
60%
80%
100%
Fin
land
Kor
ea
Net
her
land
s
Jap
an
Can
ada
Bel
gium
Swit
zerl
and
Aus
tral
ia
New
Zea
land
Never(%) 1 to 2 times a year(%) 3 to 5 times a year(%) Monthly(%) More once a month(%)

49494949Assessment methods in the top performing PISA countries
Student assignements/projects/homework
0%
20%
40%
60%
80%
100%
Fin
land
Kor
ea
Net
herl
ands
Jap
an
Can
ada
Bel
gium
Swit
zerl
and
Aus
tral
ia
New
Zea
land
Never(%) 1 to 2 times a year(%) 3 to 5 times a year(%) Monthly(%) More once a month(%)

50505050 One challenge – different approaches
The tradition of education systems
has been “knowledge poor”
The future of education systems needs to be
“knowledge rich”
National prescription
Professional judgement
Informed professional judgement, the teacher
as a “knowledge worker”
Informed prescription
Uninformed professional judgement
Uninformed prescription,
teachers implement curricula
51515151 Further information
www.pisa.oecd.org– All national and international publications– The complete micro-level database
email: [email protected]
…and remember:
Without data, you are just another person with an opinion

52525252
OECD countries participating from PISA 2000
OECD countries participating from PISA from 2003
OECD partner countries participating from PISA 2000
OECD partner countries participating from PISA 2003
OECD partner countries participating from PISA 2006
PISA country participation