what results driven accountability (rda) means … 03 23 final rda.pdf · what results driven...
TRANSCRIPT

Ambush or Opportunity ?:What Results Driven
Accountability (RDA) Means
for the School Psychologist
W. Alan Coulter, Ph.D.
Human Development Center
LSU Health Sciences Center –New Orleans

Our Purpose Today
What You Need to Know about Changes w/RDA &
the Potential Impact on You, your LEA, & School Psychology !

Disclaimer
Alan is
Not
OSEP !Adaptations were made from
OSEP & other materials…

W. Alan Coulter, Ph.D. &
TIERS Group – LSUHSC
New Orleans
Alan - Full Disclosure !


Listening to Alan Can Be
Like Watching TV
Feel Free to
Stand or
Pace the
Back of the
Room Today

What Do You Expect From Today ?
1. Who Are You?
2. What One or Two ‘Things’ Do
You Expect from Today’s
Session (about 90’)?
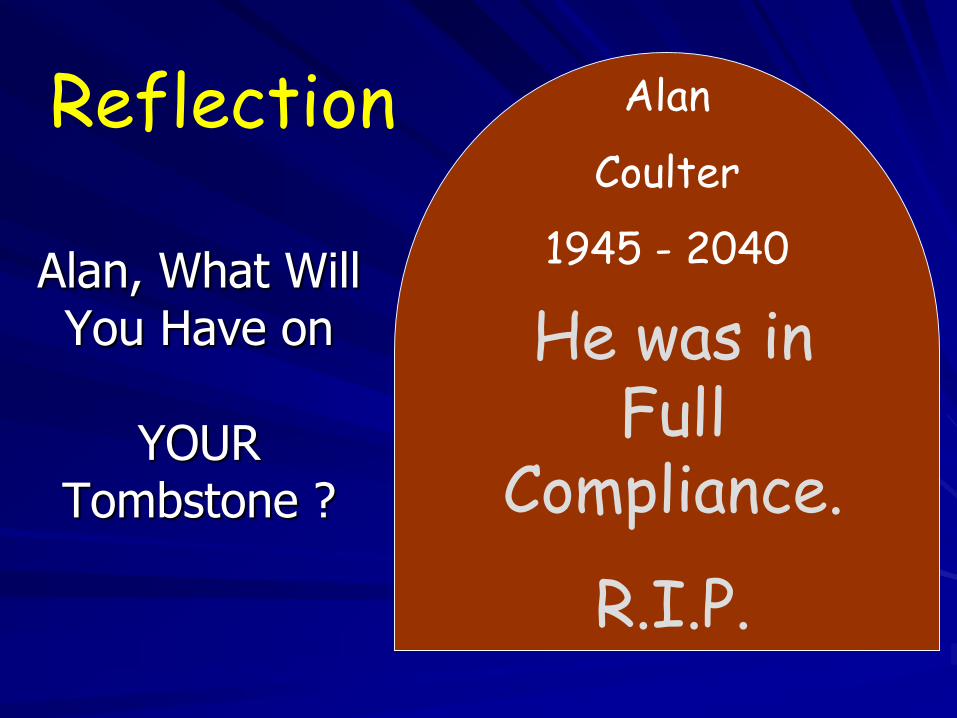
Alan, What Will You Have on
YOUR Tombstone ?
He was in Full
Compliance.
R.I.P.
Alan
Coulter
1945 - 2040
Reflection

3 Sections for This Morning
1.Context – How We Got to
this Point in Special Education
2.Results Driven Accountability –
A Shift in Emphasis
3.Preparing for Impact - What
You Can Do (in 90 minutes!)
How Did We
Get Here ?
Context
for
RDA

39 Years of Special Education
LawFour Original Purposes of the Law
1. FAPE
2. Protect Rights
3. Provide Technical Assistance,
and
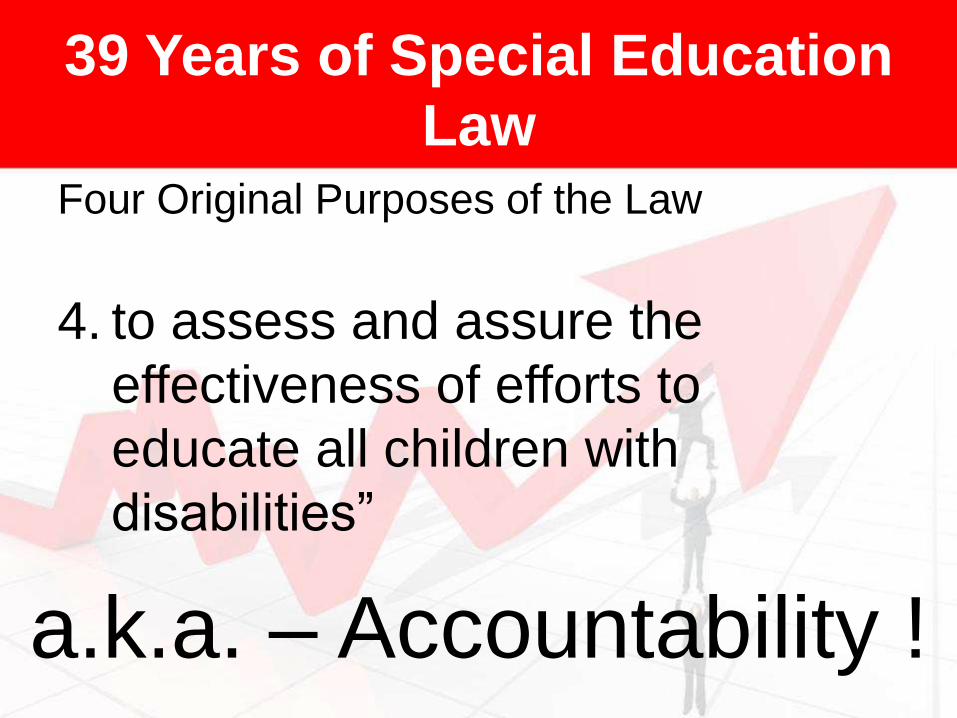
39 Years of Special Education
LawFour Original Purposes of the Law
4. to assess and assure the
effectiveness of efforts to
educate all children with
disabilities”
a.k.a. – Accountability !

Monitoring Compliance
1978 - “The Office of Education will
be looking at 6,000 to 7,000 IEPs in
the next few months to see whether
any problems are developing”
Ernest Boyer, 1979, p. 300.
IEP = Compliance

Never Forget
There are More than 755 Process
Requirements in IDEA ’04 Regulations.

A Checklist Mentality
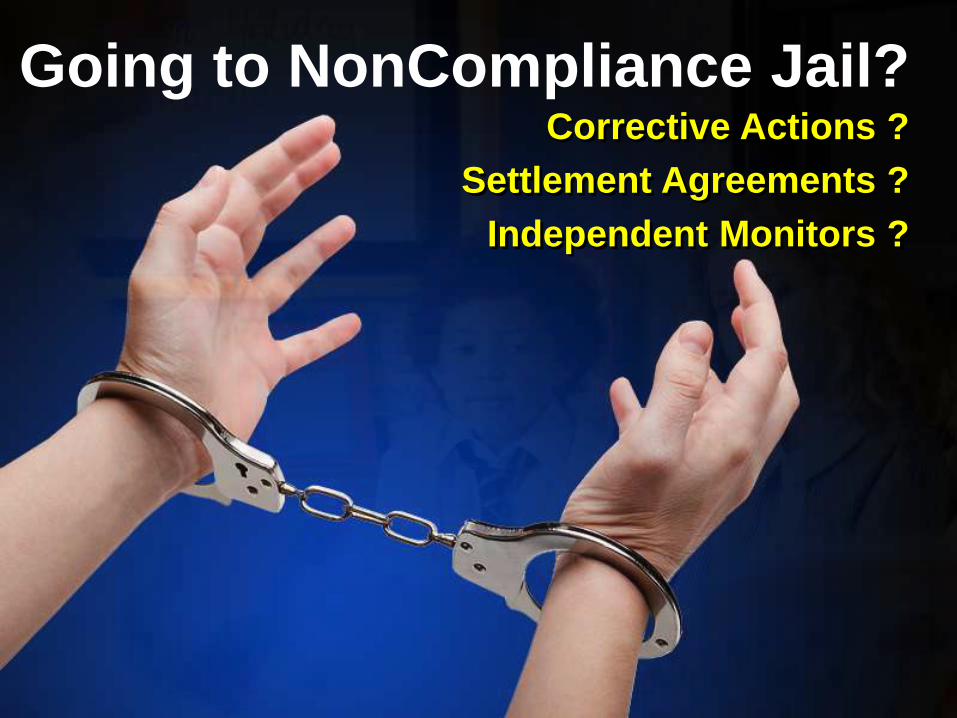
Going to NonCompliance Jail?Corrective Actions ?
Settlement Agreements ?
Independent Monitors ?

I Should Have
Checked that
IEP MoreCarefully

Student
Learning
Outcomes
Procedural
Compliance
Historic Focus

How Do We
Know
Special
Education is
Effective ?

Part B: SPP Compliance Indicators
Indicator
9: Disproportionate Representation
10: Disproportionate Representation
11: Child Find
12: Early Childhood Transition
13: Secondary Transition
15: Compliance Findings
20: Timely and Accurate Data
These are the Basis of State Status Determinations (up to 2014)

Part B: SPP Results Indicators Indicator
1: Graduation
2: Drop out
3: Statewide Assessment
4: Suspension and Expulsion
5: Educational Environments
6: Preschool Educational Environments
7: Preschool Outcomes
8: Parent Involvement
14: Postsecondary Outcomes
18: Resolution Session Agreements
19: Mediated Agreements


States Aggregate Performance onSelected Compliance Indicators
Data Source: OSEPAdapted from OSEP presentation

Success was being Realized

Never Forget
There are more than 755 Process Requirements
in IDEA ’04 Regulations.
And even if You could be in
Compliance with All 755,
You would have No Assurance ofResults

What’s
Missing ?
Time for a
Shift

“For too long
we’ve been a
compliance-driven
bureaucracy when
it come to
educating students
with disabilities,”
said U.S. Secretary of Education, Arne
Duncan.
The Shift in Accountability
Adapted from OSEP presentation

The Primary Focus of Federal and State Monitoring
activities shall be on –
• Improving Educational RESULTS and
Functional OUTCOMES for all children
with disabilities
• Ensuring that States meet… the program
requirements, with… emphasis on those
most related to Improving Results
20 U.S.C. 1416(a)(2)
+
Adapted from OSEP presentation

“…Our national policy of ensuring equality of opportunity, full participation, independent living, and economic self-sufficiency for individuals with disabilities”
65% Unemployed

Low Academic Achievement
Above Average Dropout Rates
Higher than Average Arrest Rates
Low Employment Rates
What We Know About Students With Disabilities
For more information: Sanford et al., 2011; NAEP, 2013; Planty et al., 2008, Aud et al., 2012
33.9%
12% v. 23% - $292,000.00
7% v. 26.2%
45% v. 18%


Range 87.9% to 23.5%
Data Source: OSEP

Always Carefully Walk Through Life (even if you DO HAVE DATA !!)

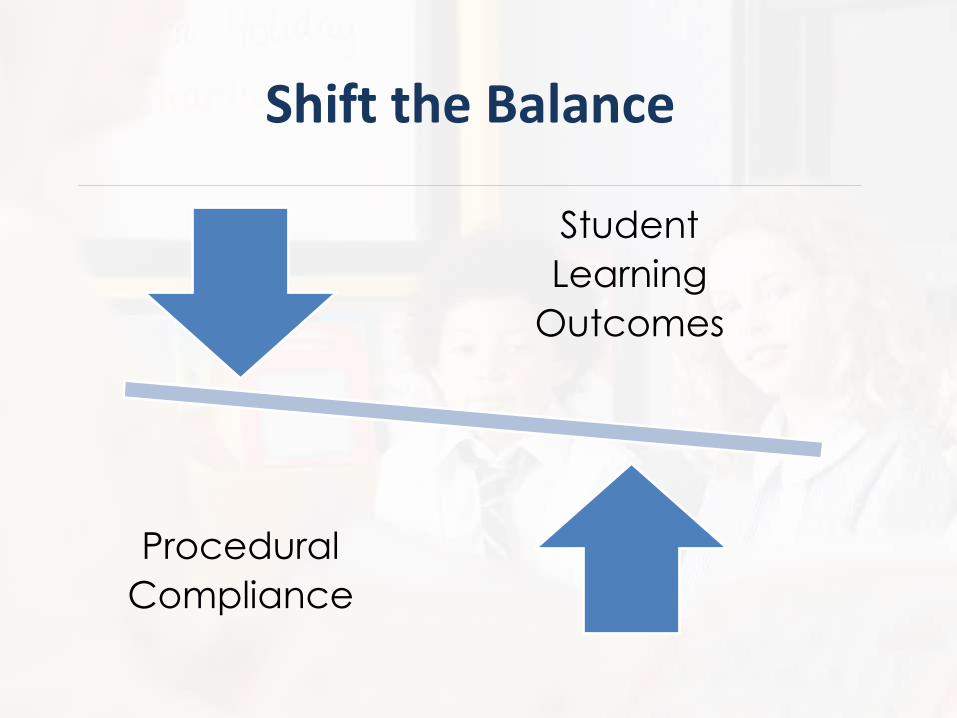
Student
Learning
Outcomes
Procedural
Compliance
Shift the Balance
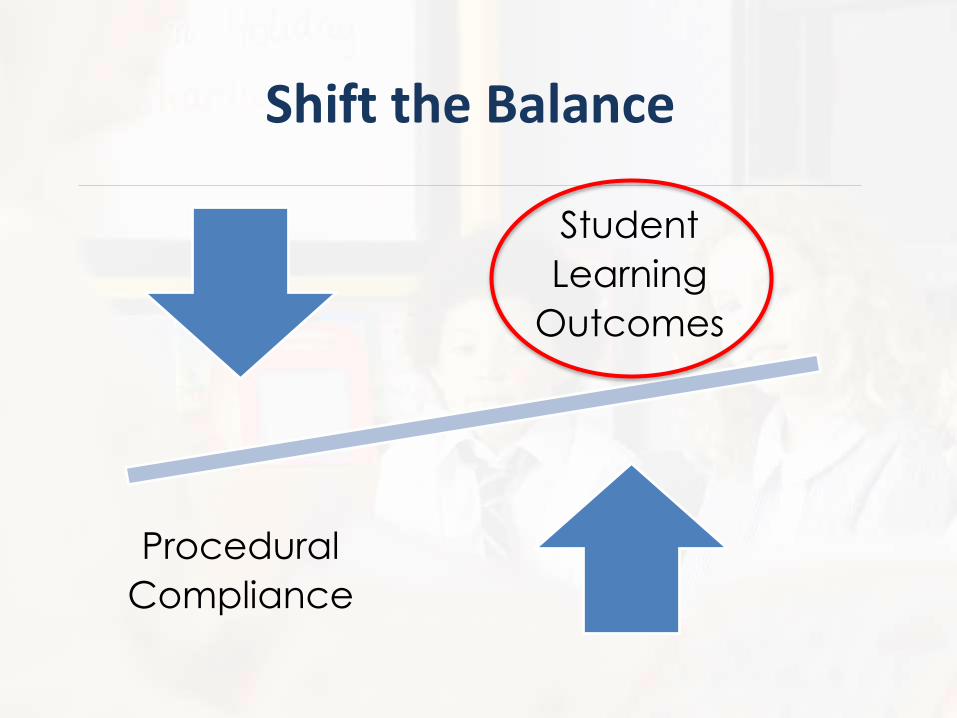
Student
Learning
Outcomes
Procedural
Compliance
Shift the Balance

Determining whether Services to
Children w/Disabilities are Effective in
Improving the Educational &
Functional Outcomes for Students,
OSEP’s Purpose with Results Driven Accountability
+
Increasing Emphasis of Monitoring & Reporting Requirements toward:
While still Maintaining most of the
Compliance Requirements

Procedural Compliance + Results
Data Source: OSEP

What Happens When You
Have Disappointing Results
State Level Applications

View of a Results-Focused System
Improved Outcomes/
Results

View of a Results-Focused System
Improved Outcomes/
Results

Collaboration and Coordination
View of a Results-Focused SystemCulture of
Empowerment and High
Expectations
Accountability & Evaluation
Improvement Practices
Improved Outcomes/
Results
Coherence with General
Education
Vision and Mission
Partnerships
GovernanceLeadership Quality Standards

View of a Results-Focused System
Improved Outcomes/
Results

View of a Results-Focused System
Data on Processes
and Results
Improved Outcomes/
Results

View of a Results-Focused System
Policies, Procedures
and Effective
Implementation
Data on Processes
and Results
Improved Outcomes/
Results

View of a Results-Focused System
Policies, Procedures & Effective
Implementation
Data on Processes
and Results
Integrated Monitoring Activities
Improved Outcomes/
Results

View of a Results-Focused SystemSystemic Improve
ment Plan
Policies, Procedures & Effective Implement
ation
Data on Processes
and Results
Integrated Monitoring Activities
Improved Outcomes/
Results

View of a Results-Focused SystemSystemic Improve
ment Plan Policies,
Procedures and
Effective Implementa
tion
Targeted Technical
Assistance & Professional
Development
Integrated Monitoring Activities
Data on Processes
and Results
Improved Outcomes/
Results

View of a Results-Focused System
Systemic Improve
ment Plan Policies,
Procedures and
Effective Implement
ation
Data on Processes
and Results
Targeted Technical
Assistance & Professional
Development
Effective Dispute
Resolution
Fiscal Manage-
ment
Integrated Monitoring Activities
Improved Outcomes/
Results

Collaboration and Coordination
View of a Results-Focused System
Systemic Improvement
Plan
Policies, Procedures and
Effective Implementation
Data on Processes and
Results
Targeted Technical
Assistance and Professional
Development
Effective Dispute
Resolution
Fiscal Management
Integrated Monitoring Activities
Culture of Empowerment
and High Expectations
Accountability & Evaluation
Improvement Practices
Improved Outcomes/
Results
Coherence with General
Education
Vision and Mission
Partnerships
GovernanceLeadership Quality Standards

View of a Results-Focused System
Systemic Improve-
ment Plan
Improved Outcomes/
Results

Phase 1: FFY 2013-14
(Reported in April, 2015)
Data Analysis
Identify SIMR
Analyze Infrastructure
to Support Improvement
& Build Capacity
Theory of Action (If-Then)
State Systemic Improvement Plan (SSIP)Comprehensive, Multi-Year Plan for Improving Results
for Students, includes 3 Phases:
Adapted from OSEP presentation

54
SSIP
SSIP
Phase 1
SSIP
Phase 1 & 2
SSIP
Phase 3SSIP Phase
1 & 2
Why is this
Happening ?What is the
Problem ?
What shall
we do
about it?
How Well
is the
Solution
Working?
• Initiate Data Analysis
• Conduct broad Infrastructure Analysis
• Identify problem area
• Root Cause Analysis (inc.infrastructure) ID factors
• For each factor, ID barriers & leverage points for improvement
•Search/evaluate evidence-based solutions
• Evaluation of progress annually
• Adjust plan as needed
•Develop Action Steps •Develop Theory of Action
•Develop Plan for Improvement
Adapted from OSEP presentation

Data AnalysisBroad,
Quantitative, &Qualitative
Infrastructure Analysis
Broad, Quantitative, &Qualitative
SIMR - A Focus for Improvement
What are the
Problems ?
In-Depth Data
Analysis
In Depth Infrastructure
AnalysisTheory of Action
‘Why’ We Will Do
What We Do
What’s a Pivotal Problem?
Limited = 31 states
Broad = 25 states
??? = 3 states

WI DPI’s
Theory of Action

Reading Drives
Achievement:
Success through Literacy
(RDA:StL)
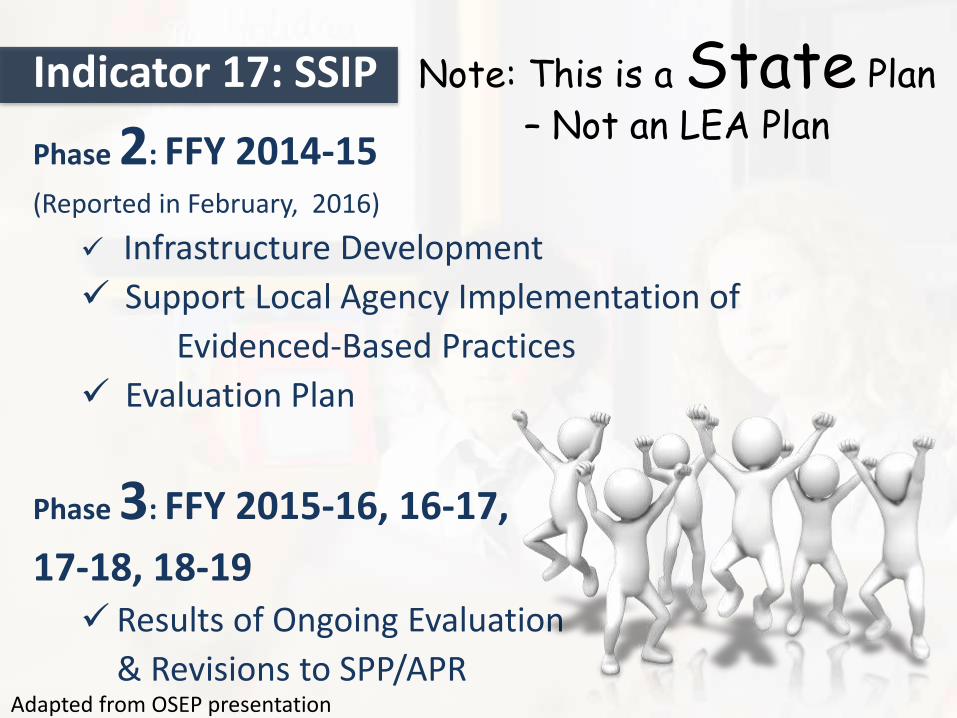
Phase 2: FFY 2014-15(Reported in February, 2016)
Infrastructure Development
Support Local Agency Implementation of
Evidenced-Based Practices
Evaluation Plan
Phase 3: FFY 2015-16, 16-17,
17-18, 18-19 Results of Ongoing Evaluation
& Revisions to SPP/APR
Indicator 17: SSIP Note: This is a State Plan
– Not an LEA Plan
Adapted from OSEP presentation
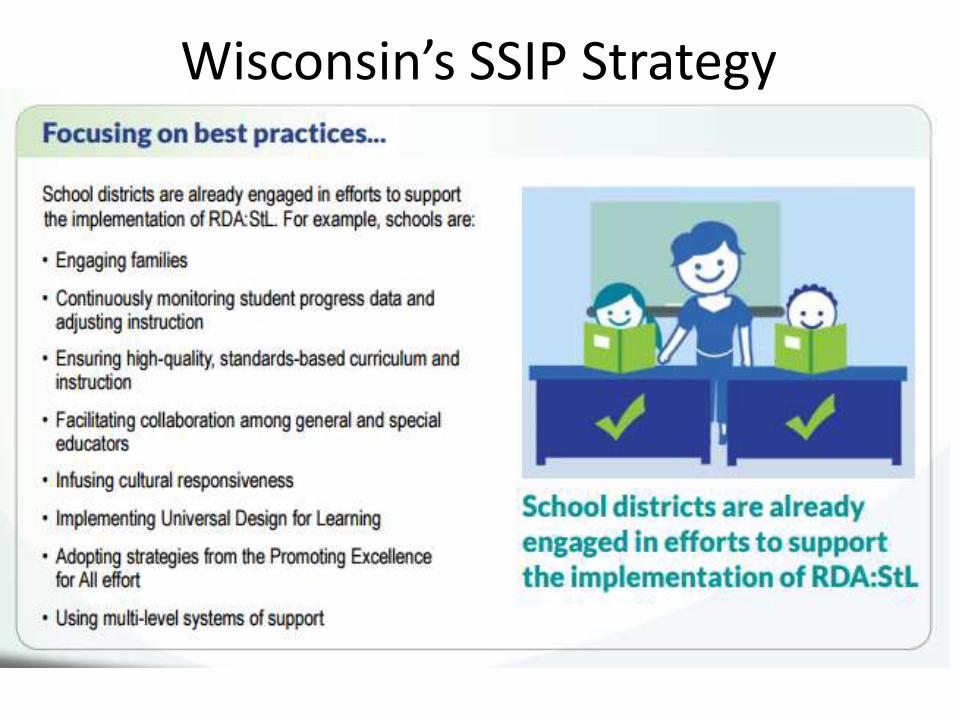
Wisconsin’s SSIP Strategy

How does RDA Affect You ?
What Impact ?
Preparing for What You Can Do
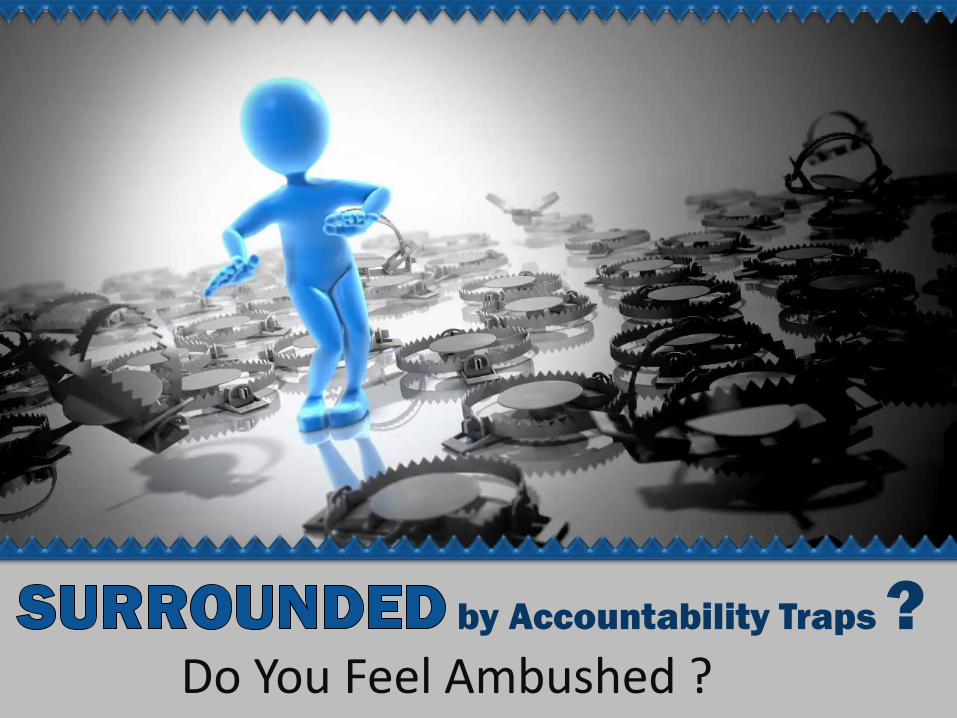
by Accountability Traps ?Do You Feel Ambushed ?

Think, Write, then
Turn & TalkYour Focus:
What Steps Do
You Take to
Engage Yourself
and Others in the
Shift towards
Results?

Begin
3 MINUTESThink for Yourself,
Make Notes
Your Focus: What Steps Do You Take to Engage Yourself and Others in theShift towards Results?

2MINUTES
Start
Talking!
Your Focus: What Steps Do You Take to Engage Yourself and Others in theShift towards Results?

1 MINUTE
Start
Wrapping
Up
Your Focus: What Steps Do You Take to Engage Yourself and Others in theShift towards Results?

Come Back!

Let’s Debrief
Your Focus: What Steps Do You Take to Engage Yourself and Others in theShift towards Results?
Steps?
Others?

In Thinking about Your District
1. What
Challenges
do You See
in Addressing
RDA?

Critical Points
• Performance on Procedural Compliance in
the past Several Years
• Performance on Results Measures in the
past Several Years
• State’s SIMR & Your Performance
• Capacity to Support Staff in Improving
Results
• Sustaining Procedural Compliance while
Improving Results

In Thinking about Your District
2. What
Resources do
You Need in
Addressing
RDA?

Critical Points
• Resources You have Now to Emphasize
Improving Results
• Identified Needs of Staff
• Data Sources to Measure and Visualize
performance
• State’s Commitment to Continuing
Professional Learning
• Costs to Sustain Gains Realized in Next few
Years

In Thinking about Your District
3. What are the
Public/Political
Implications in
Your
Community for
RDA?

Critical Points
• State’s Process to Determine LEA Status
Determinations?
• State’s Process for Disseminating this
Information to the Public, if at all?
• Current Local Stakeholder Involvement in
Efforts to Improve Results
• Current Attitudes Towards Special Education

Center for Performance
Assessment © 2006
74
Things
that
Matter
Things
You
Can
Control
What You Should Focus On
Actionable

What will You Have on
YOUR Tombstone
S/he Made Measurable Differences.
R.I.P.
????
???????
1955 – 20??
Reflection

