what’ s in-store for online grocery … for online grocery shoppin g omnichannel strategies to...
TRANSCRIPT

W H AT ’S I N-S TO R E F O R O N L I N E G R O C E R Y S H O P P I N G OMNICHANNEL STRATEGIES TO REACH CROSSOVER SHOPPERS
JANUARY 2017
2 2017 CONNECTED COMMERCE REPORT
THE BLURRING LINES BETWEEN ON AND OFFLINE SHOPPING
AROUND THE WORLD• Durableandservice-orientedcategoriescontinuetoleadthewayinself-reportedonline
purchasingamongsurveyrespondents,butseveralconsumablecategoriesaregrowingin
popularity—especiallypersonal-careandbeautycategoriesandmeal-kitandrestaurantservices.
• Onlineandofflineswitchingbehaviorssuggestthatthemajorityofconsumerswhohave
purchasedcertaindurableandservice-relatedproductsonlinecontinuetoshoponlinemore
frequentlythaninstoreforthesecategories.Theoppositeistrueforfreshandpackagedgroceries
andmedicineorhealth-careproducts.
• Foronlinepurchasingofconsumables,themosteffectiveactivationstrategyamong“trialists”
(purchasedonlineinthepastbutnotrecently)and“considerers”(currentlydon’tbuyonlinebut
wouldconsiderbuying)isamoney-backguaranteeforproductsnotmatchingwhatwasordered.
Forfreshfoods,strategiesthataddressqualityconcernstopthelist.
• Forconsumablecategories,themostimpactfulwaytoreachconsumerswithmessaging
thatinfluencespurchasebehavioriswithtraditionaltouchpoints,suchasvisitstoaphysical
store.Forconsumerelectronicsandfashionpurchasingdecisions,themostcommonlycited
informationsourcesaredigitaltouchpoints,suchasstoreorbrandwebsites.
• Onlyasmallpercentageofconsumersaroundtheworldsaythey’reusingin-storeandonline
digitaltechnologiestoaidintheirshopping,butusageisgrowing.
3Copyright © 2017 The Nielsen Company
Ifwehadtochooseasinglewordtodescribetoday’sconsumers,
“connected”wouldsurelyrisetothetopofthelist.Infact,with
3.5billionpeopleusingtheinternet,7.4billionmobile-phone
subscriptionsand1.79billionactiveFacebookusers,1connected
mightnotevenadequatelydescribethecurrentmarketplace.
Increasingly,everythingandeveryoneismovingonline,resultingin
thebreakingofoldhabitsandestablishmentofnewones.Indeed,
digitalhasdisruptedawholehostofinteractions,includingtheway
wewatchvideocontentandthewayswecommunicatewithfriends
andfamily.
Thewayweshopisnoexception.Digitalretailinggivesconsumers
morewaystoshopandmoreaccesstoproductsandservicesthan
everbefore.It’sclearthatconsumersareembracingthefreedomof
shoppingwheneverandwherevertheyplease,asonlinesalesare
capturingadouble-digitshareofretaildollarsinsomemarkets.
InChina—theworld’slargeste-commercemarket—onlineretail
salesaccountedfor12.9%ofthetotalretailpurchasesin2015;in
SouthKorea,itwas11.6%.2InGreatBritain,onlineaccountedforan
averageof12.5%ofallretailspendingthroughthefirst10months
of2016,andintheU.S.,e-commercerepresentedanaverage8.1%
oftotalretailsalesthroughthefirstthreequartersof2016,3arate
thatNielsenprojectswillgrowatacompoundannualgrowthrate
(CAGR)of12.2%through2020.
Whilethesemeasuresshowmoresalesgoingonline,theactual
consumerbehaviorisalittlemorecomplicated,asthelinesbetween
onlineandoff linechannelscontinuetoblur.Traditionalbrick-and-
mortarretailersareexpandingtheirdigitalpresence,whilepure-play
retailersareopeningphysicalstores.Thenotionofbeingconnected
istakingonnewmeaning:Retailersareimplementinginnovative
digitaltechnologiesthataretransformingtheshoppingexperience,
inordertobecomemorerelevanttoconsumers’lifestylesand
shoppingoccasions.Thinkingintermsofbricksversusclicksis
outdated;bricks-and-clicksisthecurrentandfutureretailreality.
1Mobile-phonesubscriberdatafromInternationalTelecommunicationUnion(2016).FacebookuserdatafromFacebook(September2016).2NationalBureauofStatisticsofChina;StatisticsKorea.3U.K.OfficeforNationalStatistics;CensusBureau,U.S.DepartmentofCommerce.
BRICKS VERSUS CLICKS IS OUTDATED; BRICKS-AND-CLICKS IS THE CURRENT AND FUTURE RETAIL REALITY.
4 2017 CONNECTED COMMERCE REPORT
ABOUT THE STUDY
NielsenGlobalE-Commercespansover20countriesaroundtheworld.Measurementmayrely
ondirectfromretailerdata(ePOS),datacollectedviaNielsen’sConsumerPanels,otherlicensed
data,oracombinationoftheforegoing.RetailsalesdataforChinaandFranceisforthetwo
yearsbeginningSeptember2014andendinginAugust2016.
Surveyfindingsarebasedonmorethan30,000respondentswithonlineaccessin63countries.
Whileanonlinesurveymethodologyallowsfortremendousscaleandglobalreach,itprovides
aperspectiveonthehabitsofonlyexistinginternetusers,nottotalpopulations.Indeveloping
marketswhereonlinepenetrationisstillgrowing,respondentsmaybeyoungerandmoreaffluent
thanthegeneralpopulationofthatcountry.Inaddition,surveyresponsesarebasedonclaimed
behavior,ratherthanactualmetereddata.Culturaldifferencesinreportingsentimentarelikely
factorsintheoutlookacrosscountries.Thereportedresultsdonotattempttocontrolorcorrect
forthesedifferences;therefore,cautionshouldbeexercisedwhencomparingacrosscountries
andregions,particularlyacrossregionalboundaries.
“Asshoppersincreasinglymoveseamlesslybetweenoff lineand
onlinechannels,purchasehabitsarechanging.Simplyadapting
tokeeppaceisnolongersufficient,”saidKristenCocco,vice
president,globale-commercemeasurement,Nielsen.“Savvy
marketersknowthatusingdigitaltoolsinnewandinnovativeways
toengagewithshoppersandinf luenceshoppingdecisionsmust
beapartoftheirgrowthplanforthefuture.Tocreatemaximum
ROIinanomni-channelenvironment,winningbrandsandretailers
mustknowtheirshoppers—theirdemandsandhowandwhat
they’rebuyingonlineandin-store—andthenleveragethespecific
touchpointsthatwillmaximizetheirshoppingexperience.”
TheNielsenGlobalConnectedCommerceSurveypolledonline
respondentsin63countriestounderstandtheunderlyingfactors
thatinf luencetheevolvingdigitalpathtopurchase.Weexamine
thepainpointsandbarriersassociatedwithbuyingfreshand
otherconsumableproductsonline,andweuncovertheactivation
strategiesthatcanhelpovercometheseobstacles.Wealsoprovide
aviewintothedigitaltechnologiesconsumersareusinginstores
todayandtheonesthatholdpromisefortomorrow.Finally,we
outlinethebiggestdisruptivetrendsthatwillfuelthegrowthof
connectedcommerceintheyearstocome.
5Copyright © 2017 The Nielsen Company
THE CONNECTED CATEGORY STORY: DURABLES DOMINATE, BUT CONSUMABLES GAIN TRACTIONGlobally,morethan93%ofrespondentsinNielsen’sonline
ConnectedCommerceSurveysaythey’veevershoppedonline—not
surprising,giventhatthefindingsarebasedoninternet-connected
consumers.Butthesignificanceofthisnumberisnoteworthy.Not
onlydoesitspeaktohowpervasiveonlineshoppingisamongthe
growingonlinepopulation,butalsoprovidesaninsightfulviewinto
purchasebehaviorsthatwillonlyaccelerateasinternetpenetration
continuestogrow.Andwhenitcomestobuyingonline,category
dynamicsaref luidandevolving.
Durableandservice-orientedcategoriescontinuetoleadtheway
inself-reportedonlinepurchasing,asexpected.Thesecategories
formedthebaselineofentryfore-commerce,andtheirpopularity
continuestoexpand.Morethanhalfofglobalrespondentsinthe
onlinestudysaythey’vepurchasedfashionproducts(58%)ortravel
productsorservices(55%)online,andhalfsaythey’vepurchased
books,musicorstationery.
Consumablecategories,incontrast,havebeenslowertogain
popularityamongonlineshoppers,butthatischanging—especially
forcategoriesthatarefillingparticularneedstatesexceptionally
well.Infact,nearlyfourin10globalrespondents(38%)saythey’ve
purchasedpersonal-careandbeautyproductsonline,andaboutone-
fourthsaythey’veorderedmeal-kitorrestaurantdeliveryservices
(27%)orpackagedgroceryfood(24%)online.
6 2017 CONNECTED COMMERCE REPORT
Meal-kitservicesareaninterestingexampleofanewretailmodel
thathastakentheU.S.bystorminthepastfewyears,with
companiescateringtojustabouteveryfoodpreference,fromvegan
toglutenfree.Theseserviceshavegainedtractionforseveral
reasons.Ingredientsaredeliveredstraighttoconsumers’doors
withcookinginstructions,eliminatingthedrudgeryofhavingto
planmealsandgotothestoretogettherequiredingredients.In
addition,theyhavewideappeal,offeringexoticf lavorsandamore
convenientsolutiontotraditionalcookingforbusyfoodenthusiasts,
whileprovidingguidanceforlessconfidentcooks.
“Meal-kitdeliveryservicesmeetconsumers’needsforconvenience
andcustomization,allowingtime-crunchedconsumerstochoose
frommyriadoptionsthatbestfittheirlifestyles,”saidCocco.“They
alsotapintothetrendtowardmorehealthfuleatingbyoffering
fresh,high-qualityingredients,whichiscreatingapowerfulrecipe
forgrowth.Manyopportunitiesexistforretailerstoleveragetheir
abilitytograbthein-storepurchaseanddelivery-to-homeoptionby
offeringmealkitsinadditiontoexpandingtheprepared-mealspace
tobettercompetewithrestaurantdeliveryservices.Whiledirect-to-
consumermeal-kitcompaniestendtofocusonorganicorlocally
sourcedproducts,asmoreretailersexpandtheirmeal-kitofferings,
largemanufacturershaveanopportunitytopartnerandincorporate
theirspecificingredients.”
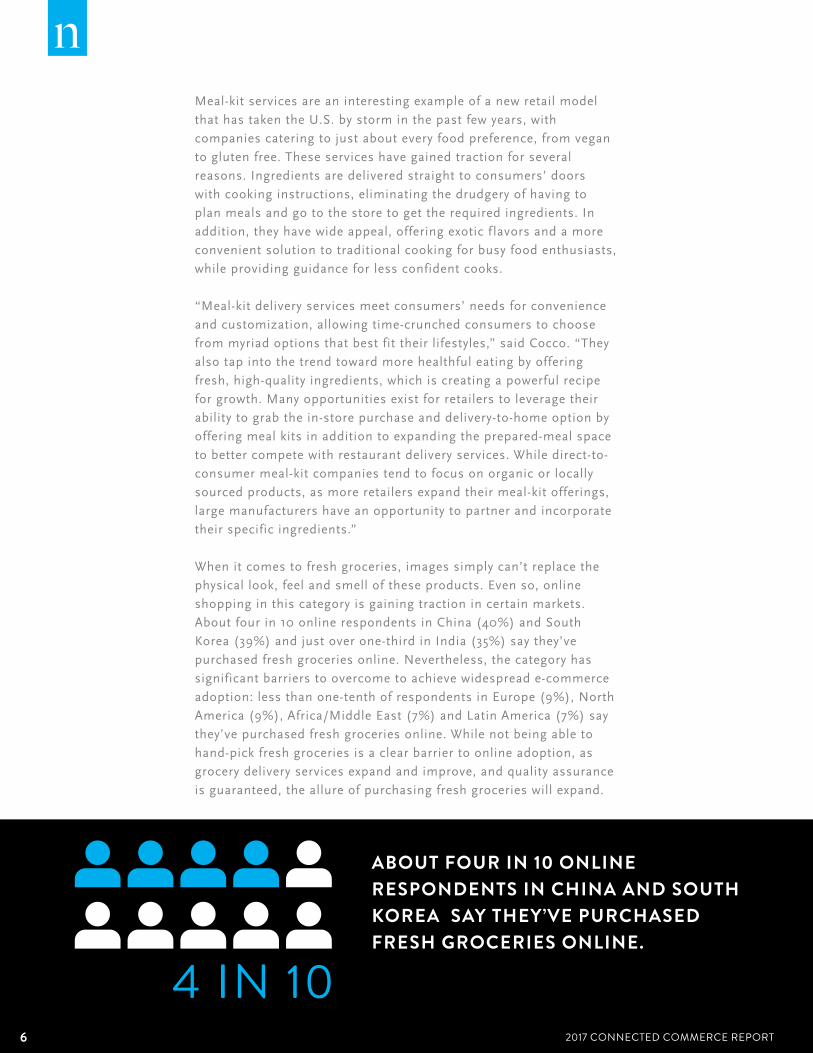
Whenitcomestofreshgroceries,imagessimplycan’treplacethe
physicallook,feelandsmelloftheseproducts.Evenso,online
shoppinginthiscategoryisgainingtractionincertainmarkets.
Aboutfourin10onlinerespondentsinChina(40%)andSouth
Korea(39%)andjustoverone-thirdinIndia(35%)saythey’ve
purchasedfreshgroceriesonline.Nevertheless,thecategoryhas
significantbarrierstoovercometoachievewidespreade-commerce
adoption:lessthanone-tenthofrespondentsinEurope(9%),North
America(9%),Africa/MiddleEast(7%)andLatinAmerica(7%)say
they’vepurchasedfreshgroceriesonline.Whilenotbeingableto
hand-pickfreshgroceriesisaclearbarriertoonlineadoption,as
grocerydeliveryservicesexpandandimprove,andqualityassurance
isguaranteed,theallureofpurchasingfreshgrocerieswillexpand.
ABOUT FOUR IN 10 ONLINE RESPONDENTS IN CHINA AND SOUTH KOREA SAY THEY’VE PURCHASED FRESH GROCERIES ONLINE.
4 IN 10

7Copyright © 2017 The Nielsen Company
GLOBAL PERCENTAGE WHO SAY THEY’VE EVER PURCHASED THE CATEGORY ONLINE
FASHION TOP COUNTRIES FOR SELECTED DURABLE
CATEGORIES
FASHION RELATED PRODUCTS
TRAVEL
BOOKS/MUSIC/STATIONERY
CONSUMER ELECTRONICS
BEAUTY & PERSONAL CARE
PACKAGED GROCERY FOOD
HOUSEHOLD CLEANING & PAPER
FRESH GROCERIES
TOP COUNTRIES FOR SELECTED CONSUMABLE
CATEGORIESTRAVEL
BOOKS/MUSIC/STATIONERY
IT AND MOBILE
EVENT TICKETS
CONSUMER ELECTRONICS
BEAUTY AND PERSONAL CARE
PRODUCTSFURNITURE,
DECOR, TOOLS
VIDEO GAME RELATED PRODUCTS
PACKAGED GROCERY FOOD
MEDICINE OR HEALTH CARE PRODUCTS
FRESH GROCERIES
FLOWERS OR GIFT SETS
WINE AND ALCOHOLIC BEVERAGES
PET FOOD AND SUPPLIES
PRODUCTS FOR BABY AND YOUNG
CHILDREN
HOUSEHOLD CLEANING AND PAPER
PRODUCTS
RESTAURANT DELIVERIES OR MEAL-KIT DELIVERY SERVICE
Source:TheNielsenGlobalConnectedCommerceSurvey,Q32016
CHINA 72%INDIA 68%GERMANY 68%SOUTH KOREA 67%AUSTRIA 66%
IRELAND 78%NORWAY 73%CHINA 68%INDIA 68%NEW ZEALAND 67%SWEDEN 67%UNITED ARAB EMIRATES 67%
JAPAN 68%AUSTRIA 68%SOUTH KOREA 66%GERMANY 66%SWEDEN 62%
CZECH REPUBLIC 62%UKRAINE 50%SLOVAKIA 50%BRAZIL 50%SOUTH KOREA 49%GREECE 49%LATVIA 49%
INDIA 50%SOUTH KOREA 48%CHINA 47%ROMANIA 43%UKRAINE 42%
CHINA 47%SOUTH KOREA 43%INDIA 34%JAPAN 29%TAIWAN 27%
SOUTH KOREA 44%CHINA 38%INDIA 37%TAIWAN 32%UNITED KINGDOM 24%
CHINA 40%SOUTH KOREA 39%INDIA 35%UNITED KINGDOM 25%ISRAEL 21%
DURABLES CONSUMABLES
BUYING CONSUMABLES ONLINE HAS ROOM TO GROW
58%
55%
50%
43%
41%
40%
38%
29%
27%
27%
24%
23%
23%
21%
18%
18%
14%
13%
8 2017 CONNECTED COMMERCE REPORT
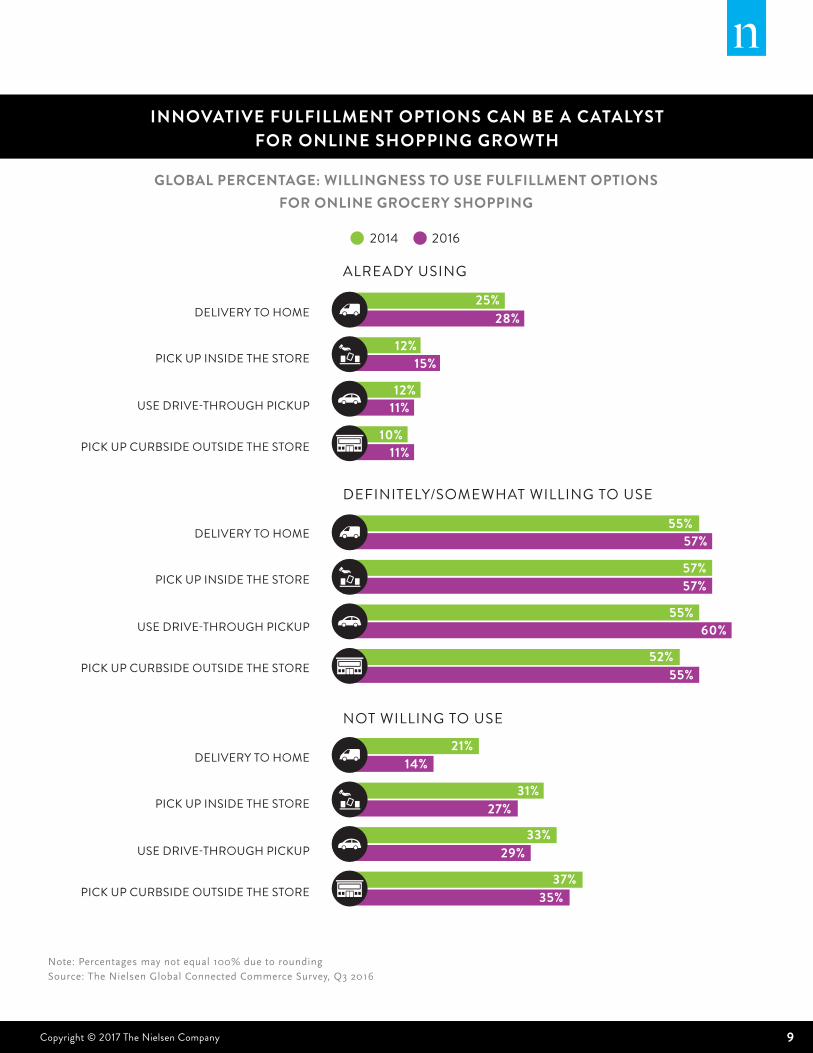
Innovativefulfillmentoptions,however,couldbeacatalystfor
growth.Orderingonlineforhomedeliveryhasbeenthetraditional
modelforconnectedcommerce,andit’sstillthemostpreferred.
However,homedeliveryisn’tparticularlywellsuitedtofresh
categories,whereperishabilityisaconcernandrefrigerationisa
basicrequirement.
Toovercomethesebarriers,retailersinahostofcountriesare
experimentingwithnewmodelsthatoffertheconvenienceof
e-commercewithoutthespoilageconcerns;examplesinclude
refrigeratedlockersatterminalstations,instantdeliveryservices
withinaone-ortwo-hourwindowand“togo”modelswhere
consumerscanorderonlineforpickupattheretailerduringa
specifiedtimeslot.Moreconsumersareopentotheseoptionsthan
havebeeninthepast.Nielsen’s2014E-commerceandtheNew
RetailSurveyshowedthat31%ofglobalrespondentswereunwilling
toorderonlineforpickupinsidethestore,and33%wereunwilling
toorderonlinefordrive-throughpickup(theclick-and-drivemodel
popularinFrance).In2016,resistancetoeachoftheseoptions
declinedbyfourpercentagepointsto27%and29%,respectively.
9Copyright © 2017 The Nielsen Company
GLOBAL PERCENTAGE: WILLINGNESS TO USE FULFILLMENT OPTIONS FOR ONLINE GROCERY SHOPPING
INNOVATIVE FULFILLMENT OPTIONS CAN BE A CATALYST FOR ONLINE SHOPPING GROWTH
ALREADY USING
DEFINITELY/SOMEWHAT WILLING TO USE
NOT WILLING TO USE
DELIVERY TO HOME
PICK UP INSIDE THE STORE
USE DRIVE-THROUGH PICKUP
PICK UP CURBSIDE OUTSIDE THE STORE
DELIVERY TO HOME
PICK UP INSIDE THE STORE
USE DRIVE-THROUGH PICKUP
PICK UP CURBSIDE OUTSIDE THE STORE
DELIVERY TO HOME
PICK UP INSIDE THE STORE
USE DRIVE-THROUGH PICKUP
PICK UP CURBSIDE OUTSIDE THE STORE
2014 2016
25%
12%15%
12%
10%
55%
55%
55%
14%
27%
29%
35%
52%
21%
31%
33%
37%
11%
11%
57%
60%
57%57%
28%
Note:Percentagesmaynotequal100%duetoroundingSource:TheNielsenGlobalConnectedCommerceSurvey,Q32016
10 2017 CONNECTED COMMERCE REPORT
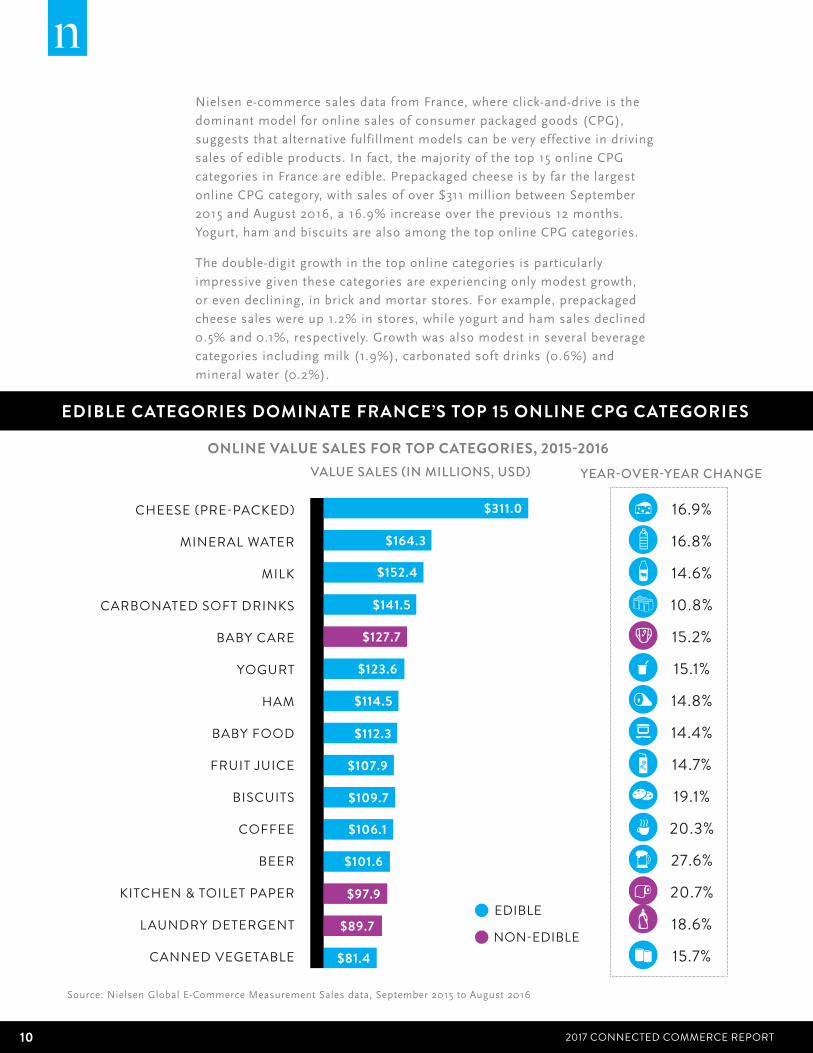
Nielsene-commercesalesdatafromFrance,whereclick-and-driveisthe
dominantmodelforonlinesalesofconsumerpackagedgoods(CPG),
suggeststhatalternativefulfillmentmodelscanbeveryeffectiveindriving
salesofedibleproducts.Infact,themajorityofthetop15onlineCPG
categoriesinFranceareedible.Prepackagedcheeseisbyfarthelargest
onlineCPGcategory,withsalesofover$311millionbetweenSeptember
2015andAugust2016,a16.9%increaseovertheprevious12months.
Yogurt,hamandbiscuitsarealsoamongthetoponlineCPGcategories.
Thedouble-digitgrowthinthetoponlinecategoriesisparticularly
impressivegiventhesecategoriesareexperiencingonlymodestgrowth,
orevendeclining,inbrickandmortarstores.Forexample,prepackaged
cheesesaleswereup1.2%instores,whileyogurtandhamsalesdeclined
0.5%and0.1%,respectively.Growthwasalsomodestinseveralbeverage
categoriesincludingmilk(1.9%),carbonatedsoftdrinks(0.6%)and
mineralwater(0.2%).
ONLINE VALUE SALES FOR TOP CATEGORIES, 2015-2016
EDIBLE CATEGORIES DOMINATE FRANCE’S TOP 15 ONLINE CPG CATEGORIES
CHEESE (PRE-PACKED)
MINERAL WATER
MILK
CARBONATED SOFT DRINKS
BABY CARE
YOGURT
HAM
BABY FOOD
FRUIT JUICE
BISCUITS
COFFEE
BEER
KITCHEN & TOILET PAPER
LAUNDRY DETERGENT
CANNED VEGETABLE
16.9%
16.8%
14.6%
10.8%
15.2%
15.1%
14.8%
14.4%
14.7%
19.1%
20.3%
27.6%
20.7%
18.6%
15.7%
VALUE SALES (IN MILLIONS, USD) YEAR-OVER-YEAR CHANGE
$311.0
$164.3
$152.4
$141.5
$127.7
$123.6
$114.5
$112.3
$107.9
$109.7
$106.1
$101.6
$97.9
$89.7
$81.4
Source:NielsenGlobalE-CommerceMeasurementSalesdata,September2015toAugust2016
EDIBLE
NON-EDIBLE
11Copyright © 2017 The Nielsen Company
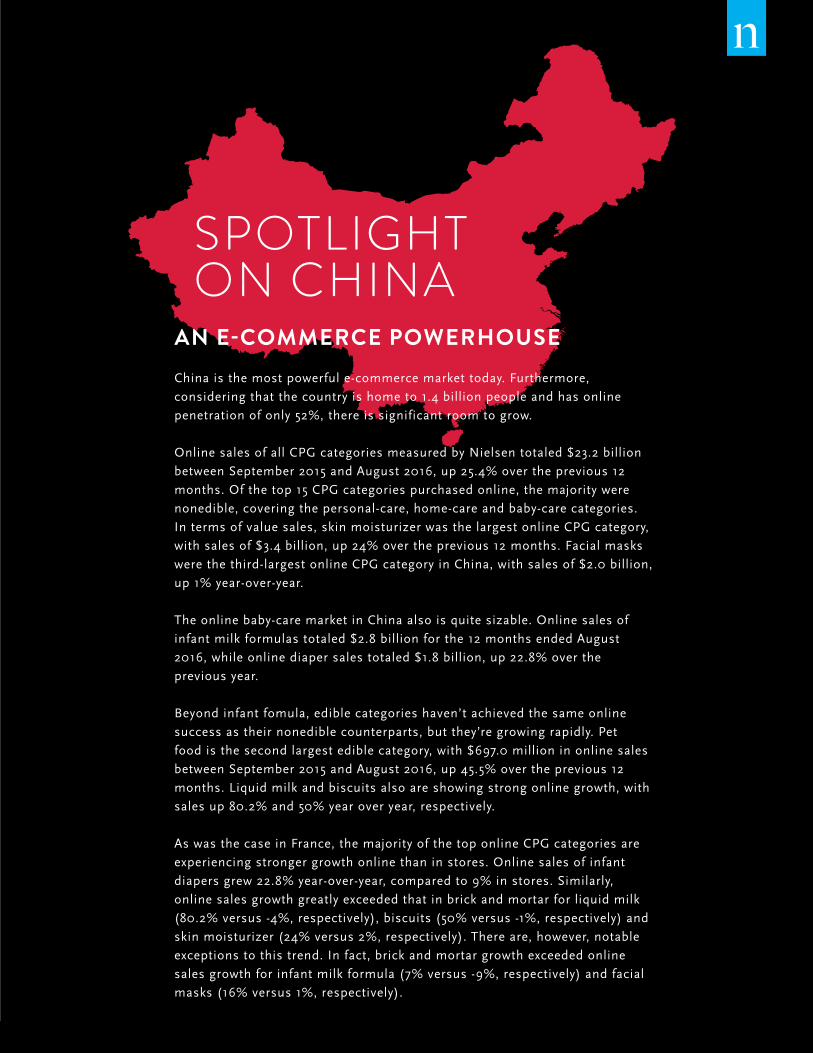
AN E-COMMERCE POWERHOUSE Chinaisthemostpowerfule-commercemarkettoday.Furthermore,
consideringthatthecountryishometo1.4billionpeopleandhasonline
penetrationofonly52%,thereissignificantroomtogrow.
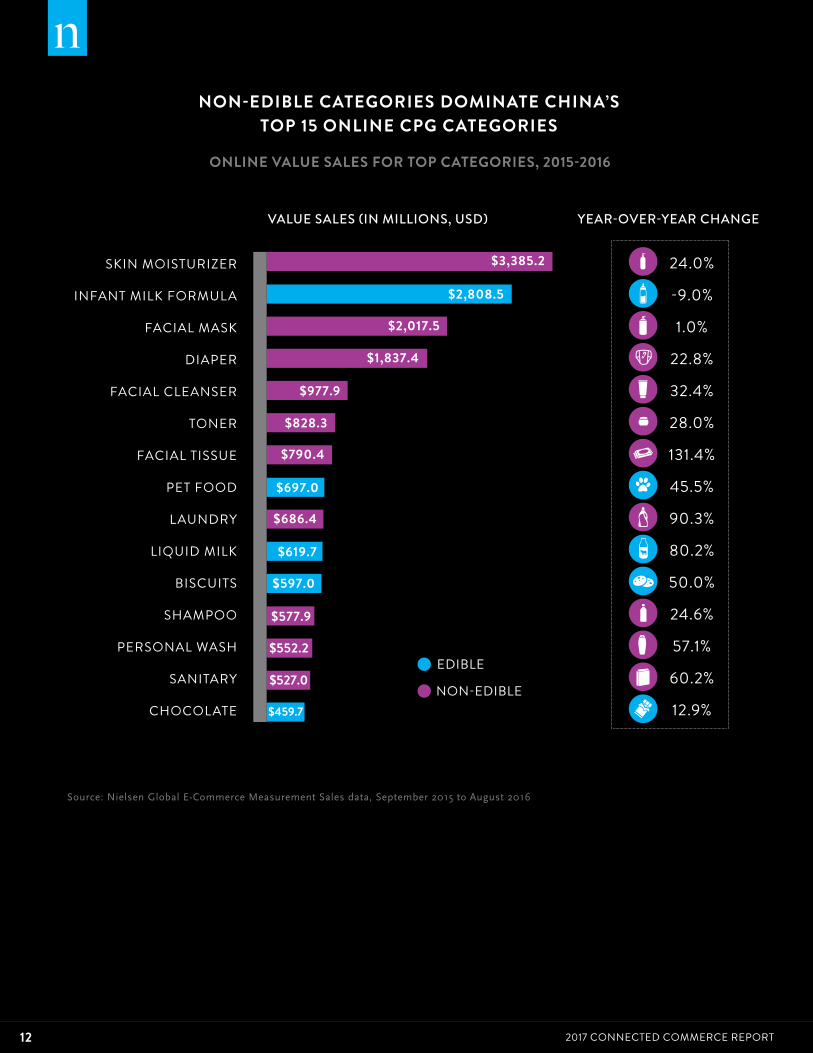
OnlinesalesofallCPGcategoriesmeasuredbyNielsentotaled$23.2billion
betweenSeptember2015andAugust2016,up25.4%overtheprevious12
months.Ofthetop15CPGcategoriespurchasedonline,themajoritywere
nonedible,coveringthepersonal-care,home-careandbaby-carecategories.
Intermsofvaluesales,skinmoisturizerwasthelargestonlineCPGcategory,
withsalesof$3.4billion,up24%overtheprevious12months.Facialmasks
werethethird-largestonlineCPGcategoryinChina,withsalesof$2.0billion,
up1%year-over-year.
Theonlinebaby-caremarketinChinaalsoisquitesizable.Onlinesalesof
infantmilkformulastotaled$2.8billionforthe12monthsendedAugust
2016,whileonlinediapersalestotaled$1.8billion,up22.8%overthe
previousyear.
Beyondinfantfomula,ediblecategorieshaven’tachievedthesameonline
successastheirnonediblecounterparts,butthey’regrowingrapidly.Pet
foodisthesecondlargestediblecategory,with$697.0millioninonlinesales
betweenSeptember2015andAugust2016,up45.5%overtheprevious12
months.Liquidmilkandbiscuitsalsoareshowingstrongonlinegrowth,with
salesup80.2%and50%yearoveryear,respectively.
AswasthecaseinFrance,themajorityofthetoponlineCPGcategoriesare
experiencingstrongergrowthonlinethaninstores.Onlinesalesofinfant
diapersgrew22.8%year-over-year,comparedto9%instores.Similarly,
onlinesalesgrowthgreatlyexceededthatinbrickandmortarforliquidmilk
(80.2%versus-4%,respectively),biscuits(50%versus-1%,respectively)and
skinmoisturizer(24%versus2%,respectively).Thereare,however,notable
exceptionstothistrend.Infact,brickandmortargrowthexceededonline
salesgrowthforinfantmilkformula(7%versus-9%,respectively)andfacial
masks(16%versus1%,respectively).
SPOTLIGHTON CHINA
12 2017 CONNECTED COMMERCE REPORT
24.0%
-9.0%
1.0%
22.8%
32.4%
28.0%
131.4%
45.5%
90.3%
80.2%
50.0%
24.6%
57.1%
60.2%
12.9%
ONLINE VALUE SALES FOR TOP CATEGORIES, 2015-2016
NON-EDIBLE CATEGORIES DOMINATE CHINA’S TOP 15 ONLINE CPG CATEGORIES
SKIN MOISTURIZER
INFANT MILK FORMULA
FACIAL MASK
DIAPER
FACIAL CLEANSER
TONER
FACIAL TISSUE
PET FOOD
LAUNDRY
LIQUID MILK
BISCUITS
SHAMPOO
PERSONAL WASH
SANITARY
CHOCOLATE
VALUE SALES (IN MILLIONS, USD) YEAR-OVER-YEAR CHANGE
$3,385.2
$2,808.5
$2,017.5
$1,837.4
$977.9
$828.3
$790.4
$697.0
$686.4
$619.7
$597.0
$577.9
$552.2
$527.0
Source:NielsenGlobalE-CommerceMeasurementSalesdata,September2015toAugust2016
EDIBLE
NON-EDIBLE$459.7
13Copyright © 2017 The Nielsen Company
ONCE ONLINE, ALWAYS ONLINE?Asimportantaswhatconsumersarebuyingonlineishowconnected
commerceisaffectingin-storebehaviors.Onceconsumersmakean
onlinepurchaseforaparticularcategory,dotheyshopforitmore
oftenonline?Ordotheyswitchbacktoin-storepurchasebehaviors?
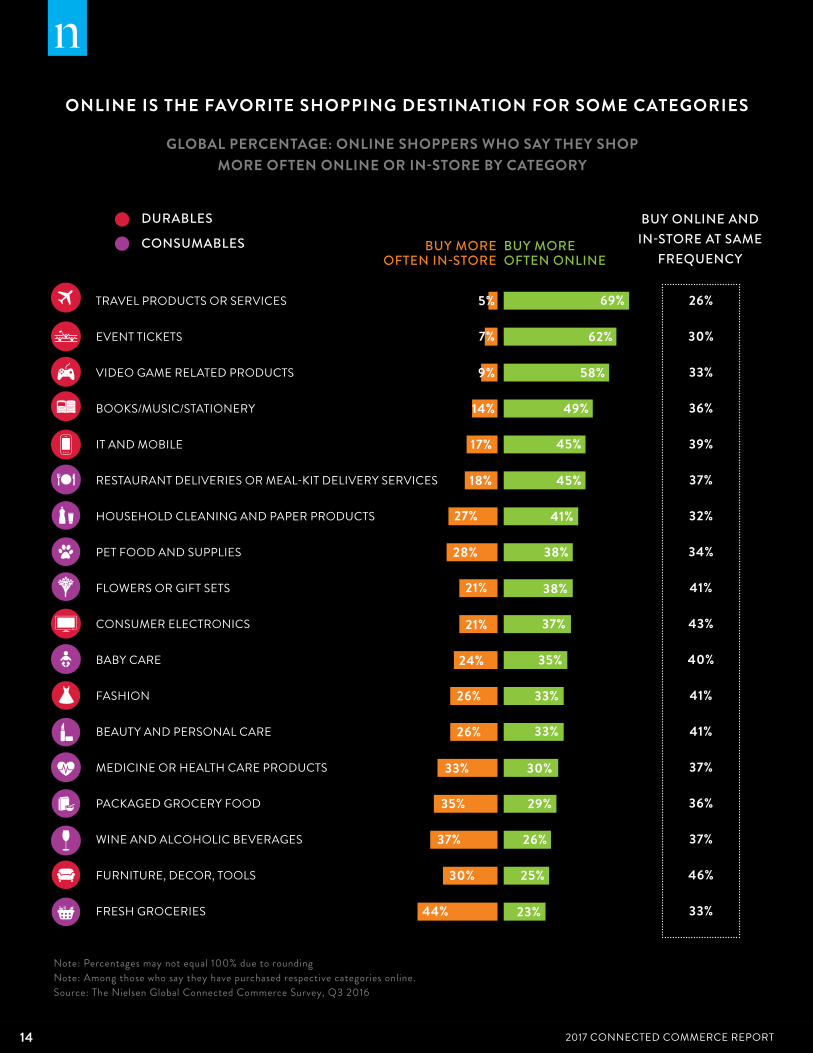
Inseveraldurableorservice-relatedcategories,findingssuggest
thatonceaconsumermakesanonlinepurchase,theonline
channelremainsthefavoriteshoppingdestination.Amongglobal
respondentswhosaythey’vepurchasedtravelproductsorservices
online,morethantwo-thirds(69%)saytheybuythecategorymore
oftenonlinethaninstore.Thesameistrueforeventticketsand
video-game-relatedproducts,whereroughlysixin10respondents
who’vepurchasedthecategoriesonlinesaytheypurchasemore
frequentlyonline(62%and58%,respectively)thaninstore.
Butthestoryisn’tthesameforalldurables.Forcategorieswith
highpricetags,infrequentpurchasingcycleandanexperiential
dimension(whereinteractingwiththeproductisimportant),the
onlinechannelisn’tnearlyasdominant.Forexample,amongglobal
respondentswhopurchasedconsumerelectronicsonline,only
37%saytheybuythecategorymoreoftenonline;21%saytheybuy
moreofteninstore,and43%saytheybuyonlineandinstoreatthe
samefrequency.Forfashion,33%saytheybuymoreoftenonline,
and26%buymoreofteninstore.Andforfurnitureanddécor,the
percentagesayingtheybuymoreofteninstore(30%)isgreaterthan
thepercentagesayingtheybuymoreoftenonline(25%),thoughthe
largestpercentagesaytheybuyinstoreandonlineequally(46%).
14 2017 CONNECTED COMMERCE REPORT
ONLINE IS THE FAVORITE SHOPPING DESTINATION FOR SOME CATEGORIES
GLOBAL PERCENTAGE: ONLINE SHOPPERS WHO SAY THEY SHOP MORE OFTEN ONLINE OR IN-STORE BY CATEGORY
BUY MORE OFTEN IN-STORE
BUY MORE OFTEN ONLINE
BUY ONLINE AND IN-STORE AT SAME
FREQUENCY
DURABLES
CONSUMABLES
26%
30%
33%
36%
39%
37%
32%
34%
41%
43%
40%
41%
41%
37%
36%
37%
46%
33%
TRAVEL PRODUCTS OR SERVICES
EVENT TICKETS
VIDEO GAME RELATED PRODUCTS
BOOKS/MUSIC/STATIONERY
IT AND MOBILE
RESTAURANT DELIVERIES OR MEAL-KIT DELIVERY SERVICES
HOUSEHOLD CLEANING AND PAPER PRODUCTS
PET FOOD AND SUPPLIES
FLOWERS OR GIFT SETS
CONSUMER ELECTRONICS
BABY CARE
FASHION
BEAUTY AND PERSONAL CARE
MEDICINE OR HEALTH CARE PRODUCTS
PACKAGED GROCERY FOOD
WINE AND ALCOHOLIC BEVERAGES
FURNITURE, DECOR, TOOLS
FRESH GROCERIES
5%
7%
9%
14%
17%
18%
27%
28%
21%
21%
24%
26%
26%
33%
35%
44%
30%
37%
62%
69%
58%
49%
45%
45%
41%
38%
38%
37%
35%
33%
33%
30%
29%
26%
25%
23%
Note: Percentages may not equal 100% due to roundingNote: Among those who say they have purchased respective categories online.Source: The Nielsen Global Connected Commerce Survey, Q3 2016
15Copyright © 2017 The Nielsen Company
Thestoryisequallymixedwhenitcomestoconsumablecategories.
Amongrespondentswhohavepurchasedhouseholdcleaningand
paperproductsonline,respondentsarelikeliesttosaytheybuymore
oftenonline(41%).Forbeautyandpersonalcare,one-thirdsaythey
buymoreoftenonline,while41%saytheybuyonlineandinstore
withthesamefrequency.
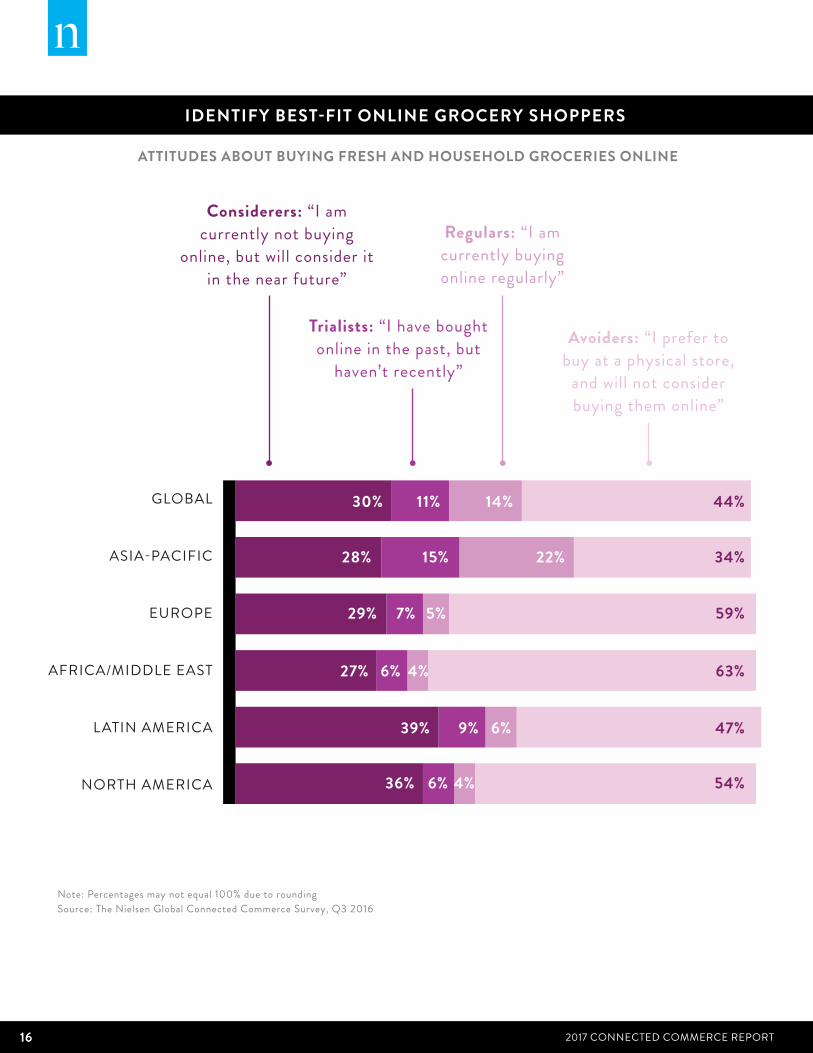
Forediblecategories,particularlyfresh,onlinefacesamore
difficultclimbtowidespreadadoption.Sixty-threepercentofonline
respondentsinAfrica/MiddleEastsaytheyprefertobuytheirfresh
andhouseholdgroceriesataphysicalstoreandwillnotconsider
buyingthemonline.InEurope,thesharewhosaythesameis
59%,andinNorthAmerica,it’s54%.Whilethemajoritywouldnot
considerbuyingfreshandhouseholdgroceriesonline,thereare
sizableproportionsofrespondentswhocanbeconsidered“regular”
onlineshoppers(thosewhoalreadybuytheseproductsonline),
“trialist”onlineshoppers(thosewhopurchasedonlineinthepast
butnotrecently)and“considerers”(thosewhocurrentlydonotbuy
onlinebutwouldconsiderbuyinginthefuture).
16 2017 CONNECTED COMMERCE REPORT
ATTITUDES ABOUT BUYING FRESH AND HOUSEHOLD GROCERIES ONLINE
IDENTIFY BEST-FIT ONLINE GROCERY SHOPPERS
GLOBAL
ASIA-PACIFIC
EUROPE
AFRICA/MIDDLE EAST
LATIN AMERICA
NORTH AMERICA
Considerers: “I am currently not buying
online, but will consider it in the near future”
Trialists: “I have bought online in the past, but
haven’t recently”
Avoiders: “I prefer to buy at a physical store,
and will not consider buying them online”
Regulars: “I am currently buying online regularly”
30%
28%
29%
27%
39%
36%
11%
15%
7%
6%
9%
6%
14%
22%
5%
4%
6%
4%
44%
34%
59%
63%
47%
54%
Note: Percentages may not equal 100% due to roundingSource: The Nielsen Global Connected Commerce Survey, Q3 2016
17Copyright © 2017 The Nielsen Company
CONVERTING TRIALISTS AND CONSIDERERS TO REGULAR ONLINE SHOPPERSConvertingtrialistsandconsidererstoactiveonlineshoppersfor
consumableproductssuchasfoodandbeverages,personal-care
products,andhealthandbeautyproductsrequiresovercomingseveral
barriers.
Thebiggestobstaclestoonlineshoppingforconsumablecategoriesare
theinabilitytoinspectgoodsanduncertaintyaboutproductqualityand
freshness.Morethantwo-thirdsofonlinerespondentstoNielsen’s2015
ConnectedCommerceSurvey(69%)agreedthattheyprefertoexamine
productspersonally,whilemorethansixin10onlinerespondents
(64%)agreedthattheywereconcernedaboutthefreshnessorqualityof
productspurchasedonline.
Secondaryonlineshoppingbarriersareconcernsaboutorderaccuracy
anddeliveryscheduling.Morethanhalfofonlinerespondentsinthe2015
surveysaidtheywereconcernedthatthegroceriestheyreceivedwouldn’t
accuratelymatchwhattheyordered(57%)orthatgrocerydeliveries
wouldtakeplacewhentheyweren’thome(55%).
Howcanbrandsconvincelapsedpurchasersandthosewhohavenever
purchasedonlinetobuyonline?
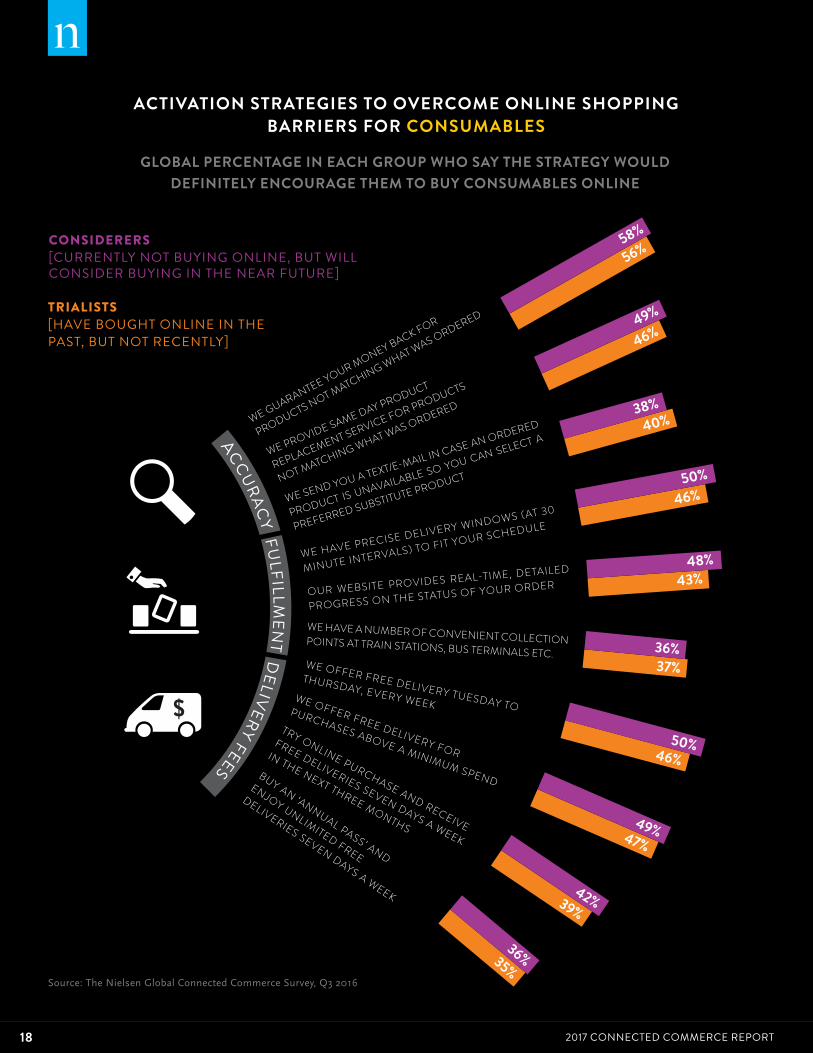
Forconsumablesingeneral,themosteffectivestrategiesaddress
accuracyconcerns.Byfarthemosteffectiveactivationstrategycited
amongbothtrialistsandconsiderersisamoney-backguarantee
forproductsnotmatchingwhatwasordered.Fifty-eightpercentof
considerersand56%oftrialistssaythisstrategywoulddefinitely
encouragethemtobuyconsumableproductsonline.
Strategiesaddressingrespondents’pricinganddelivery-scheduling
concernsalsohavethepotentialtobequiteeffective.Halfofconsiderers
(50%)and46%oftrialistssayprecisedeliverywindows(at30-minute
intervals)orfreedeliveryTuesdaytoThursdaywoulddefinitelyencourage
themtobuyconsumablesonline.Similarpercentages—49%of
considerersand47%oftrialists—sayfreedeliveryforpurchasesabovea
minimumspendinglevelwouldencouragethemtobuy.
18 2017 CONNECTED COMMERCE REPORT
ACTIVATION STRATEGIES TO OVERCOME ONLINE SHOPPING BARRIERS FOR CONSUMABLES
GLOBAL PERCENTAGE IN EACH GROUP WHO SAY THE STRATEGY WOULD DEFINITELY ENCOURAGE THEM TO BUY CONSUMABLES ONLINE
Source:TheNielsenGlobalConnectedCommerceSurvey,Q32016
WE GUARANTEE YOUR MONEY BACK FOR
PRODUCTS NOT MATCHING WHAT WAS ORDERED
OUR WEBSITE PROVIDES REAL-TIME, DETAILED
PROGRESS ON THE STATUS OF YOUR ORDER
WE PROVIDE SAME DAY PRODUCT
REPLACEMENT SERVICE FOR PRODUCTS
NOT MATCHING WHAT WAS ORDERED
WE HAVE A NUMBER OF CONVENIENT COLLECTION POINTS AT TRAIN STATIONS, BUS TERMINALS ETC.
WE SEND YOU A TEXT/E-MAIL IN CASE AN ORDERED
PRODUCT IS UNAVAILABLE SO YOU CAN SELECT A
PREFERRED SUBSTITUTE PRODUCT
WE OFFER FREE DELIVERY TUESDAY TO
THURSDAY, EVERY WEEK
WE HAVE PRECISE DELIVERY WINDOWS (AT 30
MINUTE INTERVALS) TO FIT YOUR SCHEDULE
WE OFFER FREE DELIVERY FOR
PURCHASES ABOVE A MINIMUM SPEND
TRY ONLINE PURCHASE AND RECEIVE
FREE DELIVERIES SEVEN DAYS A WEEK
IN THE NEXT THREE MONTHS
BUY AN ‘ANNUAL PASS’ AND
ENJOY UNLIMITED FREE
DELIVERIES SEVEN DAYS A WEEK
58%
56%
49%
46%
38%40%
50%46%
48%43%
36%37%
50%46%
49%47%
42%39%
36%35%
CONSIDERERS [CURRENTLY NOT BUYING ONLINE, BUT WILL CONSIDER BUYING IN THE NEAR FUTURE]
TRIALISTS [HAVE BOUGHT ONLINE IN THE PAST, BUT NOT RECENTLY]
ACCURACY FU
LFILL MEN
T DELIVERY FEES
19Copyright © 2017 The Nielsen Company
PERCENTAGE WHO SAY THE STRATEGY WOULD DEFINITELY ENCOURAGE THEM TO BUY CONSUMABLES ONLINE
LATIN AMERICAASIA-PACIFIC EUROPE AFRICA/MIDDLE EAST NORTH AMERICA
Source:TheNielsenGlobalConnectedCommerceSurvey,Q32016
53%
54%43%
60%46%
WE GUARANTEE YOUR MONEY BACK FOR PRODUCTS NOT MATCHING WHAT WAS ORDERED
WE OFFER FREE DELIVERY FOR PURCHASES ABOVE A MINIMUM SPEND
47%
46%
38%53%
37%
WE OFFER FREE DELIVERY TUESDAY TO THURSDAY, EVERY WEEK
44%
45%52%
39%
37%
45%53%
38%
36%47%
WE PROVIDE SAME DAY PRODUCT REPLACEMENT SERVICE FOR PRODUCTS NOT MATCHING WHAT WAS ORDERED
WE HAVE PRECISE DELIVERY WINDOWS (AT 30 MINUTE INTERVALS) TO FIT YOUR SCHEDULE
47%35%
39%50%
36%
OUR WEBSITE PROVIDES REAL-TIME, DETAILED PROGRESS ON THE STATUS OF YOUR ORDER
43%34%
43%53%
37%
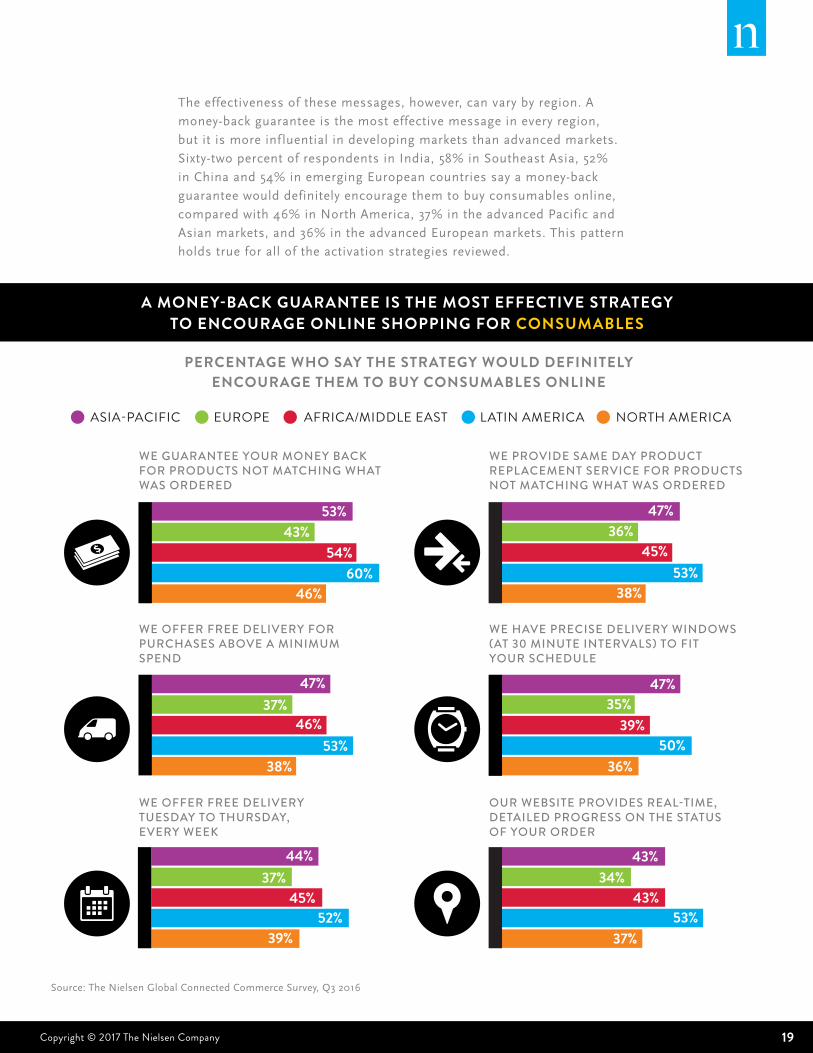
A MONEY-BACK GUARANTEE IS THE MOST EFFECTIVE STRATEGY TO ENCOURAGE ONLINE SHOPPING FOR CONSUMABLES
Theeffectivenessofthesemessages,however,canvarybyregion.A
money-backguaranteeisthemosteffectivemessageineveryregion,
butitismoreinf luentialindevelopingmarketsthanadvancedmarkets.
Sixty-twopercentofrespondentsinIndia,58%inSoutheastAsia,52%
inChinaand54%inemergingEuropeancountriessayamoney-back
guaranteewoulddefinitelyencouragethemtobuyconsumablesonline,
comparedwith46%inNorthAmerica,37%intheadvancedPacificand
Asianmarkets,and36%intheadvancedEuropeanmarkets.Thispattern
holdstrueforalloftheactivationstrategiesreviewed.
20 2017 CONNECTED COMMERCE REPORT
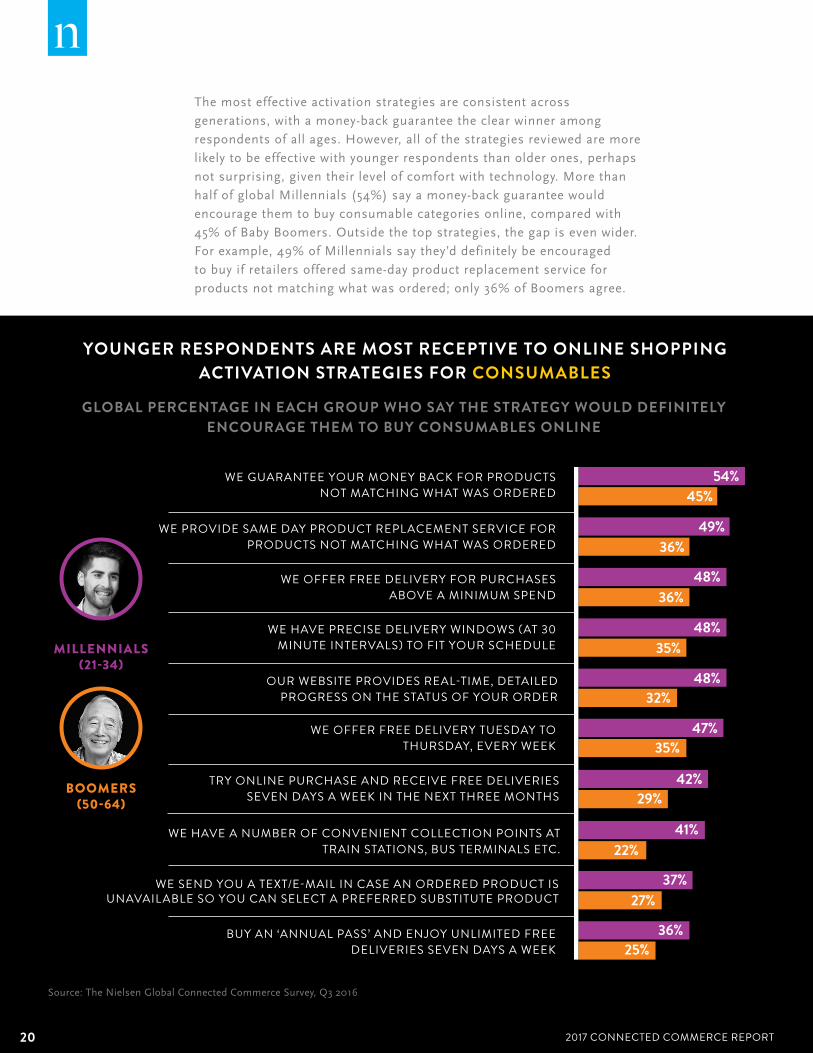
Themosteffectiveactivationstrategiesareconsistentacross
generations,withamoney-backguaranteetheclearwinneramong
respondentsofallages.However,allofthestrategiesreviewedaremore
likelytobeeffectivewithyoungerrespondentsthanolderones,perhaps
notsurprising,giventheirlevelofcomfortwithtechnology.Morethan
halfofglobalMillennials(54%)sayamoney-backguaranteewould
encouragethemtobuyconsumablecategoriesonline,comparedwith
45%ofBabyBoomers.Outsidethetopstrategies,thegapisevenwider.
Forexample,49%ofMillennialssaythey’ddefinitelybeencouraged
tobuyifretailersofferedsame-dayproductreplacementservicefor
productsnotmatchingwhatwasordered;only36%ofBoomersagree.
GLOBAL PERCENTAGE IN EACH GROUP WHO SAY THE STRATEGY WOULD DEFINITELY ENCOURAGE THEM TO BUY CONSUMABLES ONLINE
YOUNGER RESPONDENTS ARE MOST RECEPTIVE TO ONLINE SHOPPING ACTIVATION STRATEGIES FOR CONSUMABLES
MILLENNIALS(21-34)
BOOMERS(50-64)
Source:TheNielsenGlobalConnectedCommerceSurvey,Q32016
WE GUARANTEE YOUR MONEY BACK FOR PRODUCTS NOT MATCHING WHAT WAS ORDERED
WE PROVIDE SAME DAY PRODUCT REPLACEMENT SERVICE FOR PRODUCTS NOT MATCHING WHAT WAS ORDERED
WE OFFER FREE DELIVERY FOR PURCHASES ABOVE A MINIMUM SPEND
WE HAVE PRECISE DELIVERY WINDOWS (AT 30 MINUTE INTERVALS) TO FIT YOUR SCHEDULE
OUR WEBSITE PROVIDES REAL-TIME, DETAILED PROGRESS ON THE STATUS OF YOUR ORDER
TRY ONLINE PURCHASE AND RECEIVE FREE DELIVERIES SEVEN DAYS A WEEK IN THE NEXT THREE MONTHS
WE HAVE A NUMBER OF CONVENIENT COLLECTION POINTS AT TRAIN STATIONS, BUS TERMINALS ETC.
BUY AN ‘ANNUAL PASS’ AND ENJOY UNLIMITED FREE DELIVERIES SEVEN DAYS A WEEK
54%45%
49%36%
48%
48%
48%
42%
41%
36%
36%
35%
32%
29%
WE SEND YOU A TEXT/E-MAIL IN CASE AN ORDERED PRODUCT IS UNAVAILABLE SO YOU CAN SELECT A PREFERRED SUBSTITUTE PRODUCT
37%27%
22%
25%
WE OFFER FREE DELIVERY TUESDAY TO THURSDAY, EVERY WEEK
47%35%

21Copyright © 2017 The Nielsen Company
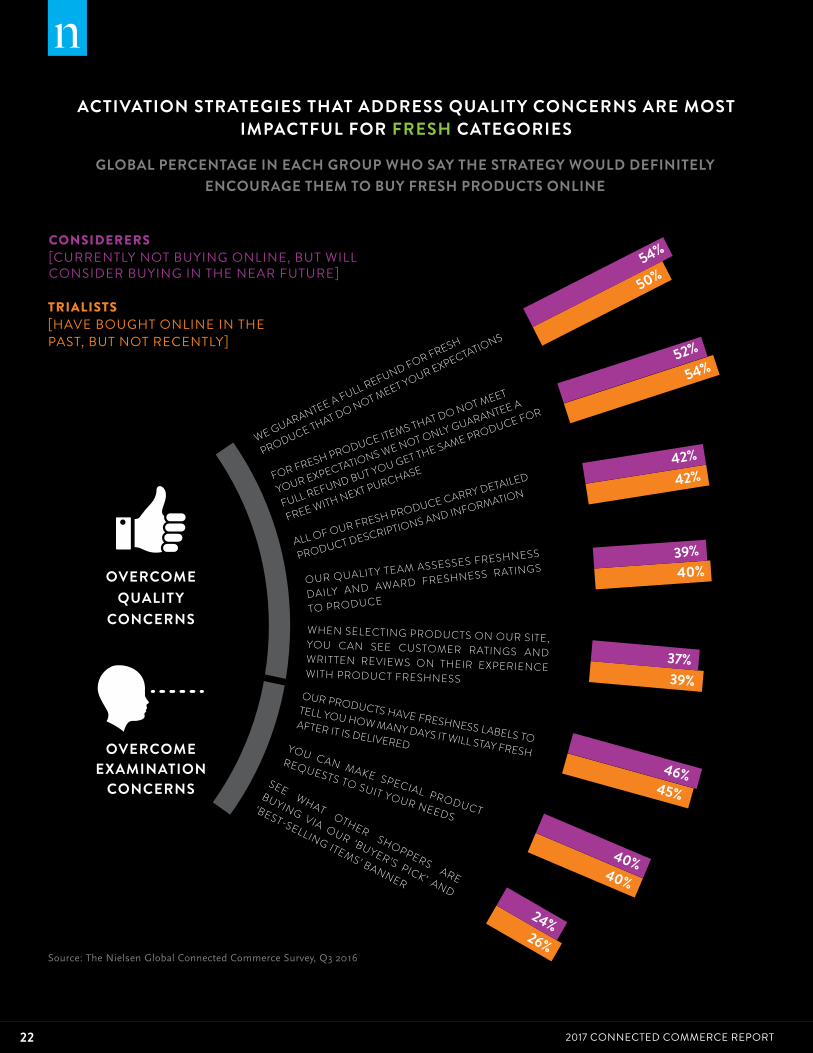
THE MOST PROMISING PRODUCE PITCH: FRESHNESS GUARANTEEDWhenitcomestoonlinepurchasesoffreshfoods,suchasfruit,
vegetables,meatanddairy,thereisaclearhierarchyintermsof
strategyeffectiveness,andit’sremarkablyconsistentamongboth
trialistsandconsiderers.Atthetopofthelistarestrategiesthat
addressconsumers’qualityconcerns.Afullrefundforfreshproduce
thatdoesn’tmeetconsumers’expectationsismostinf luential
amongbothtrialistsandconsiderers.However,whileconsiderers
aremostsatisfiedwitharefundalone(54%),trialistssayarefund
pairedwithareplacementproductontheirnexttripismost
inf luential(54%versus50%forarefundonly).
“Retailersneedtoassurestrictqualitystandardsandbewillingto
standbythemwhenconsumerexpectationsfallshort,”saidCocco.
“Includingfreshnesslabelstotellhowmanydaystheproductstays
freshafterit’sdeliveredwouldencouragemorethanfourin10
trialistsandconsiderers(46%and45%,respectively)tobuyfresh
foodsonline,and42%ineachgroupsaytheywoulddefinitelybe
encouragedbytheinclusionofdetailedproductdescriptionsabout
theoriginofthesupplierandnutritionalinformation.”
22 2017 CONNECTED COMMERCE REPORT
ACTIVATION STRATEGIES THAT ADDRESS QUALITY CONCERNS ARE MOST IMPACTFUL FOR FRESH CATEGORIES
GLOBAL PERCENTAGE IN EACH GROUP WHO SAY THE STRATEGY WOULD DEFINITELY ENCOURAGE THEM TO BUY FRESH PRODUCTS ONLINE
Source:TheNielsenGlobalConnectedCommerceSurvey,Q32016
WE GUARANTEE A FULL REFUND FOR FRESH
PRODUCE THAT DO NOT MEET YOUR EXPECTATIONS
WHEN SELECTING PRODUCTS ON OUR SITE, YOU CAN SEE CUSTOMER RATINGS AND WRITTEN REVIEWS ON THEIR EXPERIENCE WITH PRODUCT FRESHNESS
FOR FRESH PRODUCE ITEMS THAT DO NOT MEET
YOUR EXPECTATIONS WE NOT ONLY GUARANTEE A
FULL REFUND BUT YOU GET THE SAME PRODUCE FOR
FREE WITH NEXT PURCHASE
OUR PRODUCTS HAVE FRESHNESS LABELS TO
TELL YOU HOW MANY DAYS IT WILL STAY FRESH
AFTER IT IS DELIVERED
ALL OF OUR FRESH PRODUCE CARRY DETAILED
PRODUCT DESCRIPTIONS AND INFORMATION
YOU CAN MAKE SPECIAL PRODUCT
REQUESTS TO SUIT YOUR NEEDS
OUR QUALITY TEAM ASSESSES FRESHNESS
DAILY AND AWARD FRESHNESS RATINGS
TO PRODUCE
SEE WHAT OTHER SHOPPERS ARE
BUYING VIA OUR ‘BUYER’S PICK’ AND
‘BEST-SELLING ITEMS’ BANNER
CONSIDERERS [CURRENTLY NOT BUYING ONLINE, BUT WILL CONSIDER BUYING IN THE NEAR FUTURE]
TRIALISTS [HAVE BOUGHT ONLINE IN THE PAST, BUT NOT RECENTLY]
54%
50%
52%
42%
39%40%
37%39%
46%45%
40%40%
24%26%
42%
54%
OVERCOME QUALITY
CONCERNS
OVERCOME EXAMINATION
CONCERNS
23Copyright © 2017 The Nielsen Company
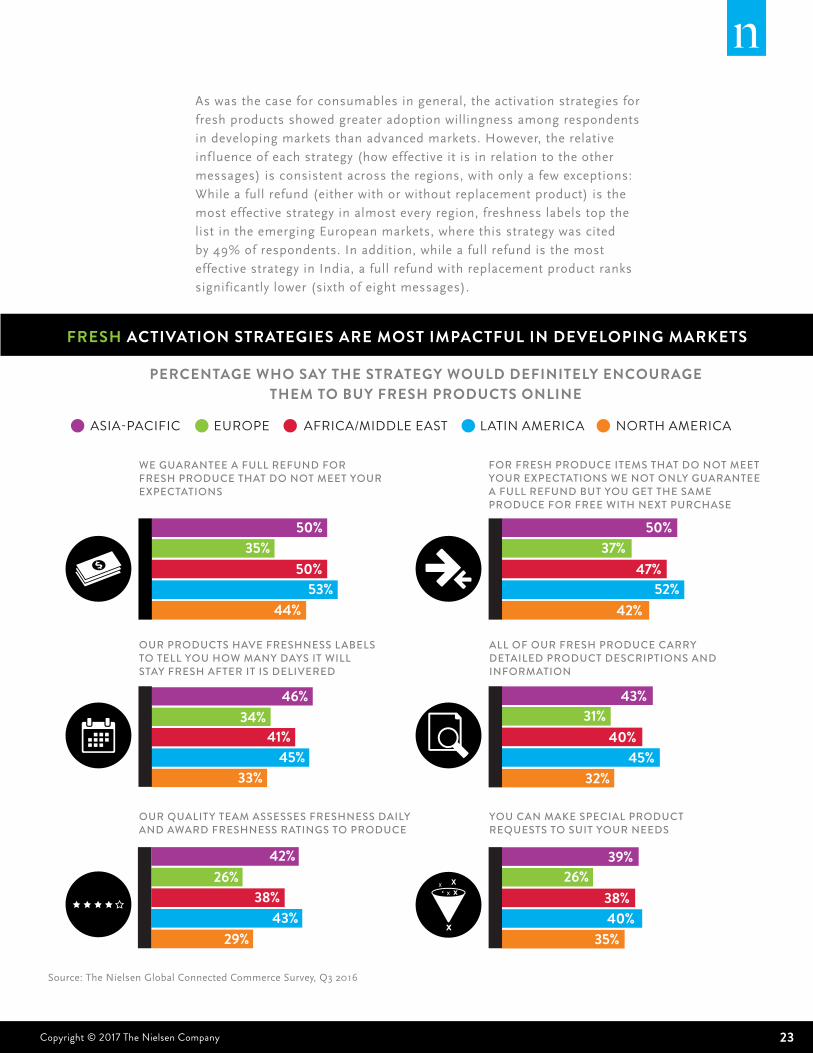
Aswasthecaseforconsumablesingeneral,theactivationstrategiesfor
freshproductsshowedgreateradoptionwillingnessamongrespondents
indevelopingmarketsthanadvancedmarkets.However,therelative
inf luenceofeachstrategy(howeffectiveitisinrelationtotheother
messages)isconsistentacrosstheregions,withonlyafewexceptions:
Whileafullrefund(eitherwithorwithoutreplacementproduct)isthe
mosteffectivestrategyinalmosteveryregion,freshnesslabelstopthe
listintheemergingEuropeanmarkets,wherethisstrategywascited
by49%ofrespondents.Inaddition,whileafullrefundisthemost
effectivestrategyinIndia,afullrefundwithreplacementproductranks
significantlylower(sixthofeightmessages).
PERCENTAGE WHO SAY THE STRATEGY WOULD DEFINITELY ENCOURAGE THEM TO BUY FRESH PRODUCTS ONLINE
LATIN AMERICAASIA-PACIFIC EUROPE AFRICA/MIDDLE EAST NORTH AMERICA
Source:TheNielsenGlobalConnectedCommerceSurvey,Q32016
50%
50%35%
53%44%
WE GUARANTEE A FULL REFUND FOR FRESH PRODUCE THAT DO NOT MEET YOUR EXPECTATIONS
OUR PRODUCTS HAVE FRESHNESS LABELS TO TELL YOU HOW MANY DAYS IT WILL STAY FRESH AFTER IT IS DELIVERED
46%
41%
33%45%
34%
OUR QUALITY TEAM ASSESSES FRESHNESS DAILY AND AWARD FRESHNESS RATINGS TO PRODUCE
42%
38%43%
29%
26%
47%52%
42%
37%50%
FOR FRESH PRODUCE ITEMS THAT DO NOT MEET YOUR EXPECTATIONS WE NOT ONLY GUARANTEE A FULL REFUND BUT YOU GET THE SAME PRODUCE FOR FREE WITH NEXT PURCHASE
ALL OF OUR FRESH PRODUCE CARRY DETAILED PRODUCT DESCRIPTIONS AND INFORMATION
43%31%
40%45%
32%
YOU CAN MAKE SPECIAL PRODUCT REQUESTS TO SUIT YOUR NEEDS
39%26%
38%40%
35%
FRESH ACTIVATION STRATEGIES ARE MOST IMPACTFUL IN DEVELOPING MARKETS
24 2017 CONNECTED COMMERCE REPORT
POWERFULLY PERSUASIVE INFORMATION SOURCESWhenitcomestoreachingconsumerswithmessagingtoinf luence
purchasing,whatsourcesaremosteffective?Forconsumable
categories,themostwidelycitedinformationsourcesusedin
purchasingdecisionsaretraditionaltouchpoints.Visitstoaphysical
storearehelpfulforallproductcategories,butthey’reclearlythe
mostinf luentialsourceforpersonal-careandfresh-groceryproducts.
Forty-fourpercentofglobalrespondentssayin-personstorevisits
helpthemdecidewhichfreshgroceriestobuy,andthepercentageis
39%forpersonal-careandbeautyproducts.Globally,wordofmouth
isthesecond-most-inf luentialsourceforthefresh-grocery(27%)
andpersonal-careandbeauty(32%)categories.
InNorthAmerica,in-personstorevisitsareparticularlyinf luential
fordecisionstopurchasefreshgroceries(52%)andpersonal-care
products(46%).Othersourcesmorewidelyusedforfresh-grocery
purchasedecisionsinNorthAmericathangloballyaref lyersor
directmailandcouponwebsites.Aboutone-quarterofNorth
Americanrespondentssaytheyusef lyersordirectmail(25%)or
couponanddiscountwebsites(24%)whenmakingpurchasing
decisionsaboutfreshgroceries,comparedwith18%foreachof
theseglobally.

25Copyright © 2017 The Nielsen Company
PERCENTAGE WHO SAY THE INFORMATION SOURCE HELPS WHEN MAKING A PURCHASE DECISION
VISIT TO THE PHYSICAL STORE
WEBSITES CONTAINING COUPONS OR DISCOUNTS
WORD OF MOUTH FROM SOMEONE YOU KNOW?
STORE WEBSITE
ONLINE USER REVIEWS (WRITTEN)
BLOGS OR SPECIAL INTEREST WEBSITES
BRAND WEBSITE
NEWSPAPER OR MAGAZINES (CONTENT OR ADS)
MARKETING E-MAILS
SOCIAL MEDIA
RECOMMENDATIONS/INFORMATION FROM STORE STAFF
FLYERS OR DIRECT MAILS
TV OR RADIO (SHOWS OR ADS)
ONLINE USER REVIEWS (VIDEO)
TRADITIONAL INFORMATION SOURCES
DEVELOPING MARKETS ADVANCED MARKETS
29%
26%
20%
14%
15%
16%
31%
27%
18%
14%
37%
28%
22%
24%
29%
26%
16%
11%
30%
27%
20%
18%
15%
13%
39%
28%
38%
20%
Note:SeelastpageofreportforlistofadvancedanddevelopingmarketsSource:TheNielsenGlobalConnectedCommerceSurvey,Q32016
BEAUTY & PERSONAL CARE
TRADITIONAL INFORMATION SOURCES ARE MOST IMPACTFUL FOR BUYING ONLINE CONSUMABLES
26 2017 CONNECTED COMMERCE REPORT
Conversely,forconsumerelectronicsandfashion,themost
commonlycitedinformationsourcesforpurchasingdecisionsare
digitaltouchpoints.Storewebsitestopthelistofsourcesusedto
makepurchasingdecisionsaboutfashionproducts(49%),andthat
sourceisthesecondmostcommonlycitedforconsumerelectronics
(42%).Forconsumerelectronics,brandwebsitesarethemost
widelycitedsource,whilestorewebsitesplacedthird(35%),behind
in-personvisits(40%).
Forallcategories,socialmediaismoreinf luentialinpurchasing
decisionsindevelopingmarketsthanadvancedones.Infact,it’s
amongthetopthreesourcesusedforfashionpurchasingdecisions
inIndia,SoutheastAsiaandAfrica/MiddleEast,andforpersonal-
careandbeautydecisionsinSoutheastAsiaandAfrica/MiddleEast.
Inallregions,socialmediahaslittleinf luenceinfresh-grocery
purchasingdecisions.
“Dependingonthecategoryandthecountry,themixoftraditional
anddigitalsourcesusedtoinf luencepurchasingmustbecarefully
considered,”saidCocco.“Themosteffectivestrategiesstartwith
akeenunderstandingofhowshoppersmakedecisionsalongthe
pathtopurchase—bothonlineandinstore—andthenoffering
touchpointsthatarespecificandrelevanttotheirneeds.”

27Copyright © 2017 The Nielsen Company
PERCENTAGE WHO SAY THE INFORMATION SOURCE HELPS WHEN MAKING A PURCHASE DECISION
STORE WEBSITE
ONLINE USER REVIEWS (WRITTEN)
VISIT TO THE PHYSICAL STORE
NEWSPAPER OR MAGAZINES (CONTENT OR ADS)
BRAND WEBSITE
BLOGS OR SPECIAL INTEREST WEBSITES
WORD OF MOUTH FROM SOMEONE YOU KNOW
RECOMMENDATIONS/INFORMATION FROM STORE STAFF
TV OR RADIO (SHOWS OR ADS)
SOCIAL MEDIA
ONLINE USER REVIEWS (VIDEO)
MARKETING E-MAILS
WEBSITES CONTAINING COUPONS OR DISCOUNTS
FLYERS OR DIRECT MAILS
DEVELOPING MARKETS ADVANCED MARKETS
32%
22%
19%
14%
9%
14%
39%
25%
24%
11%
39%
28%
43%
15%
31%
20%
18%
15%
32%
23%
20%
19%
13%
12%
52%
31%
41%
16%
Note:SeelastpageofreportforlistofadvancedanddevelopingmarketsSource:TheNielsenGlobalConnectedCommerceSurvey,Q32016
FASHION
DIGITAL AND TRADITIONAL INFORMATION SOURCES ARE IMPACTFULFOR BUYING ONLINE NON-CONSUMABLES
DIGITAL INFORMATION SOURCES
28 2017 CONNECTED COMMERCE REPORT
WHAT’S NEXT FOR IN-STORE DIGITAL-TECHNOLOGY ADOPTION?E-commerceisonlypartofthedigitalpicture.Increasingly,
storesaregoingdigitalasretailersincorporateavarietyof
digitaltools—fromdigitalcouponstosmartshelvestovirtual
stores.Thesetechnologiesbridgetheonlineandphysicalworlds,
bringingtheease,convenienceandpersonalizationofonline
intobrick-and-mortarstores.Andthey’renotjust“cool”nice-to-
havefeatures;theycreaterealvalueforretailers.In-storedigital-
enablementoptionshavebeenshowntoincreasedwelltime,
engagementlevels,basketsizeandshoppersatisfaction.
Whileonlyasmallpercentageofconsumersaroundtheworld
saythey’reusingdigitaltechnologies—forexample,in-store
handheldscanners,self-servicecheckoutsandmobileapps—to
aidintheirshopping,usageisgrowing.
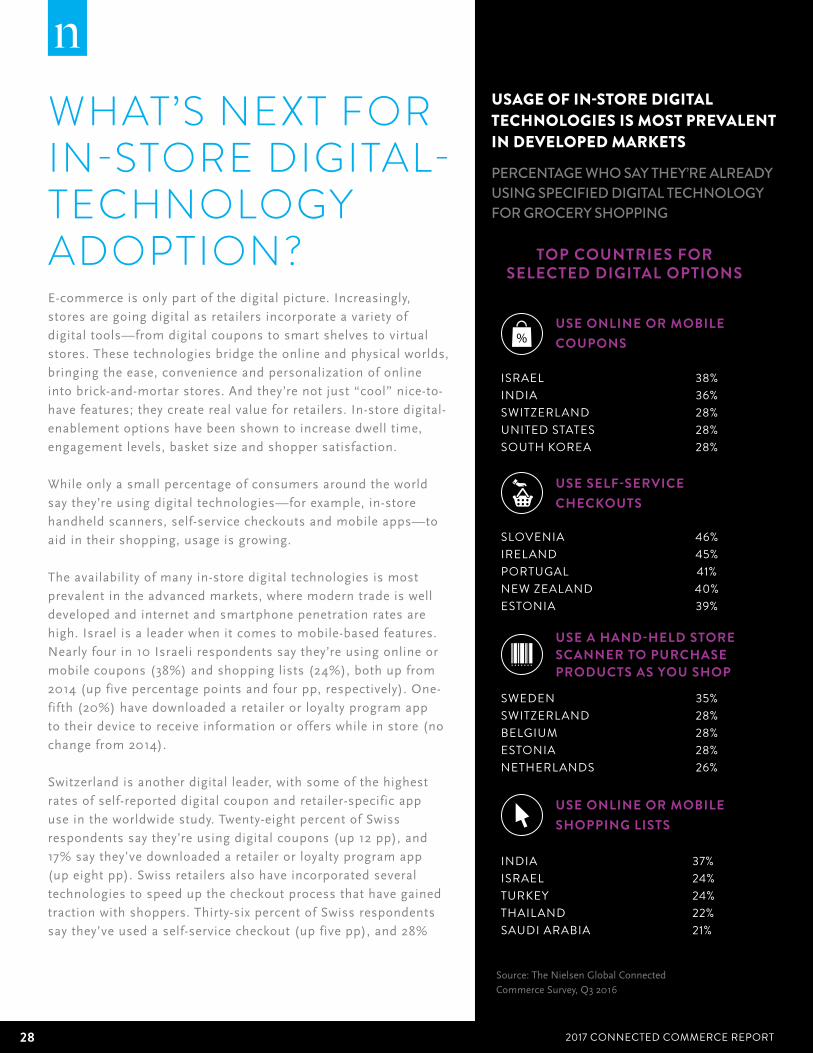
Theavailabilityofmanyin-storedigitaltechnologiesismost
prevalentintheadvancedmarkets,wheremoderntradeiswell
developedandinternetandsmartphonepenetrationratesare
high.Israelisaleaderwhenitcomestomobile-basedfeatures.
Nearlyfourin10Israelirespondentssaythey’reusingonlineor
mobilecoupons(38%)andshoppinglists(24%),bothupfrom
2014(upfivepercentagepointsandfourpp,respectively).One-
fifth(20%)havedownloadedaretailerorloyaltyprogramapp
totheirdevicetoreceiveinformationorofferswhileinstore(no
changefrom2014).
Switzerlandisanotherdigitalleader,withsomeofthehighest
ratesofself-reporteddigitalcouponandretailer-specificapp
useintheworldwidestudy.Twenty-eightpercentofSwiss
respondentssaythey’reusingdigitalcoupons(up12pp),and
17%saythey’vedownloadedaretailerorloyaltyprogramapp
(upeightpp).Swissretailersalsohaveincorporatedseveral
technologiestospeedupthecheckoutprocessthathavegained
tractionwithshoppers.Thirty-sixpercentofSwissrespondents
saythey’veusedaself-servicecheckout(upfivepp),and28%
USAGE OF IN-STORE DIGITAL TECHNOLOGIES IS MOST PREVALENT IN DEVELOPED MARKETS PERCENTAGE WHO SAY THEY’RE ALREADY USING SPECIFIED DIGITAL TECHNOLOGY FOR GROCERY SHOPPING
TOP COUNTRIES FOR SELECTED DIGITAL OPTIONS
USE ONLINE OR MOBILE COUPONS
USE SELF-SERVICE CHECKOUTS
USE A HAND-HELD STORE SCANNER TO PURCHASE PRODUCTS AS YOU SHOP
USE ONLINE OR MOBILE SHOPPING LISTS
ISRAEL 38%INDIA 36%SWITZERLAND 28%UNITED STATES 28%SOUTH KOREA 28%
SLOVENIA 46%IRELAND 45%PORTUGAL 41%NEW ZEALAND 40%ESTONIA 39%
SWEDEN 35%SWITZERLAND 28%BELGIUM 28%ESTONIA 28%NETHERLANDS 26%
INDIA 37%ISRAEL 24%TURKEY 24%THAILAND 22%SAUDI ARABIA 21%
Source:TheNielsenGlobalConnectedCommerceSurvey,Q32016
29Copyright © 2017 The Nielsen Company
areusinghandheldscannersastheyshop,ratherthanstanding
incheckoutlinestopurchaseproducts(downonepp).Theonly
countrywithhigherself-reporteduseofhandheldscannersis
Sweden.Thirty-fivepercentofSwedishrespondentssaythey
usehandheldscannerstoavoidcheckoutlines(downthreepp).
Slightlymore(36%)saytheyuseself-checkout(downtwopp).
Whyhavethesetoolsgainedtractioninthesemarkets?Above
all,availabilityiscentral.InIsrael,alargepharmacychainhas
averypopularappthatincludesashopping-listfeatureas
wellaspersonalizedandgeneralcoupons.InSwitzerland,two
majorretailersdominatethegrocerymarket—with80%share—
reachingnearlyeverySwissshopper.Bothoftheseretailers
haveincorporateddigitaltechnologiesintheirstores—for
example,introducingmobileappsthatincludemobilecoupons
andpayments.Finally,inSweden,handheldscannershave
beeninthemarketforover10yearsandareavailableinalmost
allofthehypermarkets.Attitudestowardtechnologyandhigh
adoptionsratesalsoareimportantgrowthdrivers.Israelhas
ahighconcentrationofearlyadoptersandoneofthehighest
smartphonepenetrationratesintheworld,whileSwedenand
Switzerlandaregloballeadersintermsofsmartphoneand
internetadoption.
Whileuseofsomedigitaltoolsmaybehigherinadvanced
markets,theexamplesfromIsrael,SwedenandSwitzerland
demonstratethatasthesetoolsbecomemorewidelyavailable,
adoptioninothermarketswilllikelygrow,especiallyconsidering
thehighpercentagesofrespondentswhosaythey’rewillingto
usethem.
30 2017 CONNECTED COMMERCE REPORT
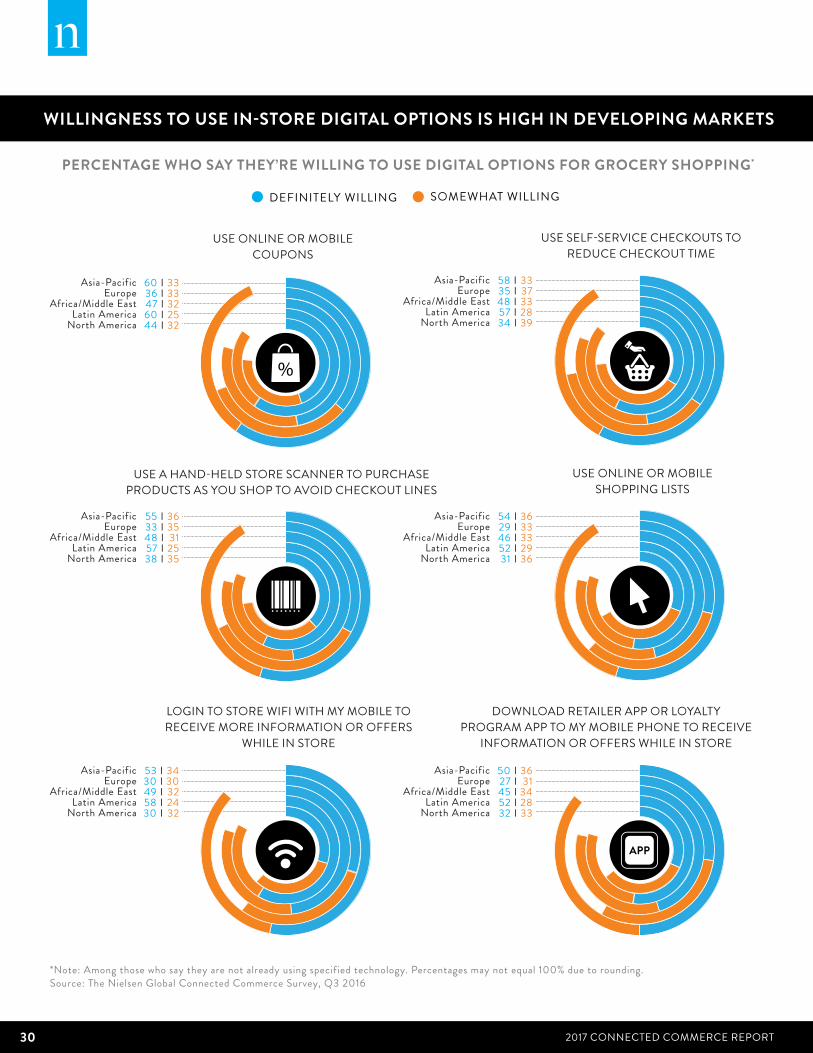
PERCENTAGE WHO SAY THEY’RE WILLING TO USE DIGITAL OPTIONS FOR GROCERY SHOPPING*
WILLINGNESS TO USE IN-STORE DIGITAL OPTIONS IS HIGH IN DEVELOPING MARKETS
DEFINITELY WILLING SOMEWHAT WILLING
USE ONLINE OR MOBILE COUPONS
USE A HAND-HELD STORE SCANNER TO PURCHASE PRODUCTS AS YOU SHOP TO AVOID CHECKOUT LINES
LOGIN TO STORE WIFI WITH MY MOBILE TO RECEIVE MORE INFORMATION OR OFFERS
WHILE IN STORE
USE SELF-SERVICE CHECKOUTS TO REDUCE CHECKOUT TIME
USE ONLINE OR MOBILE SHOPPING LISTS
DOWNLOAD RETAILER APP OR LOYALTY PROGRAM APP TO MY MOBILE PHONE TO RECEIVE
INFORMATION OR OFFERS WHILE IN STORE
Asia-PacificEurope
Africa/Middle EastLatin America
North America
Asia-PacificEurope
Africa/Middle EastLatin America
North America
Asia-PacificEurope
Africa/Middle EastLatin America
North America
Asia-PacificEurope
Africa/Middle EastLatin America
North America
Asia-PacificEurope
Africa/Middle EastLatin America
North America
Asia-PacificEurope
Africa/Middle EastLatin America
North America
55 I 3633 I 3548 I 3157 I 2538 I 35
53 I 3430 I 3049 I 3258 I 2430 I 32
60 I 3336 I 3347 I 3260 I 2544 I 32
54 I 3629 I 3346 I 3352 I 2931 I 36
50 I 3627 I 3145 I 3452 I 2832 I 33
58 I 3335 I 3748 I 3357 I 2834 I 39
*Note: Among those who say they are not already using specified technology. Percentages may not equal 100% due to rounding. Source: The Nielsen Global Connected Commerce Survey, Q3 2016
31Copyright © 2017 The Nielsen Company
WILLINGNESS TO USE IN-STORE DIGITAL OPTIONS IS HIGH IN DEVELOPING MARKETS DISRUPTIVE TRENDS THAT WILL CONTINUE TO DRIVE CONNECTED-COMMERCE GROWTHSeveralmajoreconomicandconsumptiontrendswilldrive
connectedcommerce’sgrowthandreshapetraditionaldefinitionsof
shopping:
• Businessmodelinnovation.E-commerceisreshapingwhatit
meanstoshop,asnewretailmodelsgaintraction.Theclick-
and-collectmodelhasgainedtractioninFrance,andconsumers
aroundtheworldindicatethey’reopentousingthisandother
pickupmodelsinthefuture.IntheU.S.,meal-kitservices,
direct-to-consumermodelsandautomatic-subscriptionmodels
haveseentremendousgrowth.Eighteenpercentofonline
purchasesintheU.S.arebasedonsubscriptions,including30%
ofhealthand29%ofpersonal-carepurchases.Asmoreretailers
andmanufacturerscontinuetodefinetheirvisionforthefuture
andexperimentwithnewformatsthatblendthedigitaland
physicalworlds,whatitmeanstoshopandwhatconsumers
expectfromstoreswillcontinuetoevolve.Butnosinglemodel
isrightforeveryone,andthechallengeistodeterminehowto
takethebestoftheonlineandoff lineworldsandblendthemin
awaythatdeepenstherelationshipwithshoppers.
32 2017 CONNECTED COMMERCE REPORT
• Risingconnectivity.TheDemandInstitute,jointlyoperatedby
NielsenandTheConferenceBoard,projectsthatanadditional
1.2billionpeoplewillcomeonlineby2020.Themajorityof
thisgrowthwilloccurinemergingmarkets,drivenlargely
bythespreadofmobiledevices,whichwillbringbillionsof
consumersonlineforthefirsttime.GSMA,amobile-operator
tradeassociation,predictsthatthenumberofsmartphone
subscriptionsworldwidewillrisefrom2.6billionin2015to5.8
billionby2020.
Manyofthesenewuserswillbeinremoteareaswith
underdevelopedretailinfrastructure.Whileonlineretailersmust
overcomelogisticalchallengesinreachingtheseconsumers,
limitedretailinfrastructuremayactuallybeaboonforconnected
commerce,asconsumerswithlimitedchoiceswilllikely
enthusiasticallywelcomeaccesstonewproductsandservices
madepossiblebye-commerce.Moreover,worriesaboutinternet
securityarenotbarrierstoonlinepurchasingformost.Infact,
62%ofglobalrespondentsinNielsen’ssurvey—including81%
inIndiaandnearlytwo-thirdsinSoutheastAsia(66%)and
LatinAmerica(65%)—saythey’reconfidentthattheirpersonal
informationissecurewhenbuyingitemsonline.
Emergingmarketsarenottheonlyoneswhereretailerswill
benefitfromthemobileexplosion.It’salreadyanimportant
growthengineinadvancedmarkets.IntheU.S.in2016,Black
FridayandCyberMondayretailsalesviamobiledeviceswereup
33%and34%overthepreviousyear,andBlackFridaybecame
thefirstdayevertogenerateoverabilliondollarsinsalesvia
mobiledevices($1.2billion).4Asretailerscontinuetoimprove
themobileexperienceandconsumersgrowmorecomfortable
transactingontheirphones,tremendousgrowthwillcontinue.
• Digital-paymentdisruption.Mobilealsoishelpingtoaddress
anothermajorchallengeforonlineretailers:thelargeunbanked
populationinmuchofthedevelopingworld.Accordingto
GSMA,mobilemoneyservicesarenowavailablein90countries
worldwide,enablingbillionsofnewconsumerstoengagein
e-andm-commerceandconsumercreditmarketsforthefirst
time.TheDemandInstituteestimatesthatgrowthinaccess
tocashlesspaymentscouldleadtoasmuchas$10trillionin
additionalconsumerspendingoverthenextdecade.
4AdobeDigitalInsights(November2016).

33Copyright © 2017 The Nielsen Company
Mobilepaymentsystemsaren’tjustbringingnewconsumers
online,theyalsoareacriticalpartofthedigitaldisruption
that’stransformingwhatitmeanstoshop.Mobilepayments
areacriticalpartofAmazon’svisionfortheretailstoreofthe
future,withshoppersenteringthestoreandpayingforgoods
withoutevertakingouttheirwallet.Butmobilepaymentsaren’t
justadistantfantasy;they’realreadyaffectingthewaymany
consumersshop.JustlookatthepopularityofUberandLyft,
whichallowconsumerstohailandpayforaridecompletelyvia
mobiledevice.InNielsen’sGlobalMobileShopping,Banking
andPaymentSurvey,morethan28%ofglobalrespondents,
including35%ofMillennials,saidtheywerehighlylikelytouse
mobilepaymentsinbars,restaurantsorretailstoresinthenext
sixmonths.Asthesemethodsgaintraction,theirimpacton
consumers’expectationswillbetremendous.
• Risingeconomicprosperityandconsumption-ledgrowth.AccordingtotheWorldBank,consumerpurchasingpoweris
growingbetween7%and9%peryearinChina,Indiaandsub-
SaharanAfrica.Inaddition,theOrganizationforEconomic
CooperationandDevelopmentpredictstheglobalmiddleclass
willincreasefrom1.8billionin2009to4.9billionby2030.
Risingprosperitywillbeagrowthengineforconsumption,with
youngconsumers—digitalnativesenteringtheirprimespending
years—beingaparticularlypowerfulforce.TheMcKinseyGlobal
Instituteprojectsthatincreasedconsumerspendingwilldrive
three-quartersofglobalconsumptiongrowthbetween2015and
2030.
• Urbanliving.AccordingtotheUnitedNations,theworldiscurrentlyundergoingthelargestwaveofurbangrowthinhistory.
Morethanhalfoftheworld’spopulation(54%)livesinanurban
area—upfrom47%in2000—andthisnumberwillrisetonearly
two-thirds(66%)by2050.Thistrendpresentsretailerswith
challengesandopportunities.Urbanareasoftenhavethedigital
andphysicalinfrastructurenecessarytofacilitateconnected-
commercegrowth.Atthesametime,urbanconsumerstypically
havereadyaccesstostores,andthey’reoftenthefirstwith
accesstoinnovativenewstoreorserviceformats,digital
technologiesandorderfulfillmentoptions.Asaresult,these
shoppershaveveryhighexpectationswhenitcomestof lexibility
andefficiency,andoptimizingtheshoppingexperiencewillbe
criticalforretailersofallformats.
34 2017 CONNECTED COMMERCE REPORT
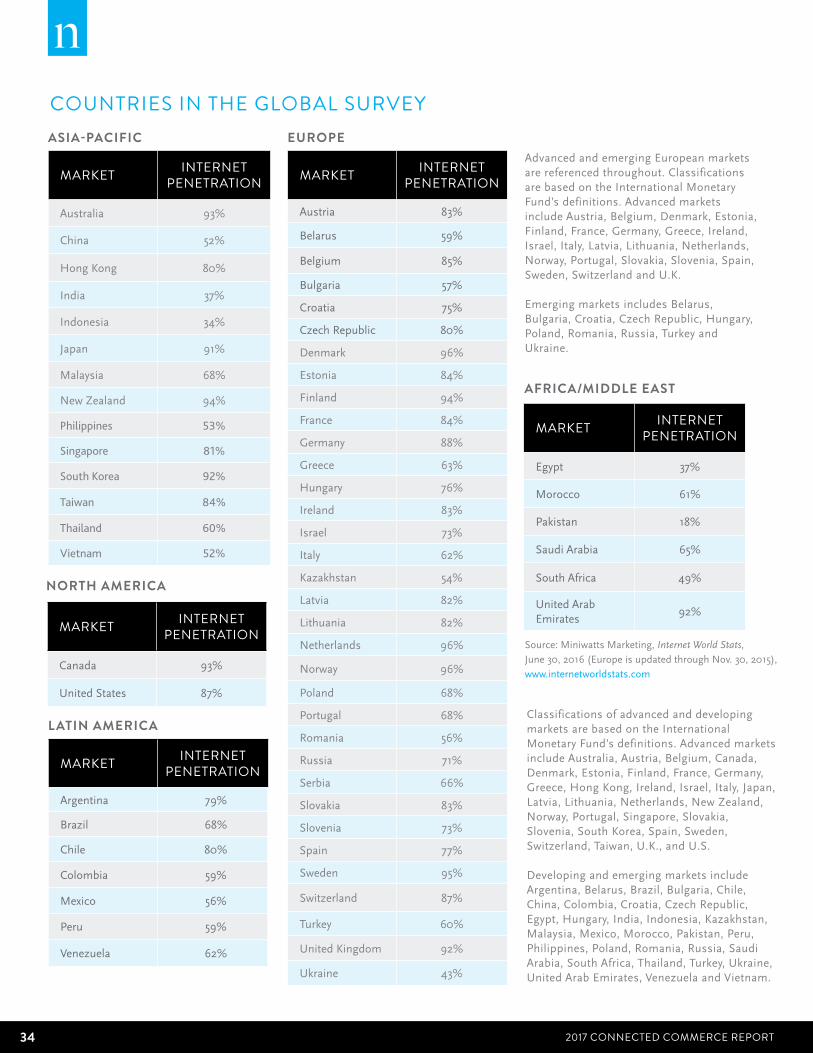
COUNTRIES IN THE GLOBAL SURVEY
ClassificationsofadvancedanddevelopingmarketsarebasedontheInternationalMonetaryFund’sdefinitions.AdvancedmarketsincludeAustralia,Austria,Belgium,Canada,Denmark,Estonia,Finland,France,Germany,Greece,HongKong,Ireland,Israel,Italy,Japan,Latvia,Lithuania,Netherlands,NewZealand,Norway,Portugal,Singapore,Slovakia,Slovenia,SouthKorea,Spain,Sweden,Switzerland,Taiwan,U.K.,andU.S.
DevelopingandemergingmarketsincludeArgentina,Belarus,Brazil,Bulgaria,Chile,China,Colombia,Croatia,CzechRepublic,Egypt,Hungary,India,Indonesia,Kazakhstan,Malaysia,Mexico,Morocco,Pakistan,Peru,Philippines,Poland,Romania,Russia,SaudiArabia,SouthAfrica,Thailand,Turkey,Ukraine,UnitedArabEmirates,VenezuelaandVietnam.
MARKET INTERNET PENETRATION
Australia 93%
China 52%
HongKong 80%
India 37%
Indonesia 34%
Japan 91%
Malaysia 68%
NewZealand 94%
Philippines 53%
Singapore 81%
South Korea 92%
Taiwan 84%
Thailand 60%
Vietnam 52%
ASIA-PACIFIC
MARKET INTERNET PENETRATION
Egypt 37%
Morocco 61%
Pakistan 18%
SaudiArabia 65%
SouthAfrica 49%
UnitedArabEmirates
92%
AFRICA/MIDDLE EAST
MARKET INTERNET PENETRATION
Canada 93%
UnitedStates 87%
NORTH AMERICA
EUROPE
MARKET INTERNET PENETRATION
Austria 83%
Belarus 59%
Belgium 85%
Bulgaria 57%
Croatia 75%
CzechRepublic 80%
Denmark 96%
Estonia 84%
Finland 94%
France 84%
Germany 88%
Greece 63%
Hungary 76%
Ireland 83%
Israel 73%
Italy 62%
Kazakhstan 54%
Latvia 82%
Lithuania 82%
Netherlands 96%
Norway 96%
Poland 68%
Portugal 68%
Romania 56%
Russia 71%
Serbia 66%
Slovakia 83%
Slovenia 73%
Spain 77%
Sweden 95%
Switzerland 87%
Turkey 60%
UnitedKingdom 92%
Ukraine 43%
MARKET INTERNET PENETRATION
LATIN AMERICA
Argentina 79%
Brazil 68%
Chile 80%
Colombia 59%
Mexico 56%
Peru 59%
Venezuela 62%
Source:MiniwattsMarketing,Internet World Stats,June30,2016(EuropeisupdatedthroughNov.30,2015),www.internetworldstats.com
AdvancedandemergingEuropeanmarketsarereferencedthroughout.ClassificationsarebasedontheInternationalMonetaryFund’sdefinitions.AdvancedmarketsincludeAustria,Belgium,Denmark,Estonia,Finland,France,Germany,Greece,Ireland,Israel,Italy,Latvia,Lithuania,Netherlands,Norway,Portugal,Slovakia,Slovenia,Spain,Sweden,SwitzerlandandU.K.
EmergingmarketsincludesBelarus,Bulgaria,Croatia,CzechRepublic,Hungary,Poland,Romania,Russia,TurkeyandUkraine.
35Copyright © 2017 The Nielsen Company
ABOUT NIELSEN GLOBAL E-COMMERCE MEASUREMENT SALES DATANielsenGlobalE-Commercespansover20countriesaroundtheworld.
Measurementmayrelyondirectfromretailerdata(ePOS),datacollected
viaNielsen’sConsumerPanels,otherlicenseddata,oracombinationof
theforegoing.Specificmethodologiesmayvaryfromcountrytocountry,
inaccordancewitheachcountry’srulesandregulations.DataforChinais
acombinationof directfromretailerdata(ePOS)andotherlicenseddata
projectedtoatotalcountrynumber.Franceisanaggregationofdirectfrom
retailerdatafortheclickandcollectmarket(whichaccountsfor85%ofall
CPGe-commercesalesinFrance).
ABOUT THE NIELSEN GLOBAL SURVEYTheNielsenGlobalConnectedCommerceSurveywasconducted
October31–November18,2016,andpolledmorethan30,000online
consumersin63countriesthroughoutAsia-Pacific,Europe,Latin
America,theMiddleEast/AfricaandNorthAmerica.Thesample
includesinternetuserswhoagreedtoparticipateinthissurveyand
hasquotasbasedonageandsexforeachcountry.Itisweightedtobe
representativeofinternetconsumersbycountry.Becausethesampleis
basedonthosewhoagreedtoparticipate,noestimatesoftheoretical
samplingerrorcanbecalculated.However,aprobabilitysampleof
equivalentsizewouldhaveamarginoferrorof±0.6%attheglobal
level.ThisNielsensurveyisbasedonlyonthebehaviorofrespondents
withonlineaccess.Internetpenetrationratesvarybycountry.Nielsen
usesaminimumreportingstandardof60%internetpenetrationoran
onlinepopulationof10millionforsurveyinclusion.

36 2017 CONNECTED COMMERCE REPORT
ABOUT NIELSENNielsenHoldingsplc(NYSE:NLSN)isaglobalperformancemanagement
companythatprovidesacomprehensiveunderstandingofwhatconsumers
watchandbuy.Nielsen’sWatchsegmentprovidesmediaandadvertising
clientswithTotalAudiencemeasurementservicesforalldevicesonwhich
content—video,audioandtext—isconsumed.TheBuysegmentoffers
consumerpackagedgoodsmanufacturersandretailerstheindustry’sonly
globalviewofretailperformancemeasurement.Byintegratinginformation
fromitsWatchandBuysegmentsandotherdatasources,Nielsenalso
providesitsclientswithanalyticsthathelpimproveperformance.Nielsen,
anS&P500company,hasoperationsinover100countries,coveringmore
than90%oftheworld’spopulation.
Formoreinformation,visitwww.nielsen.com.
Copyright©2017TheNielsenCompany.Allrightsreserved.Nielsenand
theNielsenlogoaretrademarksorregisteredtrademarksofCZT/ACN
Trademarks,L.L.C.Otherproductandservicenamesaretrademarksor
registeredtrademarksoftheirrespectivecompanies.17/10714