what the overall digital economy and society index reveals
TRANSCRIPT
Regional Statistics, Vol. 10. No. 2. 2020: 42–62; DOI: 10.15196/RS100209
What the overall Digital Economy and Society Index reveals: A statistical analysis of the DESI EU28 dimensions
Zoltán Bánhidi Budapest University of Technology
and Economics E-mail: [email protected]
Imre DobosBudapest University of Technology
and Economics E-mail: [email protected]
András NemeslakiBudapest University of Technology
and Economics E-mail: [email protected]
Keywords:digital transformation measurement,
DESI index, correlation analysis,
cluster analysis, multidimensional scaling
We build on the argument that measurement of digitalization is essential for effective public policy strategies in order to to govern digital transition. Developing this argument, we investigate the five principal dimensions of the European Commission´s Digital Economy and Society Index (DESI) using a series of multivariate statistics. The analysis can be divided into three groups. First, we analyse the linear relationships between dimensions by correlation analysis, partial correlation analysis, and principal component analysis. In the partial correlation analysis, causal relationships between the dimensions show high correlations. Second, we assign countries into groups with cluster analysis and multi-dimensional scaling. The groups obtained by the two methods are very similar. Finally, we rank the European Union (EU) countries using statistical methods and compare with the results obtained with the overall DESI index. The correlation between the two rankings shows a strong linear relationship. Based on these results we draw conclusions on how to effectively use the DESI data for public policy analysis.
Introduction to digital transformation and problems of its measurement
During the past 25 years, with the emergence of e-business and the internet economy, several industries have been restructured with Information and Communications Technology (ICT) ‘disruption’, and we can hardly recognize some of them from their past perspectives. For instance, the internet has reformed media industries such as music, television and films; retail businesses such as books, newspapers, apparel and electronics; and services such as travel, banking or

What the overall Digital Economy and Society Index reveals: A statistical analysis of the DESI EU28 dimensions
43
Regional Statistics, Vol. 10. No. 2. 2020: 42–62; DOI: 10.15196/RS100209
insurance. Initially, the e-business revolution only took place in industries related to information or digital products, while others that were not influenced by the rapid disruptions in information technology remained intact. However, ICT is now more pervasive and affordable pressure on innovation has also become wide spread. Broadly, in this paper, we define this phenomenon as digital transformation.
Pervasiveness may be characterized by penetration, mobility, and access to computers, devices, and networks. We are very close to the scenario when this pervasiveness will increase connectedness of the entire world population. Significant progress has been made towards bridging the global digital divide, achieving universal and affordable access to the internet in the least developed countries. Affordability, on the other hand, implies costs and how the costs of hardware, software, and connectivity compare to incomes and general economic development per capita. We can expect to witness tremendous progress in this area, and not only will devices get cheaper but the rates of telecommunication services will also decline. However, ICT-based business transformation does not happen because of the economics of ICT, but it is due to the application of such technologies that allow us to do things fundamentally differently. In a fascinating monograph, former Google CEO Eric Schmidt and Jared Cohen (2013), a foreign relations and counterterrorist expert, paint an exciting new world of the future in the digital age – how ICT reshapes people, businesses, and countries.
In some industries, such as automotive and electronics, competitiveness of companies is already influenced by the efficient deployment of information and communication technology, the efficiency of innovation processes, co-operation of intelligent machines, and of people at all levels (including the shop floor), or by intertwining artificial intelligence/learning algorithms with everyday processes. Economic and technological trends, however, indicate that this development will not only shape the auto and machine industries, but will basically transform all businesses. A new ecosystem, labelled in several countries as Industry 4.0 or the era of the industrial internet, is emerging, and it not only encompasses the dilemmas of how ICT is embedded in blue and white collar processes leading to radical innovations but also draws attention to future work, new forms of financing, the changing landscape of international strategic management, organizational culture, and the need to transform leadership practices.
Notwithstanding the elimination of the classic elements of digital divide, such as barriers to ICT adoption, use of social media, or the uptake of current e-government services, new chasms have appeared, e.g. regarding privacy, cybersecurity, or the major challenge of how to deal with fake news and other forms of cyber manipulation. The appearance of this new ‘digital divide’ raises the concern for the need to reconsider the new relationship between governments and businesses, how public policies and science and technology programs influence digital transformation and, more importantly, how the new form of leadership must react to these challenges.

44 Zoltán Bánhidi – Imre Dobos – András Nemeslaki
Regional Statistics, Vol. 10. No. 2. 2020: 42–62; DOI: 10.15196/RS100209
In the context of the European Union (EU), a universal scoring system – the Digital Economy and Society Index (DESI) – has been developed for measuring preparedness and progress of digital transformation. For capturing the complexity of the above socio-economic digital transformation, DESI collects and organizes the statistical data of 28 EU countries into five main dimensions: Connectivity, Human Capital, Use of Internet, Integration of Digital Technology, and Digital Public Services. Notwithstanding that DESI has been around since 2014, we intend in our paper to highlight two main dilemmas using the latest data available from DESI Report 2018 (European Commission 2018) for the five indicators. Of course, in addition to DESI, the EU also sets other similar indices and efficiency indicators in other areas of the economy and society based on EU databases. For example, the definition of an international reputation index is presented by Fernandez-Crehuet et al. (2019). Dudek and Sedefoğlu (2019) use material deprivation rates in the indicators in a European Union context.
Correlation and causality of the five dimensions
The European Commission accepts that the five principle policy areas of DESI are not isolated from each other and clearly show that digital transformation can only be achieved by a concerted effort that must be reflected in the DESI dimensions. This principle, however contradicts the requirement of avoiding redundancy that has led to both statistical and interpretation problems. Since the five DESI dimensions comprise several sub-indicators from statistical databases, we argue about the importance of investigating, in pure statistical terms, how strong this correlation is, how many different dimensions DESI measures, and how the dimensions impact each other. Our first set of research questions aim to answer these problems.
Problem of country clusters and ranking according to DESI
The typical use of the DESI measurement system – what the European Commission publishes with every new DESI data recording – is the grouping and ranking of countries, which is considered as comparison or ‘scoring’ of EU countries related to their digital transformation. It is interesting that while the term ‘cluster’ is used in this context, DESI reports do not apply a statistical form of cluster analysis or scaling methods; instead they prefer weighting of the five dimensions and publish country grouping accordingly. For instance, in one of the latest reports, the European Commission identified three so-called clusters, namely high, medium, and low performing EU countries with 9, 10 and 9 members belonging to them. We argue that without exploring how statistical clusters and scaling separates and ranks countries according to the raw DESI data, an unnecessary bias may distort member states´ position. In other words, by finding out how naturally DESI ranks and groups countries by using appropriate

What the overall Digital Economy and Society Index reveals: A statistical analysis of the DESI EU28 dimensions
45
Regional Statistics, Vol. 10. No. 2. 2020: 42–62; DOI: 10.15196/RS100209
multivariate statistical methods, we can reveal the inherent structure of EU countries and juxtapose it with existing reports. Our second set of research questions intend to contribute to this problem by analysing DESI data with cluster analysis and multidimensional scaling.
The paper is organized as follows. Section 2 presents a brief review of the existing literature on the analysis of DESI data. Section 3 presents the DESI overall index with the five indicators. Please note that the sub-dimensions and individual indicators of DESI dimensions are not examined in this paper. Section 4 covers the statistical analysis. The linear connections of the variables are examined with classical correlational analysis, partial correlation analysis, and principal component analysis. The countries are grouped with cluster analysis and multidimensional scaling. The following section is an application of the multidimensional scaling model to rank countries. These statistical results are then compared with the scoring model developed by the European Commission. Section 5 concludes the paper by presenting the results.
A conceptual review of the Digital Economy and Society Index
Measurement of digital transformation: introduction to DESI and other systems
There are several indices, scores, indicators, and measurement units that describe the status of the digital economy, society, public administration, and they are used as descriptors of digital transformation.
First, some of these scoring systems describe and compare the impact of global digitization. For instance, reports from the United Nations (UN), Organization for Economic Cooperation and Development (OECD), World Bank, or the International Telecommunication Union (ITU) serve similar objectives as the regular research projects of major consulting firms such as Forrester, International Data Corporation (IDC), Gartner or McKinsey.
The second category of these measures focus on regional or well-defined country clusters belonging to a geopolitical area. Typical surveys of this type are the EU scoring boards: Digital Skills Indicator (DSI), Consumer Conditions Scoreboard (CCS) indices, or the Digital Economy and Society Index (DESI).
Finally, the third set of data collected for describing the impact of ICT are country-specific compilations conducted by the respective National Statistical Offices or domestic research firms.
The DESI report tracks the progress made by EU member countries with respect to their digitization. It is structured around five chapters (Table 1):
46 Zoltán Bánhidi – Imre Dobos – András Nemeslaki
Regional Statistics, Vol. 10. No. 2. 2020: 42–62; DOI: 10.15196/RS100209
Table 1 Dimensions of DESI
Connectivity Fixed broadband, mobile broadband, and prices
Human Capital Internet use, basic and advanced digital skills
Use of Internet Services Citizens' use of content, communication, and online transactions
Integration of Digital Technology Business digitization and e-commerce
Digital Public Services eGovernment and eHealth
Source: https://digital-agenda-data.eu
It is a widely used and quoted measurement system by experts and policy makers, however it has certain advantages and serious limitations. The main advantage is that it is measured in 28 countries, enables comparison, it is accepted by the European Union, allows compliance and provides the big picture of the digital ecosystem in the EU and its member countries.
Disadvantages are rooted in the same sources as the advantages. The fact that measurements are collected in 28 different countries entails that the methodology is determined to be general and applicable to all. Therefore the results are also general and not suitable for deep analysis and to explain certain phenomena. Specifically, the major drawbacks are that the measurement factors often have the impression of improvised choice in a given year and they change frequently. It often seems biased by industry lobbies, the period between data collection and publication is very long, thereby frequently resulting in outdated assessments. The composition of dimensions changes year-by-year, and this makes it difficult to compare time series performances because these corrections are often not emphasized. There are also significant differences between the statistical offices and data collection methods among countries.
Regardless of the problems, DESI´s method and collection system is still a robust approach, unavoidable in many instances, and it is considered as the best choice for mapping Europe’s progress on digitalisation.
Literature review on conceptual questions of DESI
Stoica and Bogoslov (2017) compared the five indicators of DESI with the available data for Romania and the EU and analysed them over time. They concluded that Romania had undergone significant development during the period under review (2014–2017). However, they did not analyse what type of statistical correlations exist between the available data. Using data from Greece, Kontolaimou and Skintzi (2018) published a similar study. Their research was methodologically deeper, extended to human capital, including gender. Dynamic effects are presented in this analysis; in this case however it is difficult to test dynamic datasets due to limited data

What the overall Digital Economy and Society Index reveals: A statistical analysis of the DESI EU28 dimensions
47
Regional Statistics, Vol. 10. No. 2. 2020: 42–62; DOI: 10.15196/RS100209
availability. Mirke et al. (2019) analysed human capital elements of the Czech Republic and Latvia, and assessed the adult population’s digital competence through learning.
Nikolov and Krumova (2019) considered the fifth element of DESI in their study, that is e-Government, and examined the countries of the European Union (EU) in their model. Scupola (2018) provided an overview of the state of digital transformation in Denmark. The study also reported experiences in e-Government. This paper appears to be very insightful as Denmark has been one of the best-performing countries in DESI rankings for several years. Urs (2017) also investigated the development of e-Government, focusing on local municipalities in Romania and highlighted that improving their service quality can be a daunting task for their understaffed and underfinanced IT departments, hampered by the lack of central coordination and deficient national infrastructure.
Russo (2020), following the European guidelines on the DESI index, applied them on the Italian region of Abruzzo to provide a local framework of technological development. Alonso–García (2018) analysed the digital economy in the context of entrepreneurship using DESI. Their research focused on how digitalization affects the entrepreneurial ecosystem and had found that digitalization changes not only the size of the entrepreneurial market but also its profitability. Curko et al. (2017) considered DESI from the perspective of smart business and examined the impact of Industry 4.0 on the digital economy. Similarly, Götz (2017) analysed the impact of Industry 4.0 on the economic relations between Germany and Poland, concluding that the digital economy can have a positive effect on German-Polish relationships.
These illustrative overviews indicate that the DESI has been used in academic research in order to understand how digital transformation works across different European countries, sectors, and social and economic dimensions. Thus, we argue that it is important to understand the statistical robustness of the DESI methodology, specifically the conclusions we can draw using the five dimensions in such contexts.
Research questions and methodology – statistical analysis of DESI 2018 indicators
To analyse the two problem areas, we propose five research questions (RQ): three related to the problem of correlation (RQ1-RQ3), and two assigned to the problem of country clustering and ranking (RQ4-RQ5).
RQ1: What are the linear relationships between the DESI dimensions? RQ2: Based on their relationships can the dimensions be reduced? That is, do
the dimensions measure different latent variables? RQ3: Can we reveal any information on the causal relationship between the
DESI dimensions?

48 Zoltán Bánhidi – Imre Dobos – András Nemeslaki
Regional Statistics, Vol. 10. No. 2. 2020: 42–62; DOI: 10.15196/RS100209
RQ4: How can we cluster the European Union countries – as data points – using the DESI dimensions?
RQ5: By using the DESI dimensions how can we arrange the country data points – by creating a natural ranking – and compare this with the published DESI overall index?
For data analysis, our DESI dataset of 2018 was compiled from the EU Commission’s website https://digital-agenda-data.eu (Table 2). This raw dataset for the five dimensions – synonymously referred to as variables in this context – is presented in Table 2 and used for the multivariate statistical analysis (Tabachnick et al. 2007):
Table 2 Raw DESI 2018 data for analysis
Country ConnectivityHuman Capital
Use of Internet
Integrationof Digital
Technology
Digital Public
Services Denmark DK 78.482 70.413 75.085 61.283 73.219 Sweden SE 75.985 74.227 73.370 56.367 70.765 Finland FI 66.053 79.240 65.406 60.879 78.642 Netherlands NL 81.132 74.254 66.458 52.338 70.550 Luxembourg LU 80.053 71.311 65.864 33.175 56.208 Ireland IE 65.118 61.706 52.316 60.017 64.719 United Kingdom UK 68.848 71.631 62.395 39.962 58.244 Belgium BE 75.128 57.452 53.310 54.560 57.872 Estonia EE 64.112 61.375 61.607 37.065 78.103 Spain ES 64.708 54.578 49.431 49.791 72.362 Austria AT 63.725 64.365 47.568 44.145 66.468 Malta MT 73.140 51.633 63.281 38.904 61.262 Lithuania LT 64.895 48.526 56.845 47.455 68.217 Germany DE 64.745 62.855 52.743 41.326 50.233 Slovenia SI 60.337 52.009 44.938 47.866 57.350 Portugal PT 67.383 45.824 46.344 41.928 59.643 Czech Republic CZ 63.861 55.100 46.460 40.444 50.165 France FR 56.404 59.069 42.247 37.828 58.371 Latvia LV 65.932 43.840 54.777 27.027 65.185 Slovakia SK 55.071 51.882 51.285 37.430 50.401 Cyprus CY 60.632 43.027 51.136 37.674 54.815 Croatia HR 49.436 49.807 54.075 35.439 44.351 Hungary HU 61.728 47.978 53.638 25.082 40.390 Poland PL 58.810 48.283 42.080 23.532 48.208 Italy IT 52.826 40.810 37.364 36.821 52.503 Bulgaria BG 54.906 34.832 41.684 24.424 49.717 Greece EL 43.104 38.185 45.218 26.940 39.239 Romania RO 58.119 32.065 34.964 17.756 41.362
Source: https://digital-agenda-data.eu

What the overall Digital Economy and Society Index reveals: A statistical analysis of the DESI EU28 dimensions
49
Regional Statistics, Vol. 10. No. 2. 2020: 42–62; DOI: 10.15196/RS100209
We used the IBM SPSS 20 Statistical Program Package to perform the following methodological calculations. For analysing the linear and causal relationships (RQ1 and RQ3), simple Pearson and partial correlation measures were used. Pearson correlation shows the strength and direction of the linear relationship between two variables, while the partial correlation provides information on the causal relationship between the two variables, but without the ability to deduce its direction. For RQ2, that is, basically for compressing information, we performed principal component analysis on the datasets, based on which we examined the latent variables describing the best returned variance. Basically, this calculation shows how many new variables characterize the existing five dimensions. In order to cluster the EU countries (RQ4) we used hierarchical cluster analysis. This method shows which countries are positioned relatively close to each other in the five-dimensional space determined by the original DESI variables. Multidimensional scaling was used to assess the stability of the cluster analysis; a method in which the elements of the five-dimensional space are represented in lower dimensions. We preferred the two-dimensional space for visualization, in accordance with the results of the principal component analysis. Finally, for answering our last research question (RQ5), we applied an extreme case of multidimensional scaling by mapping our country data points from the five-dimensional space to a one-dimensional space, which may be called a straight numerical order. This order can be turned into ranking, when and if this mapping shows a good fit.
Results and discussion
RQ1: Correlation analysis
Table 3 shows that there is a moderate to strong correlation between the variables. Each of these correlation coefficients has a positive sign, suggesting that the movement of variables is in a single direction; importantly, all the correlation ratios are significant at 99% confidence level. We consider this as an important consequence to any further use of the DESI dimensions, in which case the dilemma is about how orthogonal these dimensions are in terms of our understanding the digital economy and society. In other words, how will each of these dimensions add value to our assessment of the status of digital transition in the EU? In any case, a high correlation could be alarming in this respect, pointing towards little additional value for some variables in the DESI model.

50 Zoltán Bánhidi – Imre Dobos – András Nemeslaki
Regional Statistics, Vol. 10. No. 2. 2020: 42–62; DOI: 10.15196/RS100209
Table 3 Correlation matrix between DESI variables
Human Capital
Use of Internet
Integration of Digital
Technology
Digital Public Services
Connectivity Pearson Correlation
0.683** 0.736** 0.547** 0.605**
Sig. (2-tailed) 0.000 0.000 0.003 0.001
Human Capital Pearson Correlation 0.765** 0.709** 0.647**
Sig. (2-tailed) 0.000 0.000 0.000
Use of Internet Pearson Correlation 0.568** 0.616**
Sig. (2-tailed) 0.002 0.000
Integration of Digital Technology
Pearson Correlation 0.726**
Sig. (2-tailed) 0.000
**Correlation is significant at the 0.01 level (2-tailed).
RQ2: Application of principal component analysis
Principal component analysis reveals how the five – strongly correlated – DESI variables may be reduced. We used the principal component analysis method, without rotation, with VARIMAX rotation to answer the dilemmas raised as a result of RQ1, that is, to identify the group of variables that describe different aspects of the digital economy.
The Kaiser-Meyer-Olkin measure of sampling adequacy shows that our model is meritorious with 0.834 value, confirming its fitness. At the same time, Bartlett's test of sphericity is proven significant, further underscoring the goodness of our model. These tests support the acceptance of our model’s results.
First, we report communalities values that are between 0.8 and 0.9, suggesting that the calculated components explain a large proportion of the variance. In our analysis, two components are sufficient for this purpose and they returned 84.280 percent of variance. Specifically, in the principal component model without rotation, the first component yielded 72.859 percent of variance, and the value of component weights was above 0.830, indicating that each variable strongly correlated with this component. In the case of our second component, each variable showed weak correlation, except Integration of Digital Technology, which showed weak-medium correlation of 0.451. The second component displayed 11.422 percent of variance. We obtained a rather insightful result, concluding that the second part of the principal component analysis, which was computed with the VARIMAX rotation of

What the overall Digital Economy and Society Index reveals: A statistical analysis of the DESI EU28 dimensions
51
Regional Statistics, Vol. 10. No. 2. 2020: 42–62; DOI: 10.15196/RS100209
the above results, yielded 84.280 percent of the variance on the two components. Table 4 summarizes the two components and their corresponding variables with the respective component weights.
The first component is strongly determined by Connectivity and Use of Internet variables, while the second with strong component weights such as Integration of Digital Technology and Digital Public services. We can observe that Human Capital shows moderate weights with both components, slightly higher with the first one. This suggests that both components have a medium linear relationship with the variable Human Capital. We will clarify this in more detail by calculating the partial correlation values between our dimensions. Table 4 is an important and somewhat intuitive outcome of our quantitative analysis, namely the five DESI dimensions can be reduced to two different variables describing the status of digitalization: one component provides the measure of ‘preparedness’ by integrating infrastructure and its use; while the other, more obvious component, measures what is actually happening with digital technologies, namely how it is integrated into businesses, social institutions, and public administration. However, the special status of Human Capital is somewhat counter intuitive, which one may have predicted as a ‘preparedness’ variable, but principal component analysis results do not provide strong proof on this issue.
Table 4 Rotated Component Matrix
Component
1 2
Connectivity 0.862 0.300
Use of Internet 0.867 0.339
Human Capital 0.699 0.562
Integration of Digital Technology 0.302 0.895
Digital Public Services 0.387 0.818
Extraction Method: Principal Component Analysis. Rotation Method: Varimax with Kaiser Normalization.
These conclusions lead us to the third part of the correlation problem, that is, whether the data show any further relationship between the DESI dimensions in order to disclose the causality underlying our components.

52 Zoltán Bánhidi – Imre Dobos – András Nemeslaki
Regional Statistics, Vol. 10. No. 2. 2020: 42–62; DOI: 10.15196/RS100209
RQ3: Partial correlational analysis
We report the results of partial correlation analysis in Table 5 by italicizing values that are significant at 5% level. Table 5 shows that six relationships do not affect each other by eliminating the impact of the other variables, and the values of the four significant polar correlations are between 0.4 and 0.5, which is considered a weak-medium linear relationship between these variables after filtering out the effects of the other three variables.
Table 5 Partial correlation matrix between variables after filtering
Human Capital
Use of Internet
Integration of Digital
Technology
Digital Public Services
Connectivity Pearson Correlation
0.177 0.411 0.005 0.181
Sig. (2-tailed) 0.397 0.041 0.983 0.387
Human Capital Pearson Correlation 0.454 0.407 0.032
Sig. (2-tailed) 0.023 0.044 0.880
Use of Internet Pearson Correlation
–0.073 0.151
Sig. (2-tailed) 0.727 0.470
Integration of Digital Technology
Pearson Correlation
0.490
Sig. (2-tailed) 0.013
Numerical data from Table 5 can be translated into a graphical visualization shown in Figure 1. By acknowledging that partial correlation analysis only reveals causal relationships but does not provide information on its direction, we carefully avoided drawing arrows on the connecting lines. The answer to this research question suggests that DESI has two ‘independent variables’ (Connectivity and Human Capital), and three ‘dependent variables’, which are Use of Internet, Integration of Digital Technology, and Digital Public Services.

What the overall Digital Economy and Society Index reveals: A statistical analysis of the DESI EU28 dimensions
53
Regional Statistics, Vol. 10. No. 2. 2020: 42–62; DOI: 10.15196/RS100209
Figure 1 Causal relationships between variables
Figure 1 shows a somewhat unexpected result that needs further investigation and has ample consequences on the use of DESI for policy making. The data suggests that penetration and level of digital public services are only dependent on how digital technology is integrated into other business processes and it is not directly connected with internet use. Similarly, the integration of digital technology into business processes is in causality with human capital not significantly with connectivity, which we may consider as the basis for digital transformation. Elaborating on the consequences of these results – RQ1, RQ2, and RQ3 – is beyond the scope of this paper but causality mapping may be explored for more elaborate policy design in digital transformation.
RQ4: Grouping countries with hierarchical cluster analysis
Cluster analysis is a statistical method for classifying observations, in this case regarding the EU 28 countries, in the space of the variables, that is, the five DESI dimensions. We argue that it is an important incumbent grouping of data points instead of choosing artificially defined ‘leaders and laggards’ categories according to predetermined DESI composite values. We must assign a group centre to determine the distance between countries in cluster analysis based on data metrics, which is the squared Euclidean distance in this paper, and our scale of measurement is an interval scale. We selected the hierarchical cluster methodology because it can be supported with the dendrogram visualization, and is an expressive demonstration of how distinctly different groups emerge as a result of creating clusters. Dendrograms enable the monitoring of cluster attachment and cluster spreading. The first result describes how closely data points belong to a given group, and the second shows how many different groups the data points may be divided into. The components of our dendrogram are shown in Figure 2, and its interpretation is presented with the
Connectivity
Human Capital
Use of Internet
Integration of Digital Technology
Digital Public Services
54 Zoltán Bánhidi – Imre Dobos – András Nemeslaki
Regional Statistics, Vol. 10. No. 2. 2020: 42–62; DOI: 10.15196/RS100209
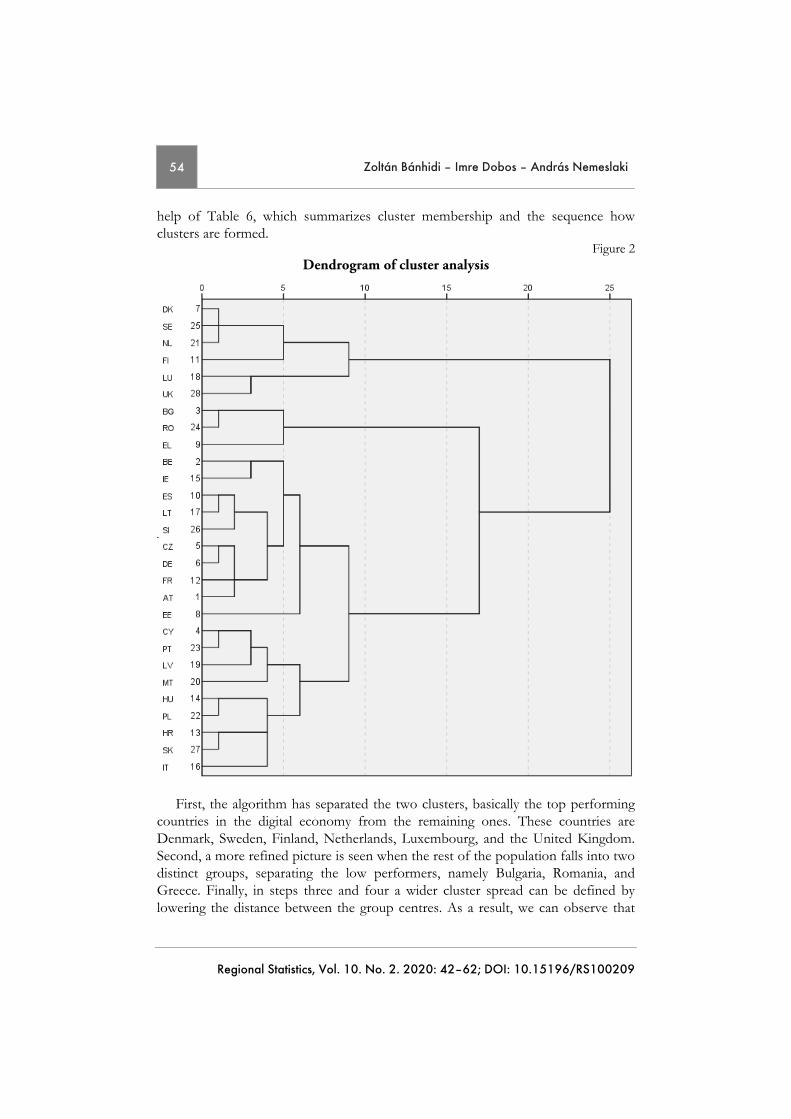
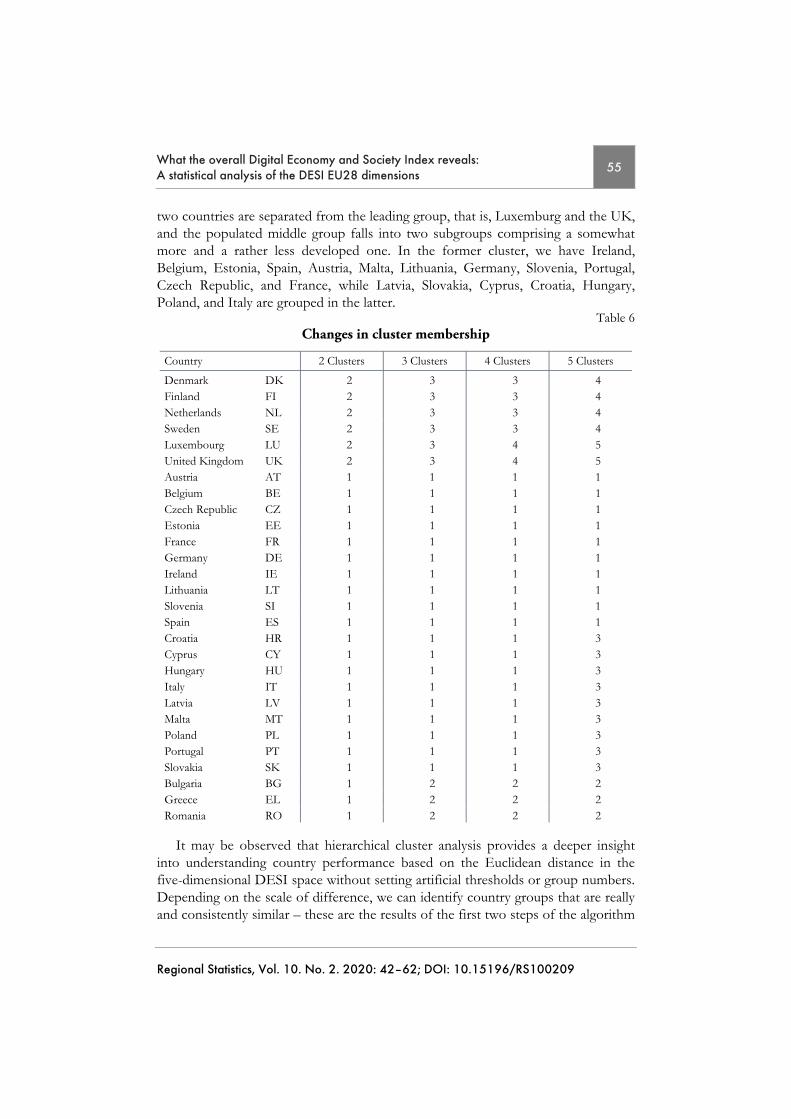
help of Table 6, which summarizes cluster membership and the sequence how clusters are formed.
Figure 2 Dendrogram of cluster analysis
First, the algorithm has separated the two clusters, basically the top performing countries in the digital economy from the remaining ones. These countries are Denmark, Sweden, Finland, Netherlands, Luxembourg, and the United Kingdom. Second, a more refined picture is seen when the rest of the population falls into two distinct groups, separating the low performers, namely Bulgaria, Romania, and Greece. Finally, in steps three and four a wider cluster spread can be defined by lowering the distance between the group centres. As a result, we can observe that
What the overall Digital Economy and Society Index reveals: A statistical analysis of the DESI EU28 dimensions
55
Regional Statistics, Vol. 10. No. 2. 2020: 42–62; DOI: 10.15196/RS100209
two countries are separated from the leading group, that is, Luxemburg and the UK, and the populated middle group falls into two subgroups comprising a somewhat more and a rather less developed one. In the former cluster, we have Ireland, Belgium, Estonia, Spain, Austria, Malta, Lithuania, Germany, Slovenia, Portugal, Czech Republic, and France, while Latvia, Slovakia, Cyprus, Croatia, Hungary, Poland, and Italy are grouped in the latter.
Table 6 Changes in cluster membership
Country 2 Clusters 3 Clusters 4 Clusters 5 Clusters
Denmark DK 2 3 3 4 Finland FI 2 3 3 4 Netherlands NL 2 3 3 4 Sweden SE 2 3 3 4 Luxembourg LU 2 3 4 5 United Kingdom UK 2 3 4 5 Austria AT 1 1 1 1 Belgium BE 1 1 1 1 Czech Republic CZ 1 1 1 1 Estonia EE 1 1 1 1 France FR 1 1 1 1 Germany DE 1 1 1 1 Ireland IE 1 1 1 1 Lithuania LT 1 1 1 1 Slovenia SI 1 1 1 1 Spain ES 1 1 1 1 Croatia HR 1 1 1 3 Cyprus CY 1 1 1 3 Hungary HU 1 1 1 3 Italy IT 1 1 1 3 Latvia LV 1 1 1 3 Malta MT 1 1 1 3 Poland PL 1 1 1 3 Portugal PT 1 1 1 3 Slovakia SK 1 1 1 3 Bulgaria BG 1 2 2 2 Greece EL 1 2 2 2 Romania RO 1 2 2 2
It may be observed that hierarchical cluster analysis provides a deeper insight into understanding country performance based on the Euclidean distance in the five-dimensional DESI space without setting artificial thresholds or group numbers. Depending on the scale of difference, we can identify country groups that are really and consistently similar – these are the results of the first two steps of the algorithm

56 Zoltán Bánhidi – Imre Dobos – András Nemeslaki
Regional Statistics, Vol. 10. No. 2. 2020: 42–62; DOI: 10.15196/RS100209
– and we refine grouping also, by choosing lower Euclidean distance values as in the third and fourth step, resulting in more clusters but with less distinct difference between the middle group. Based on the structure of DESI data, we conclude that the EU 28 countries fall into five separate and relevant clusters as presented in Table 6:
1. Cluster (#4): Denmark, Finland, Netherlands, and Sweden, 2. Cluster (#5): Luxembourg and United Kingdom, 3. Cluster (#1): Austria, Belgium, Czech Republic, Estonia, France, Germany,
Ireland, Lithuania, Slovenia, and Spain, 4. Cluster (#3): Croatia, Cyprus, Hungary, Italy, Latvia, Malta, Poland, Portugal,
and Slovakia, and 5. Cluster (#2): Bulgaria, Greece, and Romania. In the next section, clustering is performed using another method, the
multidimensional scaling.
RQ5: Grouping countries by multidimensional scaling
When applying multidimensional scaling (MDS), we consider the smallest dimensional space in which the distances between observations can be best returned. Thus, our data are derived from the five-dimensional space into a smaller dimensional one, but preferably to the size that we can visualize. In our case, we transform our data into the plane, a two-dimensional space. This corresponds with the results of the principal component analysis that yielded two components condensing the five DESI dimensions. One of these components is ‘digital application’ and we may summarize the other as ‘readiness’ or ‘digital competence’, as indicated in Figure 3. The adequacy of dimension reduction is robust, since the stress value is very low at 0.103, which is the sum of the squares of the difference between the five-dimensional and two-dimensional distances.

What the overall Digital Economy and Society Index reveals: A statistical analysis of the DESI EU28 dimensions
57
Regional Statistics, Vol. 10. No. 2. 2020: 42–62; DOI: 10.15196/RS100209
Figure 3 Location of countries on the plane of principal components
Digital applications
0.0
0.5
1.0
0–3 –2 –1 1 2Digital competences
–1.5
–1.0
–0.5
3
The adequacy of the model is further confirmed by the R-squared value (R2=0.958), which shows a strong linear relationship between the points in the two dimensional space, as R-squared over 0.900 linearity is considered to be very good.
For a very simple interpretation of Figure 3, we may conclude that the DESI measurement distributes the EU 28 countries into four quadrants based on their level of competency and application of digital technologies. The first quadrant in the upper right corner contains countries where both components are higher than average, that is, they perform well in both competencies (connectivity, use) and application (integration and public services). Moving clockwise, the lower right corner collects countries where applications lag the opportunities of competencies – the value of this latter component is negative. Countries which are lower than average in both components can be found in the lower left corner, which corresponds to the fifth and fourth clusters of the hierarchical cluster analysis showing the refined situation, as in Romania and Bulgaria; although lagging in terms of the competency component, they perform better in terms of the application dimension. Finally, the last quadrant is the upper left segment with countries that exploit applications of technology to a certain extent, that is, beyond the level of competency or their actual readiness.

58 Zoltán Bánhidi – Imre Dobos – András Nemeslaki
Regional Statistics, Vol. 10. No. 2. 2020: 42–62; DOI: 10.15196/RS100209
In the second part of this research topic we apply MDS to generate ranking of data points measured by the DESI variables. Basically, this is an extreme case when the original data are projected into a one-dimensional space using MDS, that is, we assign values for each country lying on a numerical line.
It is important to note that this method is fundamentally different from the present logic of DESI ranking (or overall DESI), since applying a multidimensional scoring method involves weighing of the five dimensions and aggregating them accordingly. Hence DESI overall is a scalar multiplication of the DESI variables presented in Table 2, and a predetermined weight vector defined by the EU Commission is shown in Table 7.
Table 7 Weights of the variables for DESI overall index
Connectivity Human Capital Use of
Internet
Integration of Digital
Technology
Digital Public Services
0.25 0.25 0.15 0.2 0.15
The EU Commission´s website (https://digital-agenda-data.eu) provides a simulation tool where weight values may be changed and DESI ranking can be calculated by altering the weight of Connectivity for the benefit of Integration or Digital Public Services. No matter which values are set, however, the logic of multidimensional scoring always reflects the competence of the decision maker or the requestor for the ranking. On the other hand, MDS provides incumbent ranking based on the structure of data that are independent of any external utility assessment of the DESI dimensions. The results of MDS and its comparison with the existing scoring is presented in Table 8. The stress value in this case is 0.187, which is worse than that of the plane model in Figure 8, although still acceptable. Furthermore, the value of R-squared is still very high at 0.908, as in our two-dimensional model.
Table 8 shows that the result of the scoring model does not differ significantly from MDS. The correlation between the two rankings is 0.991, indicating a strong linear relationship between them. On the other hand, consistent with our previous cluster analysis results, we identify some important findings regarding the assessment of a few countries. Among the high performers, Finland´s position is different according to the two methods, which may indicate some interesting best practice observations and transfer. Also, there are slight positional differences between countries in the middle and lower groups.

What the overall Digital Economy and Society Index reveals: A statistical analysis of the DESI EU28 dimensions
59
Regional Statistics, Vol. 10. No. 2. 2020: 42–62; DOI: 10.15196/RS100209
Table 8 DESI overall indicators with ranking
Country DESI overall
index Ranking with
DESI MDS values Ranking with
MDS
Denmark 71.726 1 1.801 1 Sweden 70.447 2 1.638 3 Finland 70.106 3 1.780 2 Netherlands 69.865 4 1.493 4 Luxembourg 62.787 5 0.905 5 Ireland 61.264 6 0.760 6 United Kingdom 61.208 7 0.659 8 Belgium 60.735 8 0.544 9 Estonia 59.741 9 0.728 7 Spain 58.048 10 0.427 10 Austria 57.957 11 0.343 11 Malta 57.655 12 0.255 12 Lithuania 56.606 13 0.254 13 Germany 55.612 14 0.021 14 Slovenia 53.003 15 –0.186 15 Portugal 52.585 16 –0.283 16 Czech Republic 52.323 17 –0.312 17 France 51.527 18 –0.331 18 Latvia 50.843 19 –0.485 19 Slovakia 49.477 20 –0.487 20 Cyprus 49.342 21 –0.528 21 Croatia 46.663 22 –0.823 22 Hungary 46.547 23 –1.010 23 Poland 45.023 24 –1.062 24 Italy 44.253 25 –1.084 25 Bulgaria 41.029 26 –1.416 26 Greece 38.379 27 –1.675 27 Romania 37.546 28 –1.926 28

60 Zoltán Bánhidi – Imre Dobos – András Nemeslaki
Regional Statistics, Vol. 10. No. 2. 2020: 42–62; DOI: 10.15196/RS100209
Figure 4
DESI overall indicators
Conclusions
Measuring the processes and results of digital transformation is important for policy making and for improving local, regional, and European level competitiveness. From 2014 onwards, the EU Commission has been using the Digital Economy and Society Index (DESI) as a complex measurement scheme for collecting data from member states in order to assess the business and social implications of digitalization status in the EU. Over the years, DESI has emerged as a reference point and a major source for policy making and comparing the performance of different countries. In our paper we analysed two major problems by defining five research questions of DESI that need more attention regarding its use.
Three research questions are used to analyse the first problem area covering the issues of correlation and causality of the five DESI dimensions. After running correlation tests, principal component analysis, and partial correlation computations, we concluded that the five DESI dimensions are strongly correlated, they can be reduced to two principal components covering the same scope of measurement, and there is a causality mapping the variables´ relationship. According to these findings there are two independent dimensions (Connectivity and Human Capital) and three
DESI overall index
37,546–41,000 41,001–49,000 49,001–55,000 55,001–62,000 62,001–71,726

What the overall Digital Economy and Society Index reveals: A statistical analysis of the DESI EU28 dimensions
61
Regional Statistics, Vol. 10. No. 2. 2020: 42–62; DOI: 10.15196/RS100209
dependent ones, of which Use of Internet shows causality with both independent dimensions, and Integration of Digital Technology shows causality only with Human Capital. Furthermore, Digital Public Services clearly show a relationship with the Integration dimension, underlying the intuitive experience that applications, both in business and public services are creating a strong principal component while capabilities such as connectivity and human readiness create another.
In the second problem area two research questions examined the clustering and ranking of EU28 countries and juxtaposed the results of hierarchical cluster analysis and multidimensional scaling with the DESI overall indices. With the introduction of these two multivariate statistical methods we created an incumbent grouping of EU28 countries and mapped the groups on a two dimensional and one-dimensional (ranking) space. Our results confirm the usability and effectiveness of the DESI overall index – or weighted aggregate score – and also present a more subtle mapping and ranking of EU countries in the DESI dimensions.
Our paper has its limitations that require future research. A key limitation is that we ran the analyses based only on 2018 data. Therefore, in order to generalize our conclusions analysis should be extended to previous datasets as well. Furthermore, we focused on the five highest level dimensions, a more detailed picture can be gained using second-level data before aggregating them into the five top variables. Regardless we believe our contribution is relevant from at least two points. First, by extending the multivariate statistical analysis of DESI, the entire measurement system can be amended and improved – especially the correlation dilemma can be resolved. Second, based on our findings, a more refined public policy analysis, design and execution may be projected, as adequate knowledge of causality between variables helps decision makers to identify the root causes and actions for improvement.
REFERENCES
ALONSO, M. A. P.– GARCÍA, J. C. S. (2018): Digitalization as Push and Pull Factor Redefining the Entrepreneurship Concept Conference Proceedings Chapters. In: TODOROV, K.–KOLAROV, K. (ed.): The International Entrepreneurship: Trends, Challenges, Achievements Proceedings of the Eighth International Conference, 6–9 June 2017, Varna, Bulg, edition 1, chapter 127, pp. 175–191., Bulgarian Association for Management Development and Entrepreneurship, Varna.
CURKO, K.–CURIC, T.–VUKŠIC, V. B. (2017): Perspective of smart business development International Journal of Renewable Energy Sources 2 (2): 40–47.
DUDEK, H.–SEDEFOĞLU, G. (2019): Modelling severe material deprivation rates in EU regions using fractional response regression Regional Statistics 9 (2): 130–147. https://doi.org/10.15196/RS090210
FERNANDEZ-CREHUET, J. M.–ROSALES-SALAS, J.–BARRAGÁN, G. G. (2019): Construction and validation of an international reputation index: the European case Regional Statistics 9 (2): 105–129. https://doi.org/10.15196/RS090205

62 Zoltán Bánhidi – Imre Dobos – András Nemeslaki
Regional Statistics, Vol. 10. No. 2. 2020: 42–62; DOI: 10.15196/RS100209
GÖTZ, M. (2017): Industry 4.0–the perspective of international economics. The case of Polish-German relationships Przegląd Zachodni 365 (4): 169–185.
KONTOLAIMOU, A.–SKINTZI, G. (2018): 4.2. Digitisation patterns of the Greek economy and society Greek Economic Outlook 37: 41–48.
MIRKE, E.–KAŠPAROVÁ, E.–CAKULA, S. (2019): Adults’ readiness for online learning in the Czech Republic and Latvia (digital competence as a result of ICT education policy and information society development strategy) Periodicals of Engineering and Natural Sciences 7 (1): 205–215. http://dx.doi.org/10.21533/pen.v7i1.366.g255
EUROPEAN COMISSION (2018): DESI Report: https://ec.europa.eu/digital-single-market/en/des (downloaded: 05.06.2019)
NIKOLOV, H. S.–KRUMOVA, M. Y. (2019): Hofstede’s model in the context of e-government and open government in EU countries: countries clustering based on similarities and differences Smart Cities and Regional Development (SCRD) Journal 3 (1): 29–46.
RUSSO, V. (2020): Digital Economy and Society Index (DESI). European Guidelines and Empirical Applications on the Territory. In: SARASOLA SÁNCHEZ-SERRANO, J. L.–, MATURO, F.– HOŠKOVÁ-MAYEROVÁ, Š. (eds.): Qualitative and Quantitative Models in Socio-Economic Systems and Social Work pp. 427–442., Springer, Cham.
SCHMIDT, E.–COHEN, J. (2013): The New Digital Age: Reshaping the Future of People, Nations and Business Alfred A. Knopf, New York.
SCUPOLA, A. (2018): Digital Transformation of Public Administration Services in Denmark: A Process Tracing Case Study Nordic and Baltic Journal of Information and Communications Technologies (1): 261–284. https://doi.org/10.13052/nbjict1902-097X.2018.014
STOICA, E. A.–BOGOSLOV, I. A. (2017): A Comprehensive Analysis Regarding DESI Country Progress for Romania Relative to the European Average Trend Balkan Region Conference on Engineering and Business Education 3 (1): 258–266.
https://doi.org/10.1515/cplbu-2017-0034 TABACHNICK, B. G.–FIDELL, L. S.–ULLMAN, J. B. (2007): Using multivariate statistics (5th
Edition). Pearson, Boston, MA. URS, N. (2018): E-government development in Romanian local municipalities: A
complicated story of success and hardships Transylvanian Review of Administrative Sciences 14 (55): 118–129. http://dx.doi.org/10.24193/tras.55E.8