what we do now determines the future. james m. sugden – (right now)
TRANSCRIPT

What we do now
determines the future.
James M. Sugden – (right now)

Chapter 14
FINANCIAL STATEMENT FINANCIAL STATEMENT ANALYSIS: ANALYSIS:
The Big PictureThe Big Picture

Chapter 14
After studying Chapter 14, you should be able to:
• Understand the concept of sustainable income.
• Indicate how irregular items are presented.• Explain the concept of comprehensive
income.• Describe and apply horizontal analysis.
• Describe and apply vertical analysis.

Chapter 14
After studying Chapter 14, you should be able to:
• Identify and compute ratios used in analyzing a company’s liquidity, solvency, and profitability.
• Understand the concept of quality of earnings.

Components of the Income Statement

Irregular Items
Two types of irregular items are reported -- (all net of taxes)
• discontinued operations
• extraordinary items

Discontinued Operations...
The disposal of a significant segment of a business...
–the elimination of a major class of customers or
–an entire activity.
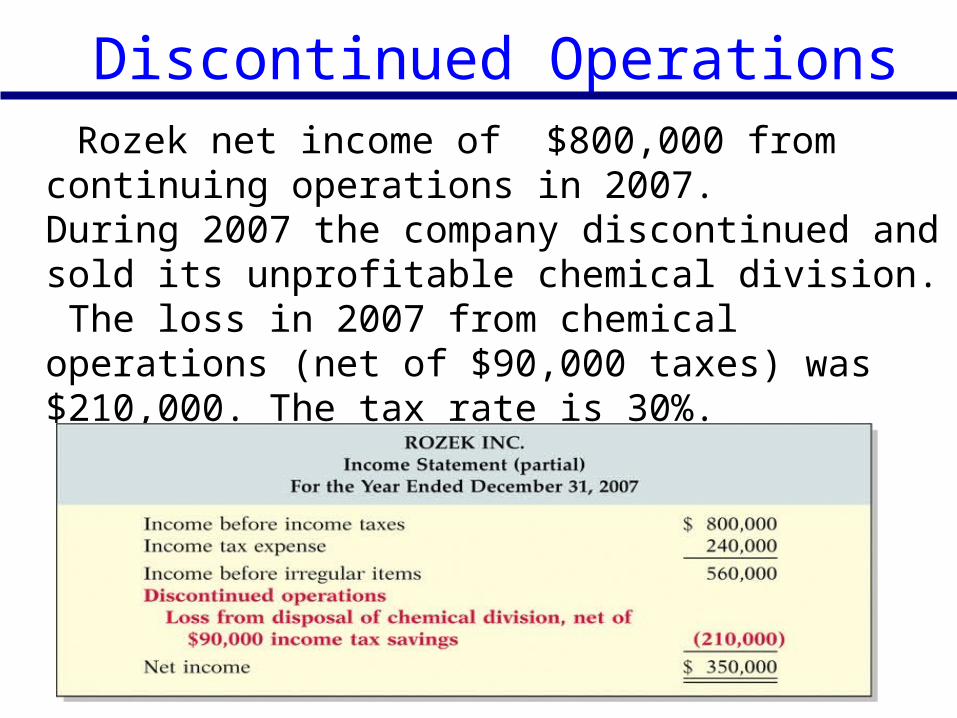
Rozek net income of $800,000 from continuing
operations in 2007.During 2007 the company discontinued and sold its unprofitable chemical division. The loss in 2007 from chemical operations (net of $90,000 taxes) was $210,000. The tax rate is 30%.
Discontinued Operations

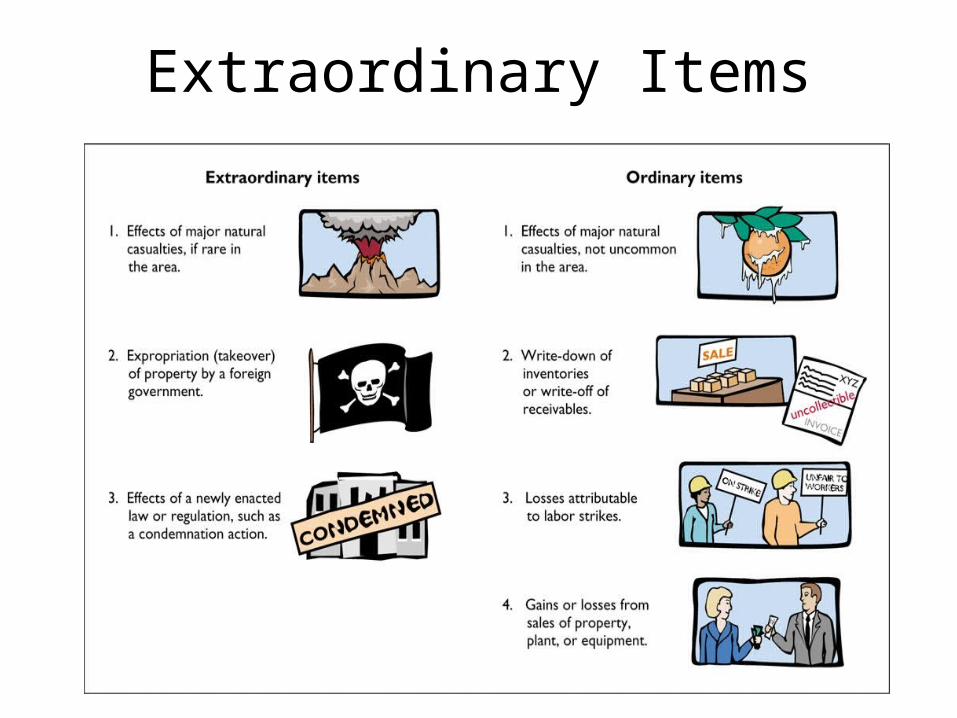
Extraordinary Items...
Are events and transactions that meet two conditions: –Unusual in nature–Infrequent in
occurrence
9

• In 2007 a revolutionary foreign government expropriated property held as an investment by Rozek Inc.
• The loss is $70,000 before applicable income taxes of $21,000, the income statement presentation will show a deduction of $49,000.
Extraordinary Items

Presentation of Extraordinary Items...
Extraordinary Items

Are these considered Extraordinary Items?(a) A large portion of a tobacco
manufacturer’s crops are destroyed by a hail storm. Severe damage from hail storms in the locality where the manufacturer grows tobacco is rare.
(b) A citrus grower's Florida crop is damaged by frost.
(c) Loss from sale of temporary investments.
(d) Loss attributable to a labor strike.
YESYES
NONO
NONONONO
Earning Power and Irregular ItemsEarning Power and Irregular ItemsEarning Power and Irregular ItemsEarning Power and Irregular Items

(e) Loss from flood damage. (The nearby Black River floods every 2 to 3 years.)
(f) An earthquake destroys one of the oil refineries owned by a large multi-national oil company. Earthquakes are rare in this geographical location.
g) Write-down of obsolete inventory.
h) Expropriation of a factory by a foreign government.
NONO
YESYES
YESYESNONO
Are these considered Extraordinary Items?
Earning Power and Irregular ItemsEarning Power and Irregular ItemsEarning Power and Irregular ItemsEarning Power and Irregular Items

Sustainable Income...
• Is the most likely level of income to be obtained in the future.
• Does not include irregular revenues, expenses, gains, or losses.

Estimating Sustainable Income
When evaluating a company, it generally makes sense to eliminate all irregular items in estimating future sustainable income.

Change in Accounting Principle
• Occur when the principle used in the current year is different from the one used in the preceding year.
• Is permitted, when – management can show that the new principle is preferable to
the old and– Most changes are reported retroactively – improves
comparability
• Example: a change in inventory costing methods (such as FIFO to average cost).

• Most revenues, expenses, gains, and losses recognized during the period are included in net income.
• Specific exceptions to this practice have developed - these items bypass income and are reported directly in stockholders’ equity.
Comprehensive Income

• The FASB now requires that, in addition to reporting net income, a company must also report comprehensive income.
Comprehensive Income
Comprehensive Income
Includes all changes in stockholders' equity during a period except those resulting from investments by stockholders and distributions to stockholders.

Complete Income Statement

There are three types of comparisons to improve decision usefulness of financial information:
• Intracompany basis
• Intercompany basis
• Industry averages
Financial Statement Analysis

Financial Statement Analysis
Three basic tools are used in financial statement analysis :
1. Horizontal analysis
2. Vertical analysis
3. Ratio analysis
23

Analysts should look beyond the ratios.
Economic factors
Consumer tastes
Industry trends
Technological changes
Changes within the firm
Limitations of Financial Statement Analysis
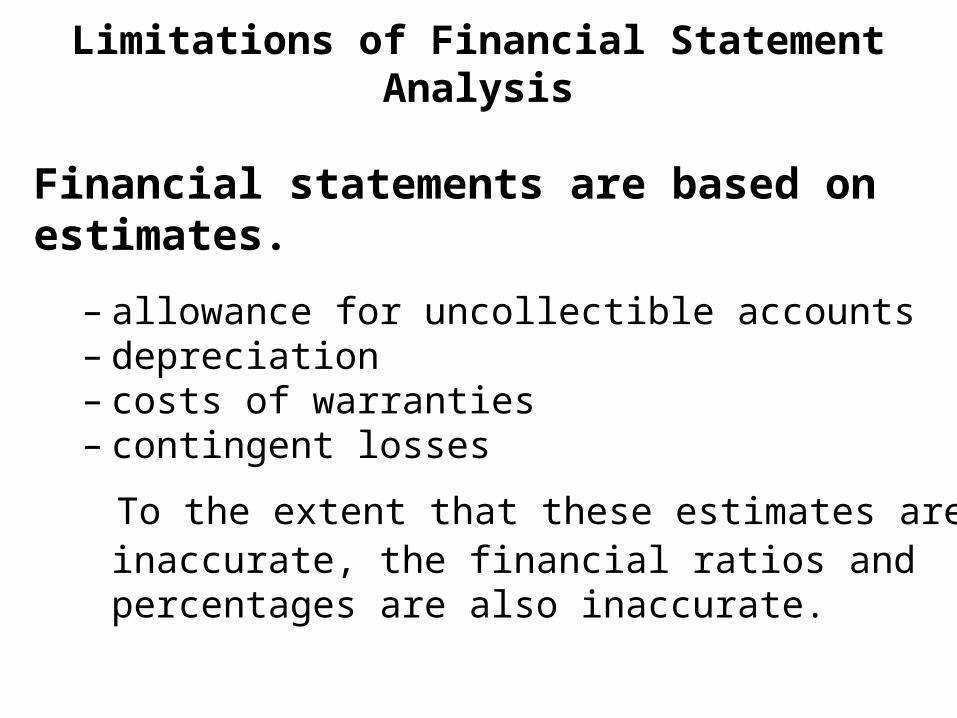
Financial statements are based on estimates.
– allowance for uncollectible accounts– depreciation– costs of warranties– contingent losses
To the extent that these estimates are inaccurate, the financial ratios and percentages are also inaccurate.
Limitations of Financial Statement Analysis

Statements in Comparative and Common-Size Form
Dollar and percentage changes on statements
Common-size statements
Ratios
Analytical techniques used to examine
relationships among financial statement
items

Dollar and Percentage Changes on Statements
Comparing statements underscores movements and trends and may provide valuable clues about
what to expect in the future.
Horizontal analysis
Trendanalysis

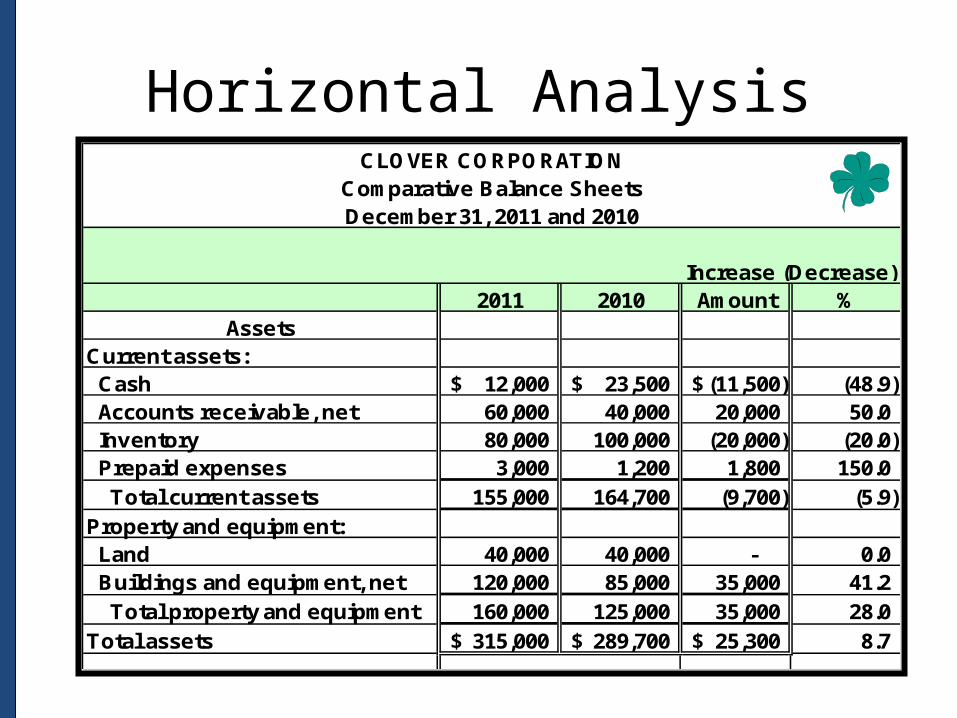
Horizontal Analysis
Horizontal analysis shows the changes between years in the financial data in
both dollar and percentage form.

Horizontal Analysis
CLOVER CORPORATIONComparative Balance SheetsDecember 31, 2011 and 2010
Increase (Decrease)2011 2010 Amount %
AssetsCurrent assets: Cash 12,000$ 23,500$ Accounts receivable, net 60,000 40,000 Inventory 80,000 100,000 Prepaid expenses 3,000 1,200
Total current assets 155,000 164,700
Property and equipment: Land 40,000 40,000 Buildings and equipment, net 120,000 85,000
Total property and equipment 160,000 125,000
Total assets 315,000$ 289,700$

Horizontal Analysis
Calculating Change in Dollar Amounts
DollarChange
Current YearFigure
Base YearFigure
= –
The dollar amounts for 2007 become
the “base” year figures.

Horizontal Analysis
Calculating Change as a Percentage
PercentageChange
Dollar Change Base Year Figure
100%= ×

Horizontal AnalysisCLOVER CORPORATION
Comparative Balance SheetsDecember 31, 2011 and 2010
Increase (Decrease)2011 2010 Amount %
AssetsCurrent assets: Cash 12,000$ 23,500$ (11,500)$ (48.9) Accounts receivable, net 60,000 40,000 Inventory 80,000 100,000 Prepaid expenses 3,000 1,200
Total current assets 155,000 164,700
Property and equipment: Land 40,000 40,000 Buildings and equipment, net 120,000 85,000
Total property and equipment 160,000 125,000
Total assets 315,000$ 289,700$
($11,500 ÷ $23,500) × 100% = 48.9%
$12,000 – $23,500 = $(11,500)
Horizontal AnalysisCLOVER CORPORATION
Comparative Balance SheetsDecember 31, 2011 and 2010
Increase (Decrease)2011 2010 Amount %
AssetsCurrent assets: Cash 12,000$ 23,500$ (11,500)$ (48.9) Accounts receivable, net 60,000 40,000 20,000 50.0 Inventory 80,000 100,000 (20,000) (20.0) Prepaid expenses 3,000 1,200 1,800 150.0
Total current assets 155,000 164,700 (9,700) (5.9)
Property and equipment: Land 40,000 40,000 - 0.0 Buildings and equipment, net 120,000 85,000 35,000 41.2
Total property and equipment 160,000 125,000 35,000 28.0
Total assets 315,000$ 289,700$ 25,300$ 8.7

Horizontal AnalysisCLOVER CORPORATION
Comparative Income StatementsFor the Years Ended December 31, 2011 and 2010
Increase (Decrease)
2011 2010 Amount %Net sales 520,000$ 480,000$ 40,000$ 8.3Cost of goods sold 360,000 315,000 45,000 14.3
Gross margin 160,000 165,000 (5,000) (3.0)Operating expenses 128,600 126,000 2,600 2.1
Net operating income 31,400 39,000 (7,600) (19.5)Interest expense 6,400 7,000 (600) (8.6)
Net income before taxes 25,000 32,000 (7,000) (21.9)Less income taxes (30%) 7,500 9,600 (2,100) (21.9)
Net income 17,500$ 22,400$ (4,900)$ (21.9)
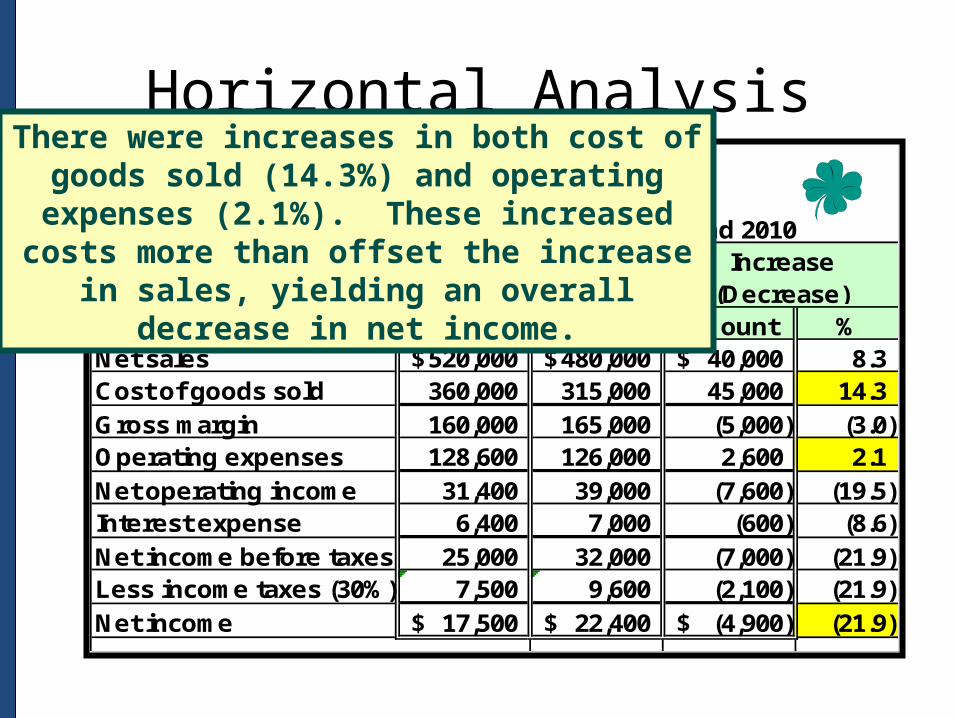
Sales increased by 8.3% yet net income decreased by 21.9%.
Horizontal AnalysisCLOVER CORPORATION
Comparative Income StatementsFor the Years Ended December 31, 2011 and 2010
Increase (Decrease)
2011 2010 Amount %Net sales 520,000$ 480,000$ 40,000$ 8.3Cost of goods sold 360,000 315,000 45,000 14.3
Gross margin 160,000 165,000 (5,000) (3.0)Operating expenses 128,600 126,000 2,600 2.1
Net operating income 31,400 39,000 (7,600) (19.5)Interest expense 6,400 7,000 (600) (8.6)
Net income before taxes 25,000 32,000 (7,000) (21.9)Less income taxes (30%) 7,500 9,600 (2,100) (21.9)
Net income 17,500$ 22,400$ (4,900)$ (21.9)
There were increases in both cost of goods sold (14.3%) and operating expenses (2.1%). These increased costs more than offset the
increase in sales, yielding an overall decrease in net income.
Trend Percentages
Trend percentages state several years’
financial data in terms of a base year, which equals 100 percent.

Trend Analysis
Example
Look at the income information for Berry Products for the years 2007 through 2011. We will do a trend
analysis on these amounts to see what we can learn about the company.

Trend Analysis
Berry ProductsIncome Information
For the Years Ended December 31,
The baseyear is 2007, and its amounts
will equal 100%.
YearItem 2011 2010 2009 2008 2007
Sales 400,000$ 355,000$ 320,000$ 290,000$ 275,000$ Cost of goods sold 285,000 250,000 225,000 198,000 190,000 Gross margin 115,000 105,000 95,000 92,000 85,000

Trend Analysis
Berry ProductsIncome Information
For the Years Ended December 31, Year
Item 2011 2010 2009 2008 2007Sales 105% 100%Cost of goods sold 104% 100%Gross margin 108% 100%
2008 ÷ 2007 ( $290,000 ÷ $275,000 ) × 100% = 105%( $198,000 ÷ $190,000 ) × 100% = 104%( $ 92,000 ÷ $ 85,000 ) × 100% = 108%

Trend Analysis
Berry ProductsIncome Information
For the Years Ended December 31,
By analyzing the trends for Berry Products, we can see that cost of goods sold is increasing
faster than sales, which is slowing the increase in gross margin.
YearItem 2011 2010 2009 2008 2007
Sales 145% 129% 116% 105% 100%Cost of goods sold 150% 132% 118% 104% 100%Gross margin 135% 124% 112% 108% 100%

Trend AnalysisWe can use the trend
percentages to construct a graph so we can see the
trend over time.
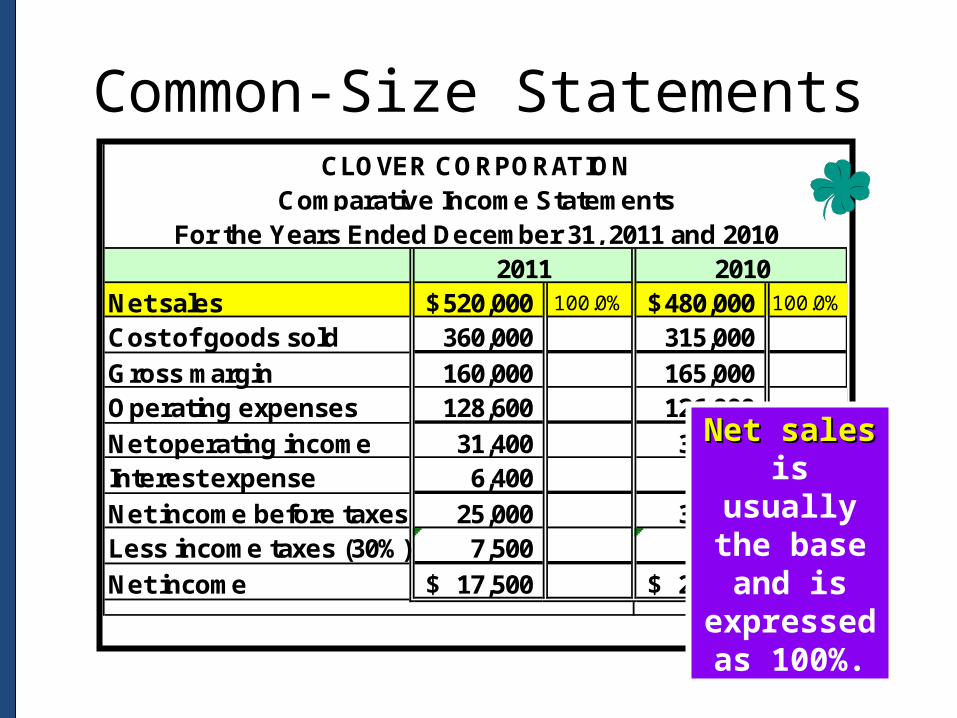
Common-Size Statements
Common-sizeCommon-size statements use
percentages to express the relationship of
individual components to a total within a singlesingle
period. This is also known as vertical vertical
analysisanalysis.

Common-Size Statements
Example
Let’s take another look at the information from the comparative
income statements of Clover Corporation for 2011 and 2010.
This time let’s prepare common-size
statements.
Common-Size Statements
Net sales 520,000$ 100.0% 480,000$ 100.0%
Cost of goods sold 360,000 315,000
Gross margin 160,000 165,000 Operating expenses 128,600 126,000
Net operating income 31,400 39,000 Interest expense 6,400 7,000
Net income before taxes 25,000 32,000 Less income taxes (30%) 7,500 9,600
Net income 17,500$ 22,400$
2011 2010
CLOVER CORPORATIONComparative Income Statements
For the Years Ended December 31, 2011 and 2010
Net sales Net sales is usually the base and is expressed as 100%.

Common-Size Statements
Net sales 520,000$ 100.0% 480,000$ 100.0%
Cost of goods sold 360,000 69.2% 315,000 65.6%
Gross margin 160,000 165,000 Operating expenses 128,600 126,000
Net operating income 31,400 39,000 Interest expense 6,400 7,000
Net income before taxes 25,000 32,000 Less income taxes (30%) 7,500 9,600
Net income 17,500$ 22,400$
2011 2010
CLOVER CORPORATIONComparative Income Statements
For the Years Ended December 31, 2011 and 2010
2011 COGS ÷ 2011 Net Sales ( $360,000 ÷ $520,000 ) = 69.2%
2010 COGS ÷ 2010 Net Sales ( $315,000 ÷ $480,000 ) = 65.6%

Common-Size Statements
Net sales 520,000$ 100.0% 480,000$ 100.0%
Cost of goods sold 360,000 69.2% 315,000 65.6%
Gross margin 160,000 30.8% 165,000 34.4%
Operating expenses 128,600 24.8% 126,000 26.2%
Net operating income 31,400 6.0% 39,000 8.2%
Interest expense 6,400 1.2% 7,000 1.5%
Net income before taxes 25,000 4.8% 32,000 5.7%
Less income taxes (30%) 7,500 1.4% 9,600 2.0%
Net income 17,500$ 3.4% 22,400$ 4.7%
2011 2010
CLOVER CORPORATIONComparative Income Statements
For the Years Ended December 31, 2011 and 2010
What conclusions
can we draw?

ReviewReviewReviewReview
In horizontal analysis, each item is In horizontal analysis, each item is expressed as a percentage of the:expressed as a percentage of the:
a.a. net income amount.net income amount.
d.d. base-year amount.base-year amount.c. c. total assets amount.total assets amount.b.b. stockholders’ equity amount.stockholders’ equity amount.
ReviewReviewReviewReview

In vertical analysis, the base amount In vertical analysis, the base amount for depreciation expense is for depreciation expense is generally:generally:a.a. net sales.net sales.
d.d. fixed assets.fixed assets.c. c. gross profit.gross profit.b.b. depreciation expense in a previous year.depreciation expense in a previous year.
ReviewReviewReviewReview
Ratio Analysis
11 6

Ratios Three types:
Liquidity ratios
Solvency ratios
Profitability ratios
Can provide clues to underlying conditions that may not be apparent from an inspection of the individual components.
Single ratio by itself is not very meaningful.
53

Liquidity Ratios
Measure the short-term ability of the enterprise to pay its maturing obligations and to meet unexpected needs for cash.
WHO CARES?Short-term creditors such as bankers and suppliers

Liquidity Ratios
Solvency Ratios
Measure the ability of the enterprise to survive over a long period of time
WHO CARES?Long-term creditors and stockholders
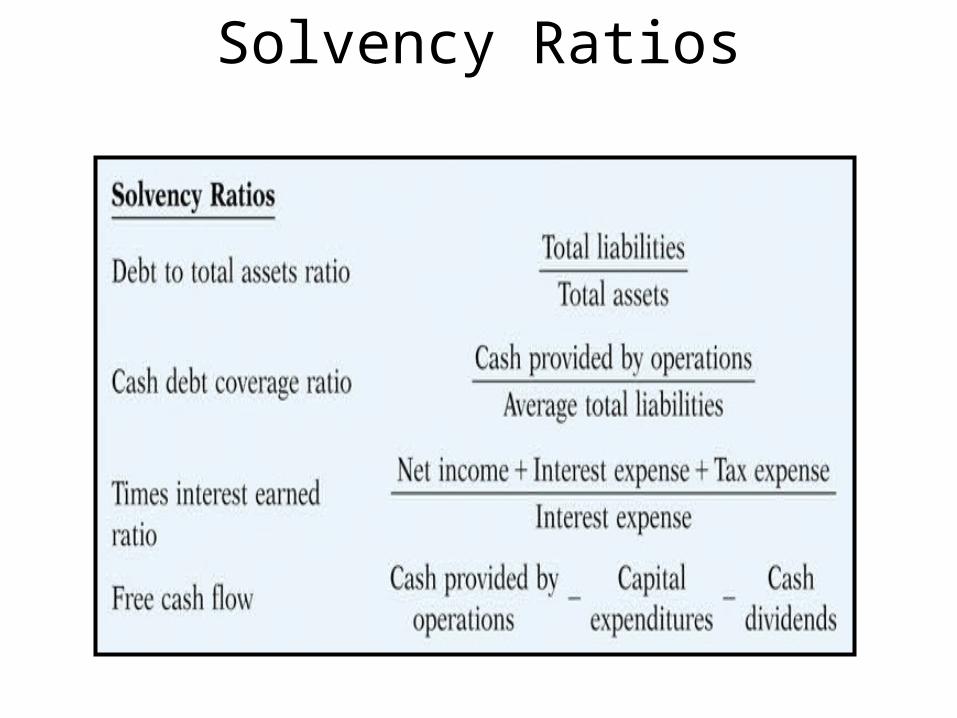
Solvency Ratios
Profitability Ratios
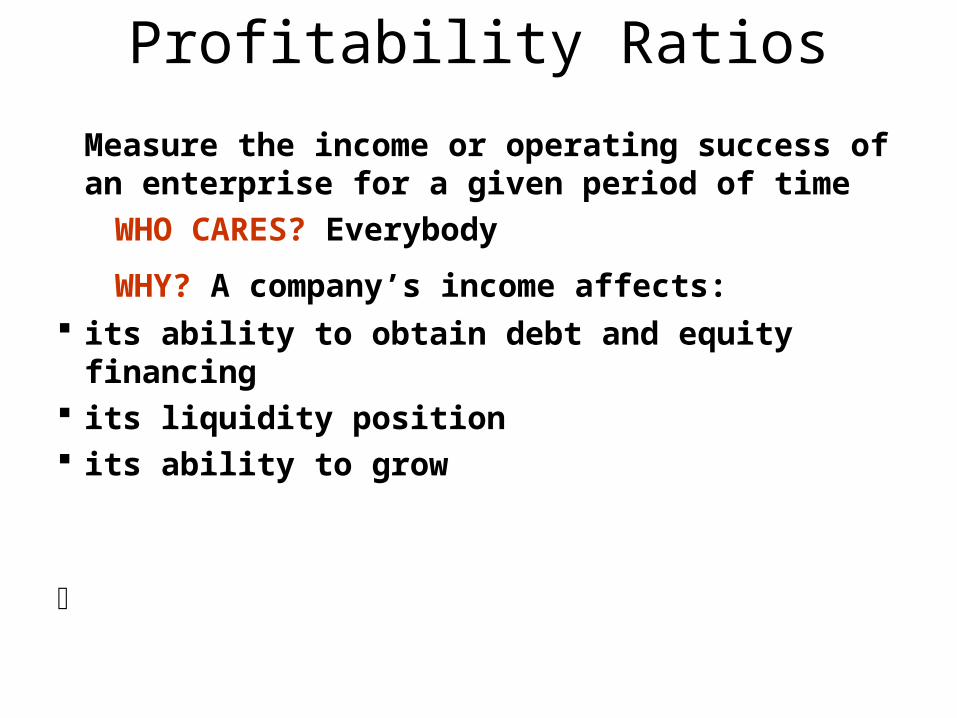
Measure the income or operating success of an enterprise for a given period of time
WHO CARES? Everybody
WHY? A company’s income affects: its ability to obtain debt and equity financing its liquidity position its ability to grow

Profitability Ratios

Quality of Earnings
A company that has a high quality of earnings provides full and transparent information that will not confuse or mislead users of the financial statements.

Alternative Accounting Methods
• One company may use the FIFO method, while another company in the same industry may use LIFO.
• If the inventory is significant for both companies, it is unlikely that their current ratios are comparable.
• In addition to differences in inventory costing methods, differences also exist in reporting such items as depreciation, depletion, and amortization.

Pro Forma Income
A measure of the net income generated that usually excludes items that the company thinks are unusual or nonrecurring.

Improper Recognition
• Offering big discounts (channel stuffing) to companies to get them to buy early- Often leads to disaster in subsequent periods.
• Improper capitalization of operating expenses
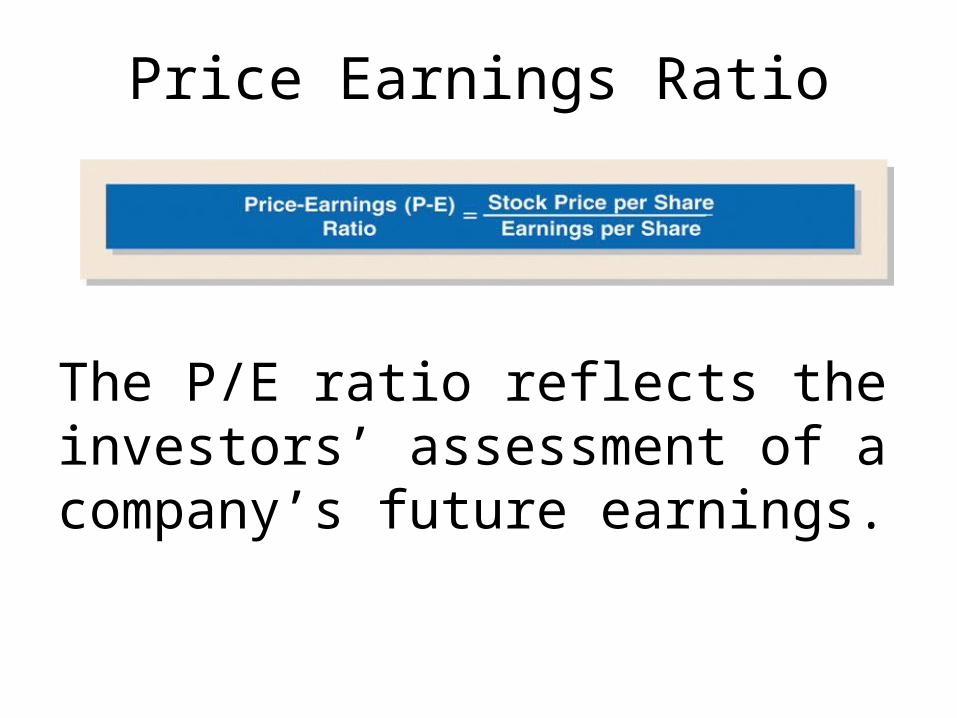
Price Earnings Ratio
The P/E ratio reflects the investors’ assessment of a company’s future earnings.
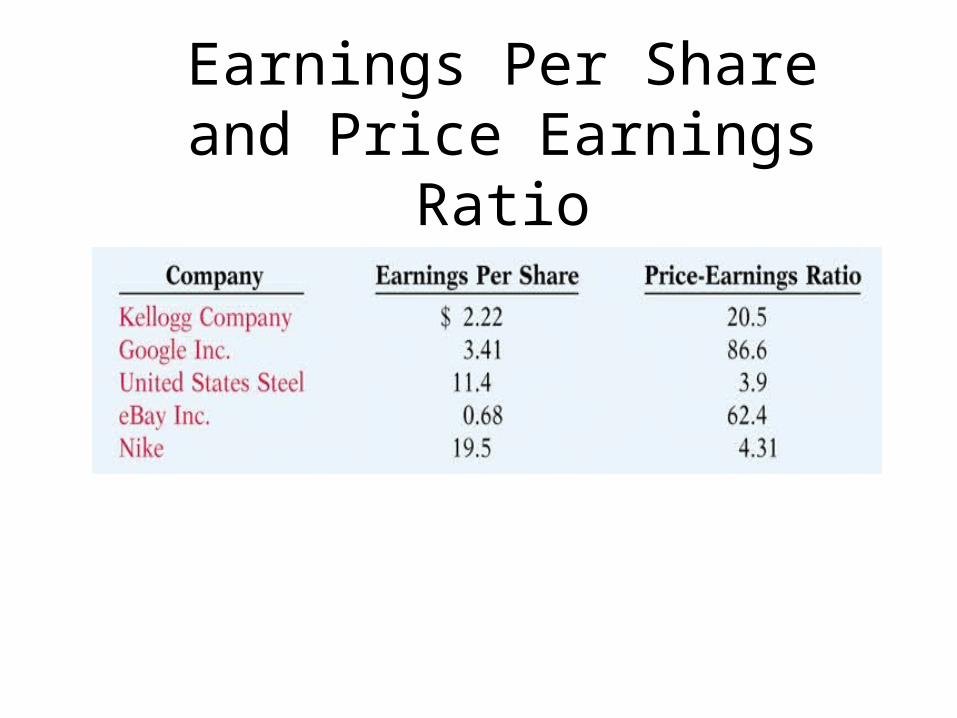
Earnings Per Share and Price Earnings Ratio