what we know about ocean acidification status and … 16, 2015 · what we know about ocean...
TRANSCRIPT

What we know about ocean acidification status and trends on the West Coast
Dr. Simone Alin
With thanks to Tessa Hill, Richard Feely, Brendan Carter, Adrienne Sutton, Jan Newton, Francis Chan, Brian Gaylord, Dana Greeley, and many others
Indicators of Climate Change in California Workshop (June 16, 2015)

2
Pacific Northwest hatchery failures
“Between 2005 and 2009, disastrous production failures at Pacific Northwest oyster hatcheries signaled a shift in ocean chemistry that has profound implications for Washington’s marine environment.”
Washington Blue Ribbon Panel on Ocean Acidification 2012
★ Whiskey Creek
★ Taylor Shellfish
Photos: Taylor Shellfish
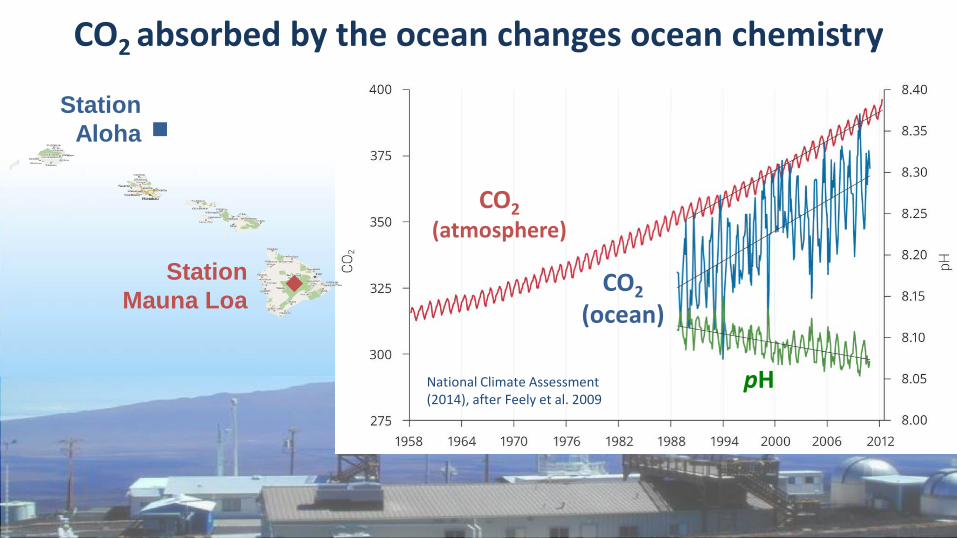
CO2 absorbed by the ocean changes ocean chemistry
Station
Aloha
Station Mauna Loa
CO2 (atmosphere)
CO2 (ocean)
pH National Climate Assessment (2014), after Feely et al. 2009
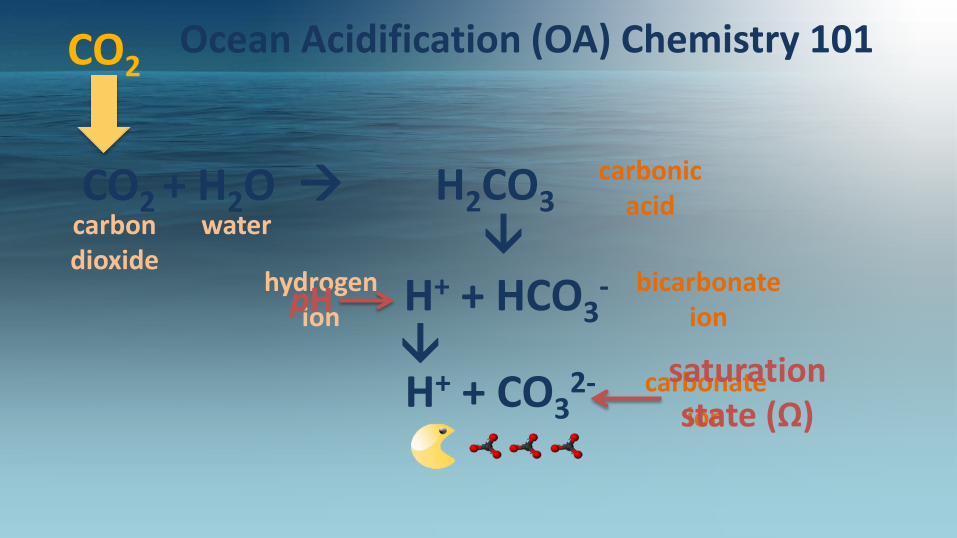
Ocean Acidification (OA) Chemistry 101 CO2
CO2 + H2O H2CO3
H+ + HCO3-
carbonic acid
carbonate ion
H+ + CO32-
bicarbonate ion
hydrogen ion
water carbon dioxide
pH
saturation state (Ω)


Socioeconomic benefits of West Coast fisheries
Photos: Washington Blue Ribbon Panel on Ocean Acidification 2012
• $0.5B per year industry on West Coast • About 60% of which is shellfish and
vulnerable to decreasing saturation states • Jobs and livelihoods • Cultural and ceremonial importance • Recreational value
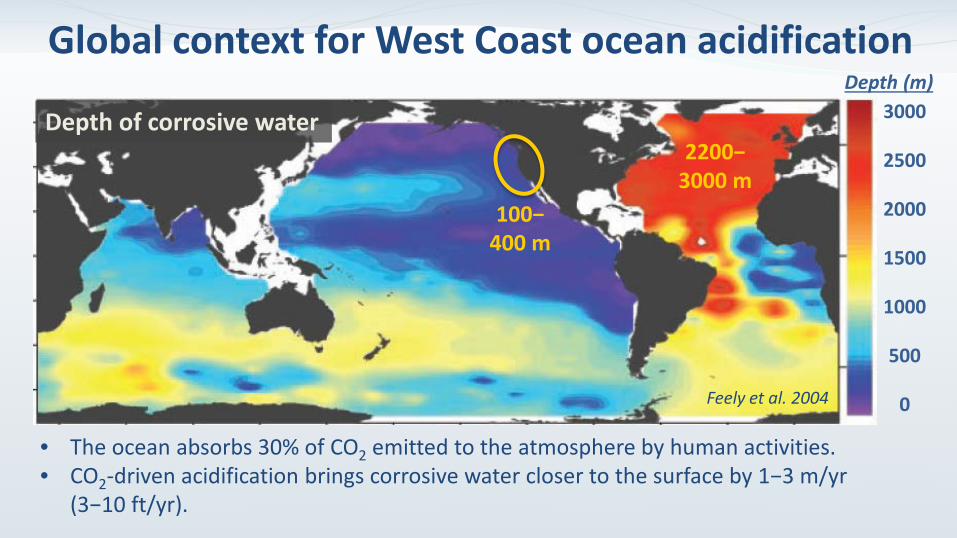
Global context for West Coast ocean acidification
• The ocean absorbs 30% of CO2 emitted to the atmosphere by human activities. • CO2-driven acidification brings corrosive water closer to the surface by 1−3 m/yr
(3−10 ft/yr).
3000
2000
1000
0
2500
1500
500
Depth of corrosive water Depth (m)
Feely et al. 2004
100− 400 m
2200− 3000 m
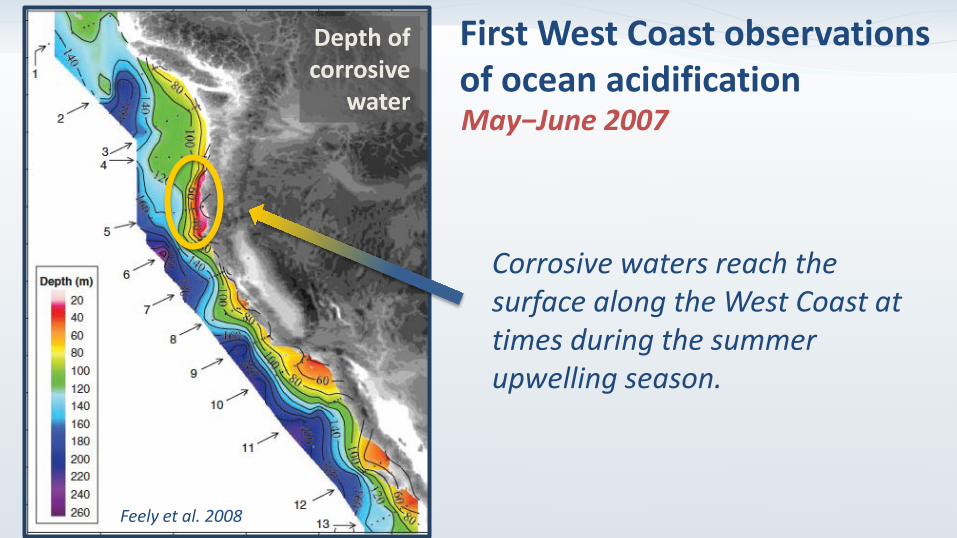
First West Coast observations of ocean acidification
Feely et al. 2008
May−June 2007
Depth of corrosive
water
Corrosive waters reach the surface along the West Coast at times during the summer upwelling season.

Why are conditions so much worse along the coast?

• Spatial surveys of carbonate chemistry done on ship-based research “cruises” in 2007, 2011, 2012, 2013, and 2016.
• We also measure high-resolution changes in chemistry at several time-series moorings along the West Coast ( ).
• Areas of corrosive conditions at the surface and everywhere at 125 m during summer. Upwelling, production/respiration, and rivers are important contributors.
Present-day conditions along the West Coast
Feely, Alin, Chan, Hill et al., in prep

Estimated chemistry changes since pre-industrial Aragonite saturation state off Newport, Oregon
Surface
Deep
Num
ber o
f obs
erva
tions
Harris et al. 2013
Increasing frequency of corrosivity
• Estimated mean present-day Ωarag is 0.52 lower than during the pre-industrial (Oregon).
• Frequency of corrosive conditions in shelf water has increased by 20−26% (Oregon, Washington).

Past, present, and projected pH along West Coast
Gruber et al. 2012
1750
2005
2050
• Projected change over next 35 years is accelerating and projected to be greater than since 1750.
Pre-industrial Present-day Mid-century

14
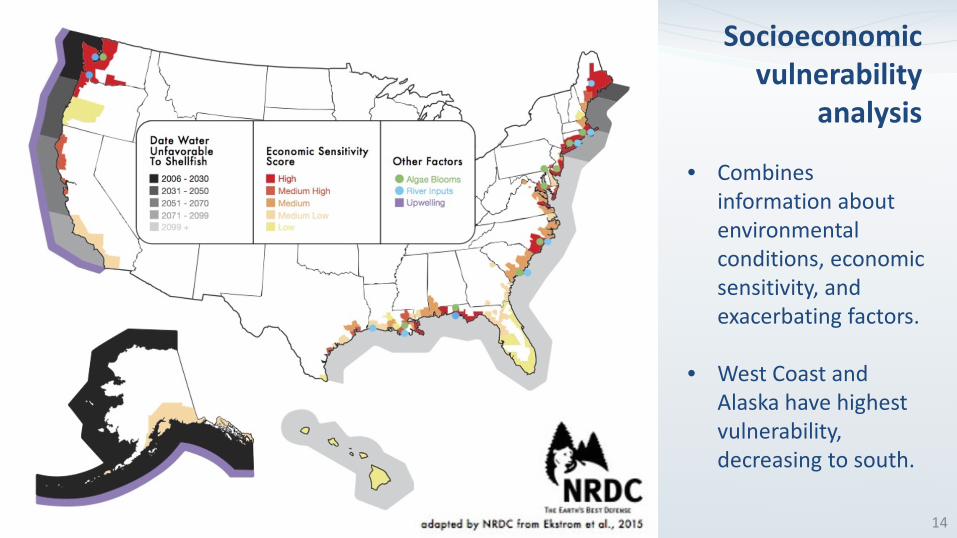
• Combines information about environmental conditions, economic sensitivity, and exacerbating factors.
• West Coast and Alaska have highest vulnerability, decreasing to south.
Socioeconomic vulnerability
analysis
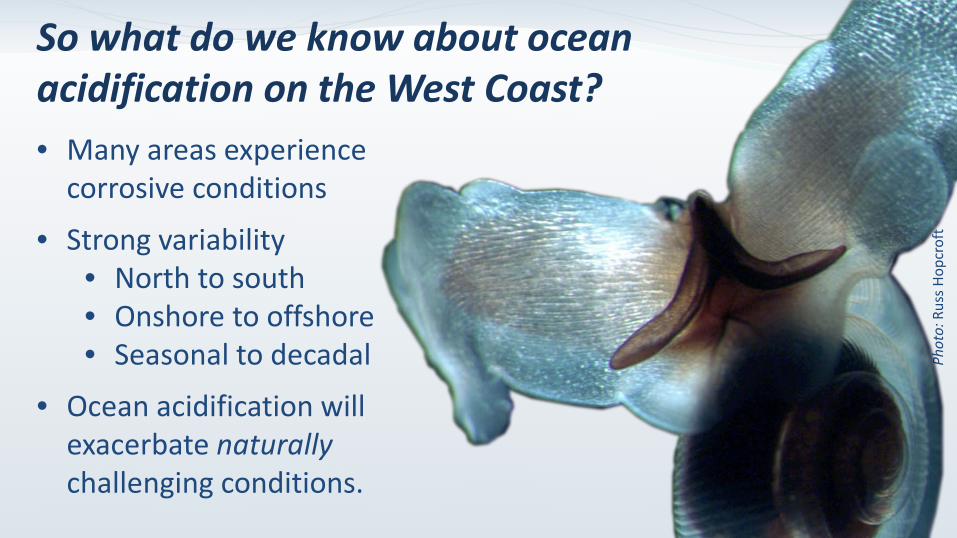
So what do we know about ocean acidification on the West Coast?
Phot
o: R
uss H
opcr
oft
• Many areas experience corrosive conditions
• Strong variability • North to south • Onshore to offshore • Seasonal to decadal
• Ocean acidification will exacerbate naturally challenging conditions.

Indicators might track changes in: • Annual CO2, pH, Ωaragonite
extremes • Annual averages • Corrosive events (“carbonate
weather”) • Frequency • Duration • Intensity
• Seasonal first & last appearance of corrosive waters in key habitats
OA indicators along West Coast: under development
Alin et al. in press, Sutton et al. in prep.
Washington moorings
California mooring (CCE2)
xCO
2 (pp
m)
Air Seawater
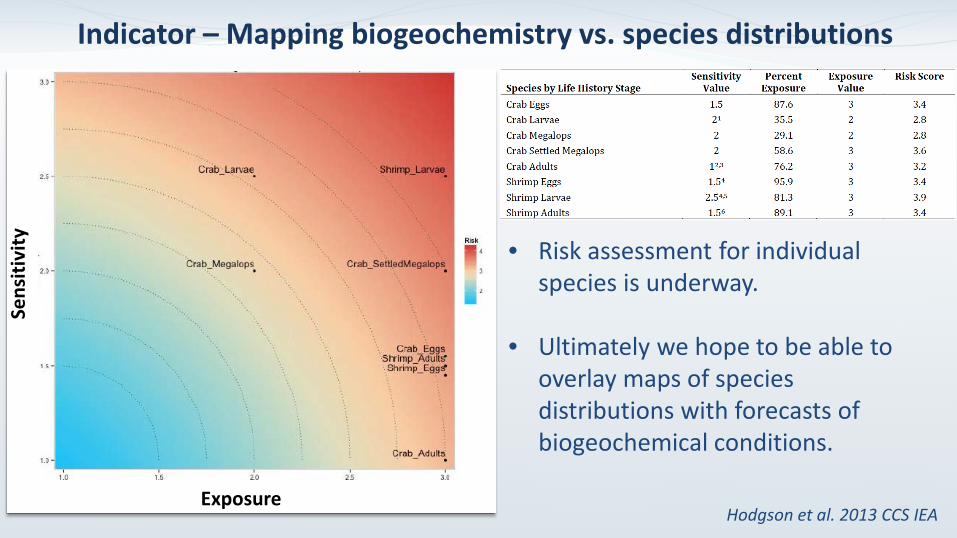
Indicator – Mapping biogeochemistry vs. species distributions
Hodgson et al. 2013 CCS IEA
• Risk assessment for individual species is underway.
• Ultimately we hope to be able to overlay maps of species distributions with forecasts of biogeochemical conditions.
Exposure
Sens
itivi
ty

Closing thoughts • Acidity is projected to increase (= pH decrease) and
aragonite saturation state to decrease at accelerating rates in the future due to ongoing CO2 emissions.
• Many potential indicators to track (under development).
• Clean Water Act specifies pH criteria that may provide a route for management/regulation based on changing chemistry.
• However, regional inputs through rivers and stormwater runoff may be more amenable to state level action.

