what’s brewing with caiso’s markets and grid operations?
TRANSCRIPT

Making Clean Local Energy Accessible Now
Craig LewisExecutive Director
Clean Coalition
10 November 2020
Loretta LynchFormer President
California Public Utilities Commission
What’s brewing with CAISO’s markets and grid operations?

2Making Clean Local Energy Accessible Now
GoToWebinar FAQ
• Webinar recording and slides will be sent to registered attendees within two business days.
• All webinars are archived on clean-coalition.org, under Events.
• Submit questions in the Questions pane at any time during the webinar.
• View varies by operating system and browser.
• Questions will be answered during the Q&A portion of the webinar.
• For other questions, contact Rosana Francescato: [email protected]

3Making Clean Local Energy Accessible Now
Presenters
Loretta Lynch
Loretta is a lawyer, writer, and progressive political activist who advises progressive, environmental, and community groups how to achieve clean, sustainable and local energy solutions in regulatory and political environments. As California Public Utilities Commission President, she fought against gouging and manipulation by energy sellers throughout the California energy crisis in 2000-2002 and opposed PG&E’s first bankruptcy bailout, which let them off the hook for their poor corporate choices. One of the first critics of energy deregulation, she is a strong advocate for keeping prices reasonable and for converting from fossil fuels to renewable energy. After the PUC, Ms. Lynch lectured at UC Berkeley’s Goldman Public Policy School and became a visiting scholar at the UC Berkeley Institute for Governmental Studies. She serves on the Sierra Club’s energy and environment committee, and has served on the boards of several California-based environmental groups.

4Making Clean Local Energy Accessible Now
Presenters
Craig Lewis
Craig is Executive Director of the Clean Coalition. He has over 30 years of experience in the renewables, wireless, semiconductor, and banking industries. Previously VP of Government Relations at GreenVolts, he was the first to successfully navigate a solar project through California’s Renewable Portfolio Standard solicitation process. Craig was energy policy lead on Steve Westly’s 2006 California gubernatorial campaign. His resume includes senior government relations, corporate development, and marketing positions at leading wireless, semiconductor, and banking companies such as Qualcomm, Ericsson, and Barclays Bank. Craig received an MBA and MSEE from the University of Southern California and a BSEE from the University of California, Berkeley.

5Making Clean Local Energy Accessible Now
Clean Coalition (nonprofit)
MissionTo accelerate the transition to renewable
energy and a modern grid throughtechnical, policy, and project
development expertise.
100% renewable energy end-game• 25% local, interconnected within the
distribution grid and facilitating resilience without dependence on the transmission grid.
• 75% remote, dependent on the transmission grid for serving loads.

6Making Clean Local Energy Accessible Now
Transmission costs are out of control• Unbelievably high guaranteed return on equity for transmission investments leads to
predictable conflicts-of-interest and perverse market outcomes.• Market distortions like the erroneous metering & assessment of Transmission
Access Charges (TAC) for California IOUs creates massive market distortions that steal value from local generation, hurt ratepayers, and preempt energy resilience.

7Making Clean Local Energy Accessible Now
Transmission costs are far worse than they seem due to O&M driving ~10x increase to upfront costs
• Transmission costs are the fastest-growing component of electricity bill and are already about the same cost as the energy itself.
• The capital costs of transmission infrastructure represent a fraction of total transmission costs. Operations and maintenance (O&M) and returns on investments drive up transmission costs significantly over the life of these assets, with those excessive costs borne by ratepayers.
In nominal dollars, total lifetime ratepayer cost is nearly 10x the initial capital cost; O&M accounts for 68% of this because it increases much faster than inflation. In real dollars (constant value dollars, accounting for inflation), the total lifetime cost
is 5x the initial capital cost, and O&M accounts for 55% of this.

8Making Clean Local Energy Accessible Now
Optimizing the grid for ratepayer savings requires lots of local renewables & energy storage• SCE found that intelligently siting 4 GW of local solar would preempt over $2.2 billion in new
transmission infrastructure investments, which represents approximately $20 billion in ratepayer savings over the lifetime of such transmission investments when considering O&M.
• Transmission costs are always borne by ratepayers, while distribution & interconnection costs are always borne by solar project developers.

9Making Clean Local Energy Accessible Now
Optimizing the grid for energy resilience requires lots of local renewables & energy storageGoleta Load Pocket (GLP) is the perfect opportunity for a Community Microgrid
• GLP spans 70 miles of California coastline, from Point Conception to Lake Casitas, encompassing the cities of Goleta, Santa Barbara (including Montecito), and Carpinteria.
• GLP is highly transmission-vulnerable and disaster-prone (fire, landslide, earthquake). • 200 megawatts (MW) of solar and 400 megawatt-hours (MWh) of energy storage will
provide 100% protection to GLP against a complete transmission outage (“N-2 event”).• 200 MW of solar is equivalent to about 5 times the amount of solar currently deployed in the GLP and
represents about 25% of the energy mix. • Multi-GWs of solar siting opportunity exists on commercial-scale built environments like parking lots,
parking structures, and rooftops; and 200 MW represents about 7% of the technical siting potential.• Other resources like energy efficiency, demand response, and offshore wind can significantly reduce
solar+storage requirements.

10Making Clean Local Energy Accessible Now
TAC cause massive California market distortions
Current interface for metering TAC in PTO utility service territories(at customer meters with no distinction of energy from next door vs 1,000 miles away)
Proper interface for metering & assessing all High Voltage TAC (done properly for municipal utilities, but not for IOUs)
Proper interface for metering all Low Voltage TAC (done properly for municipal utilities, but not for IOUs)

11Making Clean Local Energy Accessible Now
The real value of locally generated energy
Existing transmission costs, assessed as TAC and currently averaging 2¢/kWh, should be added to the cost of remote generation that requires use of the transmission grid to get energy from where it is generated to
where it is used, which is almost always on the distribution grid where people live and work. Future transmission investments, currently averaging 2.5¢/kWh in the evenings, can be avoided via dispatchable
local generation, and that value should reduce the evaluated cost of local generation. When correctly considering ratepayer impacts of transmission costs, dispatchable local generation provides an average of
4.5¢/kWh of better value to ratepayers than is currently assumed in the majority of instances.

12Making Clean Local Energy Accessible Now
Transmission Access Charges (TAC) distortion adds to transmission costs in California
• In California, high transmission costs are exacerbated by how Transmission Access Charges (TAC) are metered & assessed in IOU service territories: TAC are charged on all energy, whether or not the energy uses the transmission grid.
• This massive market distortion creates an unfair disadvantage against clean local energy.• The easy fix: Charge for electricity transmission infrastructure based on actual use
of the transmission grid.• TACC are already metered & assessed correctly for municipal utilities.• The California Independent System Operator (CAISO) has agreed that we need TAC
reform but has deferred to the California Public Utilities Commission (CPUC) to take action.
Paying a toll doesn’t make sense if you don’t cross the bridge, but this is how we are charged for electricity transmission infrastructure in much of California. Currently, all ratepayers pay the same charge for “using” the transmission system, whether or not the energy they use travels across that system.

13Making Clean Local Energy Accessible Now
TAC are growing fast to ~4.5 cents/kWh over 20 years
2016 - 2035
$/kW
h
Forecasted PG&E Total TAC Rate
$0.03/kWh when levelized over 20 years
$0.015
$0.020
$0.025
$0.030
$0.035
$0.040
$0.045
1 2 3 4 5 6 7 8 9 10 11 12 13 14 15 16 17 18 19 20
Business As Usual (BAU)
The 20-year levelized TAC is about 3 cents/kWh, which is roughly 50% of the average wholesale cost of electricity in
California!

14Making Clean Local Energy Accessible Now
Not fixing TAC would cost Californians $60 billion over the next two decades
• Generating energy closer to where we use it means we need less transmission infrastructure, which lowers costs for ratepayers by avoiding expensive transmission lines.
• Continuing with business as usual will cost Californians ~ $60 billion in avoidable transmission costs over the next 20 years.

15Making Clean Local Energy Accessible Now
Transmission divestment eliminates a major conflict of interest
• Transmission divestment would eliminate a major conflict of interest at the utility between transmission and distribution grid investments, both of which it owns under the current system:

16Making Clean Local Energy Accessible Now
A new utility business model: Distribution System Operator (DSO)
• Freed from its transmission assets, PG&E could become a Distribution System Operator
(DSO), focused on achieving maximum value from DER and the distribution grid.
• The utility's transmission assets could be taken over by a private company, or ownership
could be assumed by the state.
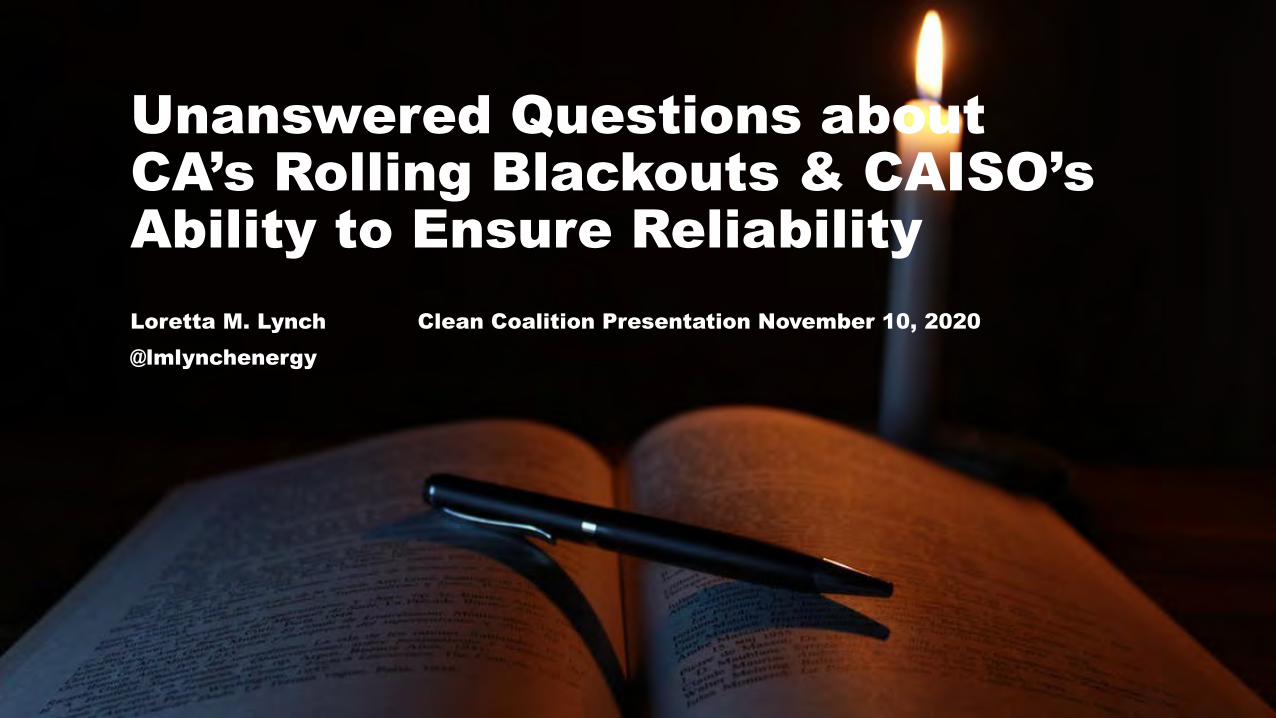
Unanswered Questions about CA’s Rolling Blackouts & CAISO’s Ability to Ensure ReliabilityLoretta M. Lynch Clean Coalition Presentation November 10, 2020@lmlynchenergy

The Origin & Operation Of the ISO
What the ISO Is and What It Does
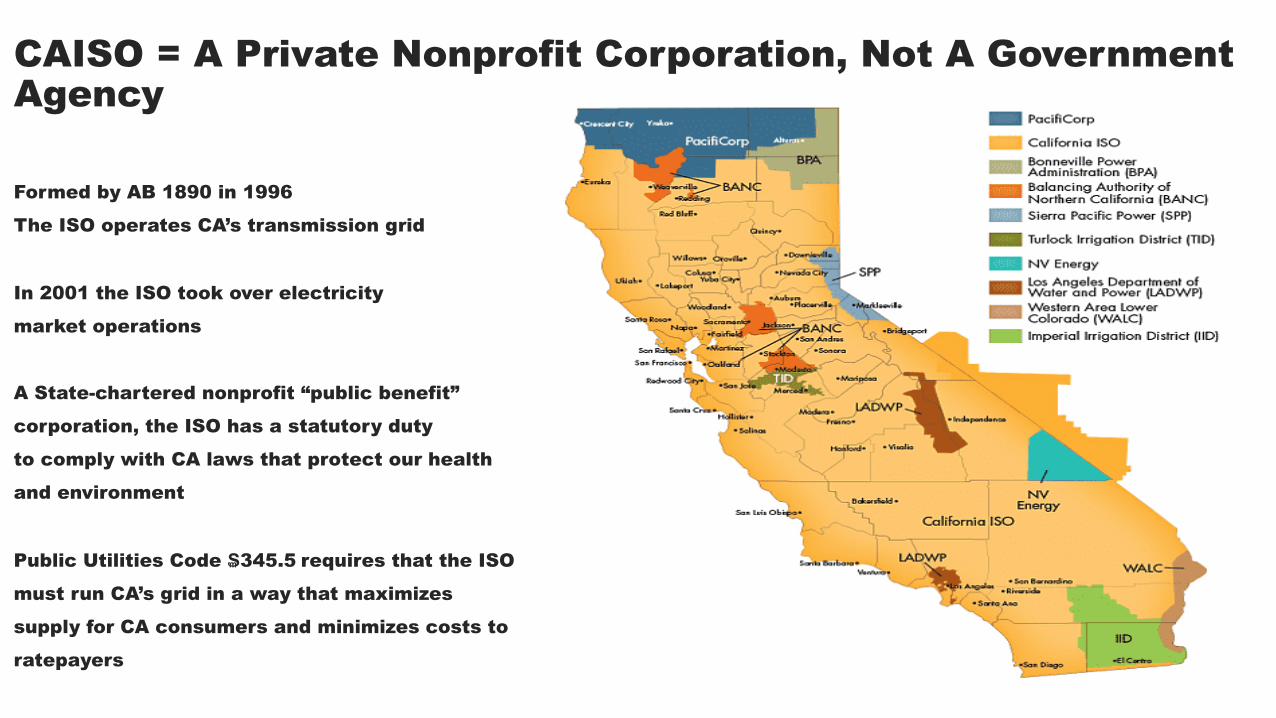
CAISO = A Private Nonprofit Corporation, Not A Government Agency
Formed by AB 1890 in 1996
The ISO operates CA’s transmission grid
In 2001 the ISO took over electricity
market operations
A State-chartered nonprofit “public benefit”
corporation, the ISO has a statutory duty
to comply with CA laws that protect our health
and environment
Public Utilities Code ₷345.5 requires that the ISO
must run CA’s grid in a way that maximizes
supply for CA consumers and minimizes costs to
ratepayers

The CA ISO Juggles Multiple Roles
Operates California’s Electricity Transmission Gridscheduling electricity to travel from where it is produced to
where it is consumed
Operates Multiple Electricity Markets• Day Ahead• Convergence Bidding• Real Time• Ancillary Services• Resource Adequacy • Power purchases through the Capacity Procurement Mechanism
Now the Reliability Coordinator for Most of the West

Source: Western Electirc Coordinating Council (WECC) via (EIA)
California Buys & Sells Electricity Throughout the West
• The Western Electric Coordinating Council (WECC) provides regional grid operations standards.
• NERC’s most recent long-term reliability assessment found that “The Western Interconnection and all the individual subregions are expected to have sufficient generation to meet or exceed the Reference Margin Level . . .” (NERC 2019 Long Term Reliability Assessment, p.94)
• NERC found that the WECC CA region maintained 2020 reserves ranging from a 21% prospective reserve margin; a 17.8% anticipated reserve margin; and a 13.74% reference margin level. (NERC 2019 Assessment ,p. 99)
5

The ISO Itself Calculated the Summer 2020 Planning Reserve Margin to Meet CA’s Summer Electricity Demand
0
10,000
20,000
30,000
40,000
50,000
60,000
MW
Planning Reserve Margin represents an additional 15% more power that the utilities must purchase based on the Peak Load Forecast below
The Load Forecast represents the amount of power projected by the ISO to be needed that the PUC requires utilities to buy in advance
45,907
6,886
Planning Reserve Margin = Base Peak Load Forecast + 15% = 52,973 MWSource: CAISO’s 2020 Summer Loads and Resources Assessment, Table 6, p. 20 http://www.caiso.com/Documents/2020SummerLoadsandResourcesAssessment.pdf

What Happened With CA’s Grid & Electricity Markets in August 2020• The ISO Called Rolling Blackouts on Aug. 14th at 6:30 pm. Peak demand had
reached 46,777 MW but blackouts began with demand at 45,716 MW.• The ISO Called Rolling Blackouts on Aug.15th at 6:28 pm. Peak demand had
reached 44,913 MW; blackouts began with demand at 44,524 MW.• The ISO Suspended its Convergence Bidding Market on August 17th without
explanation until Sept. 11th, when it admitted that the Convergence Bidding Market affected reliability• The ISO triggered its emergency buying authority under CPM to purchase
power in August and September, spending as yet unknown amounts for power

August 14th & 15th Peak Demand Never Neared CA’s Historic Electricity Demand of 50,000+ MW
August 14th August 15th
Peak Demand 6PM Blackout @ 6:28 pm 44,913 MW 44,524 MW
Peak Demand 5PM Blackout @ 6:38 pm 46,777 MW 45,716 MW
Source: CAISO’s Today’s Outlookhttp://www.caiso.com/TodaysOutlook/Pages/index.html

The ISO Reported Three Root Causes of the August 2020 Blackouts
1. The existing resource planning processes are not designed to fully address an extreme heat storm like the one experienced in mid-August.
2. In transitioning to a reliable, clean, and affordable resource mix, resource planning targets have not kept pace to lead to sufficient resources that can be relied upon to meet demand in the early evening hours. This makes balancing demand and supply more challenging. These challenges were amplified by the extreme heat storm.
3. Some practices in the day-ahead energy market exacerbated the supply challenges under highly stressed conditions.
CA ISO, Preliminary Root Cause Analysis, Mid-August 2020 Heat Storm, October 6, 2020, p. 3.

CA’s Summer 2020 Planning Reserve Margin Provided Sufficient Electricity During CA’s Historic August Heat Wave
0
10,000
20,000
30,000
40,000
50,000
60,000
MW
August 14 = 46,777 MW Peak Demand
45,907
6,886
August 15 = 44,913 MW Peak Demand
Source: CAISO’s 2020 Summer Loads and Resources Assessment, Table 6, p. 20 http://www.caiso.com/Documents/2020SummerLoadsandResourcesAssessment.pdf
Planning Reserve Margin = 1-in-2 Peak Load Forecast + 15% = 52,973 MW

11CAISO Summer Loads & Resources Assessment, CAISO 2020 NQC List, CAISO Outage List. Foundation for Resilient Societies Analysis, August 2020 Blackouts in CAISO, November 5, 2020 Presentation
45,907
6,886
49,236
6,800
45,079
5,733
0
10,000
20,000
30,000
40,000
50,000
60,000
2020 Resource Need 2020 Planned Resources 5:00pm on August 14
Meg
awat
tsPeak Load at 5:00pm on August 14, 2020 Compared to Resources
Realized Imports
Realized Capacity
Estimated Imports
Procured Capacity
Planning Margin of 15%
1-in-2 Peak Load Forecast
Peak Load of 46,777 MW

CAISO’s 8/14 Operating Reserve Margin Equaled 8/9%
Why Blackout CA with 8+% in Contracted Reserves? O
peration R
eserves R
em
ain
ing
0%
1%
2%
3%
4%
5%
6%
7%
8%
9%
10%
11%
12%
Stage 3 Emergency < 3%
(Rolling Blackouts)
Stage 2 Emergency = 3 - 6%
Stage 1 Emergency = 6 - 10%
Source: Energy Analyst, David Marcus, in New York Times
https://www.nytimes.com/2020/08/16/business/california-blackouts.html#:~:text=Managers%20of%20the%20electric%20system,of%20the%20state's%20peak%20years
Aug 14, 2020, ORM = 8.9%
at time of blackout
On August 14, 2020, CA’s
operating reserve margin
bottomed out at 8.9%,
approximately three times higher
than CAISO’s own standard for
ordering blackouts.

The ISO’s report downplays but admits that “some practices in the day-ahead energy market exacerbated the supply challenges underhighly stressed conditions"
CA ISO Root Cause Analysis, Figure B.23 , Report p. 98. October 6, 2020
Day-ahead bid-in demand below actual:8/14
At peak: Time of net demand peak:
3,3861,792
8/153,4343,219
Peak Net demand pe ak
30,000
25,000
20,000
35,000
40,000
45,000(M
W)
8/14 and 8/15 day -ahead bid -in demand, CAISO forecast, and actual demand
50,000
Actual demand
CAISO forecast of CAISO d emand
Day-ahead bid-in demand

The ISO’s Report Charts the Extraordinary Amount of Power Exports It Allowed During the August Heat Wave. Figure B.25 shows the Total Exports By Category & breakdown of export types from: economical bids, priority (PT), lower priority (LPT) & other export bids. (p. 100)

The ISO Shows Available Supply and Imports on Aug. 13-15 Compared to Exports in Report Figure B.24 (Comparison of Non-RA Cleared Supply vs. Total Exports, p. 100)

Unpacking The Third Cause, Market Flaws
What “Market Practices” “Exacerbated the Supply Challenges”
=Caused Electricity Supply Shortages?

The ISO’s Market Monitor Repeatedly Warned That Lax Market Rules Could Cause Market Power & Electricity Supply Shortages
In 2018 & 2019, the ISO’s Market Monitor warned about potential system-level market power in the ISO’s energy markets and the need to mitigate potential system level market power in the ISO’s energy markets.
Some of the contracts that the ISO uses for reliability fail to provide reliability and cannot reduce or stop “potential system-level market power” – i.e. manipulation.
The Market Monitor warned the ISO that failure to require power owners to offer their power into the ISO market could lead to electricity shortages.
The Monitor has warned that the ISO must require power owners to bid their power into the market when needed, which the ISO has failed to do. CPUC 7/22/19 filing; 2018 Annual Report.

The Market Monitor Warned That Resource Adequacy Capacity-Only Imports Cause Problems & Could Affect Reliability
• The ISO has not “addressed DMM’s concerns that import resource adequacy can receive capacity payments while providing no real benefits in terms of either system reliability or market competiveness.” PUC 6/8/20 RA filing.• “Imports used to meet RA requirements are not subject to any type of bid or price
mitigation. Thus, increased reliance on such capacity-only imports . . . may decrease both system reliability and CAISO market competitiveness.” PUC 7/22/19 RA filing.• RA requirements met by capacity-only imports may be especially problematic from
the perspective of both system reliability and energy market power. 7/22/19 filing. • “DMM has longstanding concerns that existing resource adequacy rules could allow
a significant portion of RA requirements to be met by imports that may have limited availability and value during critical system and market conditions.” 7/22/19 filing; 2018 Annual Report (May 2019).
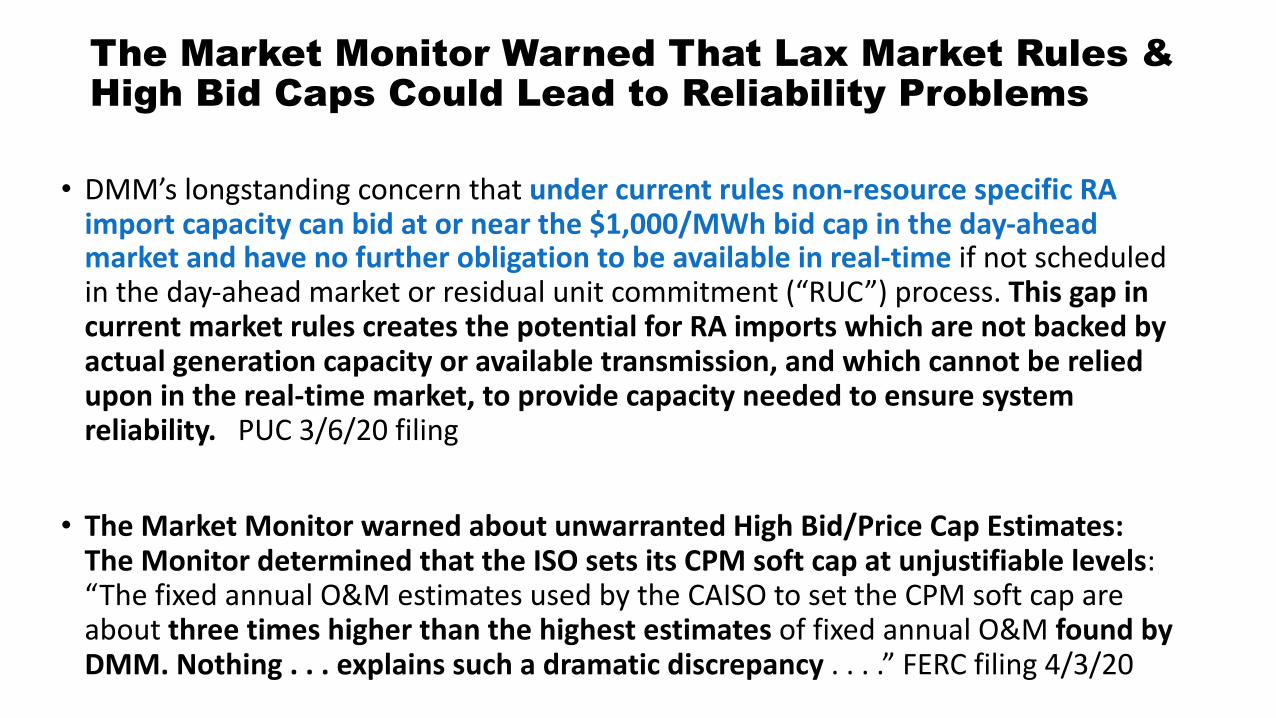
The Market Monitor Warned That Lax Market Rules & High Bid Caps Could Lead to Reliability Problems
• DMM’s longstanding concern that under current rules non-resource specific RA import capacity can bid at or near the $1,000/MWh bid cap in the day-ahead market and have no further obligation to be available in real-time if not scheduled in the day-ahead market or residual unit commitment (“RUC”) process. This gap in current market rules creates the potential for RA imports which are not backed by actual generation capacity or available transmission, and which cannot be relied upon in the real-time market, to provide capacity needed to ensure system reliability. PUC 3/6/20 filing
• The Market Monitor warned about unwarranted High Bid/Price Cap Estimates: The Monitor determined that the ISO sets its CPM soft cap at unjustifiable levels: “The fixed annual O&M estimates used by the CAISO to set the CPM soft cap are about three times higher than the highest estimates of fixed annual O&M found by DMM. Nothing . . . explains such a dramatic discrepancy . . . .” FERC filing 4/3/20

Slide courtesy of Tyson Slocum of Public Citizen

The ISO’s Report Diverts Attention, Blaming Inadequate Supply As The Culprit Instead of Its Own Market Flaws
Blackouts Reveal Lapses In Power SupplyDan Walters, CALMATTERS, Oct. 18, 2020
What caused California’s rolling blackouts? Climate change and poor planning Sammy Roth, Los Angeles Times, Oct. 6, 2020
Climate Change and Poor Planning Blamed for California BlackoutsIvan Penn, NY Times, Oct. 6, 2020

Déjà Vu All Over Again: Inaccurately Claiming a Lack of Supply Politicizes the Facts About CA’s Markets & Obscures the Real Problem
● President Bush and Vice President Dick Cheney rebuffed California’s calls for relief, saying the state was to blame for failing to build enough power plants to meet its growing demand.
June 2002 Wharton School Policy Brief
● In California, Democrats have intentionally implemented rolling blackouts — forcing Americans in the dark. Democrats are unable to keep up with energy demand.
Donald Trump tweet 8/18/20

What the ISO Knew in August 2020
• The ISO Knew That It Allowed Thousands of MWs of Exports During Historic Heat Waves• The ISO Knew That It Had Accurately Projected Summer 2020 Demand, Yet
Accused Others Of Lowballing Demand and RA Supply • The ISO Knew That Its Market Rules Were Lax and Ripe for Market
Manipulation Because Its Own Market Monitor Repeatedly Warned It• The ISO Knew That It Failed to Deploy Operational Measures to Assure
Summer Power Availability: It Allowed Planned Plant Outages & Long Start Units• The ISO Knew That Its Import Capacity Contracts & Bidding Rules Created
Reliability Problems, Yet It Failed to Implement the Market Monitor’s Fixes

Why CA’s Electricity Markets and Grid Operations MatterMarket rules and grid operation choices create real world consequences.
Focusing on making markets and assisting “market participants” upends California’s statutory priorities to manage the grid and electricity markets for California’s electricity consumers, our health & safety, our environment and our economy

Failure to Run the Grid & Electricity Markets = Real Consequences to Real People
Blackouts Cause Public Transport Shutdowns and EmergenciesStranded Commuters Cannot Get HomeDiverts Local Government Resources to Ensuring SafetyTransit Resources Strained & Without Adequate Notice, Can Be Broken, Requiring Expensive Fixes

Failure to Run the Grid & Electricity Markets = Real Consequences for Public Safety & HealthBlackouts Cause Problems for Police, Fire & Hospitals
Traffic Accidents Increased During CA Energy Crisis, Causing Cascading Effects on Lives & PropertyHospitals & Public Safety Providers Must Spend Scarce Funds to Ensure Communication & Operational Functionality During Grid Emergencies

Failure to Run the Grid & Electricity Markets = Real Consequences for CA’s Health, Environment & EconomyBlackouts Cause Food Waste: Spoiled Food Costs Both Businesses & Families
Lack of Air Conditioning and Refrigeration Creates Serious Health & Safety Problems
Californians w/ disabilities face serious health consequences from inability to keep critical medical equipment running

Failure to Run the Grid & Electricity Markets = Real Consequences for CA’s EnvironmentISO’s August Blackouts Led to the State Water Board Reversal of Its 2010 OTC Plant Retirement Order
7 Plants that Refused to Comply With the SWRC Board’s 2010 Order to Retrofit or Retire Were Granted Years of Additional Operations on September 1st
ISO’s Grid Operation Led the Governor to Declare a State of Emergency in Both August & September That Suspended Power Plant Air Pollution Permit Limits

What We Know About What Caused CA’s Blackouts
The ISO allowed thousands of MW to be exported during a historic heat wave. The ISO allows unrestricted exports thru Stage 2s, despite heat waves or high demand.
The ISO’s Preliminary Report admits that the ISO allowed a 400MW plant to be offline for a planned outage in the hottest summer months – without requiring substitute replacement power to be obtained.
The ISO’s Preliminary Report fails to identify all the power plants that were offline on critical days or explain why.
CA Munis did not experience supply problems and did not black out any customers because of lack of supply or transmission constraints.
Neighboring states did not experience supply shortages or even call Flex Alerts.

UNANSWERED QUESTIONS What Californians Deserve To Know
• How could just 2 “offline” plants -- Blythe = 496MW (offline @ 2:57 pm) and Panoche= loss of 248 MW – cause rolling blackouts given the almost 7,000MW already-purchased reserves that should have been available?
• Why didn’t the ISO call on all the resources already purchased for reserve power?
• Why did ISO suspend its convergence bidding market on Aug. 17th & why was that market allowed to restart on Aug.22nd?
• What did the ISO experience that caused it to conclude: “the convergence supply positions may be facilitating demand schedules in the day-ahead market, while the CAISO faced the possibility that it would have to curtail scheduled based on what the system could actually support physically to maintain reliability.” (ISO Stakeholder Q&A published 9/11/2020)
• Why does the ISO allow exports during historic heat waves or during any time of tight supply?
• Did the ISO call on all DR resources that were available?
• What Will All These Grid & Market Choices Cost California’s Businesses & Families?
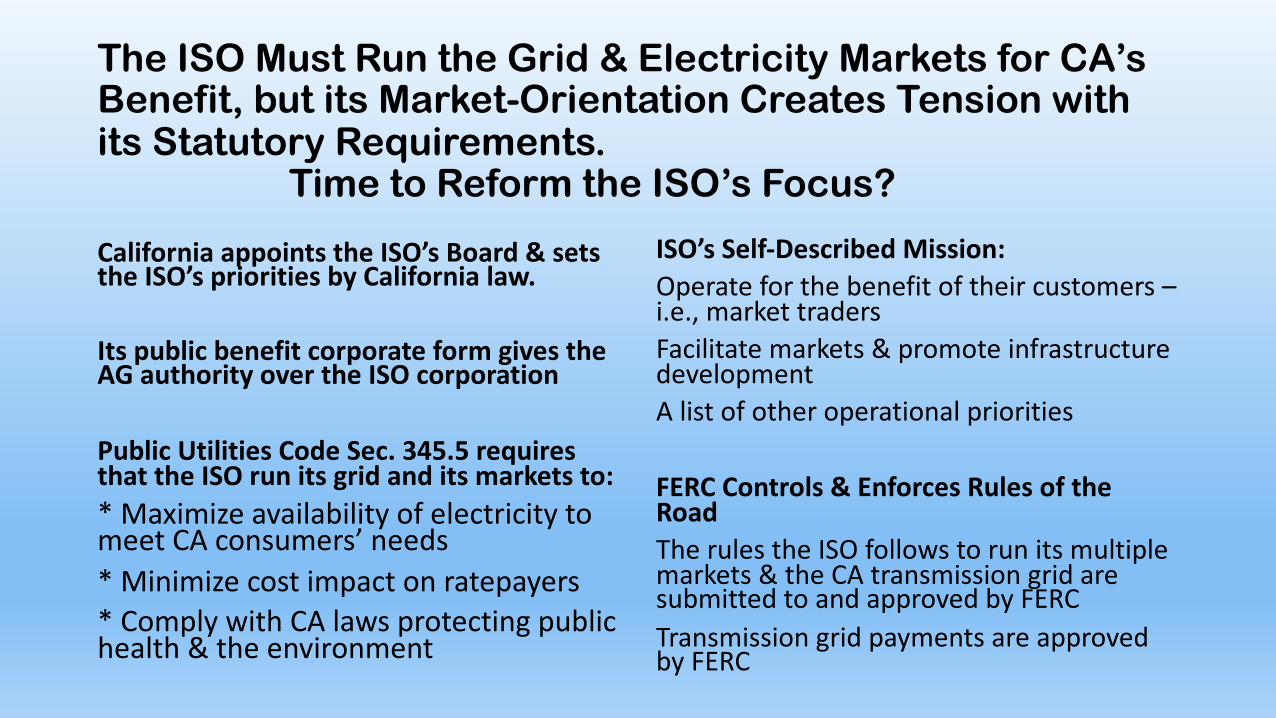
The ISO Must Run the Grid & Electricity Markets for CA’s Benefit, but its Market-Orientation Creates Tension with its Statutory Requirements.
Time to Reform the ISO’s Focus?
California appoints the ISO’s Board & sets the ISO’s priorities by California law.
Its public benefit corporate form gives the AG authority over the ISO corporation
Public Utilities Code Sec. 345.5 requires that the ISO run its grid and its markets to:* Maximize availability of electricity to meet CA consumers’ needs* Minimize cost impact on ratepayers* Comply with CA laws protecting public health & the environment
ISO’s Self-Described Mission: Operate for the benefit of their customers –i.e., market tradersFacilitate markets & promote infrastructure developmentA list of other operational priorities
FERC Controls & Enforces Rules of the RoadThe rules the ISO follows to run its multiple markets & the CA transmission grid are submitted to and approved by FERCTransmission grid payments are approved by FERC