“what’s happening” - texas statewide telephone ... · pdf...
TRANSCRIPT

“What’s Happening” Telecommunications Industry Overview
June 12, 2014

2
Table of ContentsWireline Industry Dynamics
Wireless Industry Update
Discussion of Strategy Approaches
Internet Infrastructure Discussion
Appendix – Maps and Charlesmead Credentials
Telecommunications Industry Overview June 2014

I. Wireline Industry Dynamics
3
Telecommunications Industry Overview June 2014

4
Telecom Trends at a Glance
! Year-over-year (YoY) access line loss has been stable for the last two years
▫ The six public RLECs reported average and median line loss of -4.9% and -5.0% in 1Q14,respectively
▫ Windstream reported notably negative losses of -6.1% while FTR improved from -8.8% in 1Q13 to -3.6% in 1Q14
! Broadband subscribership stable in 1Q14
▫ Average YoY growth improved slightly to 1.2% in 1Q14
▫ Revenue generating units (access lines, HSD, and video subs) continue to decline! Cable is reporting slightly improved RGU growth (1.4% v. 0.7% in 4Q13)
! The RLEC decline was stable in 1Q14 at -2.0%
! YoY revenue change improved to -3.3% in 1Q14 from -5.9% in 4Q13
▫ Weakness reported at the top line for ALSK, CNSL, TDS and WIN
! EBITDA margins remain stable
▫ Median industry EBITDA margin down slightly to 38.1% in 1Q14 from 39.5% in 4Q13
▫ Margins are mixed for 6 rural carriers with 3 improving and 3 declining
June 2014Telecommunications Industry Overview

5
Broadband Data and Video Trends
June 2014Telecommunications Industry Overview
! Market reporting best quarter in 2 years▫ Net adds of 1.2M in 1Q14 vs 800K in 1Q13 ▫ Cable sub growth of 5.8% in 1Q14 vs 7.0% in 1Q13 and 4.8% in 4Q13▫ Telco sub growth of 1.0% in 1Q14 vs 1.6% in 1Q13 and 1.4% in 4Q13▫ Cable continues to increase market share up from 59.2% in 1Q13 to 59.4% in 1Q14▫ Broadband penetration as percentage of occupied households was 70.4% in 1Q14
! Cable continues to take share of DSL, but U-verse broadband is strong ! Relatively stable competitive dynamics in spite of rising prices▫ Strongest customer growth in 2 years
! Cable lost 132K customers, lowest loss since 1Q11
▫ Price increases at major MSOs keeping revenue growth in the single digits (6.1% in 1Q14 v. 3.1% in1Q13) despite subscriber losses
▫ Total video subscribers increased by 203K in 1Q14 despite cable losing 132K subscribers
! Pay TV lost subs for the second consecutive quarter; subscriber growth has fallen sharplysince 4Q09▫ In 1Q14, satellite subs grew by 52K, cable TV subs slipped by 132K and telco subs grew by 283K▫ Video market share: cable 55%, satellite 35%, telco 10%
Broadband Data
Video
Source: UBS Equity Research, and company data

6
Long-Term Broadband Trends
June 2014Telecommunications Industry Overview
! Broadband growth weak but stable
! Recent growth has been driven by fiber-based adds
▫ Broadband growth has slowed since 2010
▫ ILEC data growth has slowed more rapidly than cable; cable offerings more robust
! Cable successfully marketing video and data combinations
! Market share shift towards cable due to cable winning in non-FTTH markets based onsuperior network capabilities
Source: UBS Equity Research, company data
Broadband Subscriber Growth Broadband Market Share
Telco Cable Total Telco Cable1Q102Q103Q104Q101Q112Q113Q114Q111Q122Q123Q124Q121Q132Q133Q134Q131Q141Q10
1Q10
3Q10
3Q10
1Q11
1Q11
3Q11
3Q11
1Q12
1Q12
3Q12
3Q12
1Q13
1Q13
3Q13
3Q13
1Q14
1Q14
00.020.040.060.080
0
0.02
0.02
0.04
0.04
0.06
0.06
0.08
0.08
1Q102Q103Q104Q101Q112Q113Q114Q111Q122Q123Q124Q121Q132Q133Q134Q131Q141Q10
1Q10
3Q10
3Q10
1Q11
1Q11
3Q11
3Q11
1Q12
1Q12
3Q12
3Q12
1Q13
1Q13
3Q13
3Q13
1Q14
1Q14
0.20.40.60.2
0.2
0.4
0.4
0.6
0.6

7
Revenue and EBITDA Trends
June 2014Telecommunications Industry Overview
Year-over-Year Change in Revenue and EBITDA
Cable Index (1) : Revenue EBITDA RLEC Index (2) : Revenue EBITDA
1Q092Q093Q094Q091Q102Q103Q104Q101Q112Q113Q114Q111Q122Q123Q124Q121Q132Q133Q134Q131Q141Q09
1Q09
2Q09
2Q09
3Q09
3Q09
4Q09
4Q09
1Q10
1Q10
2Q10
2Q10
3Q10
3Q10
4Q10
4Q10
1Q11
1Q11
2Q11
2Q11
3Q11
3Q11
4Q11
4Q11
1Q12
1Q12
2Q12
2Q12
3Q12
3Q12
4Q12
4Q12
1Q13
1Q13
2Q13
2Q13
3Q13
3Q13
4Q13
4Q13
1Q14
1Q14
-0.04-0.0200.020.040.060.080.10.12-0.04
-0.04
-0.02
-0.02
0
0
0.02
0.02
0.04
0.04
0.06
0.06
0.08
0.08
0.1
0.1
0.12
0.12
! Trends generally mirror RGUs; cable outperforming
! RLEC revenue and EBITDA trends weakening in2Q2013
Source: Company filings and press releases(1) Cable index is comprised of CVC, CHTR, CMCSA, and TWC.(2) RLEC index is comprised of CTL, CNSL, FTR, and WIN.

8
Regulatory Review – Potential / Probable Outcomes
June 2014Telecommunications Industry Overview
! Reduced or eliminated near-term capital investment
! Proximate reductions in personnel and other operating costs
! Conservation / redirection of cash to survive rather than invest in wireline ops
Operating
! Increased cost of capital driven by operational trends and evolving regulatory rules
! Insufficient recovery, especially on recent fiber investments
! Skepticism on sector from lenders and equity investors
! Consolidation complicated by financial risks and concern over potential bankruptcies;progressive companies taking proactive approaches where feasible
Financial
! Less or no wired broadband deployment in unserved or underserved regions
! Growing urban-rural divide in telecommunications investment and services
! Rural service rates will rise for services that are not comparable to those in urban areas
Customer Service
! USF mechanisms are no longer predictable and sufficient
! COLR becomes problematic if mandates are underfunded
! Services will no longer be comparable in urban and rural regions
Policy

II. Wireless Industry Update
9
Telecommunications Industry Overview June 2014

10
Wireless Industry Update and Trends
Source: Company filings, UBS Equity Research, Bank of America Merrill Lynch Research, and press releases
PrimaryTrends
Subscribers
ARPU andData
Devices
Financials
June 2014Telecommunications Industry Overview
! AT&T & Verizon remain dominant carriers▫ Maintain market shares of 28% and 33%, respectively▫ Sprint holds a 17% share! 4G deployment continues; AT&T and VZW offers LTE to more than 300
million POPs and 500 markets across U.S
! Connection growth rate slowing as penetration exceeds 100%! Incremental penetration driven by growth in connected devices! VZW reports 2.8 connections per account in 1Q14! In 1Q14, industry-wide subscribers increased approximately 4.7% YoY! Approximately 21% of total wireless subs are prepaid
! Increasing demand driving data growth! AT&T ARPU down 1.9% YoY! VZW reports ARPA (per account) up 6.3% to $159.67! ARPU gap increasing between smartphones and features phones! Industry-wide ARPU is flat sequentially
! Smartphones are the devices of choice! AT&T reports 78% of postpaid subs use smartphones! VZW reports 72% of postpaid subs use smartphones! Android and Apple control over 80% of the smartphone market
! AT&T and VZW generate ≈90% of U.S. wireless unlevered FCF! 1Q14 service revenue growth: AT&T at 2.2%; VZW at 7.5%! 1Q14 service EBITDA margin: AT&T at 45.4%; VZW at 52.1%! 1Q14 EBITDA growth: AT&T at 7.3%; VZW at 11.3%
1Q092Q093Q094Q091Q102Q103Q104Q101Q112Q113Q114Q111Q122Q123Q124Q121Q132Q133Q134Q131Q141Q09
1Q09
1Q10
1Q10
1Q11
1Q11
1Q12
1Q12
1Q13
1Q13
1Q14
1Q14
-0.16-0.12-0.08-0.0400.040.080.120.160.2-0.16
-0.16
-0.12
-0.12
-0.08
-0.08
-0.04
-0.04
0
0
0.04
0.04
0.08
0.08
0.12
0.12
0.16
0.16
0.2
0.2
Total Service Revenue Growth
Service ARPU Growth
EBITDA Growth1Q092Q093Q094Q091Q102Q103Q104Q101Q112Q113Q114Q111Q122Q123Q124Q121Q132Q133Q134Q131Q141Q09
1Q09
1Q10
1Q10
1Q11
1Q11
1Q12
1Q12
1Q13
1Q13
1Q14
1Q14
-0.05-0.04-0.03-0.02-0.0100.010.020.030.040.05-0.05
-0.05
-0.04
-0.04
-0.03
-0.03
-0.02
-0.02
-0.01
-0.01
0
0
0.01
0.01
0.02
0.02
0.03
0.03
0.04
0.04
0.05
0.05
1Q092Q093Q094Q091Q102Q103Q104Q101Q112Q113Q114Q111Q122Q123Q124Q121Q132Q133Q134Q131Q141Q09
1Q09
1Q10
1Q10
1Q11
1Q11
1Q12
1Q12
1Q13
1Q13
1Q14
1Q14
-0.4-0.200.20.40.60.8-0.4
-0.4
-0.2
-0.2
0
0
0.2
0.2
0.4
0.4
0.6
0.6
0.8
0.8
Sprint
AT&T
VZW
11
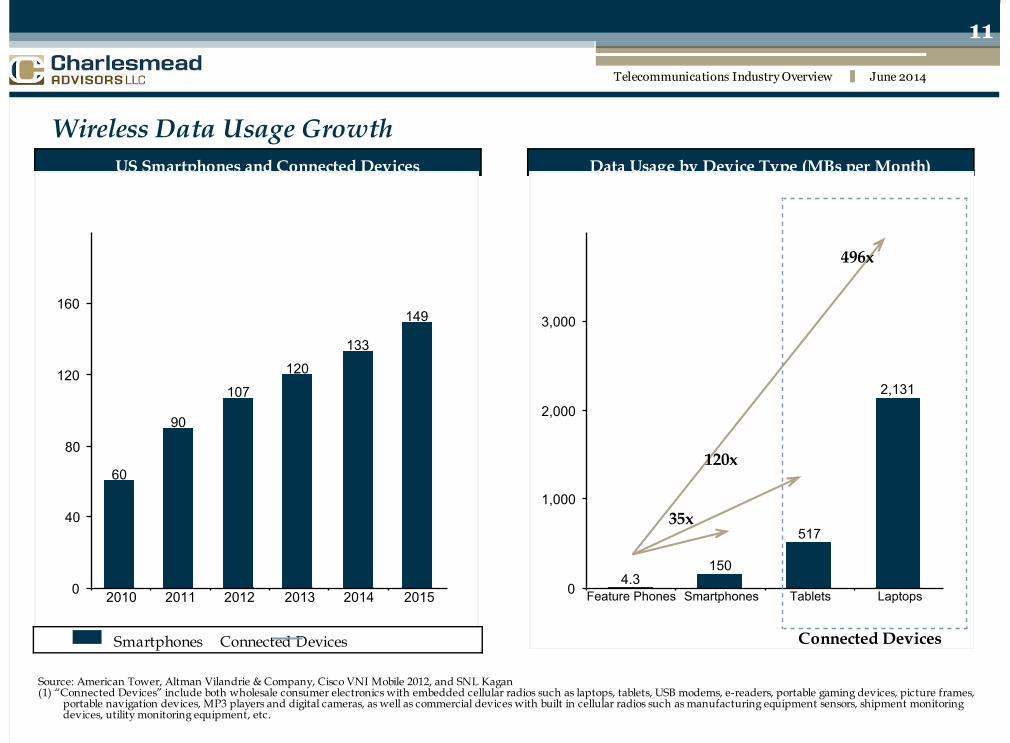
Wireless Data Usage GrowthData Usage by Device Type (MBs per Month)US Smartphones and Connected Devices
Source: American Tower, Altman Vilandrie & Company, Cisco VNI Mobile 2012, and SNL Kagan(1) “Connected Devices” include both wholesale consumer electronics with embedded cellular radios such as laptops, tablets, USB modems, e-readers, portable gaming devices, picture frames,
portable navigation devices, MP3 players and digital cameras, as well as commercial devices with built in cellular radios such as manufacturing equipment sensors, shipment monitoringdevices, utility monitoring equipment, etc.
609010712013314960
60
90
90
107
107
120
120
133
133
149
149
2010201120122013201420152010
2010
2011
2011
2012
2012
2013
2013
2014
2014
2015
2015
040801201602000
0
40
40
80
80
120
120
160
160
4.31505172,1314.3
4.3
150
150
517
517
2,131
2,131
Feature PhonesSmartphonesTabletsLaptopsFeature Phones
Feature Phones
Smartphones
Smartphones
Tablets
Tablets
Laptops
Laptops
01,0002,0003,0004,0000
0
1,000
1,000
2,000
2,000
3,000
3,000
35x
120x
496x
Smartphones Connected Devices
Connected Devices
June 2014Telecommunications Industry Overview

12
Verizon Wireless LTE Deployment
June 2014Telecommunications Industry Overview
Verizon Wireless LTE Coverage! Verizon Wireless’ 4G network is 100% LTE▫ Currently offers more LTE coverage than all other
networks combined, 35% of traffic on LTE at present▫ LTE is available in more than 500 markets, covering
approximately 97% of the U.S. population▫ LTE network has been deployed to over 300 million POPs▫ 4G LTE network covers more than 99 percent of the 3G
network footprint
! Nationwide LTE coverage available by 2014▫ LTE map will look like current 3G map▫ Expects to migrate its entire network to LTE between
2016 and 2018
! Provides network speeds of up to 5-12 Mbps downand 2-5 Mbps up▫ LTE offers customers mobile browsing speeds
comparable to DSL services
Source: Company press releases and website
! “LTE in Rural America” plan enables Verizon to partner with rural wireless carriers and rapidly expand its
LTE network to serve smaller markets▫ 17 LTE partners include: MTA, Bluegrass Cellular, Carolina West, Cellcom, Pioneer Cellular, and Thumb Cellular
! LTE lowers data delivery costs by 75%-80% on a per MB basis versus current 3G EV-DO network! The LTE ecosystem currently contains numerous 30 devices including smartphones, tablets, and dongles! Verizon Wireless estimates that the LTE network requires 10x-20x the backhaul capacity of 3G platforms
▫ EV-DO network traffic is backhauled using 45% fiber, 45% copper, and 10% microwave▫ LTE network utilizes 80% fiber and 20% microwave backhaul

13
AT&T 4G LTE Deployment
June 2014Telecommunications Industry Overview
! AT&T is the only U.S. carrier providing 4G usingboth HSPA+ and LTE technologies▫ 288 million people are covered by AT&T's 4G networks
! 4G LTE network build-out▫ LTE live in ≈500 markets covering ≈280 million POPs▫ AT&T 4G LTE is expected to cover 300 million people by
year-end 2014
! Almost 90 percent of AT&T's mobile data trafficruns over enhanced backhaul that supports bothHSPA+ and 4G LTE data traffic
! AT&T is the nation's largest Wi-Fi provider, withmore than 32,000 domestic Wi-Fi hot spots▫ Wi-Fi hot spots off-load traffic in major cities,
entertainment venues, and key transportation hubs
! AT&T’s mobile broadband traffic has grownrapidly since the introduction of its 3G network▫ Millions of smartphones and connected devices
activated! Invested nearly $100 billion of dollars since 2008 to
expand and upgrade wireless network▫ Purchased 700 MHz spectrum: FCC Auction 73, Aloha
Partners and QUALCOMM, and numerous small deals▫ Laid fiber to cell sites to improve speed and capacity▫ Deployed 1,400 additional cell sites, 30,000 new carriers,
and 200 DAS systems in 2011
AT&T Wireless Coverage Map
Source: Company press releases and website
14
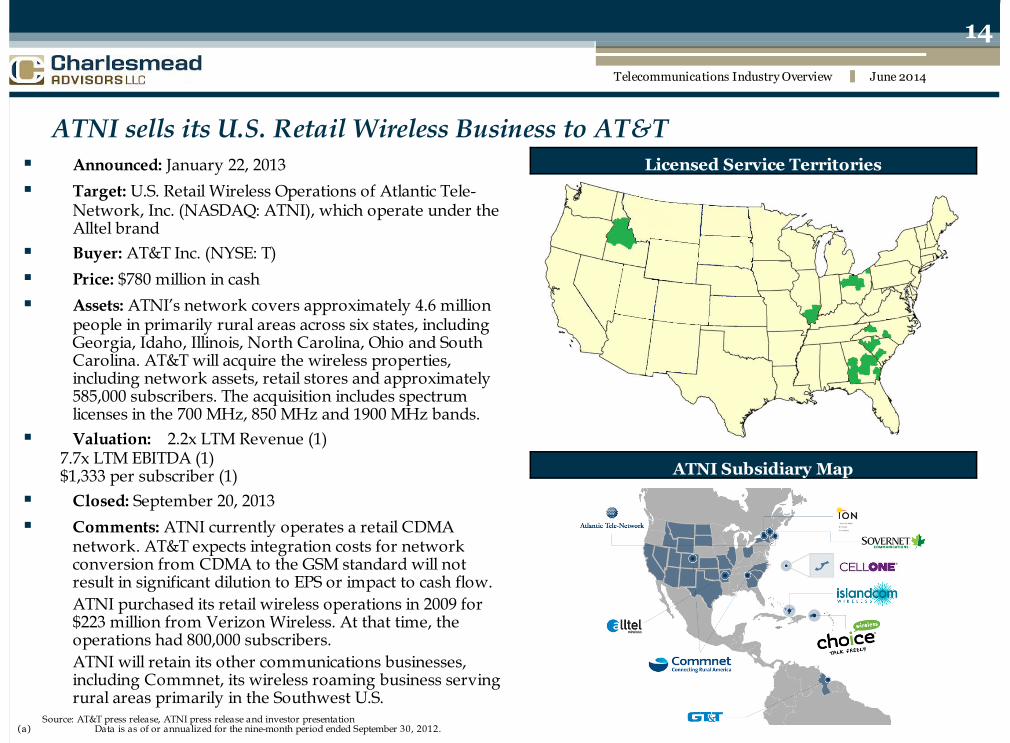
ATNI sells its U.S. Retail Wireless Business to AT&T
June 2014Telecommunications Industry Overview
! Announced: January 22, 2013
! Target: U.S. Retail Wireless Operations of Atlantic Tele-Network, Inc. (NASDAQ: ATNI), which operate under theAlltel brand
! Buyer: AT&T Inc. (NYSE: T)
! Price: $780 million in cash
! Assets: ATNI’s network covers approximately 4.6 millionpeople in primarily rural areas across six states, includingGeorgia, Idaho, Illinois, North Carolina, Ohio and SouthCarolina. AT&T will acquire the wireless properties,including network assets, retail stores and approximately585,000 subscribers. The acquisition includes spectrumlicenses in the 700 MHz, 850 MHz and 1900 MHz bands.
! Valuation: 2.2x LTM Revenue (1) 7.7x LTM EBITDA (1) $1,333 per subscriber (1)
! Closed: September 20, 2013
! Comments: ATNI currently operates a retail CDMAnetwork. AT&T expects integration costs for networkconversion from CDMA to the GSM standard will notresult in significant dilution to EPS or impact to cash flow.ATNI purchased its retail wireless operations in 2009 for$223 million from Verizon Wireless. At that time, theoperations had 800,000 subscribers.ATNI will retain its other communications businesses,including Commnet, its wireless roaming business servingrural areas primarily in the Southwest U.S.
Source: AT&T press release, ATNI press release and investor presentation(a) Data is as of or annualized for the nine-month period ended September 30, 2012.
Licensed Service Territories
ATNI Subsidiary Map

15
Wireless Subscriber Composition
June 2014Telecommunications Industry Overview
Domestic Subscribers: 352 million
Source: Company financials and UBS Research. Data is as of March 31, 2014.
Sales
Sales
Other

III. Discussion of Strategy Approaches
16
Telecommunications Industry Overview June 2014

17
Telecommunications Industry Overview
June 2014Telecommunications Industry Overview
! Additional broadband penetration
! Organic CLEC & business-focused opportunities
! Wholesale fiber transport
! Hosted and managed services
! Acquisitions
▫ CLEC
▫ Fiber
▫ Hosted and managed services
▫ ILEC
Opportunities! Regulatory reforms ongoing
! Continued cable competition
! Continued wireless voice substitution
! Increasing costs of capital
! Decreasing credit availability
! Wireless data substitution
Challenges

18
Illustrative Strategic Commitment Based on Valuation Focus
June 2014Telecommunications Industry Overview
! Illustration focuses on strategic issues▫ Purpose is to understand the drivers and impact on business valuations
! No change in growth rates or valuation multiples! Current business mix that includes initially smaller growth initiatives
! Voice and broadband services account for 65% of revenue
! In seven years a voice/broadband only ILEC would:▫ Suffer a total loss of EBITDA in the voice/broadband business of 14.5% by Year 7 (at fixed
margins)! (30.2%) loss of voice services EBITDA! 14.9% increase in broadband EBITDA
! Note: The illustrative ILEC currently owns strategic businesses (FTTT, fiber transport anddata center) as presented above and further analyzed on the next slide
% of Year 0 Revenue Annual Rev. Growth EBITDA Margin EBITDA % of Total Rev. EBITDA Multiple
Voice Services 40.0% -5.0% 35.0% 14.0% 5.0xBroadband 25.0% 2.0% 30.0% 7.5% 6.0xFiber-to-the-Tower 10.0% 10.0% 70.0% 7.0% 6.5xFiber Transport 10.0% 10.0% 60.0% 6.0% 7.0xData Center 15.0% 15.0% 37.0% 5.6% 11.0x

19
Illustrative Valuation: Combining ILEC Cash Flows with Growth Initiatives
June 2014Telecommunications Industry Overview
! Illustration uses the assumptions from the previous slide and highlights the importance ofinvesting in growth through value-creating initiatives
! Value is created through EBITDA (proxy for cash-flow) growth▫ Can be enhanced on an interim basis through synergistic acquisitions (cost, capex, revenues)▫ Can also be achieved, in the short-run, through increased efficiencies
! Illustrative valuation results▫ Company valuation rises by 65% in Year 7 in spite of contraction in voice/broadband value
! CAGR is 7.4% and is accelerating as growth businesses expand
! Challenge is to identify and execute on a strategic vision
Yr 0Yr 1Yr 2Yr 3Yr 4Yr 5Yr 6Yr 7Yr 0Yr 0
Yr 1Yr 1
Yr 2Yr 2
Yr 3Yr 3
Yr 4Yr 4
Yr 5Yr 5
Yr 6Yr 6
Yr 7Yr 7
010020030040050000
100
100
200
200
300
300
400
400
Illustrative ValuationIllustrative Valuation
Illustrative Valuation65% Growth: 7.4% CAGR
ILEC (Voice) Broadband Fiber-to-the-Tower Fiber Transport Data CenterSales
Sales
Valuation Year 7 ($434m)Valuation Year 7 ($434m)
Valuation Year 7 ($434m)
Sales
Sales
Valuation Year 0 ($264m)Valuation Year 0 ($264m)
Valuation Year 0 ($264m)

20
ILEC Strategic Approaches
June 2014Telecommunications Industry Overview
! ILECs are pursuing strategic approaches that reduce reliance on support and voicerevenues
! Mergers and acquisitions are valuable tools in executing on these strategies
! Pure-play ILEC transactions appear to be important but transitional strategic steps
! Common transaction criteria within the industry include▫ Focus on sustainable data-centric services▫ Attractive markets (competition, geographic proximity, demographics, etc.)▫ Meaningful synergy / cost saving opportunities (ability to integrate and operate efficiently)▫ Strong growth and/or diversification potential (enhanced focus on faster growth segments—
broadband, business, IT services, fiber transport, Internet infrastructure, etc.)▫ High-quality, well-positioned network▫ Reasonable price relative to strategic value (cash flow accretive?)▫ Positive impact on overall financial position (manageable leverage levels, enhanced operating profile
and results)
! Increase scope and scale ofILEC operations throughM&A
! Rationalize cost structuresover a larger revenue base
Increase Scope & Scale ! Reduce regulatory exposure! Geographic diversification! Expand network assets and
business lines-CLEC & fiber! Enter business services-data
centers, managed services,cloud services
Diversification ! Grow ILEC scope and scale! Simultaneously pursue
business diversification
Hybrid

21
Overview of Strategic Approaches
June 2014Telecommunications Industry Overview
Increase Scope & Scale Focus on Diversification Hybrid – Increase Scale &Diversify
Hybrid – Increase Scale &Diversify
Example Frontier Windstream CenturyLink Consolidated
NotableInitiatives /Acquisitions
• Verizon 14-stateoperations
• Commonwealth• Southern New England
Telephone (from AT&T)
• PAETEC• Hosted Solutions• Q-Comm• NuVox• Iowa Telecom
• Savvis• Qwest• Embarq
• SureWest• North Pittsburgh• Emphasis on high-
bandwidth services, IPTVwith HD/DVR and bundling
Pros
• Synergies / scale• Reduced regulated revenue• Potential to grow
broadband in underservedareas
• Better position for futureacquisitions and competition
• Synergies / scale• De-emphasize regulatory
rev• Increase exposure to
business revenue• Grow business service
offerings• Reduce residential and
voice
• Synergies / scale• Reduced regulatory
revenue• Potential to grow
broadband• Diversification thru Qwest
long-haul network• Data center / managed
services exposure
• Synergies / scale• Fewer transactional risks• Bundles with video & HSD
driving low line losses (~4%)• Focus on core reduces
business risk• More attractive target
Cons
• Integration challenges• Execution risk• Dependence on legacy telco• Regulatory conditions
• Integration challenges• Execution risk• Greater cyclicality• More competitive
• Integration challenges• Execution risk• Legacy telco operations
remain primary business• Regulatory conditions
• Limited growth prospects• More exposure to
regulated revenue• Reliance on legacy telco
Resultsto Date
• 2Q11 increased synergyguidance to $600m from$550m
• Systems conversions: WVdone, integration completed3/2012
• Broadband investmentahead of targets
• Leading HSD penetration• Leading (lowest) line
losses• ILEC best positioned for
top-line growth• 70% of revenue from
business and broadband• 95,500 CLEC bus. cust.• >30,000 fiber route miles
• CTL/Q legacy businessdeclining; CTL systems couldmitigate
• Slowing access line losses• Enterprise growth• Annual synergies of
$450m million earlier thananticipated
• Synergy guidanceincreased
• IPTV build pressuringmargins
• IPTV penetration > 15%;>25% in some markets
• Concern about reformimpacts; reg rev trend lower
• Viewed as an acquisitiontarget

22
EATEL Acquires Venyu and Vision Communications
June 2014Telecommunications Industry Overview
EATEL Pro Forma Service Territory
EATEL MarketsVision MarketsVenyu Facilities
Legend
`
! Announced/Closed: August 31, 2013
! Assets: Venyu is a national provider of data center, managedhosting, cloud, virtualization, and data protection solutions.Venyu has been a pioneer in offsite backup and was one of thefirst service providers in the country to leverage virtualizationfor disaster recovery. Founded in 1989 and headquartered inBaton Rouge, Venyu has approximately 75 employees andoperates three data center facilities. In 2011, Venyu built astate-of-the-art 10,000 sq. ft. data center within Bossier City’sCyber Innovation Center. The company will become a whollyowned subsidiary of EATEL and maintain its headquarters,data center locations, existing service offerings, staff and thesenior management team.
! Transaction Comments: EATEL, founded in 1935, is aleading regional telecommunications service provider.EATEL was one of the first companies in the country to builda 100% fiber network to provide customers a broad array ofintegrated digital services including TV, Internet, and phone.EATEL also owns Sunshine Media, a leading regional yellowpages service provider. The acquisitions enable EATEL toexpand and diversify its service territory throughout theState of Louisiana, as well as the surrounding states.
Charlesmead Advisors, LLC served as exclusive financial advisor to EATEL in these transactions.
Venyu Solutions
! Announced/Closed: September 20, 2011/January 5, 2012
! Assets: Founded in 1945, Vision provides a broad array ofadvanced telecommunications services including digital cableTV, high-speed Internet access, local and long distance voice,and commercial data services. Headquartered in Larose,Louisiana, Vision serves residential and commercial customersthroughout central and southern Lafourche and southernJefferson Parishes. Vision served approximately 9,850 accesslines at announcement.
Vision Communications

23
Selected Recent ILEC M&A Activity
June 2014Telecommunications Industry Overview
! Consolidation continues—increasing competition, regulatory reforms, synergistic benefits! Operating focus of acquirers remains on broadband, scale and cost savings, free cash flow
growth and diversification! Valuations are impacted by increasing competition, fundamentals and regulatory risk! Expect consolidation among smaller carriers to accelerate in the wake of Federal reforms! Selected recent acquisitions are detailed below
Source: Company press releases, filings, and Charlesmead analysis
Transaction Acquired Transaction Value /Announced Target / Seller State(s) Acquiror Value ($ mil) Access Lines LTM Revenue LTM EBITDA Access Line
12/17/13 AT&T Connecticut Connecticut Frontier Communications $ 2,000.0 900,000 1.6x 5.9x $ 2,222 11/28/12 FairPoint Communications Idaho Idaho Blackfoot Communications 30.0 5,400 3.8x 6.0x 5,556 9/25/12 Millington Telephone Company Tennessee Ritter Communications NA 20,000 NA NA NA 2/6/12 SureWest Communications California / Kansas Consolidated Communications 538.0 146,000 2.2x 6.3x 3,685
9/20/11 Vision Communications Louisiana EATEL NA 9,850 NA NA NA 4/4/11 Shoreham Telephone Company Vermont Otelco 4.5 4,975 1.9x NA 905
4/22/10 Qwest Communications National CenturyLink 22,400.0 10,266,000 1.8x 5.1x 2,182 11/24/09 Iowa Telecommunications Services Iowa, Minnesota Windstream Corporation 1,100.0 214,000 4.1x 8.7x 5,140
9/8/09 Lexcom, Inc. North Carolina Windstream Corporation 141.0 23,000 3.2x 5.9x 6,130 5/13/09 Verizon (14 States) National Frontier Communications 8,600.0 4,800,000 2.0x 4.5x 1,792 5/11/09 D&E Communications Pennsylvania Windstream Corporation 330.0 165,000 2.2x 5.2x 2,000
11/21/08 Sherburne Tele-Systems, Inc. Minnesota Iowa Telecommunications 80.6 15,700 2.6x 6.9x 5,134 10/27/08 Embarq Corporation National CenturyTel 11,600.0 5,853,000 2.0x 4.5x 1,982
8/7/08 Country Road Communications Maine, Massachusetts,West Virginia
Otelco 101.3 29,000 NA 7.0x 3,494
2/7/08 Bishop Communications Corporation Minnesota Iowa Telecommunications 43.9 17,100 2.3x 7.6x 2,567
Summary Statistics
Maximum 4.1x 8.7x $ 6,130 Mean 2.5x 6.1x 3,291 Median 2.2x 6.0x 2,567 Minimum 1.6x 4.5x 905

24
ILEC M&A Valuations
June 2014Telecommunications Industry Overview
Purchase Price as a Multiple of LTM EBITDA
Source: Company press releases and filings(1) Windstream / Iowa transaction value includes the value of Iowa’s net operating loss carry-forwards (multiple would have been lower without NOLs).
20,00040,00060,00020,000
20,000
40,000
40,000
0481216200
0
4
4
8
8
12
12
16
16
20
20
2006 2007 2008 2009 2010 2011 2012 2013
HAC /Hector
8.6x
CZN /CTCO6.7x FRP /
VZ (NNE)6.3x
Hanson /TSC7.8x
WIN /CT Comm.
10.1x
Iowa /Bishop
7.6x Iowa /Sherburne
6.9x
FTR /VZ (14 States)
4.5x
WIN /Lexcom
5.9x
FRP /Germantown
6.8x
CNSL /NPSI7.6x
Knology /Graceba
7.5x
CTL /Embarq
4.5x
WIN /D&E5.2x
WIN /Iowa (1)
7.7x
CTL /Qwest
5.1x
GCI/United
8.8x
CNSL /SureWest
6.3x
CTL /Madison River
8.4x
Blackfoot /FairPoint
6.0x
Frontier /AT&T Conn.
5.9x

25
The Power of Synergies
June 2014Telecommunications Industry Overview
Information Technology and Systems
Back Office Support
Public Company Expenses
Potential Synergies
Executive Expenses
Revenue Synergies
Transport Synergies
Source: Company presentations, press releases, and filings
Acquiror TargetSynergies
(% ofRevenue)
EV / EBITDA
Pre-Synergy Post-Synergy
16.0% 5.9x 4.8x
14.2% 6.3x 4.8x
5.8% 5.1x 4.5x
12.7% 8.7x 6.8x
11.3% 5.9x 4.9x
7.6% 4.5x 3.4x
16.9% 5.2x 3.7x
7.6% 4.5x 3.8x
6.9% 7.6x 6.6x
8.7% 8.4x 7.2x
13.6% 7.0x 5.5x
16.7% 10.1x 6.7x
Mean 11.5% 6.6x 5.2x

26
Blackfoot Telecommunications Acquires FairPoint Idaho
June 2014Telecommunications Industry Overview
! Announced: November 28, 2012
! Target: FairPoint Communications’ Idaho operations, FremontTelcom and Fretel Communications (“FairPoint Idaho”)
! Buyer: Blackfoot Telecommunications Group (“Blackfoot”)
! Price: $30 million in cash
! Assets: FairPoint Idaho’s competitive and incumbentproperties serve approximately 5,400 business and residentialcustomers in eastern Idaho. On an annualized basis, theproperties contribute approximately $8 million in revenue andapproximately $5 million in EBITDA, with capitalexpenditures of approximately $1 million. FairPoint Idaho alsoowns a minority investment in Syringa Networks, LLC, aregional fiber transport business.
! Valuation: Approximately 6.0x annualized EBITDA
! Closed: January 31, 2013
! Comments: Based in Missoula, Montana, Blackfoot is acooperatively-owned telecommunications company thatdelivers voice, data, IT, and security solutions to more than20,000 business and residential customers throughoutMontana and Idaho. Blackfoot's fiber optic network covers6,500 square-miles in western Montana. Eleven FairPoint Idahoemployees will join Blackfoot at the transaction closing.
The transaction follows other recent acquisitions by Blackfoot. Inearly 2012, Blackfoot purchased Modwest, a Missoula-basedweb-hosting company. Blackfoot recently announced thepending acquisition of Cutthroat Communications, a providerof wireless and fiber optic services.
Charlesmead Advisors, LLC served as exclusive financialadvisor to FairPoint Communications in this transaction.Source: FairPoint Communications and Blackfoot press releases
FairPoint Idaho Service Territory Map
Pocatello
American
Falls
Blackfoot
ShelleyIdahoFalls
Rexburg
Rigby
Monteview
Dubois
St. Anthony
Ashton
IslandPark
WestYellowstone
Wyoming
Idaho
Montana
``
``
`
Jackson
Fremont Service TerritoryFretel MarketsInterstate HighwaysCity Name
Legend

27
Ritter Communications Acquires Millington Telephone Co.
June 2014Telecommunications Industry Overview
! Announced: September 25, 2012
! Target: Millington Telephone Company, Inc. and MillingtonCATV, Inc. (collectively “Millington”)
! Buyer: Ritter Communications Holdings, Inc. (“RitterCommunications”)
! Price: Not disclosed
! Assets: Founded in 1928, Millington is a full servicecommunications company offering voice, data, and otherservices for residential and business customers. The companyserves portions of four counties in west Tennessee, includingTipton County, which is one of the fastest growing areas in thestate. Millington serves approximately 20,000 customers.
! Valuation: Not disclosed
! Closed: December 11, 2012
! Comments: Ritter serves 25,000 residential and businesscustomers in more than 45 communities in Arkansas with high-speed Internet, phone services and cable TV.
The Millington transaction follows other recent acquisitions andexpansions by Ritter. In 2005, Ritter acquired regional cable TVproperties adjoining and overlapping its northeast Arkansasservice area from Cebridge. Ritter purchased CableTel in nearbyBlytheville, Arkansas in 2008, and acquired the retail divisionof Optus, Inc. in Jonesboro in 2010.
Charlesmead Advisors, LLC served as exclusive financialadvisor to Ritter Communications in this transaction.
Source: Ritter Communications press release
Combined Service Territory Map
Fayetteville
Fort Smith
Little Rock
Hot Springs
MemphisSomerville
Brownsville
BlythevilleJonesboro
MarkedTree
MountainHome
Millington
Ritter Counties ServedRitter Fiber NetworkMillington Service TerritoryInterstate Highways
Legend

28
Frontier to Acquire AT&T Connecticut
June 2014Telecommunications Industry Overview
! Announced: December 17, 2013
! Target: AT&T’s wireline business in the State of Connecticut(“AT&T Connecticut”)
! Buyer: Frontier Communications Corporation (“Frontier”)
! Price: $2.0 billion in cash
! Assets: AT&T Connecticut’s local wireline business servingresidential, business, and carrier/wholesale customers.Business includes residential high-speed broadband service,voice service, and video service as well as businesscommunications services, including broadband, Internet, andvoice services, as well as wholesale services to other carriers.AT&T Connecticut offers 96% broadband and 42% U-versecoverage.
The operations serve more than 900,000 voice connections,400,000 broadband connections, and approximately 180,000U-verse video connections
! Valuation: 1.6x 2014E Revenue (1) 5.9x 2014E EBITDA (2) 4.8x 2014E Pro Forma Day 1 EBITDA (3)
! Expected Close: 4Q 2014
! Comments: This acquisition enhances shareholder value byincreasing free cash flow per share and lowering the dividendpayout ratio in the first full year after closing (after synergies).AT&T Connecticut also provide significant scale for Frontier byadding 1.4 million households as well as significant revenueand cash flow. Frontier expects to generate run-rate synergiesof $200 million after $250 million of integration costs. Frontierwill perform a flash cut conversion of the AT&T Connecticutsystems after closing.Source: Frontier Communications
(a) 2014E Revenue of $1,251 million.(b) 2014E EBITDA of $338 million.(c) 2014E Pro Forma Day 1 EBITDA of $413 million. Excludes certain AT&T allocated costs not transferring to Frontier.
Frontier Pro Forma Northeast Map
29
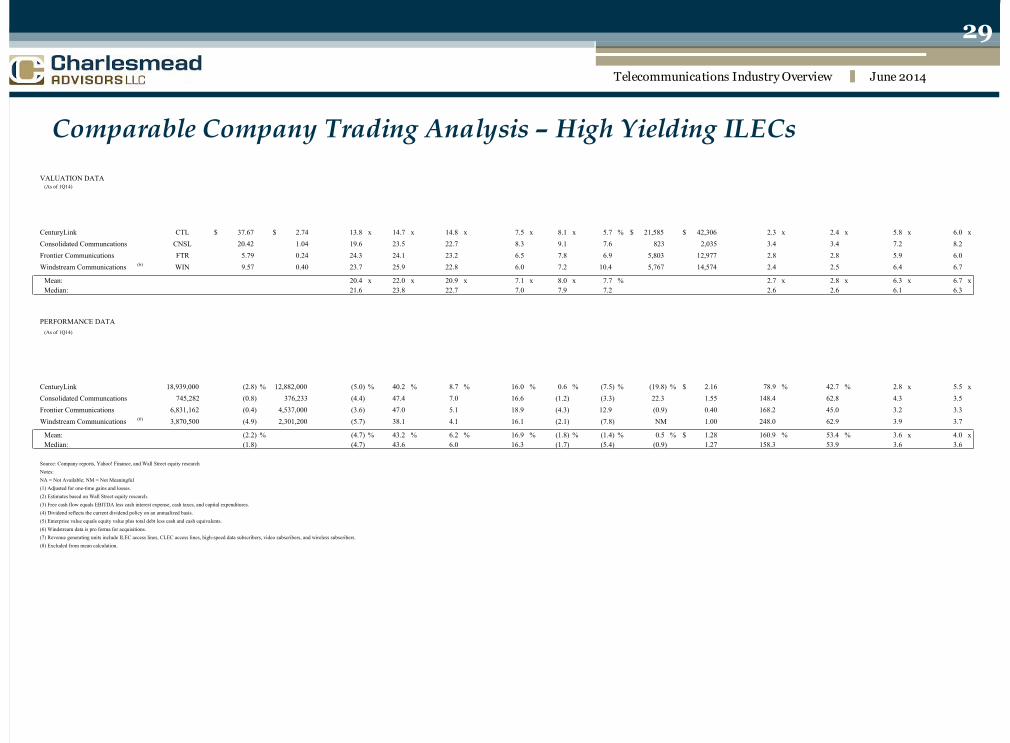
Comparable Company Trading Analysis – High Yielding ILECs
June 2014Telecommunications Industry Overview
VALUATION DATA(As of 1Q14)
Price LTM Price / EPS (2) Price/Free Cash Flow (2)(3) Dividend Equity Enterprise EV as a Multiple of Revenue EV as a Multiple of EBITDACompany Ticker 5/30/14 EPS (1) LTM 2014E 2015E LTM 2014E Yield (4) Value Value (5) LTM 2014E (2) LTM 2014E (2)
CenturyLink CTL 37.67$ 2.74$ 13.8 x 14.7 x 14.8 x 7.5 x 8.1 x 5.7 % 21,585$ 42,306$ 2.3 x 2.4 x 5.8 x 6.0 xConsolidated Communcations CNSL 20.42 1.04 19.6 23.5 22.7 8.3 9.1 7.6 823 2,035 3.4 3.4 7.2 8.2 Frontier Communications FTR 5.79 0.24 24.3 24.1 23.2 6.5 7.8 6.9 5,803 12,977 2.8 2.8 5.9 6.0 Windstream Communications (6) WIN 9.57 0.40 23.7 25.9 22.8 6.0 7.2 10.4 5,767 14,574 2.4 2.5 6.4 6.7
Mean: 20.4 x 22.0 x 20.9 x 7.1 x 8.0 x 7.7 % 2.7 x 2.8 x 6.3 x 6.7 xMedian: 21.6 23.8 22.7 7.0 7.9 7.2 2.6 2.6 6.1 6.3
PERFORMANCE DATA(As of 1Q14)
Leverage RatiosRevenue Generating Units (7) Access Line Data LTM Margins 1Q13 - 1Q14 Growth Current Dividend Payout as % of LTM Net Debt / EBITDA /
Company Total LTM Growth Total LTM Growth EBITDA Net Income Free Cash Flow Revenue EBITDA Net Income Dividend (4) Net Income Free Cash Flow EBITDA Int. Expense
CenturyLink 18,939,000 (2.8) % 12,882,000 (5.0) % 40.2 % 8.7 % 16.0 % 0.6 % (7.5) % (19.8) % 2.16$ 78.9 % 42.7 % 2.8 x 5.5 xConsolidated Communcations 745,282 (0.8) 376,233 (4.4) 47.4 7.0 16.6 (1.2) (3.3) 22.3 1.55 148.4 62.8 4.3 3.5 Frontier Communications 6,831,162 (0.4) 4,537,000 (3.6) 47.0 5.1 18.9 (4.3) 12.9 (0.9) 0.40 168.2 45.0 3.2 3.3 Windstream Communications (6) 3,870,500 (4.9) 2,301,200 (5.7) 38.1 4.1 16.1 (2.1) (7.8) NM 1.00 248.0 62.9 3.9 3.7
Mean: (2.2) % (4.7) % 43.2 % 6.2 % 16.9 % (1.8) % (1.4) % 0.5 % 1.28$ 160.9 % 53.4 % 3.6 x 4.0 xMedian: (1.8) (4.7) 43.6 6.0 16.3 (1.7) (5.4) (0.9) 1.27 158.3 53.9 3.6 3.6
Source: Company reports, Yahoo! Finance, and Wall Street equity researchNotes:NA = Not Available; NM = Not Meaningful(1) Adjusted for one-time gains and losses.(2) Estimates based on Wall Street equity research.(3) Free cash flow equals EBITDA less cash interest expense, cash taxes, and capital expenditures.(4) Dividend reflects the current dividend policy on an annualized basis.(5) Enterprise value equals equity value plus total debt less cash and cash equivalents.(6) Windstream data is pro forma for acquisitions.(7) Revenue generating units include ILEC access lines, CLEC access lines, high-speed data subscribers, video subscribers, and wireless subscribers.(8) Excluded from mean calculation.

30
Comparable Company Trading Analysis – Pure Play ILECs
June 2014Telecommunications Industry Overview
VALUATION DATA(As of 1Q14)
Price LTM Price / EPS (2) Price/Free Cash Flow (2)(3) Dividend Equity Enterprise EV as a Multiple of Revenue EV as a Multiple of EBITDACompany Ticker 5/30/14 EPS (1) LTM 2014E 2015E LTM 2014E Yield (4) Value Value (5) LTM 2014E (2) LTM 2014E (2)
Alaska Communications ALSK 1.80$ 0.60$ 3.0 x 180.0 x 36.0 x 6.0 x NA x 0.0 % 89$ 501$ 1.5 x 1.6 x 5.1 x 5.7 xAlteva (Warwick Valley) ALTV 7.05 NM NM NA NA 4.1 NA 15.3 43 54 1.8 NA 5.2 NAEnventis Corporation ENVE 13.66 0.61 22.4 NA NA 19.3 NA 4.4 187 309 1.7 NA 6.4 NAFairPoint FRP 14.10 NM NM NM NM 6.9 NA 0.0 376 1,267 1.4 1.3 4.8 5.0 Hawaiian Telcom HCOM 27.93 1.77 15.7 NA NA 19.6 NA 0.0 316 574 1.5 NA 4.8 NALumos Networks LMOS 15.08 0.69 21.7 20.4 18.0 42.2 52.0 3.7 341 671 3.3 3.3 7.1 7.1 New Ulm Telecom NULM 7.12 0.60 11.8 NA NA 7.2 NA 4.6 36 77 2.0 NA 5.2 NAOtelco (7) OTEL 4.95 0.50 9.8 NA NA 1.1 NM 0.0 15 132 1.7 NA 4.3 NA
Mean: 14.1 x 100.2 x 27.0 x 13.3 x 52.0 x 3.5 % 1.8 x 2.1 x 5.4 x 5.9 xMedian: 13.8 100.2 27.0 7.1 52.0 1.9 1.7 1.6 5.1 5.7
PERFORMANCE DATA(As of 1Q14)
Leverage RatiosRevenue Generating Units (6) Access Line Data LTM Margins 1Q13 - 1Q14 Growth Current Dividend Payout as % of LTM Net Debt / EBITDA /
Company Total LTM Growth Total LTM Growth EBITDA Net Income Free Cash Flow Revenue EBITDA Net Income Dividend (4) Net Income Free Cash Flow EBITDA Int. Expense
Alaska Communications 294,753 (3.4) % 128,006 (5.0) % 29.3 % 8.8 % 4.4 % (14.0) % (26.2) % NM % 0.00$ NM % NM % 4.2 x 2.5 xAlteva (Warwick Valley) 12,208 (8.0) 12,208 (8.0) 35.2 0.1 35.3 (2.8) NM NM 1.08 NM NM NM NMEnventis Corporation 72,021 (1.3) 39,055 (6.5) 26.1 4.5 5.3 (9.3) 5.0 3.4 0.60 98.3 NM 2.5 10.8 FairPoint 1,195,764 (4.9) 864,226 (6.8) 28.4 (8.4) 5.8 (2.1) 0.5 NM 0.00 NM NM 3.4 3.3 Hawaiian Telcom 510,725 (2.0) 378,650 (5.4) 30.5 5.1 4.1 1.2 (0.4) (0.9) 0.00 NM NM 2.1 6.8 Lumos Networks 125,894 (10.7) 120,821 (11.4) 45.9 7.7 3.9 (4.7) (8.6) (36.9) 0.56 80.7 156.7 3.5 6.3 New Ulm Telecom 53,522 (2.2) 28,432 (4.8) 37.5 7.8 12.8 6.0 (10) 6.2 (10) (16.4) 0.33 54.8 33.3 2.8 14.1 Otelco (7) 95,015 (11.4) 61,763 (15.2) 39.8 2.0 18.7 (10.5) (10) (14.3) (10) NM 0.00 NM NM 3.8 3.2
Mean: (5.5) % (7.9) % 34.1 % 3.4 % 11.3 % (5.3) % (5.9) % (12.7) % 0.32$ 77.9 % 95.0 % 3.2 x 6.7 xMedian: (4.1) (6.6) 32.9 4.8 5.5 (3.7) (0.4) (8.7) 0.17 80.7 95.0 3.4 6.3
Source: Company reports, Yahoo! Finance, and Wall Street equity researchNotes:NA = Not Available; NM = Not Meaningful(1) Adjusted for one-time gains and losses.(2) Estimates based on Wall Street equity research.(3) Free cash flow equals EBITDA less cash interest expense, cash taxes, and capital expenditures.(4) Dividend reflects the current dividend policy on an annualized basis.(5) Enterprise value equals equity value plus total debt less cash and cash equivalents.(6) Revenue generating units include ILEC access lines, CLEC access lines, high-speed data subscribers, video subscribers, and wireless subscribers.(7) Otelco data is pro forma for the company's emergence from bankruptcy.(8) Excluded from mean calculation.

IV. Internet Infrastructure Discussion
31
Telecommunications Industry Overview June 2014

32
Growth Drivers
June 2014Telecommunications Industry Overview
Rapid growth in cloud computing, M2M communications, mobile data, Internet video,e-commerce, and collaboration will drive a 44-fold increase in Internet traffic by 2020 (1)Data
Increasing dependency on IT across all enterprise functions and utilization of automatedsolutions for business processesDependency
Growing complexity of IT integration, management of rapidly evolving environment, andutilization of technology as competitive advantageComplexity
Growing pool of regulatory requirements (FINRA, HIPPA, SOX)Compliance
Shrinking IT budgets in uncertain economy and pressure to reduce capital expendituresEconomy
(1) IDC estimate.

33
Supply and Demand Characteristics
June 2014Telecommunications Industry Overview
! The Internet Infrastructure sector exhibits strongdemonstrated and forecasted demand-driven growth
▫ Rapid growth in digital information traffic driven by theemergence of IPTV, e-commerce, and high-qualitystreaming video and music
▫ Tier1 Research estimates that demand increased 15%during 2013
▫ Tier1 Research forecasts average annual demand growth of15% over the coming years
! Demand is also driven by the increased importanceof mission-critical facilities and secure digital datastorage
▫ Increased digital record retention driven by regulation suchas the Sarbanes-Oxley Act
▫ Hosting offers appreciably higher uptime compared to in-house solutions
! Supply is constrained due to significant barriers toentry
▫ Development of new data center properties requiressignificant investments of time and capital
! Most data center development projects take more thanone year to complete
! Runway allows established players to identify newcompetition and develop a strategic plan
▫ High switching costs help keep churn rates low
Source: Tier1 Research and IDC
0.140.060.130.050.150.050.160.050.170.070.150.090.14
0.14
0.06
0.06
0.13
0.13
0.05
0.05
0.15
0.15
0.05
0.05
0.16
0.16
0.05
0.05
0.17
0.17
0.07
0.07
0.15
0.15
0.09
0.09
20082009201020112012201320082008
20092009
20102010
20112011
20122012
20132013
00.040.080.120.160.20.240
0
0.04
0.04
0.08
0.08
0.12
0.12
0.16
0.16
0.2
0.2
Demand Supply
Global Data Center Supply and Demand Growth
SaaS(Software as a Service)
28% CAGR ($1.9B)
PaaS(Platform as a Service)
38% CAGR ($2.2B)
IaaS(Infrastructure as a Service)
35% CAGR ($4.0B)
Cloud Computing34%
CAGR 11-16(2013E revenues
$8.1B)
Global Cloud Computing Growth

34
Information Technology Services Overview
June 2014Telecommunications Industry Overview
! Assess technology needs
! Develop strategic plans
! Design operational andnetwork structures
! Assist in selecting andacquiring equipment
! Rack and stack, power,and test equipment
! Merge new and existingtechnology systems
! Manage equipmentlifecycles
! Colocation includesenvironments for housing ITequipment featuring
> Space, power, andsecurity
> Bandwidth and HVAC! Dedicated and virtual
hosting include> Leased equipment> Hosted servers, OS,
storage, backup, andapplications
! On-going monitoring,maintenance, and repair ofdedicated and virtual ITinfrastructure including
> Network and servers
> Systems and applications
> Storage and backup
> Security
ConsultingServices
Procurement andIntegration Services
HostingServices
ManagedServices
Value AddedResellers
IT ServiceProviders
Value AddedResellers
Data CenterOperators
Managed HostingProviders
Telecom ServiceProviders
Managed HostingProviders
IT ServiceProviders
Value AddedResellers
Telecom ServiceProviders
Telecom ServiceProviders
Telecom ServiceProviders

35
Comparison of Data Center, ILEC, and Cable Performance Metrics
June 2014Telecommunications Industry Overview
•EBITDA less CAPEX as % of Revenue•EBITDA Margin
•EBITDA Growth•Revenue Growth
Source: Company press releases and filings and Thomson Research(1) Data Center Index is comprised of EQIX, PIX.TO, and TCY.L.(2) Cable Index is comprised of CHTR, CMCSA, CVC, MCCC, and TWC.(3) ILEC Index is comprised of CNSL, CTL, FTR, and WIN.
Data Center Index (1) Cable Index (2) ILEC Index (3)
0.1990.031-0.040.1550.049-0.0360.2140.044-0.0330.130.014-0.0320.199
0.199
0.031
0.031
-0.04
-0.04
0.155
0.155
0.049
0.049
-0.036
-0.036
0.214
0.214
0.044
0.044
-0.033
-0.033
0.13
0.13
0.014
0.014
-0.032
-0.032
20102011201220132010
2010
2011
2011
2012
2012
2013
2013
00.10.20.30.40
0
0.1
0.1
0.2
0.2
0.3
0.3
0.4
0.4
0.3440.041-0.030.2050.057-0.0360.1550.053-0.0370.167-0.012-0.0210.344
0.344
0.041
0.041
-0.03
-0.03
0.205
0.205
0.057
0.057
-0.036
-0.036
0.155
0.155
0.053
0.053
-0.037
-0.037
0.167
0.167
-0.012
-0.012
-0.021
-0.021
20102011201220132010
2010
2011
2011
2012
2012
2013
2013
00.10.20.30.40
0
0.1
0.1
0.2
0.2
0.3
0.3
0.4
0.4
0.3240.3640.50.3380.3550.4690.3730.3580.4670.3920.3390.4370.324
0.324
0.364
0.364
0.5
0.5
0.338
0.338
0.355
0.355
0.469
0.469
0.373
0.373
0.358
0.358
0.467
0.467
0.392
0.392
0.339
0.339
0.437
0.437
201020112012201320102010
20112011
20122012
20132013
00.20.40.600
0.2
0.2
0.4
0.4
0.6
0.6
-0.0290.2250.380.0190.2590.35-0.0510.2210.320.0860.1820.284-0.029
-0.029
0.225
0.225
0.38
0.38
0.019
0.019
0.259
0.259
0.35
0.35
-0.051
-0.051
0.221
0.221
0.32
0.32
0.086
0.086
0.182
0.182
0.284
0.284
20102011201220132010
2010
2011
2011
2012
2012
2013
2013
00.10.20.30.40
0
0.1
0.1
0.2
0.2
0.3
0.3
0.4
0.4

36
Legacy Operations Strengths and Weaknesses for Growing Hosted Services
June 2014Telecommunications Industry Overview
Cable
TelecomServices
Colocation /ManagedHosting
IT Services
Value AddedReseller
Platform CustomerRelationships FinancialNetwork /
Infrastructure Technical Sales-BasedCulture

37
Internet Infrastructure - Large ILEC Acquisitions
June 2014Telecommunications Industry Overview
•Acquiror •Target •Strategic Rationale•Target Description •Valuation
> Global provider of cloudinfrastructure and hosted IT solutions forenterprises
> Serves approximately 2,500 uniqueclients, including 32 of the top 100companies in the Fortune 500
> Incl. 32 data centers in NA, Europe &Asia
> $3.2 billion EV
> 10.5x LQAEBITDA
> Enables CenturyLink to quicklyachieve global scale as a managedhosting and colocation provider
> Combine Savvis' leading products andservices with CenturyLink's network
> Improved growth profile & synergies
> Global provider of managed ITinfrastructure and cloud services
> Operates 13 data centers in the US,Europe, and Latin America
> Facilities include 332,000 square feetof built-out space that is 62% utilized
> $1.8 billion EV
> 19.7x LQAEBITDA
> 14.0x forwardEBITDA
> Accelerate Verizon’s “everything-as-a-service” cloud strategy
> Facilitate international expansion
> Leverage Terremark's success sellingto federal government
> Leading regional data center andmanaged hosting provider
> Serves greater than 600 SMB andenterprise customers
> Operates five data centers in MA andNC with 68,000 square feet
> $310 million incash
> 12.1x LTMEBITDA (pre-synergy)
> 11.4x LTMEBITDA (post-synergy)
> Advance Windstream’s strategy togrow non-regulated revenues
> Expand data center footprint to twelvefacilities
> Provide platform for future growth inthe managed services and cloudcomputing segments under seasonedmanagement team
> Leader in high-density data centerservices with a focus on energy andtechnology sectors
> Operates seven colocation facilitieswith 163,000 square feet
> Largest privately held data centeroperator in TX
> $525 million incash
> 12.5x LQAEBITDA
> Diversify further away fromregulated revenues
> Increase exposure to clients withnational and international footprints,including Fortune 500 companies
Source: Company filings, press releases, investor presentations, Tier1 Research, and Capital IQ

38
Internet Infrastructure - Small ILEC Acquisitions / Investments
June 2014Telecommunications Industry Overview
> Comporium has been the principal investor since founding in 2007
> Operates four data centers in South Carolina and provides anintegrated suite of managed services and infrastructure solutions forcritical business applications
> Services include colocation, dedicated Internet access, data backup &recovery, network monitoring, virtualized dedicated services, andsecurity
> Acquired in 2012: Two data centers and disaster recovery spacelocated within a 120,000 square foot facility in Winston-Salem, NorthCarolina; 30,000 square-foot facility in Raleigh; currently expanding intoCharlotte
> Delivers data center services with remote hands, cloud services,managed database, firewall, and VPNs, data protection and backup,advanced server, desktop, network, and application monitoring
> VISI (Twin Cities) acquired March 2010. Operates two data centers andover 70,000 gross square feet; serving 10,000 business and residentialcustomers
> Vital Support Systems (Des Moines) acquired June 2012. Merged withTEAM Companies (Madison, WI) in September 2012. Operates three datacenters totaling 130,000 sq. ft. in Madison; Des Moines and Cedar Falls,IA
> OneNeck IT Services (Scottsdale) acquired June 2011. OneNeck is aleading hosted application management and managed services provideroffering a comprehensive, flexible suite of ERP outsourcing solutions.
> Acquired in 2013: Operates data center facilities in Baton Rouge andShreveport-Bossier City, Louisiana; currently expanding operations
> Offers cloud hosting, colocation, managed hosting, colocation hosting,cloud backup, and disaster recovery
ILEC Data Center Description
Source: Company filings, press releases, and investor presentations.

39
Internet Infrastructure Transaction Valuations
June 2014Telecommunications Industry Overview
Source: Company filings, press releases, investor presentations, Tier1 Research, and Capital IQ(1) LQA multiples utilized where available.
711.711.112.510.412.512.119.710.810.57.214.712.515.1814.113.287
7
11.7
11.7
11.1
11.1
12.5
12.5
10.4
10.4
12.5
12.5
12.1
12.1
19.7
19.7
10.8
10.8
10.5
10.5
7.2
7.2
14.7
14.7
12.5
12.5
15.1
15.1
8
8
14.1
14.1
13.2
13.2
8
8
ServerVaultSwitch & DataViaWestCyrusOneFusepointPeak 10Hosted SolutionsTerremarkNaviSiteSAVVISE SolutionsCogeco CableEasyStreetBlackIronSystemMetricsRagingWireiWebCoreXchangeServerVault
ServerVault
CyrusOne
CyrusOne
Hosted Solutions
Hosted Solutions
SAVVIS
SAVVIS
EasyStreet
EasyStreet
RagingWire
RagingWire
0481216200
0
4
4
8
8
12
12
16
16
20
20
LQAEBITDAMultiple(1)
Target ServerVault
Switch& Data
ViaWest
CryusOne
Fusepoint
Peak10
HostedSoluti
onsTerrem
arkNaviSit
eSAVVI
SE-
Solutions
Cogeco
EasyStreet
OnlineBlackir
onSystemMetrics
RagingWire(80%)
Acquiror Carpathia
Equinix
OakHill
CincinnatiBell
Savvis WelshCarson
Windstream
Verizon
TWCable
CenturyLink
Knology Peer 1 Seapor
t RogersHawaii
anTelco
m
NTTAmeric
a
Date Sep-09 Oct-09 Apr-10 May-10 Jun-10 Sep-10 Nov-10 Jan-11 Feb-11 Apr-11 Jan-12 Dec-12 Jan-13 Apr-13 Sep-13 Oct-13
Data Centers 1 34 16 7 3 17 5 13 10 33 2 19 2 8 1 3
Values ($M) $35 $875 $420 $525 $125 $400 $310 $1,811 $311 $3,200 $14 $635 NA $196 $16 $350

40
North State Communications Acquires DataChambers
June 2014Telecommunications Industry Overview
! Announced: December 15, 2011
! Target: DataChambers, LLC
! Buyer: North State Communications (OTC: NORSA.PK)
! Price: Not disclosed
! Assets: DataChambers provides information technologyservices, including electronic data storage, managedinformation technology solutions and secure co-locationservices for mission-critical infrastructure. DataChambersoperates two data centers and disaster recovery space in its120,000 square foot facility located in Winston-Salem, NorthCarolina.
! Valuation: Not disclosed
! Closed: December 28, 2011
! Comments: North State offers Internet, voice, wireless, dataand advanced television services to businesses and consumersin the North Carolina’s Triad region. The acquisition enablesNorth State to accelerate its strategy of diversifying itsbusiness and revenue mix. The transaction will strengthenNorth State’s efforts to become becoming the preferredbusiness communications and data solutions provider in theTriad region.
Charlesmead Advisors, LLC served as exclusive financialadvisor to North State Communications in this transaction.
Source: North State Communications press release and DataChambers website
DataChambers Data Center Facility
DataChambers Products and Services
" Data center services with remote hands services
" Managed services including databases, firewalls, VPNs
" Advanced monitoring services for servers, desktops,routers, switches, and applications
" Data protection and backup with IBM’s Tivoli StorageManager and eChambers Intelligent Data Protection
" Virtualization and cloud solutions
" Business continuity space with redundant networks
" Desktop management and support to configure PCs, installpatches, managed security and firewalls
" 24/7 help desk provides Tier 1 to Tier 3 services

Appendix – Charlesmead Credentials
41
Telecommunications Industry Overview June 2014

42
Representative Transactions
June 2014Telecommunications Industry Overview
Special CommitteeReverse Share Split
Has Sold SpectrumLicenses to
Advisor to SellerDecember 2013
Advisor to BuyerAugust 2013
Has AcquiredHas Sold its WirelessPartnership Interest to
Advisor to SellerNovember 2013
Has Sold its WirelessPartnership Interest to
Advisor to SellerMarch 2014
Has Sold its WirelessPartnership Interest to
Advisor to SellerMarch 2014
Has Sold its WirelessPartnership Interest to
Advisor to SellerMarch 2014
Has Sold its EquityInterest in
BPB BIDCO to
Advisor to SellerMay 2014
Advisor to SellerMay 2014
Has Sold its EquityInterest in
BPB BIDCO to
Advisor to SellerMay 2014
Has Sold its EquityInterest in
BPB BIDCO toHas Sold Its Wireless
Tower Portfolio to
Advisor to SellerDecember 2013
Has Acquired
Advisor to BuyerDecember 2011
Has Acquired
Advisor to BuyerJanuary 2012
Has AcquiredSpectrum from
Advisor to BuyerFebruary 2012
Has Sold SpectrumLicenses to
Advisor to SellerJuly 2012
Has Acquired
Advisor to BuyerDecember 2012
Has Sold Its WirelessOperation to
Advisor to SellerJuly 2013
Has SoldFremont Telcom Company andFretel Communications, LLC to
Advisor to SellerJanuary 2013
Advisor to SellerApril 2013
Has Sold CertainWireless Assets to
Advisor to SellerJune 2013
Has Sold SpectrumLicenses to
Has Sold Its WirelessTower Portfolio to
Advisor to SellerDecember 2012

43
Presenter Biography Francis X. Gallagher, Jr., is Managing Partner and Co-Founder of Charlesmead Advisors, LLC. Mr.Gallagher has executed a wide range of financing and merger and acquisition assignments in his 15 yearsas an investment banker. Representative buy-side advisory assignments in the wireline arena include therepresentation of Iowa Telecommunications in its acquisition of Sherburne TeleSystems, and TDS in itsacquisition of managed services provider Visi Incorporated. Representative sell-side transactions includethe representation of Lakedale Telephone in its sale to Iowa Telecommunications and HutchinsonTelephone in its sale to New Ulm Telcom. In the wireless sector, Mr. Gallagher has advised Sprintaffiliates Northern PCS, Gulf Coast Wireless and Enterprise PCS in their respective sales to Sprint Nextel,and also advised Blackfoot Telephone Cooperative in the sale of its wireless division to AltaCommunications. Prior to co-founding Charlesmead Advisors, Mr. Gallagher spent almost 15 years at Legg Mason andStifel Nicolaus, where he headed the Telecommunications & Media Investment Banking Group. Prior tobecoming an investment banker, Mr. Gallagher practiced mergers and acquisitions and securities law.Mr. Gallagher began his career at New York-based Winthrop, Stimson, Putnam & Roberts where he wasresident for three years in that firm's London office. Mr. Gallagher holds a B.A. degree fromGeorgetown University, where he graduated cum laude, and a law degree from Georgetown UniversityLaw Center.
Telecommunications Industry Overview June 2014
Frank Gallagher is a registered representatives of and Securities and Investment Banking Services are offered through BA Securities, LLC Member FINRA SIPC. Charlesmead AdvisorsLLC and BA Securities, LLC are separate and unaffiliated entitiesx1