what’s happening to the economy? steven deller department of agricultural and applied economics...
TRANSCRIPT

What’s happening to the economy?
Steven DellerDepartment of Agricultural and Applied Economics
University of Wisconsin-Madison/Extension

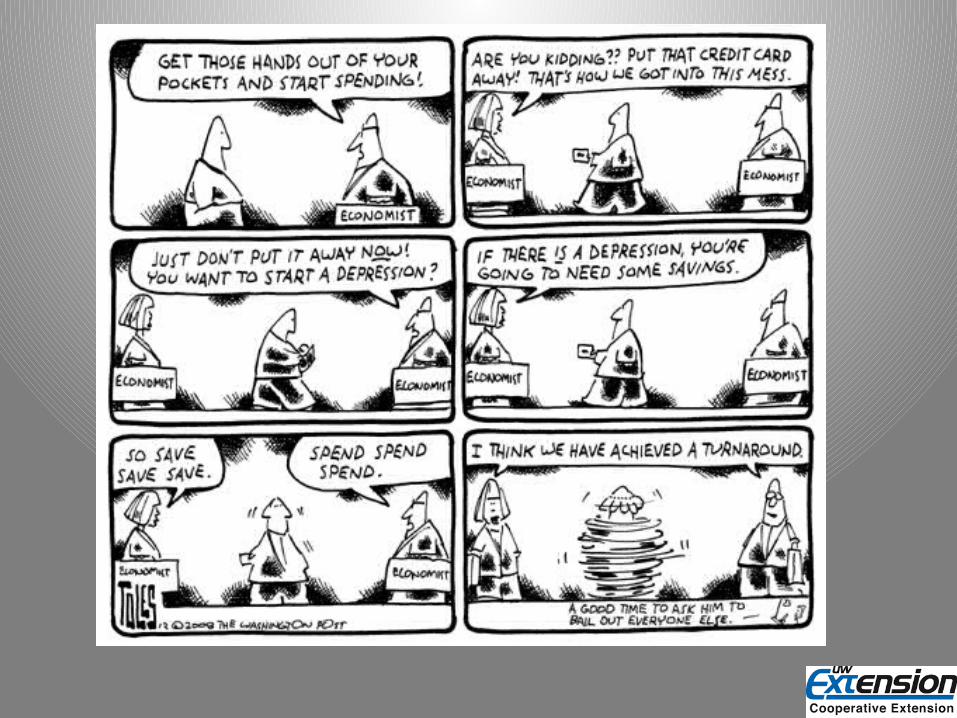
EconomicsThe Science of Explaining Tomorrow Why the Forecasts You Made Yesterday did Not Come True Today
What’s happening to the economy?
1.What’s happening at the national level?
2.What’s happening at the local level?
3.What are the strengths of the local economy?
1975-01-01
1976-05-01
1977-09-01
1979-01-01
1980-05-01
1981-09-01
1983-01-01
1984-05-01
1985-09-01
1987-01-01
1988-05-01
1989-09-01
1991-01-01
1992-05-01
1993-09-01
1995-01-01
1996-05-01
1997-09-01
1999-01-01
2000-05-01
2001-09-01
2003-01-01
2004-05-01
2005-09-01
2007-01-01
2008-05-01
2009-09-01
2011-01-01
2012-05-01
2013-09-0150
100
150
200
250
300
350
400
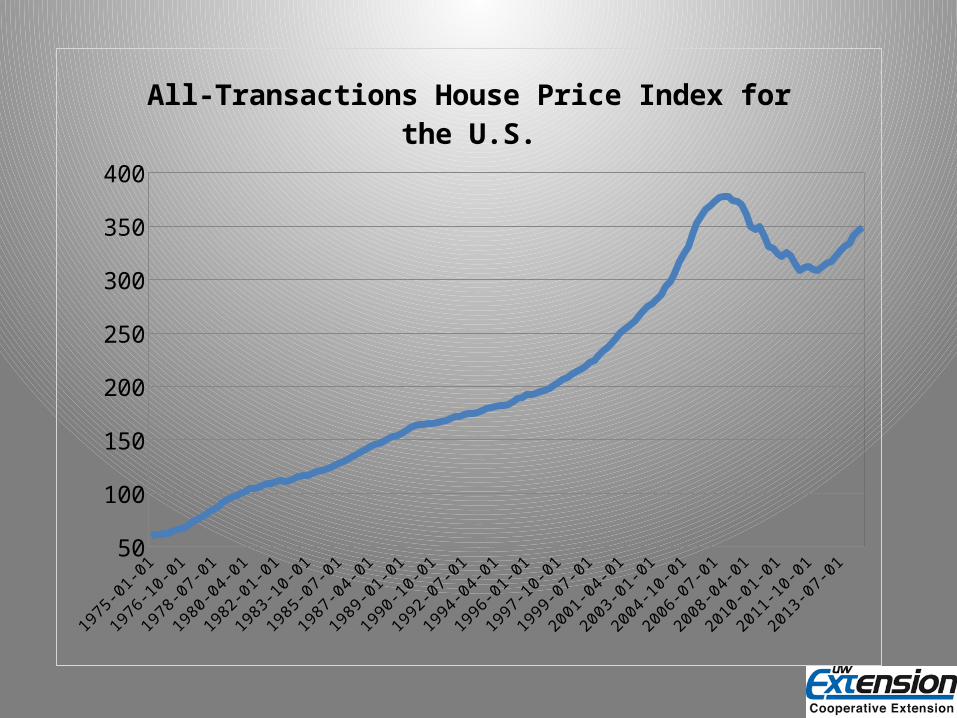
All-Transactions House Price Index for the U.S.
1975-01-01
1976-05-01
1977-09-01
1979-01-01
1980-05-01
1981-09-01
1983-01-01
1984-05-01
1985-09-01
1987-01-01
1988-05-01
1989-09-01
1991-01-01
1992-05-01
1993-09-01
1995-01-01
1996-05-01
1997-09-01
1999-01-01
2000-05-01
2001-09-01
2003-01-01
2004-05-01
2005-09-01
2007-01-01
2008-05-01
2009-09-01
2011-01-01
2012-05-01
2013-09-0150
100
150
200
250
300
350
400
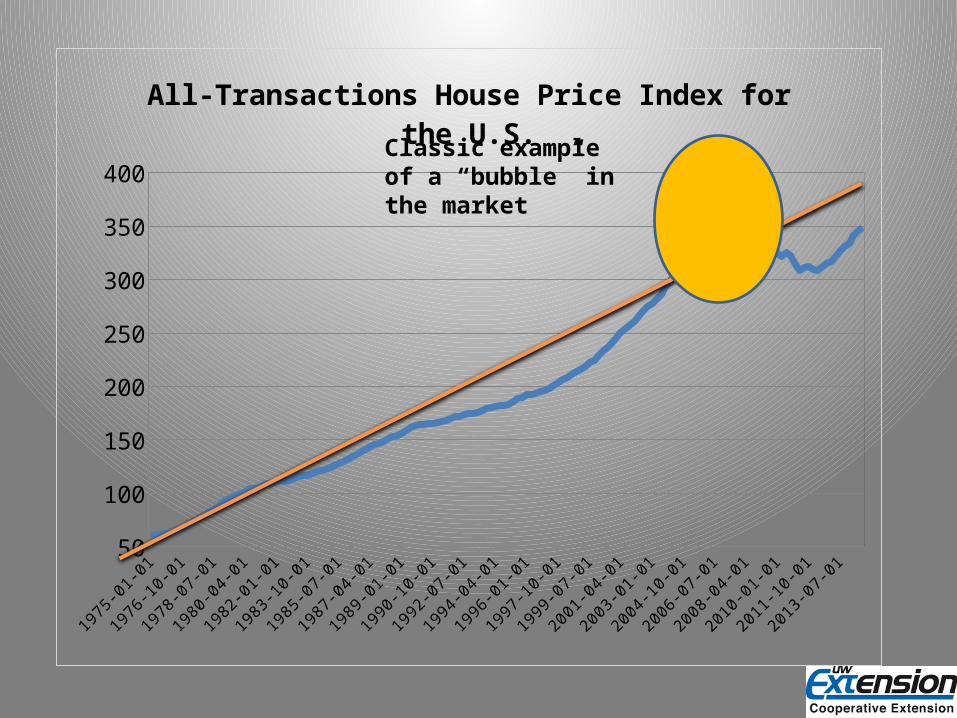
All-Transactions House Price Index for the U.S.
Classic example of a “bubble” in the market
1983-01-01
1984-02-01
1985-03-01
1986-04-01
1987-05-01
1988-06-01
1989-07-01
1990-08-01
1991-09-01
1992-10-01
1993-11-01
1994-12-01
1996-01-01
1997-02-01
1998-03-01
1999-04-01
2000-05-01
2001-06-01
2002-07-01
2003-08-01
2004-09-01
2005-10-01
2006-11-01
2007-12-01
2009-01-01
2010-02-01
2011-03-01
2012-04-01
2013-05-01
2014-06-01-1.5
-1.0
-0.5
0.0
0.5
1.0
1.5
2.0
2.5
3.0
3.5
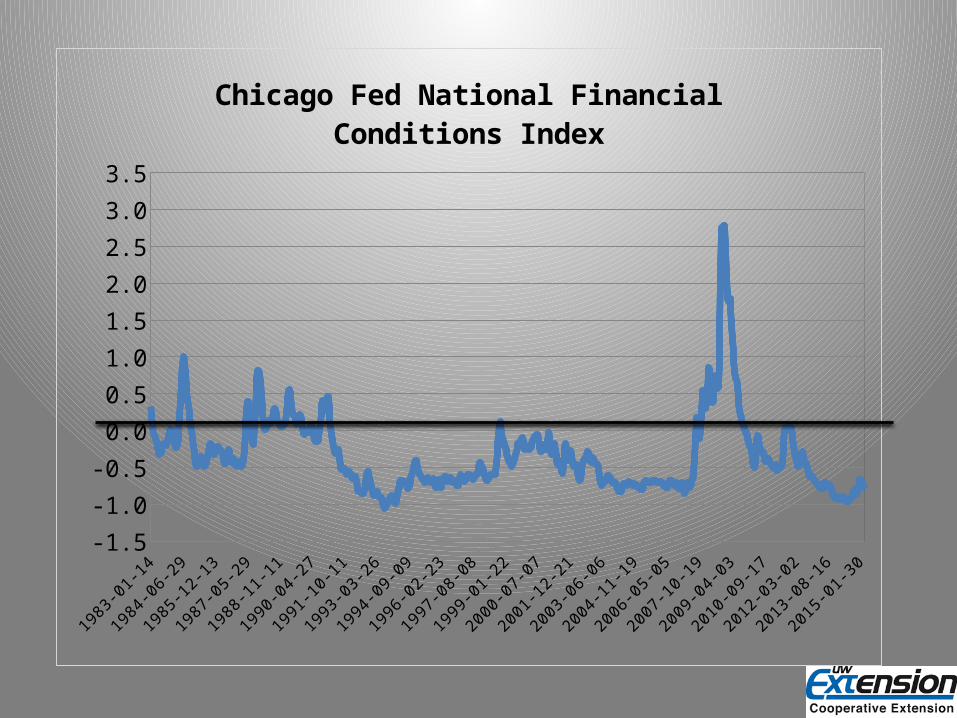
Chicago Fed National Financial Conditions Index
1991-01-01
1991-10-01
1992-07-01
1993-04-01
1994-01-01
1994-10-01
1995-07-01
1996-04-01
1997-01-01
1997-10-01
1998-07-01
1999-04-01
2000-01-01
2000-10-01
2001-07-01
2002-04-01
2003-01-01
2003-10-01
2004-07-01
2005-04-01
2006-01-01
2006-10-01
2007-07-01
2008-04-01
2009-01-01
2009-10-01
2010-07-01
2011-04-01
2012-01-01
2012-10-01
2013-07-01
2014-04-010
2
4
6
8
10
12
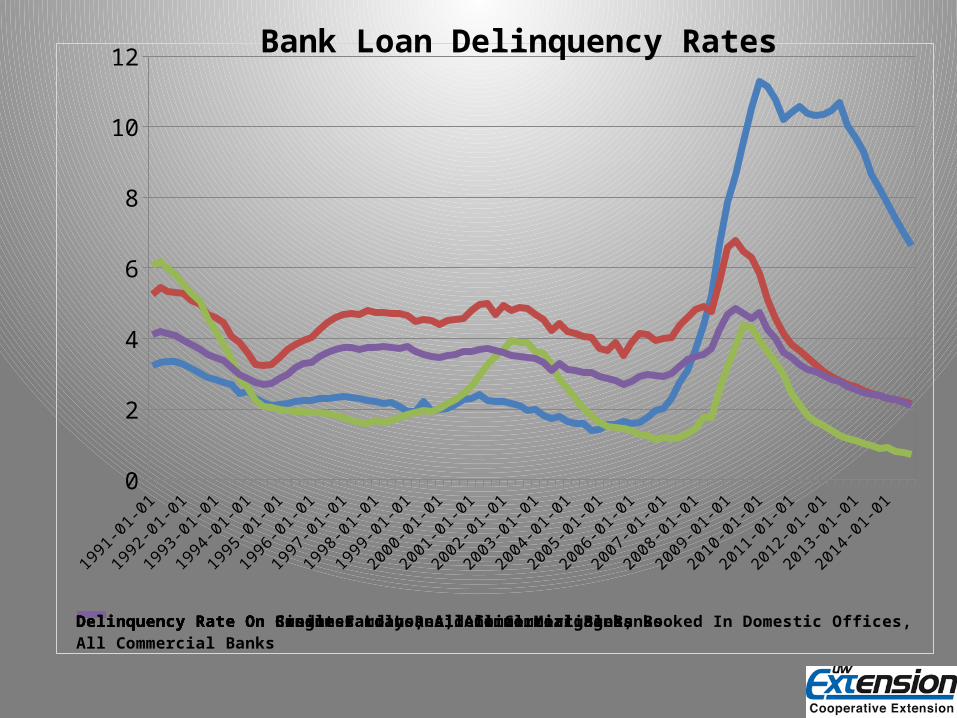
Delinquency Rate On Single-Family Residential Mortgages, Booked In Domestic Offices, All Commercial BanksDelinquency Rate On Credit Card Loans, All Commercial BanksDelinquency Rate On Business Loans, All Commercial BanksDelinquency Rate On Consumer Loans, All Commercial Banks
Bank Loan Delinquency Rates
1980-01-02
1981-06-02
1982-11-02
1984-04-02
1985-09-02
1987-02-02
1988-07-02
1989-12-02
1991-05-02
1992-10-02
1994-03-02
1995-08-02
1997-01-02
1998-06-02
1999-11-02
2001-04-02
2002-09-02
2004-02-02
2005-07-02
2006-12-02
2008-05-02100
150
200
250
300
350
400
450
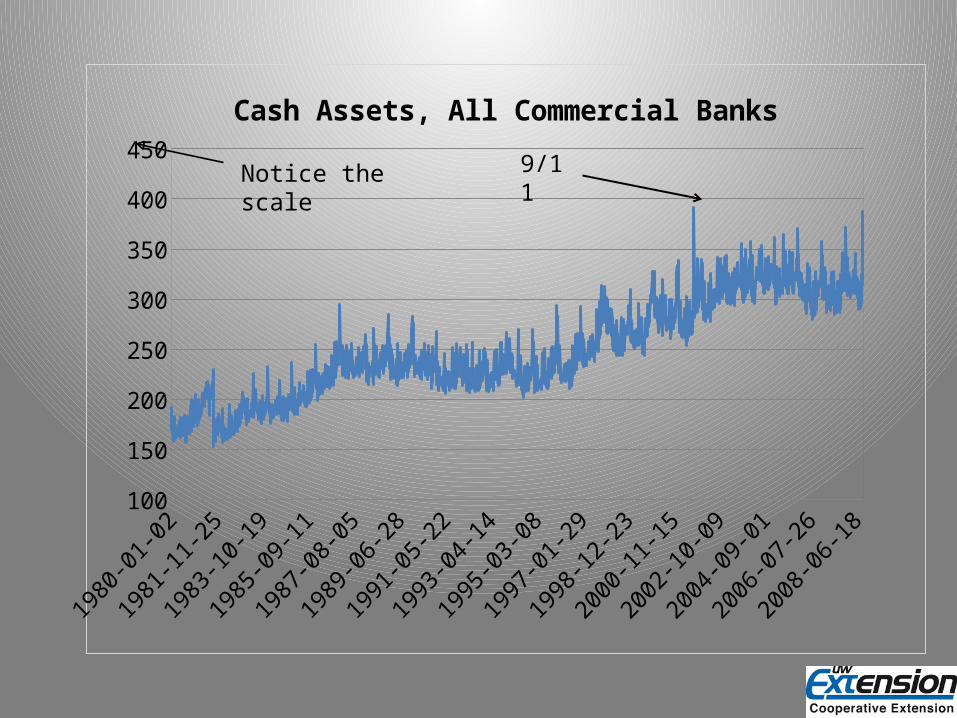
Cash Assets, All Commercial Banks
9/11Notice the scale
1980-01-02
1981-10-02
1983-07-02
1985-04-02
1987-01-02
1988-10-02
1990-07-02
1992-04-02
1994-01-02
1995-10-02
1997-07-02
1999-04-02
2001-01-02
2002-10-02
2004-07-02
2006-04-02
2008-01-02
2009-10-02
2011-07-02
2013-04-02
2015-01-02100
600
1100
1600
2100
2600
3100
3600
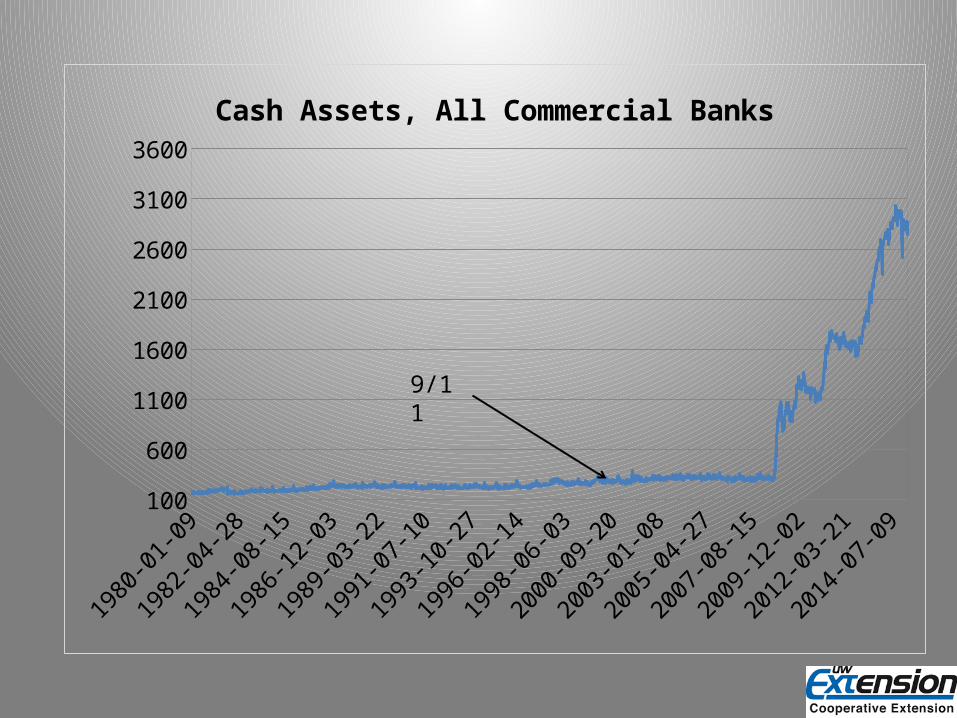
Cash Assets, All Commercial Banks
9/11
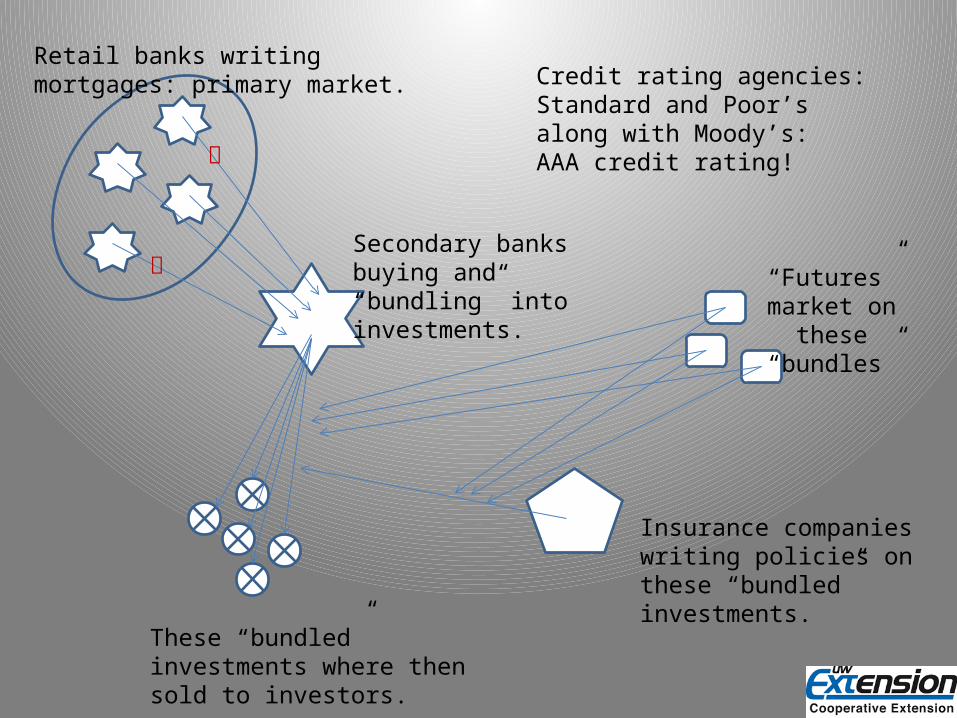
Retail banks writing mortgages: primary market.
Secondary banks buying and “bundling” into investments.
These “bundled” investments where then sold to investors.
Insurance companies writing policies on these “bundled” investments.
“Futures” market on
these “bundles”
Credit rating agencies: Standard and Poor’s along with Moody’s: AAA credit rating!
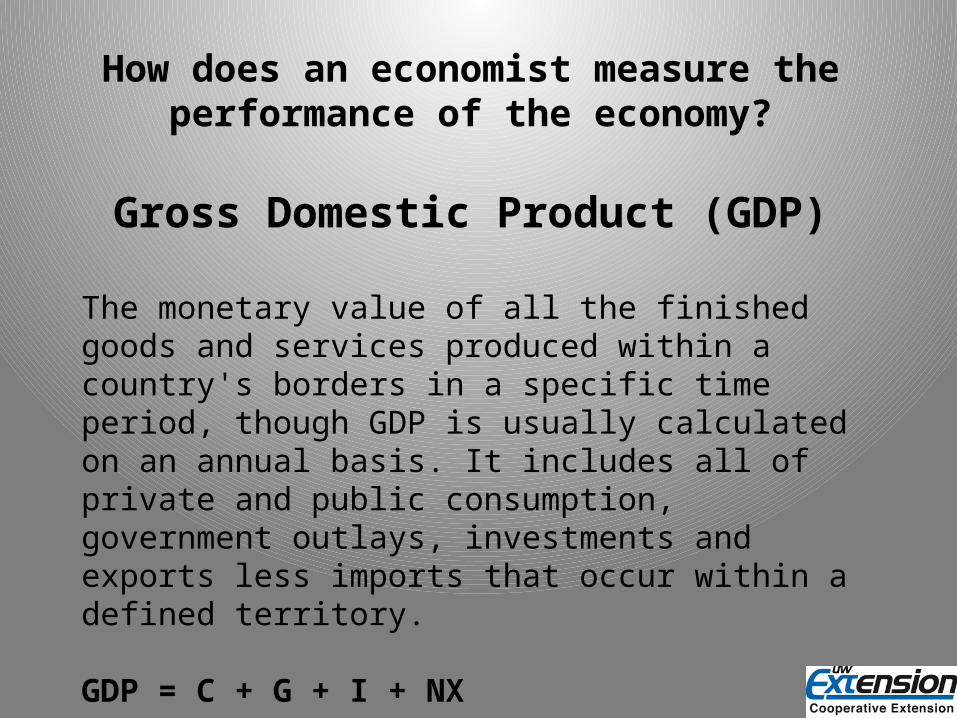
How does an economist measure the performance of the economy?
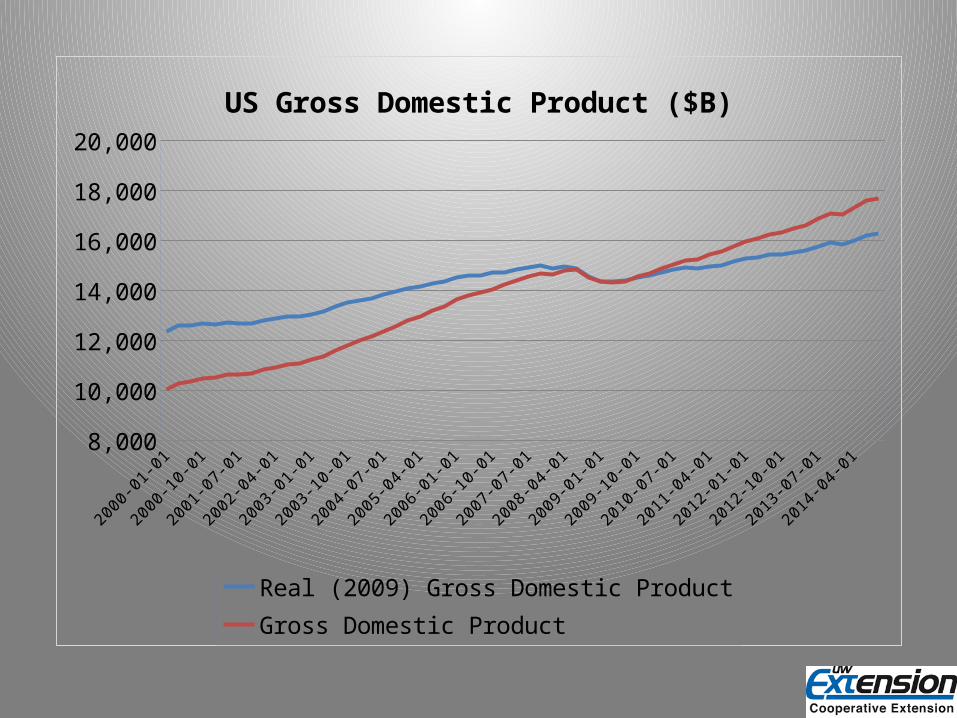
Gross Domestic Product (GDP)
The monetary value of all the finished goods and services produced within a country's borders in a specific time period, though GDP is usually calculated on an annual basis. It includes all of private and public consumption, government outlays, investments and exports less imports that occur within a defined territory.
GDP = C + G + I + NX
1947-01-01
1949-03-01
1951-05-01
1953-07-01
1955-09-01
1957-11-01
1960-01-01
1962-03-01
1964-05-01
1966-07-01
1968-09-01
1970-11-01
1973-01-01
1975-03-01
1977-05-01
1979-07-01
1981-09-01
1983-11-01
1986-01-01
1988-03-01
1990-05-01
1992-07-01
1994-09-01
1996-11-01
1999-01-01
2001-03-01
2003-05-01
2005-07-01
2007-09-01
2009-11-01
2012-01-01
2014-03-010
2,000
4,000
6,000
8,000
10,000
12,000
14,000
16,000
18,000
20,000
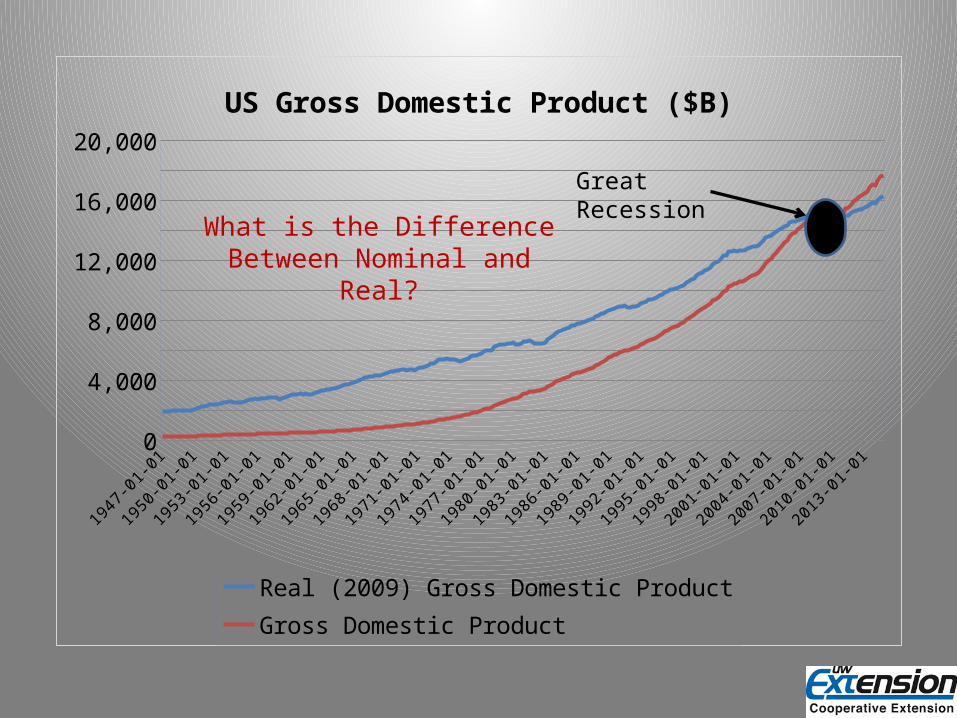
US Gross Domestic Product ($B)
Real (2009) Gross Domestic Product Gross Domestic Product
Great Recession
What is the Difference Between Nominal and Real?
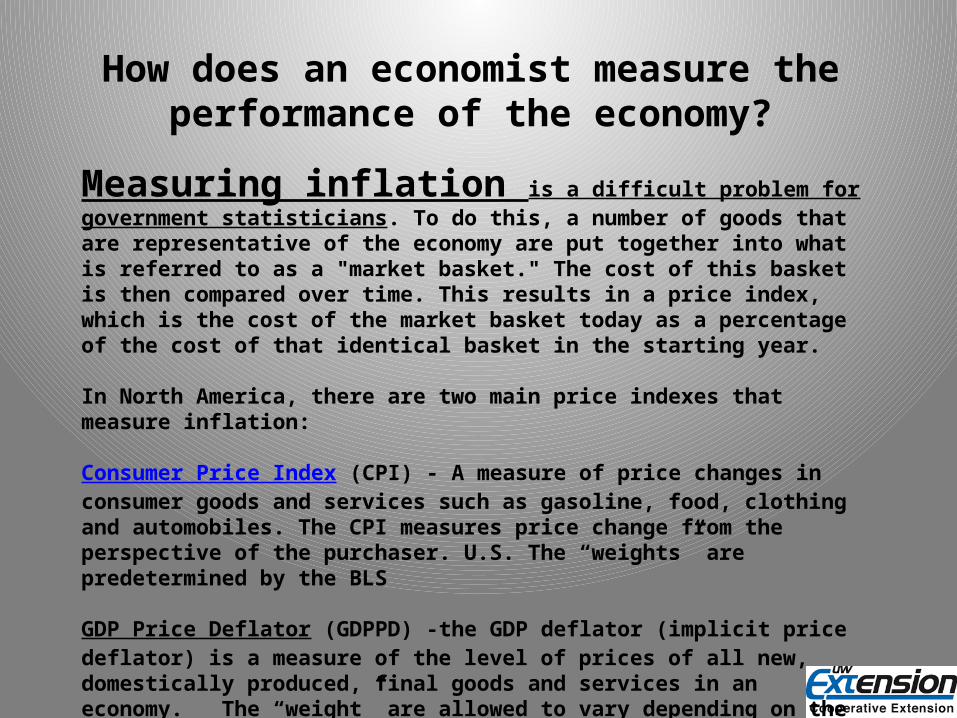
How does an economist measure the performance of the economy?
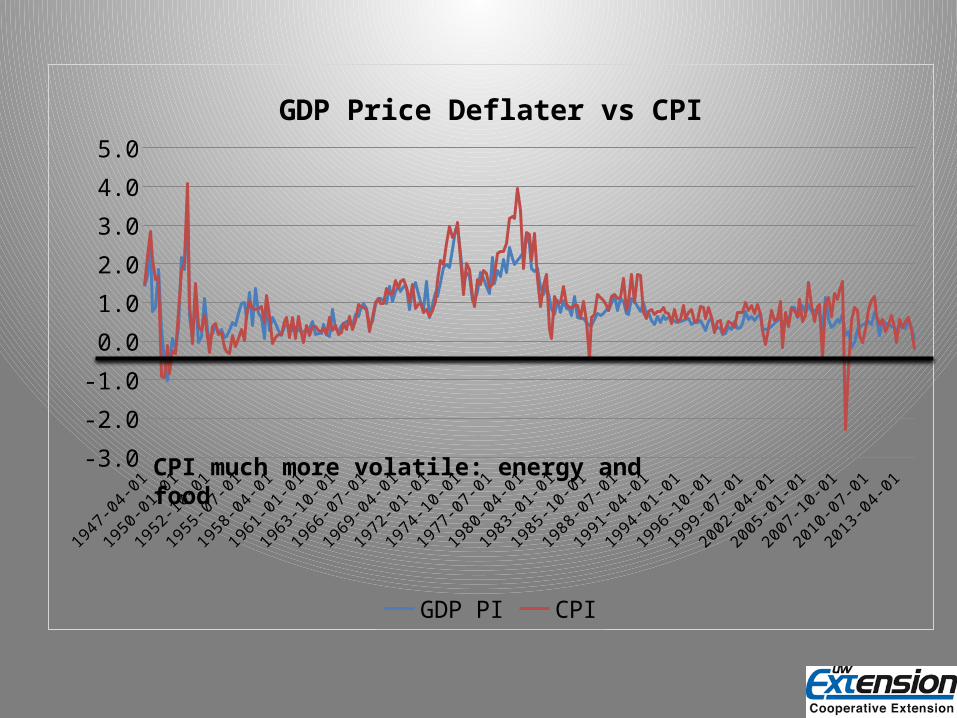
Measuring inflation is a difficult problem for government statisticians. To do this, a number of goods that are representative of the economy are put together into what is referred to as a "market basket." The cost of this basket is then compared over time. This results in a price index, which is the cost of the market basket today as a percentage of the cost of that identical basket in the starting year.
In North America, there are two main price indexes that measure inflation:
Consumer Price Index (CPI) - A measure of price changes in consumer goods and services such as gasoline, food, clothing and automobiles. The CPI measures price change from the perspective of the purchaser. U.S. The “weights” are predetermined by the BLS
GDP Price Deflator (GDPPD) -the GDP deflator (implicit price deflator) is a measure of the level of prices of all new, domestically produced, final goods and services in an economy. The “weight” are allowed to vary depending on the contribution to GDP.
1947-04-01
1949-04-01
1951-04-01
1953-04-01
1955-04-01
1957-04-01
1959-04-01
1961-04-01
1963-04-01
1965-04-01
1967-04-01
1969-04-01
1971-04-01
1973-04-01
1975-04-01
1977-04-01
1979-04-01
1981-04-01
1983-04-01
1985-04-01
1987-04-01
1989-04-01
1991-04-01
1993-04-01
1995-04-01
1997-04-01
1999-04-01
2001-04-01
2003-04-01
2005-04-01
2007-04-01
2009-04-01
2011-04-01
2013-04-01-3.0
-2.0
-1.0
0.0
1.0
2.0
3.0
4.0
5.0
GDP Price Deflater vs CPI
GDP PI CPI
CPI much more volatile: energy and food
2000-01-01
2000-07-01
2001-01-01
2001-07-01
2002-01-01
2002-07-01
2003-01-01
2003-07-01
2004-01-01
2004-07-01
2005-01-01
2005-07-01
2006-01-01
2006-07-01
2007-01-01
2007-07-01
2008-01-01
2008-07-01
2009-01-01
2009-07-01
2010-01-01
2010-07-01
2011-01-01
2011-07-01
2012-01-01
2012-07-01
2013-01-01
2013-07-01
2014-01-01
2014-07-018,000
10,000
12,000
14,000
16,000
18,000
20,000
US Gross Domestic Product ($B)
Real (2009) Gross Domestic Product Gross Domestic Product
How does an economist measure the performance of the economy?
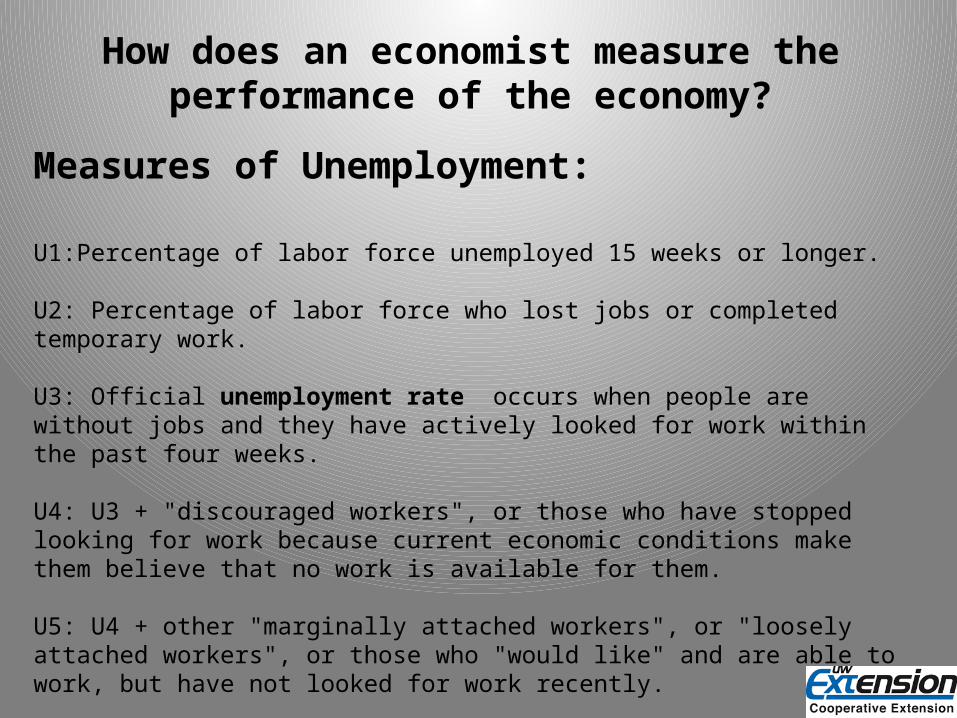
Measures of Unemployment:
U1:Percentage of labor force unemployed 15 weeks or longer.
U2: Percentage of labor force who lost jobs or completed temporary work.
U3: Official unemployment rate occurs when people are without jobs and they have actively looked for work within the past four weeks.
U4: U3 + "discouraged workers", or those who have stopped looking for work because current economic conditions make them believe that no work is available for them.
U5: U4 + other "marginally attached workers", or "loosely attached workers", or those who "would like" and are able to work, but have not looked for work recently.
U6: U5 + Part-time workers who want to work full-time, but cannot due to economic reasons (underemployment).
1994-01-01
1994-09-01
1995-05-01
1996-01-01
1996-09-01
1997-05-01
1998-01-01
1998-09-01
1999-05-01
2000-01-01
2000-09-01
2001-05-01
2002-01-01
2002-09-01
2003-05-01
2004-01-01
2004-09-01
2005-05-01
2006-01-01
2006-09-01
2007-05-01
2008-01-01
2008-09-01
2009-05-01
2010-01-01
2010-09-01
2011-05-01
2012-01-01
2012-09-01
2013-05-01
2014-01-010.0
2.0
4.0
6.0
8.0
10.0
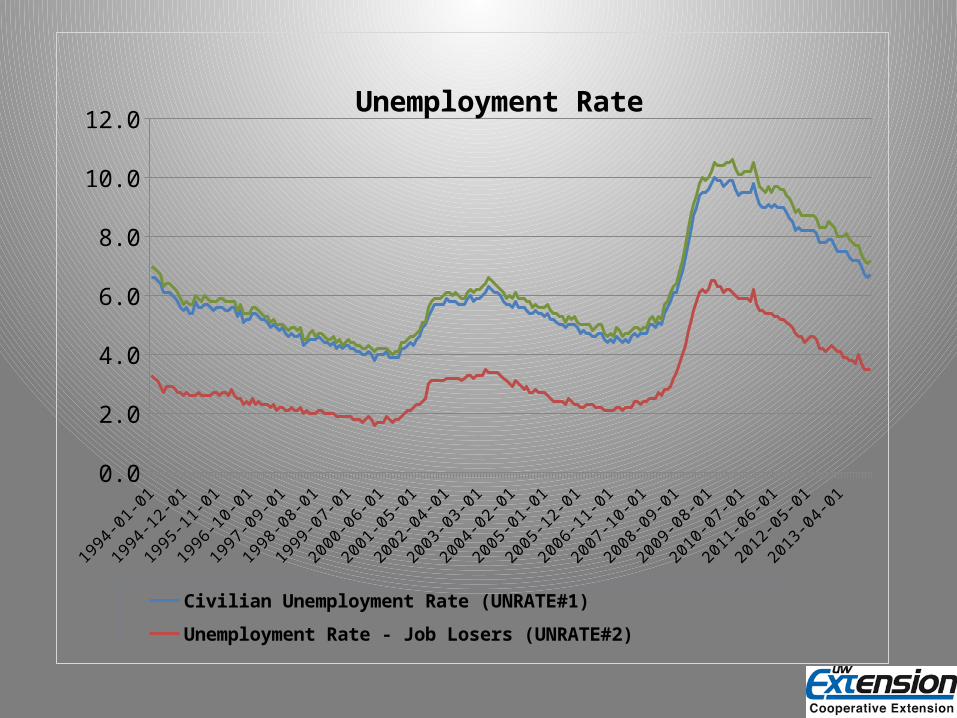
12.0Unemployment Rate
Civilian Unemployment Rate (UNRATE#1)Unemployment Rate - Job Losers (UNRATE#2)Unemployment Rate: Unemployed and Discouraged Workers (UNRATE#4)
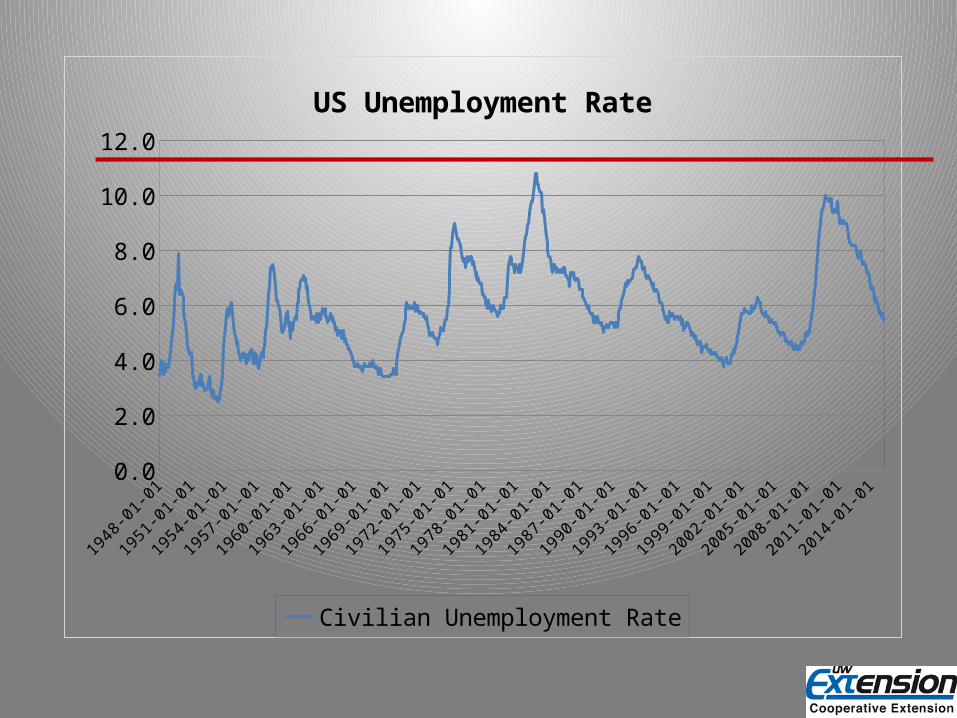
1948-01-01
1950-03-01
1952-05-01
1954-07-01
1956-09-01
1958-11-01
1961-01-01
1963-03-01
1965-05-01
1967-07-01
1969-09-01
1971-11-01
1974-01-01
1976-03-01
1978-05-01
1980-07-01
1982-09-01
1984-11-01
1987-01-01
1989-03-01
1991-05-01
1993-07-01
1995-09-01
1997-11-01
2000-01-01
2002-03-01
2004-05-01
2006-07-01
2008-09-01
2010-11-01
2013-01-01
2015-03-010.0
2.0
4.0
6.0
8.0
10.0
12.0
US Unemployment Rate
Civilian Unemployment Rate
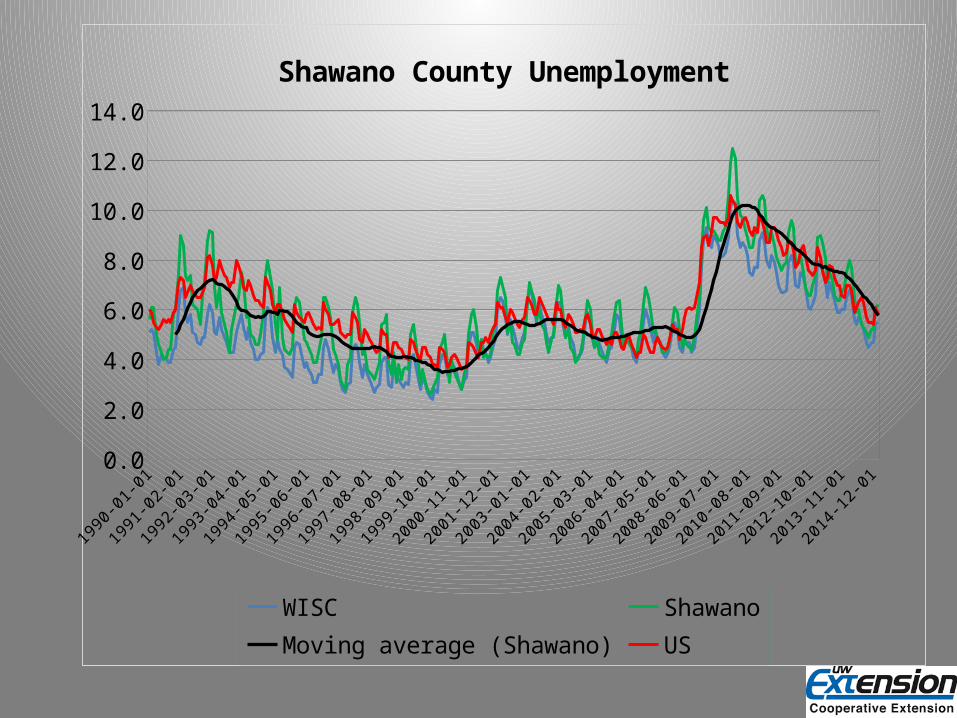
1990-01-01
1990-11-01
1991-09-01
1992-07-01
1993-05-01
1994-03-01
1995-01-01
1995-11-01
1996-09-01
1997-07-01
1998-05-01
1999-03-01
2000-01-01
2000-11-01
2001-09-01
2002-07-01
2003-05-01
2004-03-01
2005-01-01
2005-11-01
2006-09-01
2007-07-01
2008-05-01
2009-03-01
2010-01-01
2010-11-01
2011-09-01
2012-07-01
2013-05-01
2014-03-01
2015-01-010.0
2.0
4.0
6.0
8.0
10.0
12.0
14.0
Shawano County Unemployment
WISC ShawanoMoving average (Shawano) US
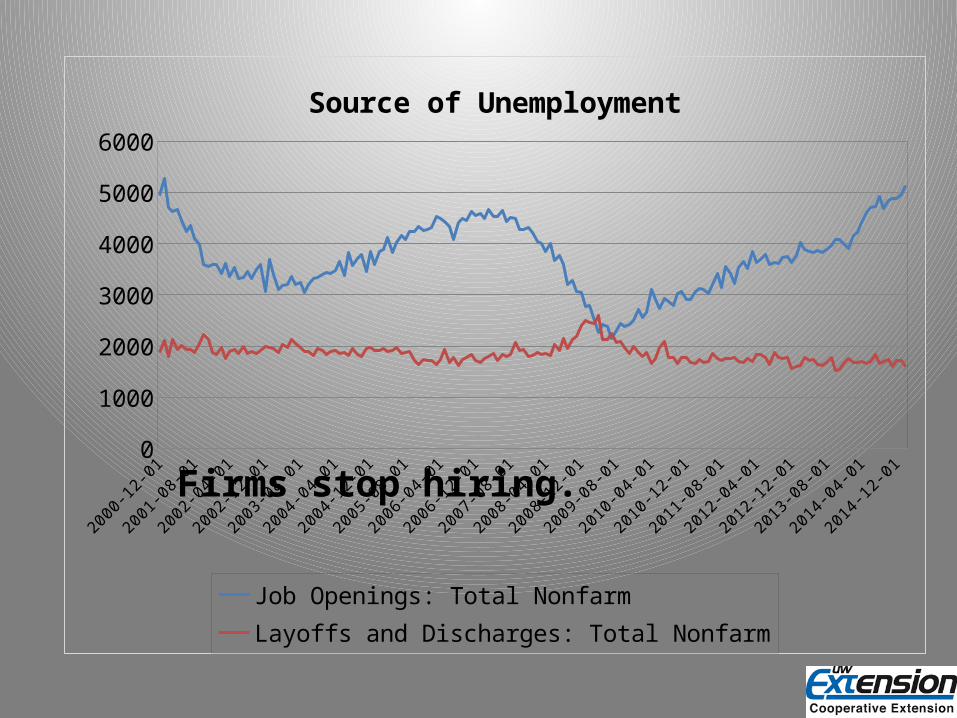
2000-12-01
2001-06-01
2001-12-01
2002-06-01
2002-12-01
2003-06-01
2003-12-01
2004-06-01
2004-12-01
2005-06-01
2005-12-01
2006-06-01
2006-12-01
2007-06-01
2007-12-01
2008-06-01
2008-12-01
2009-06-01
2009-12-01
2010-06-01
2010-12-01
2011-06-01
2011-12-01
2012-06-01
2012-12-01
2013-06-01
2013-12-01
2014-06-01
2014-12-010
1000
2000
3000
4000
5000
6000
Source of Unemployment
Job Openings: Total Nonfarm Layoffs and Discharges: Total Nonfarm
Firms stop hiring.
How does an economist measure the performance of the economy?
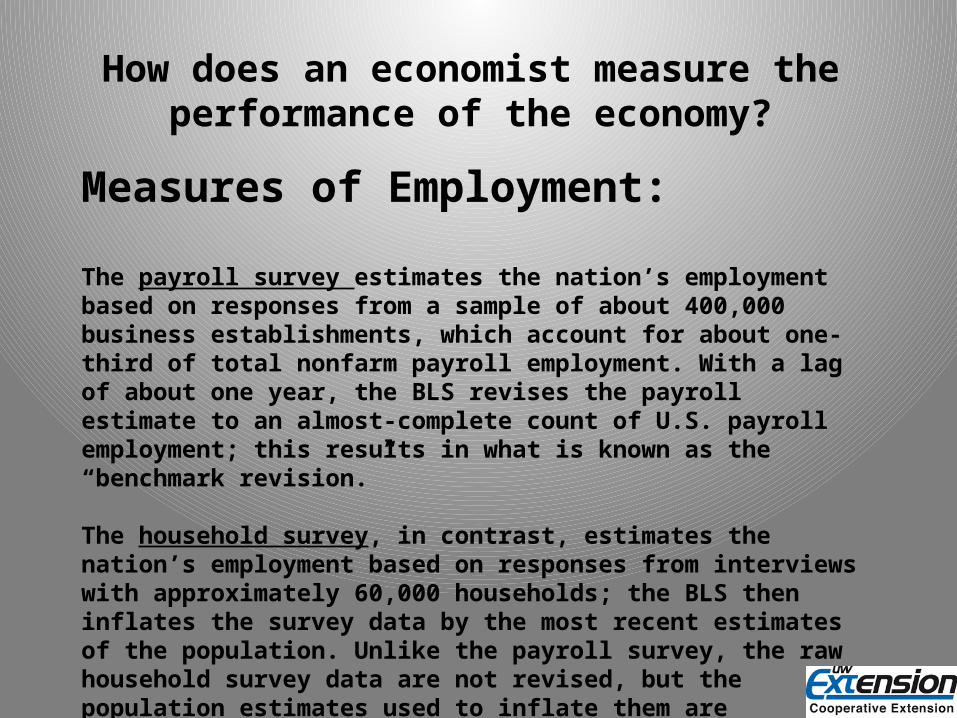
Measures of Employment:
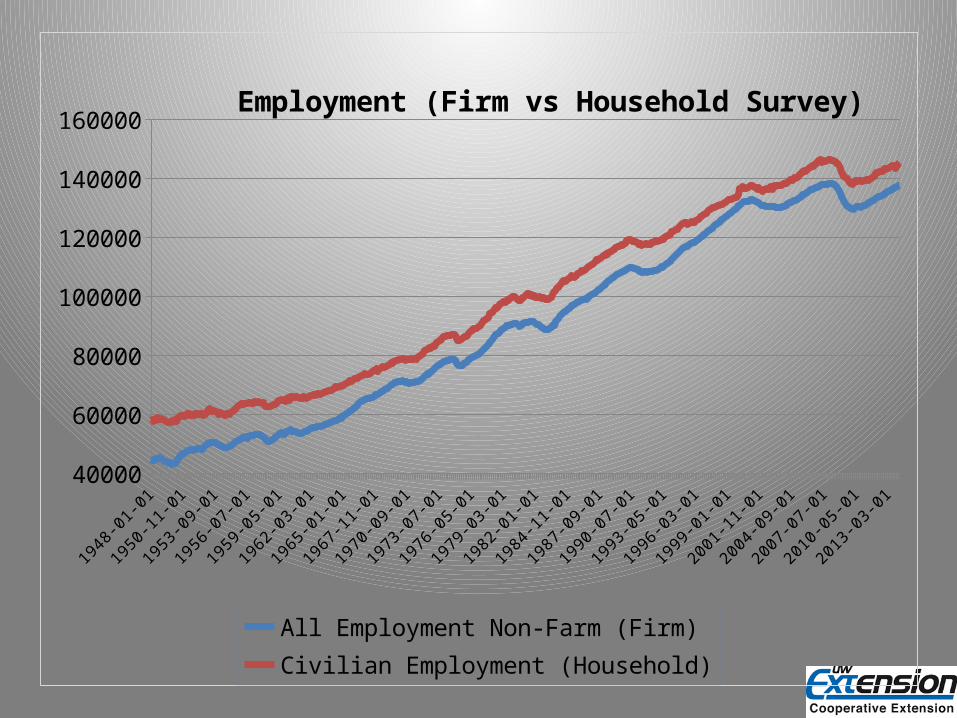
The payroll survey estimates the nation’s employment based on responses from a sample of about 400,000 business establishments, which account for about one-third of total nonfarm payroll employment. With a lag of about one year, the BLS revises the payroll estimate to an almost-complete count of U.S. payroll employment; this results in what is known as the “benchmark revision.”
The household survey, in contrast, estimates the nation’s employment based on responses from interviews with approximately 60,000 households; the BLS then inflates the survey data by the most recent estimates of the population. Unlike the payroll survey, the raw household survey data are not revised, but the population estimates used to inflate them are occasionally updated to incorporate new information from censuses and new estimates of immigration.
How does an economist measure the performance of the economy?
Measures of Employment:
QCEW is the Quarterly Census of Employment and Wages. The program originated in the 1930s, and was known as the ES-202 program until 2003 when the current QCEW name was adopted. The primary economic product is the tabulation of employment and wages of establishments which report to the Unemployment Insurance (UI) programs of the United States. Employment covered by these UI programs represents about 99.7% of all wage and salary civilian employment in the country.
How does an economist measure the performance of the economy?
Measures of Employment:
What is included in the definition?
“Non-farm” employment,“Civilian” employment“Private Sector” employment“Wage and Salary” employment
How are the self-employed counted?
1948-01-01
1950-02-01
1952-03-01
1954-04-01
1956-05-01
1958-06-01
1960-07-01
1962-08-01
1964-09-01
1966-10-01
1968-11-01
1970-12-01
1973-01-01
1975-02-01
1977-03-01
1979-04-01
1981-05-01
1983-06-01
1985-07-01
1987-08-01
1989-09-01
1991-10-01
1993-11-01
1995-12-01
1998-01-01
2000-02-01
2002-03-01
2004-04-01
2006-05-01
2008-06-01
2010-07-01
2012-08-0140000
60000
80000
100000
120000
140000
160000Employment (Firm vs Household Survey)
All Employment Non-Farm (Firm) Civilian Employment (Household)
19701972
19741976
19781980
19821984
19861988
19901992
19941996
19982000
20022004
20062008
20102012
90
110
130
150
170
190
210
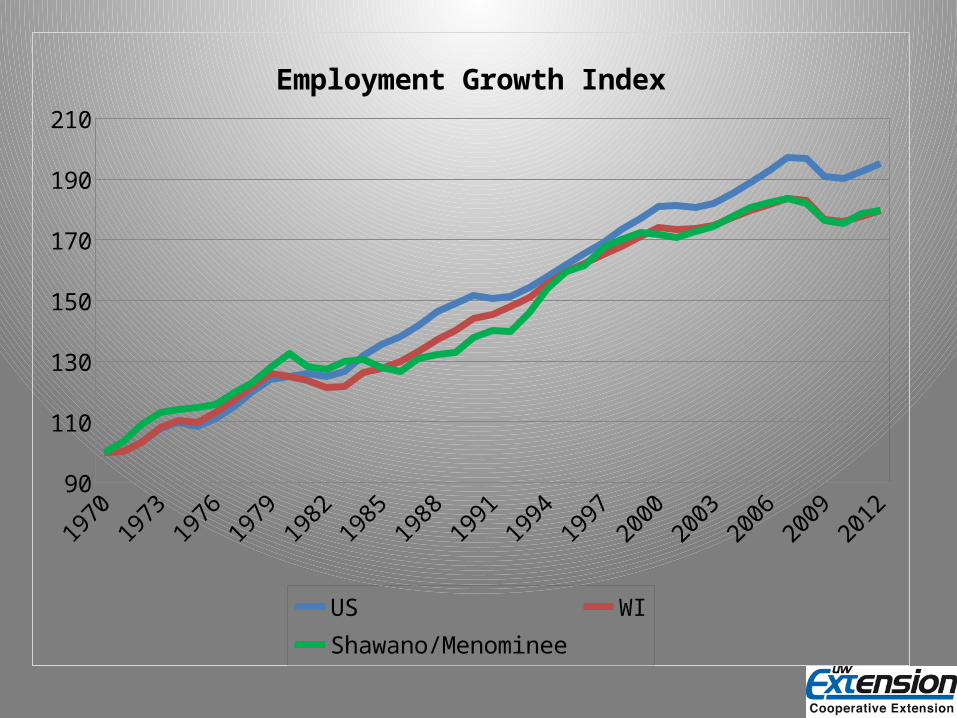
Employment Growth Index
US WI Shawano/Menominee
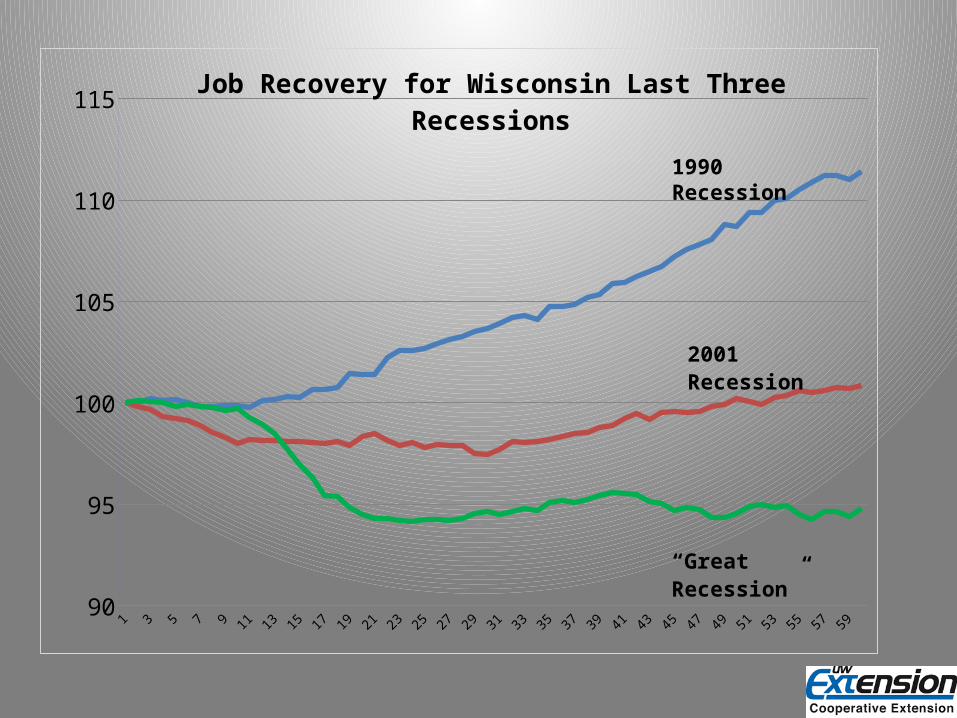
1 3 5 7 9 11 13 15 17 19 21 23 25 27 29 31 33 35 37 39 41 43 45 47 49 51 53 55 57 5990
95
100
105
110
115Job Recovery for Wisconsin Last Three Recessions
2001 Recession
“Great Recession”
1990 Recession
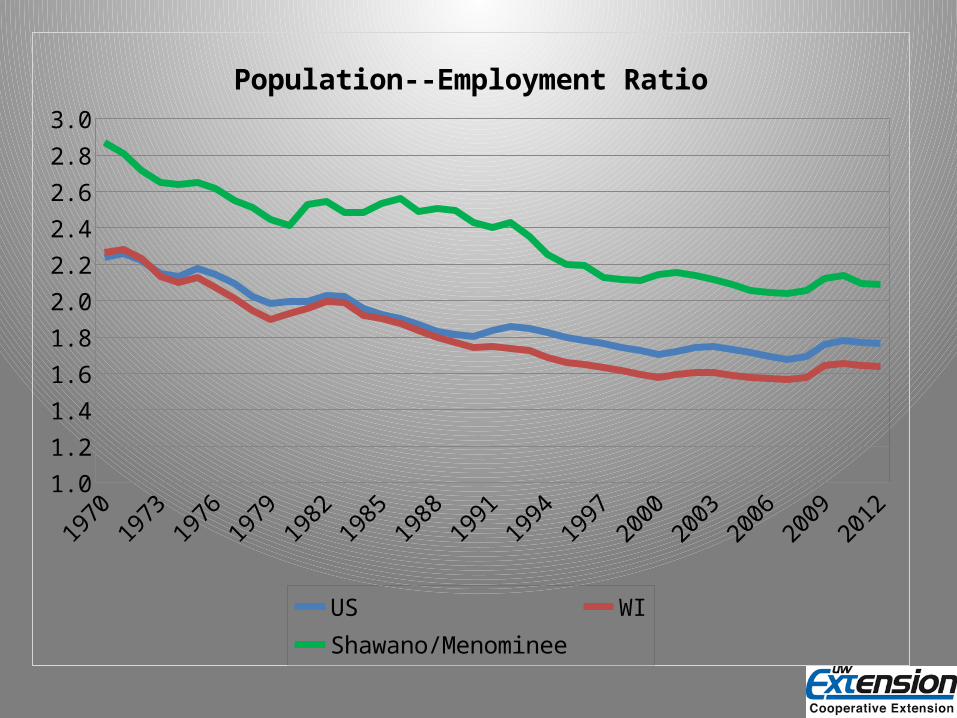
19701972
19741976
19781980
19821984
19861988
19901992
19941996
19982000
20022004
20062008
20102012
1.0
1.2
1.4
1.6
1.8
2.0
2.2
2.4
2.6
2.8
3.0
Population--Employment Ratio
US WI Shawano/Menominee
19701972
19741976
19781980
19821984
19861988
19901992
19941996
19982000
20022004
20062008
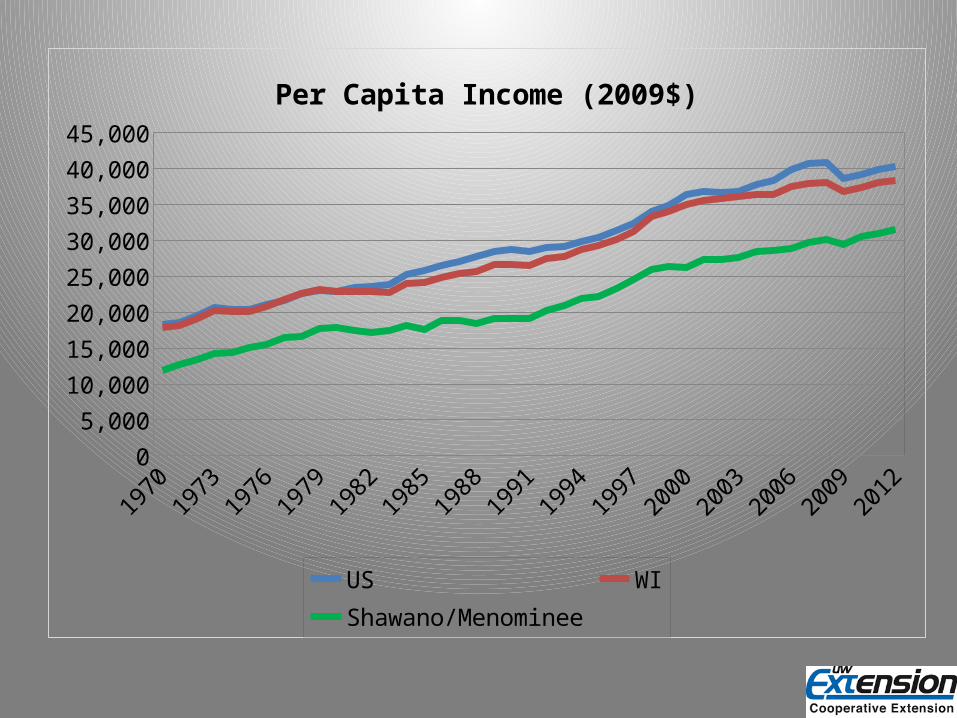
20102012
0
5,000
10,000
15,000
20,000
25,000
30,000
35,000
40,000
45,000
Per Capita Income (2009$)
US WI Shawano/Menominee
19701972
19741976
19781980
19821984
19861988
19901992
19941996
19982000
20022004
20062008
20102012
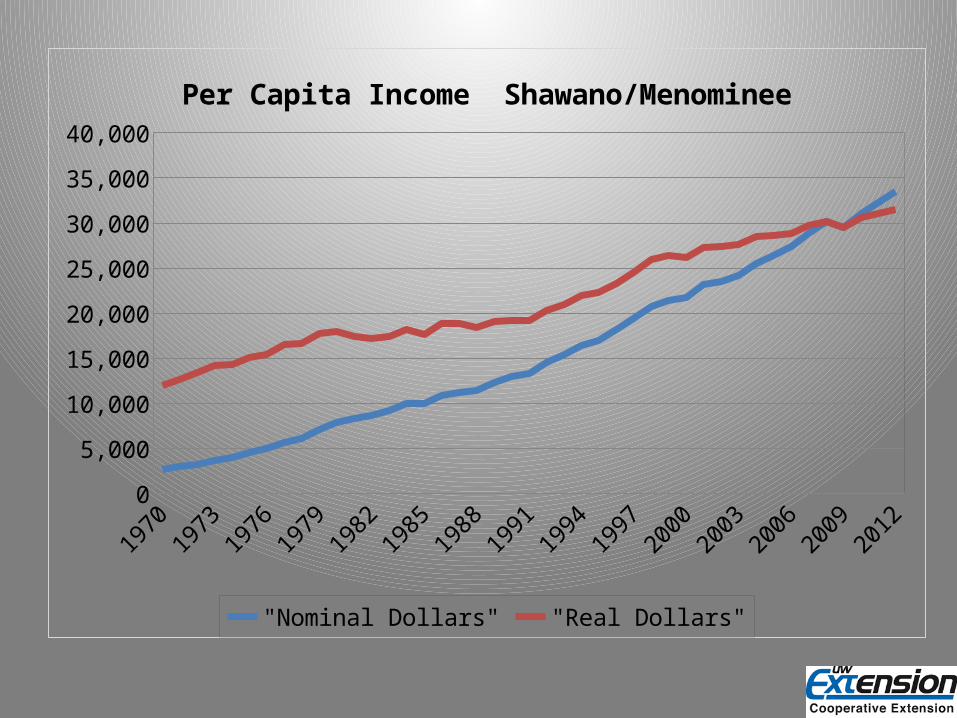
0
5,000
10,000
15,000
20,000
25,000
30,000
35,000
40,000
Per Capita Income Shawano/Menominee
"Nominal Dollars" "Real Dollars"
19701972
19741976
19781980
19821984
19861988
19901992
19941996
19982000
20022004
20062008
20102012
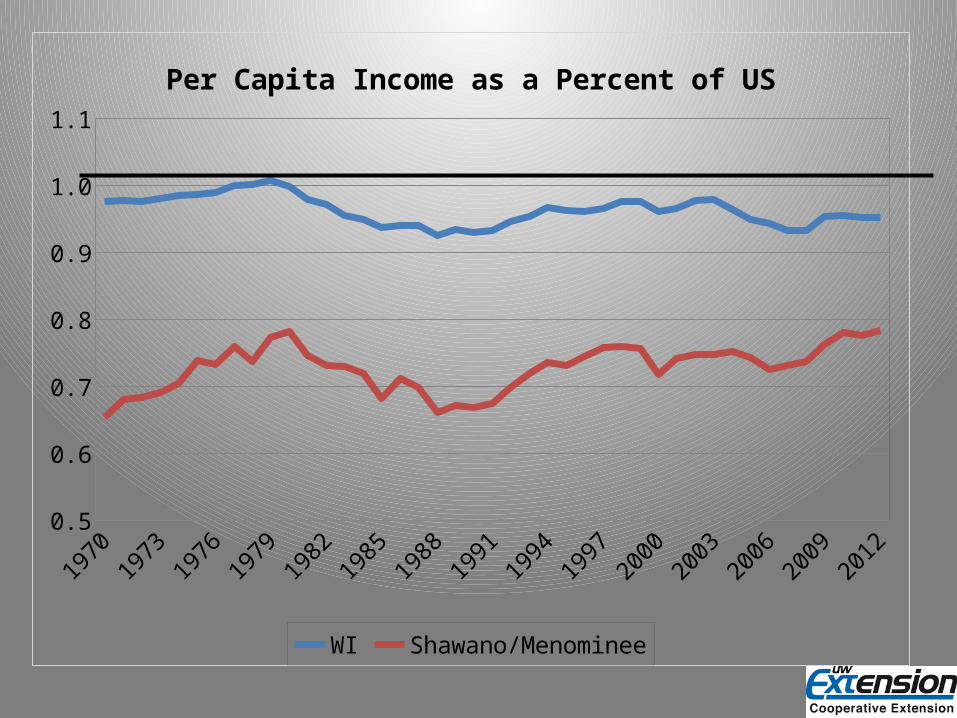
0.5
0.6
0.7
0.8
0.9
1.0
1.1
Per Capita Income as a Percent of US
WI Shawano/Menominee
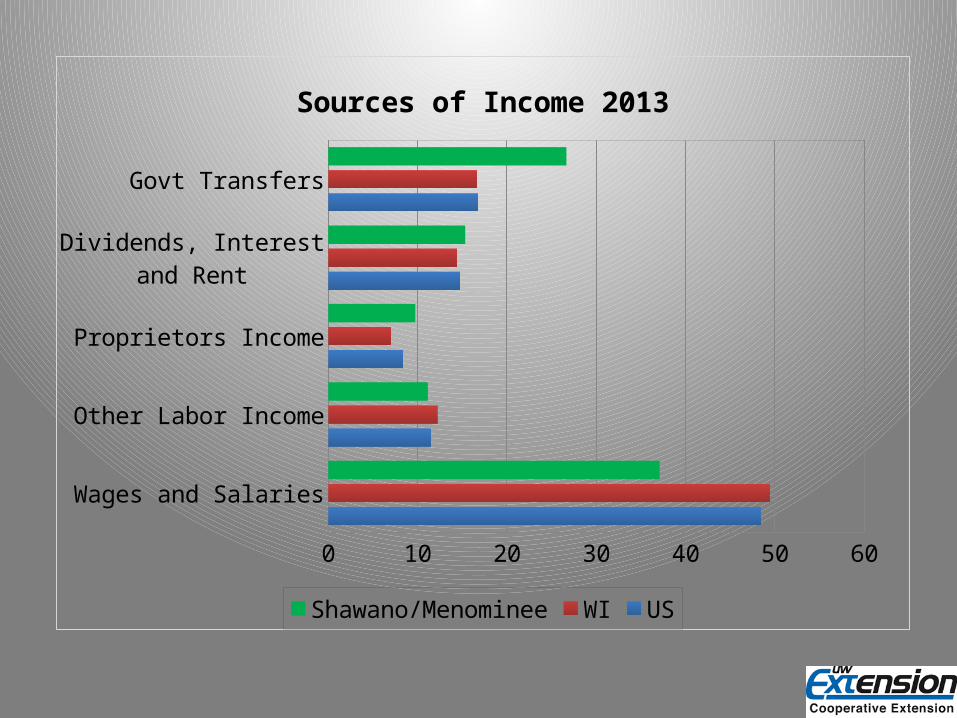
Wages and Salaries
Other Labor Income
Proprietors Income
Dividends, Interest and Rent
Govt Transfers
0 10 20 30 40 50 60
Sources of Income 2013
Shawano/Menominee WI US
19701972
19741976
19781980
19821984
19861988
19901992
19941996
19982000
20022004
20062008
20102012
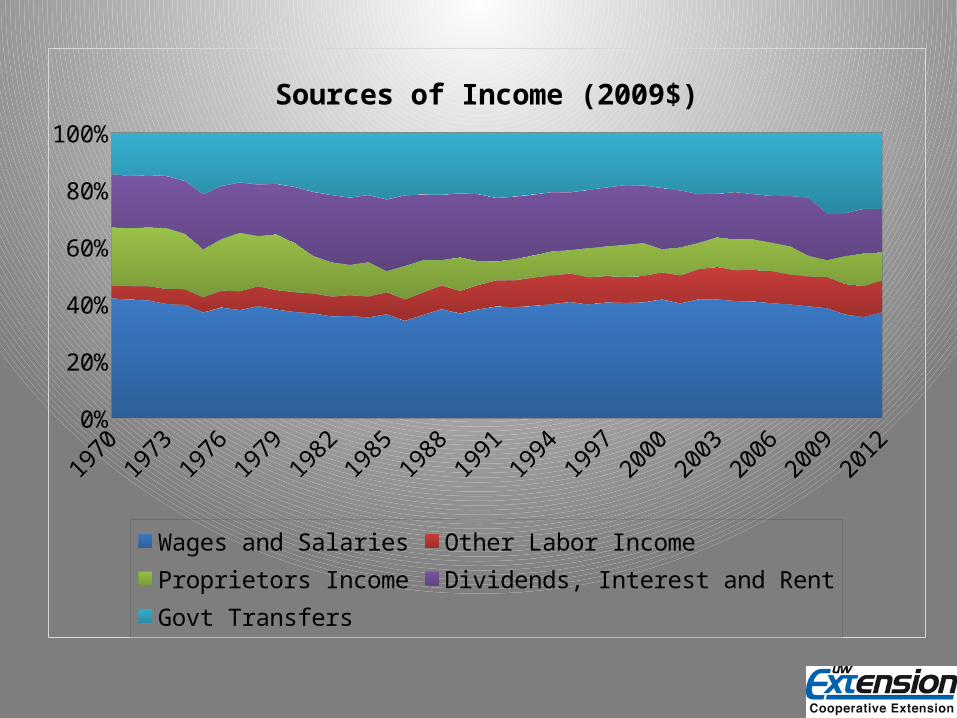
0%10%20%30%40%50%60%70%80%90%
100%
Sources of Income (2009$)
Wages and Salaries Other Labor IncomeProprietors Income Dividends, Interest and RentGovt Transfers

19701972
19741976
19781980
19821984
19861988
19901992
19941996
19982000
20022004
20062008
20102012
90
110
130
150
170
190
210
Employment Growth Index
US WI Shawano/Menominee
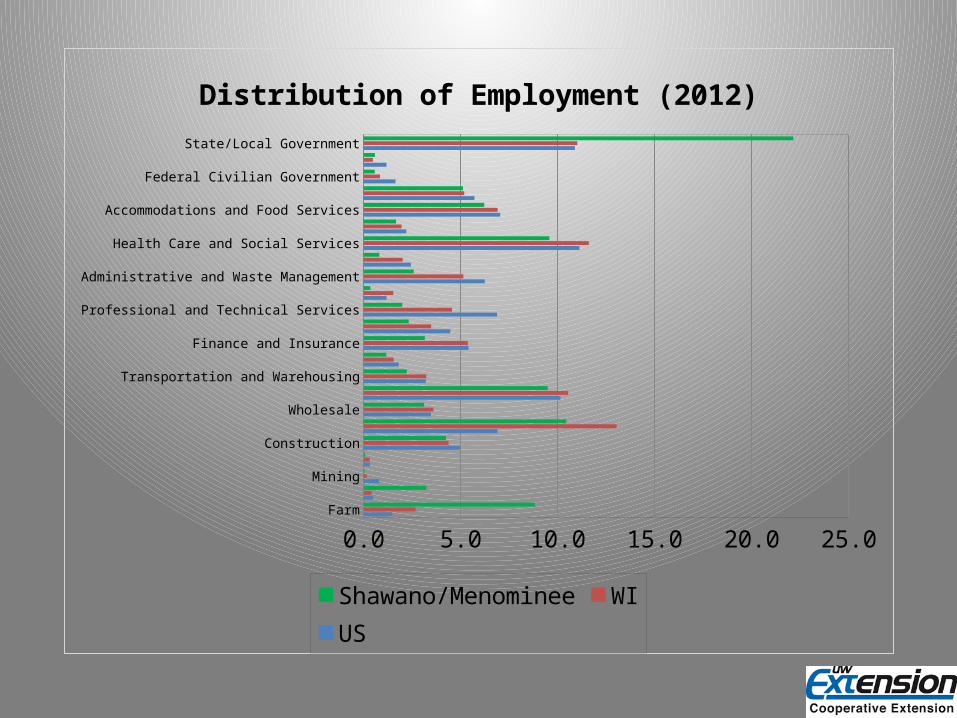
FarmForestry Fishing, Related Activities
MiningUtilities
ConstructionManufacturing
WholesaleRetail
Transportation and WarehousingInformation
Finance and InsuranceReal Estate, Rental and Leasing
Professional and Technical ServicesManagement of Companies
Administrative and Waste ManagementEducational Services
Health Care and Social ServicesArts, Entertainment and Recreation
Accommodations and Food ServicesOther Services except Public Administration
Federal Civilian GovernmentFederal Military
State/Local Government
0.0 5.0 10.0 15.0 20.0 25.0
Distribution of Employment (2012)
Shawano/Menominee WI US

Farm
Forestry Fishing, Related Activities
Mining
Utilities
Construction
Manufacturing
Wholesale
Retail
Transportation and Warehousing
Information
Finance and Insurance
Real Estate, Rental and Leasing
Professional and Technical Services
Management of Companies
Administrative and Waste Management
Educational Services
Health Care and Social Services
Arts, Entertainment and Recreation
Accommodations and Food Services
Other Services except Public Administration
Federal Civilian Government
Federal Military
State/Local Government
0.0 1.0 2.0 3.0 4.0 5.0 6.0 7.0 8.0 9.0
LQ Based on Wisconsin (2012)
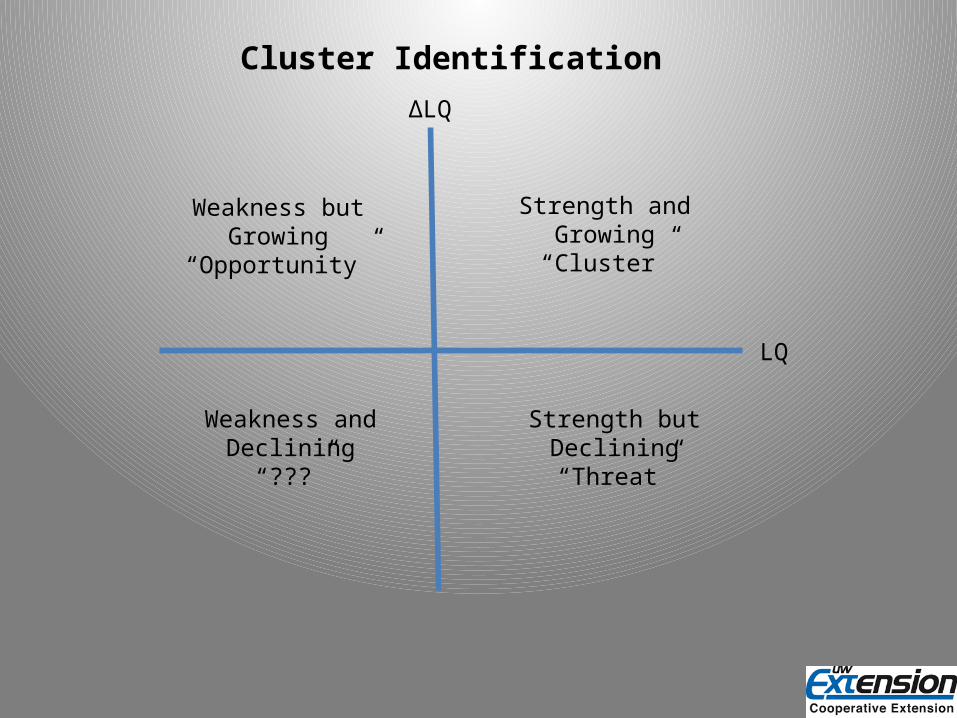
Cluster Identification∆LQ
LQ
Strength and Growing“Cluster”
Strength but Declining“Threat”
Weakness but Growing“Opportunity”
Weakness and Declining“???”
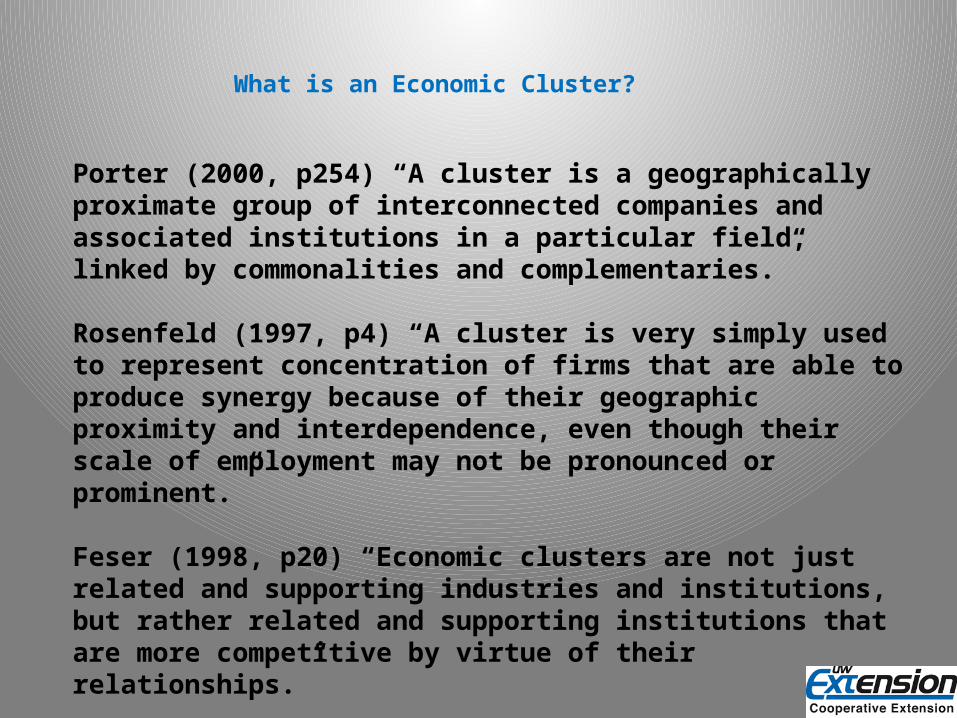
Porter (2000, p254) “A cluster is a geographically proximate group of interconnected companies and associated institutions in a particular field, linked by commonalities and complementaries.” Rosenfeld (1997, p4) “A cluster is very simply used to represent concentration of firms that are able to produce synergy because of their geographic proximity and interdependence, even though their scale of employment may not be pronounced or prominent.”
Feser (1998, p20) “Economic clusters are not just related and supporting industries and institutions, but rather related and supporting institutions that are more competitive by virtue of their relationships.”
What is an Economic Cluster?
0 1 2 3 4 5 6 7 8 9
-1.6
-1.4
-1.2
-1
-0.8
-0.6
-0.4
-0.2
0
0.2
0.4
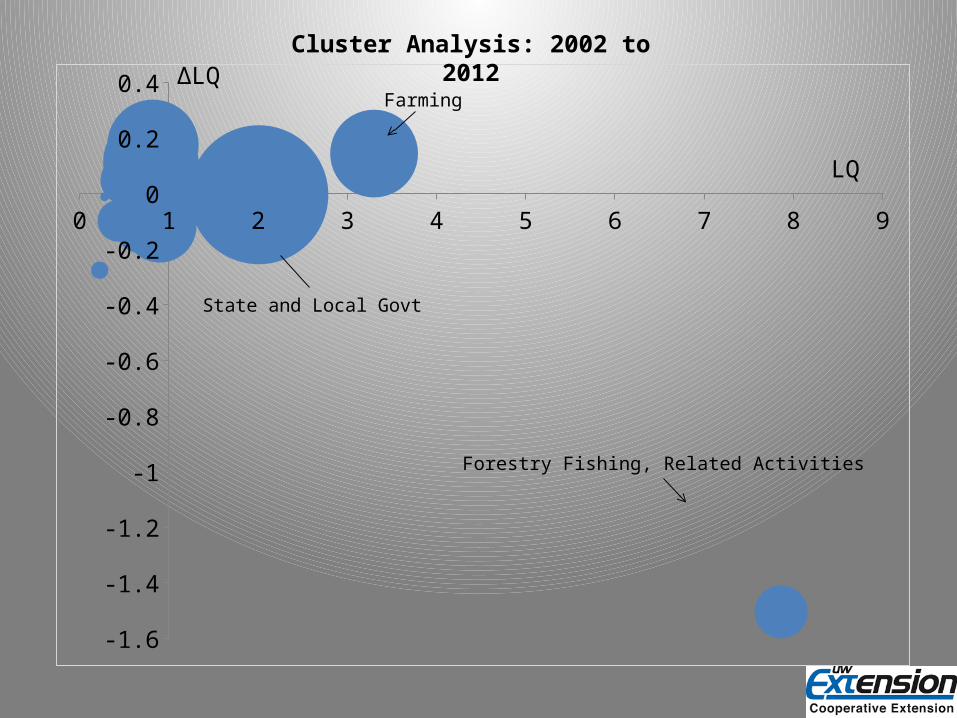
State and Local Govt
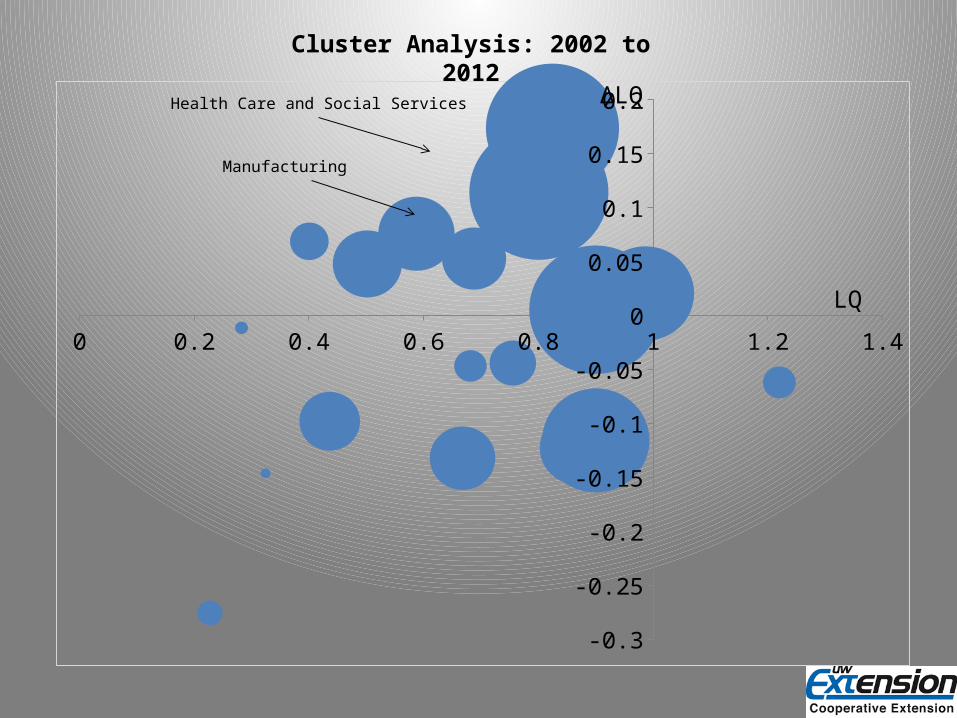
Cluster Analysis: 2002 to 2012∆LQ
LQ
Forestry Fishing, Related Activities
Farming
0 0.2 0.4 0.6 0.8 1 1.2 1.4
-0.3
-0.25
-0.2
-0.15
-0.1
-0.05
0
0.05
0.1
0.15
0.2
Cluster Analysis: 2002 to 2012
∆LQ
LQ
Health Care and Social Services
Manufacturing
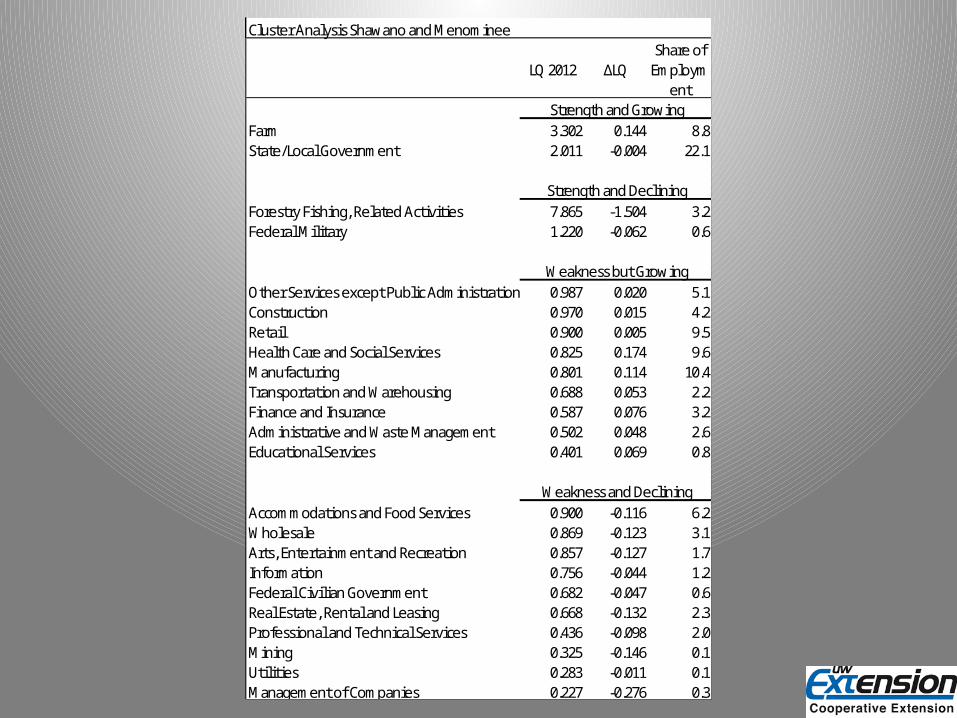
Cluster Analysis Shawano and Menominee
LQ 2012 ∆LQShare of
Employment
Strength and GrowingFarm 3.302 0.144 8.8State/Local Government 2.011 -0.004 22.1
Strength and DecliningForestry Fishing, Related Activities 7.865 -1.504 3.2Federal Military 1.220 -0.062 0.6
Weakness but GrowingOther Services except Public Administration 0.987 0.020 5.1Construction 0.970 0.015 4.2Retail 0.900 0.005 9.5Health Care and Social Services 0.825 0.174 9.6Manufacturing 0.801 0.114 10.4Transportation and Warehousing 0.688 0.053 2.2Finance and Insurance 0.587 0.076 3.2Administrative and Waste Management 0.502 0.048 2.6Educational Services 0.401 0.069 0.8
Weakness and DecliningAccommodations and Food Services 0.900 -0.116 6.2Wholesale 0.869 -0.123 3.1Arts, Entertainment and Recreation 0.857 -0.127 1.7Information 0.756 -0.044 1.2Federal Civilian Government 0.682 -0.047 0.6Real Estate, Rental and Leasing 0.668 -0.132 2.3Professional and Technical Services 0.436 -0.098 2.0Mining 0.325 -0.146 0.1Utilities 0.283 -0.011 0.1Management of Companies 0.227 -0.276 0.3
19701972
19741976
19781980
19821984
19861988
19901992
19941996
19982000
20022004
20062008
20102012
90
140
190
240
290
340
390
440
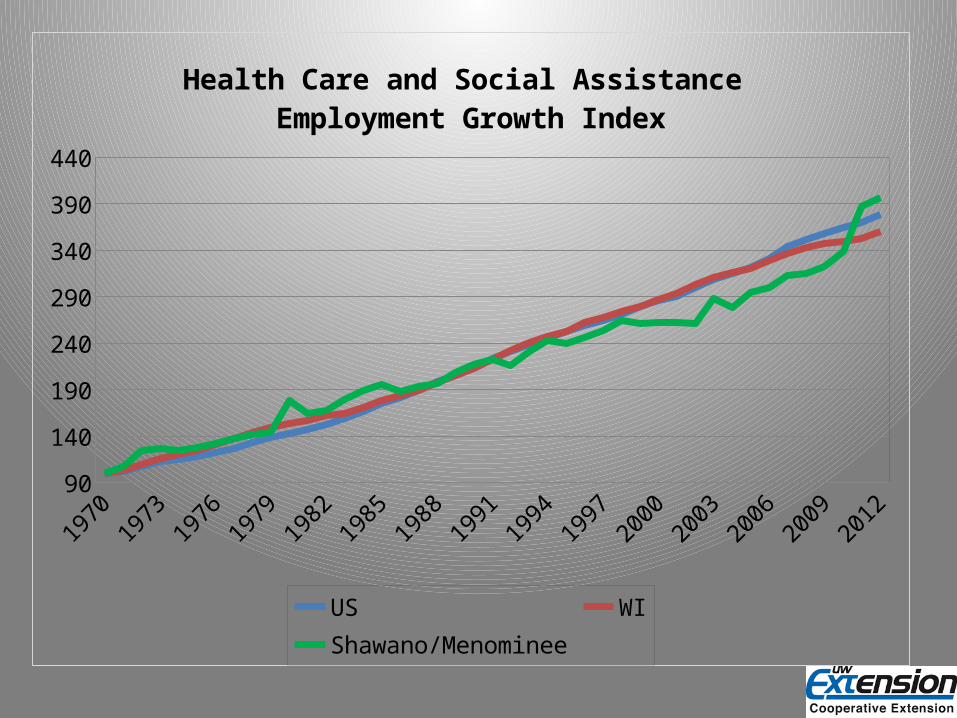
Health Care and Social Assistance Employment Growth Index
US WI Shawano/Menominee

19701972
19741976
19781980
19821984
19861988
19901992
19941996
19982000
20022004
20062008
20102012
50
70
90
110
130
150
170
190
210
230
250
Manufacturing Employment Growth Index
US WI Shawano/Menominee
19701972
19741976
19781980
19821984
19861988
19901992
19941996
19982000
20022004
20062008
20102012
50
100
150
200
250
300
350
400
450
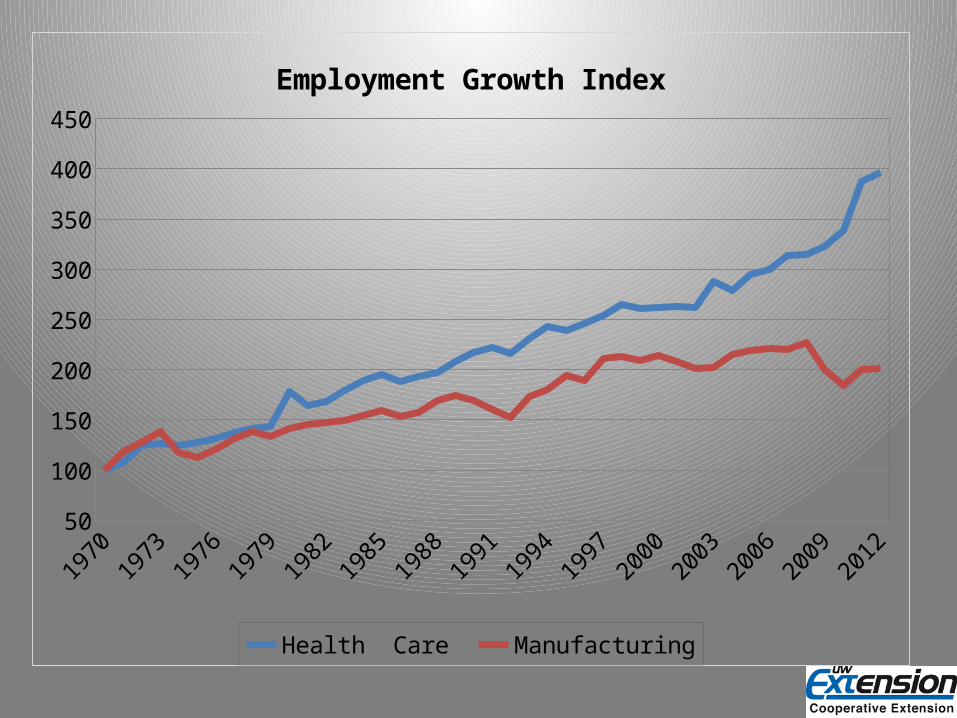
Employment Growth Index
Health Care Manufacturing
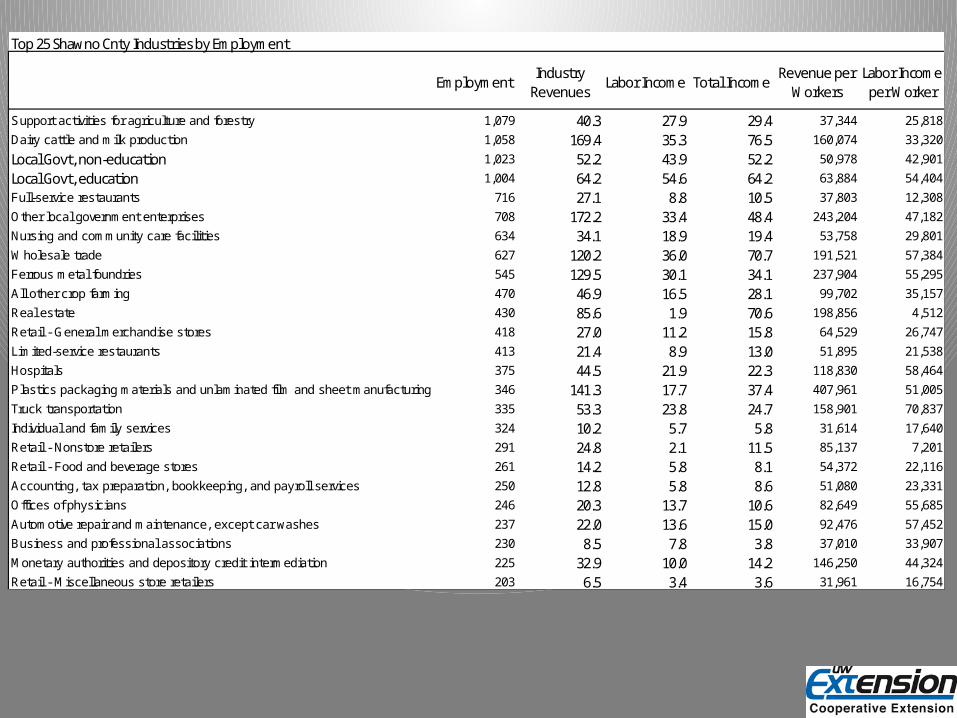
Top 25 Shawno Cnty Industries by Employment
EmploymentIndustry
RevenuesLabor Income Total Income
Revenue per Workers
Labor Income per Worker
Support activities for agriculture and forestry 1,079 40.3 27.9 29.4 37,344 25,818
Dairy cattle and milk production 1,058 169.4 35.3 76.5 160,074 33,320
Local Govt, non-education 1,023 52.2 43.9 52.2 50,978 42,901
Local Govt, education 1,004 64.2 54.6 64.2 63,884 54,404
Full-service restaurants 716 27.1 8.8 10.5 37,803 12,308
Other local government enterprises 708 172.2 33.4 48.4 243,204 47,182
Nursing and community care facilities 634 34.1 18.9 19.4 53,758 29,801
Wholesale trade 627 120.2 36.0 70.7 191,521 57,384
Ferrous metal foundries 545 129.5 30.1 34.1 237,904 55,295
All other crop farming 470 46.9 16.5 28.1 99,702 35,157
Real estate 430 85.6 1.9 70.6 198,856 4,512
Retail - General merchandise stores 418 27.0 11.2 15.8 64,529 26,747
Limited-service restaurants 413 21.4 8.9 13.0 51,895 21,538
Hospitals 375 44.5 21.9 22.3 118,830 58,464
Plastics packaging materials and unlaminated film and sheet manufacturing 346 141.3 17.7 37.4 407,961 51,005
Truck transportation 335 53.3 23.8 24.7 158,901 70,837
Individual and family services 324 10.2 5.7 5.8 31,614 17,640
Retail - Nonstore retailers 291 24.8 2.1 11.5 85,137 7,201
Retail - Food and beverage stores 261 14.2 5.8 8.1 54,372 22,116
Accounting, tax preparation, bookkeeping, and payroll services 250 12.8 5.8 8.6 51,080 23,331
Offices of physicians 246 20.3 13.7 10.6 82,649 55,685
Automotive repair and maintenance, except car washes 237 22.0 13.6 15.0 92,476 57,452
Business and professional associations 230 8.5 7.8 3.8 37,010 33,907
Monetary authorities and depository credit intermediation 225 32.9 10.0 14.2 146,250 44,324
Retail - Miscellaneous store retailers 203 6.5 3.4 3.6 31,961 16,754
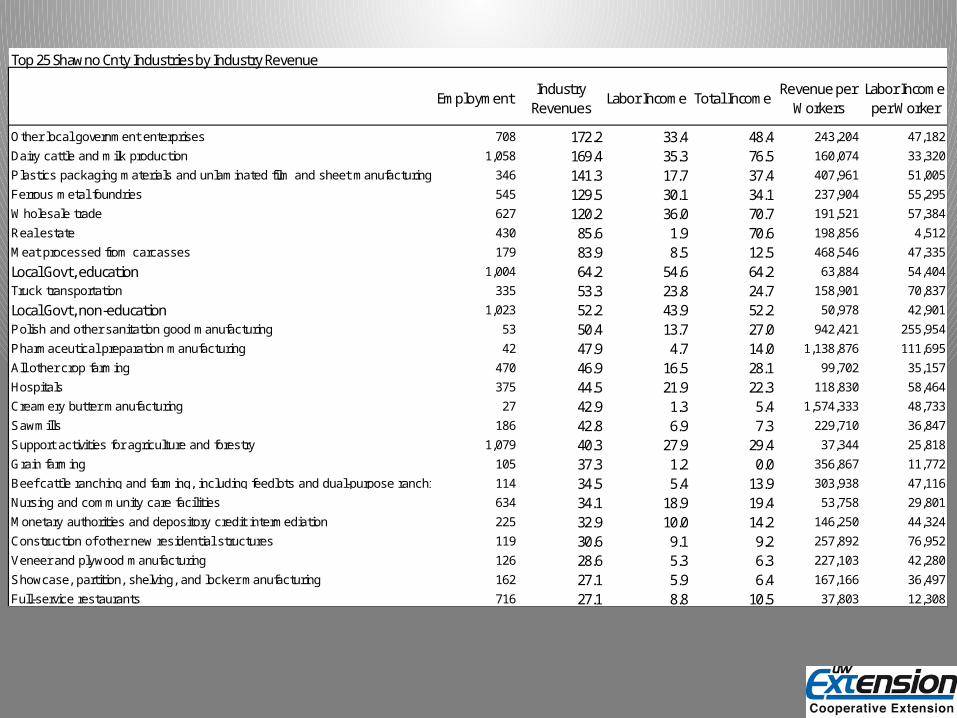
Top 25 Shawno Cnty Industries by Industry Revenue
EmploymentIndustry
RevenuesLabor Income Total Income
Revenue per Workers
Labor Income per Worker
Other local government enterprises 708 172.2 33.4 48.4 243,204 47,182
Dairy cattle and milk production 1,058 169.4 35.3 76.5 160,074 33,320
Plastics packaging materials and unlaminated film and sheet manufacturing 346 141.3 17.7 37.4 407,961 51,005
Ferrous metal foundries 545 129.5 30.1 34.1 237,904 55,295
Wholesale trade 627 120.2 36.0 70.7 191,521 57,384
Real estate 430 85.6 1.9 70.6 198,856 4,512
Meat processed from carcasses 179 83.9 8.5 12.5 468,546 47,335
Local Govt, education 1,004 64.2 54.6 64.2 63,884 54,404
Truck transportation 335 53.3 23.8 24.7 158,901 70,837
Local Govt, non-education 1,023 52.2 43.9 52.2 50,978 42,901
Polish and other sanitation good manufacturing 53 50.4 13.7 27.0 942,421 255,954
Pharmaceutical preparation manufacturing 42 47.9 4.7 14.0 1,138,876 111,695
All other crop farming 470 46.9 16.5 28.1 99,702 35,157
Hospitals 375 44.5 21.9 22.3 118,830 58,464
Creamery butter manufacturing 27 42.9 1.3 5.4 1,574,333 48,733
Sawmills 186 42.8 6.9 7.3 229,710 36,847
Support activities for agriculture and forestry 1,079 40.3 27.9 29.4 37,344 25,818
Grain farming 105 37.3 1.2 0.0 356,867 11,772
Beef cattle ranching and farming, including feedlots and dual-purpose ranching and farming114 34.5 5.4 13.9 303,938 47,116
Nursing and community care facilities 634 34.1 18.9 19.4 53,758 29,801
Monetary authorities and depository credit intermediation 225 32.9 10.0 14.2 146,250 44,324
Construction of other new residential structures 119 30.6 9.1 9.2 257,892 76,952
Veneer and plywood manufacturing 126 28.6 5.3 6.3 227,103 42,280
Showcase, partition, shelving, and locker manufacturing 162 27.1 5.9 6.4 167,166 36,497
Full-service restaurants 716 27.1 8.8 10.5 37,803 12,308
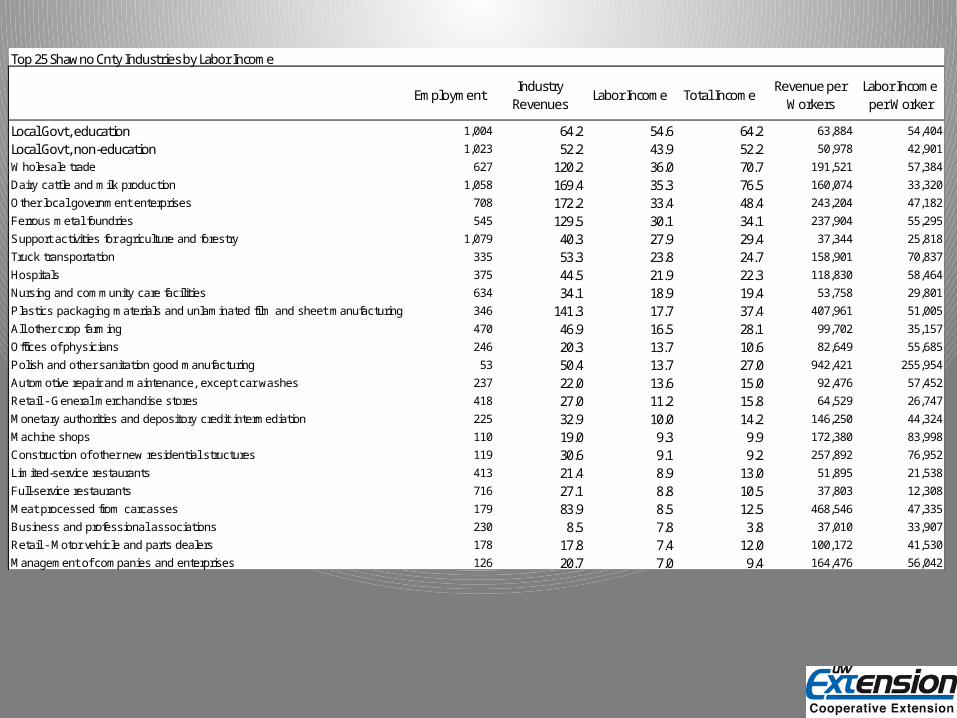
Top 25 Shawno Cnty Industries by Labor Income
EmploymentIndustry
RevenuesLabor Income Total Income
Revenue per Workers
Labor Income per Worker
Local Govt, education 1,004 64.2 54.6 64.2 63,884 54,404
Local Govt, non-education 1,023 52.2 43.9 52.2 50,978 42,901
Wholesale trade 627 120.2 36.0 70.7 191,521 57,384
Dairy cattle and milk production 1,058 169.4 35.3 76.5 160,074 33,320
Other local government enterprises 708 172.2 33.4 48.4 243,204 47,182
Ferrous metal foundries 545 129.5 30.1 34.1 237,904 55,295
Support activities for agriculture and forestry 1,079 40.3 27.9 29.4 37,344 25,818
Truck transportation 335 53.3 23.8 24.7 158,901 70,837
Hospitals 375 44.5 21.9 22.3 118,830 58,464
Nursing and community care facilities 634 34.1 18.9 19.4 53,758 29,801
Plastics packaging materials and unlaminated film and sheet manufacturing 346 141.3 17.7 37.4 407,961 51,005
All other crop farming 470 46.9 16.5 28.1 99,702 35,157
Offices of physicians 246 20.3 13.7 10.6 82,649 55,685
Polish and other sanitation good manufacturing 53 50.4 13.7 27.0 942,421 255,954
Automotive repair and maintenance, except car washes 237 22.0 13.6 15.0 92,476 57,452
Retail - General merchandise stores 418 27.0 11.2 15.8 64,529 26,747
Monetary authorities and depository credit intermediation 225 32.9 10.0 14.2 146,250 44,324
Machine shops 110 19.0 9.3 9.9 172,380 83,998
Construction of other new residential structures 119 30.6 9.1 9.2 257,892 76,952
Limited-service restaurants 413 21.4 8.9 13.0 51,895 21,538
Full-service restaurants 716 27.1 8.8 10.5 37,803 12,308
Meat processed from carcasses 179 83.9 8.5 12.5 468,546 47,335
Business and professional associations 230 8.5 7.8 3.8 37,010 33,907
Retail - Motor vehicle and parts dealers 178 17.8 7.4 12.0 100,172 41,530
Management of companies and enterprises 126 20.7 7.0 9.4 164,476 56,042
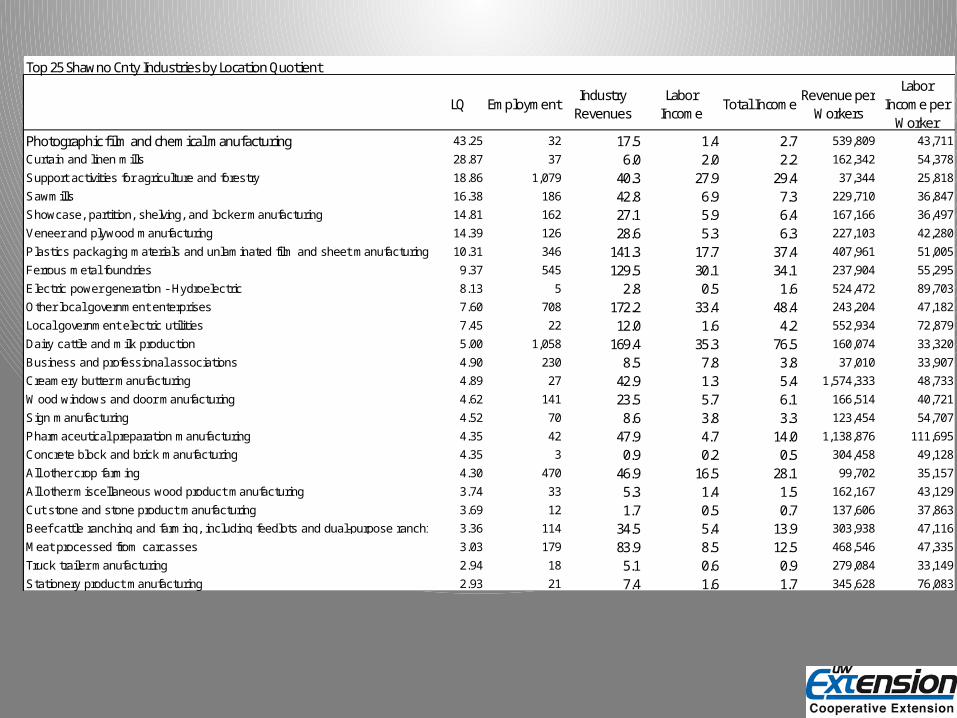
Top 25 Shawno Cnty Industries by Location Quotient
LQ EmploymentIndustry
RevenuesLabor
IncomeTotal Income
Revenue per Workers
Labor Income per
WorkerPhotographic film and chemical manufacturing 43.25 32 17.5 1.4 2.7 539,809 43,711
Curtain and linen mills 28.87 37 6.0 2.0 2.2 162,342 54,378
Support activities for agriculture and forestry 18.86 1,079 40.3 27.9 29.4 37,344 25,818
Sawmills 16.38 186 42.8 6.9 7.3 229,710 36,847
Showcase, partition, shelving, and locker manufacturing 14.81 162 27.1 5.9 6.4 167,166 36,497
Veneer and plywood manufacturing 14.39 126 28.6 5.3 6.3 227,103 42,280
Plastics packaging materials and unlaminated film and sheet manufacturing 10.31 346 141.3 17.7 37.4 407,961 51,005
Ferrous metal foundries 9.37 545 129.5 30.1 34.1 237,904 55,295
Electric power generation - Hydroelectric 8.13 5 2.8 0.5 1.6 524,472 89,703
Other local government enterprises 7.60 708 172.2 33.4 48.4 243,204 47,182
Local government electric utilities 7.45 22 12.0 1.6 4.2 552,934 72,879
Dairy cattle and milk production 5.00 1,058 169.4 35.3 76.5 160,074 33,320
Business and professional associations 4.90 230 8.5 7.8 3.8 37,010 33,907
Creamery butter manufacturing 4.89 27 42.9 1.3 5.4 1,574,333 48,733
Wood windows and door manufacturing 4.62 141 23.5 5.7 6.1 166,514 40,721
Sign manufacturing 4.52 70 8.6 3.8 3.3 123,454 54,707
Pharmaceutical preparation manufacturing 4.35 42 47.9 4.7 14.0 1,138,876 111,695
Concrete block and brick manufacturing 4.35 3 0.9 0.2 0.5 304,458 49,128
All other crop farming 4.30 470 46.9 16.5 28.1 99,702 35,157
All other miscellaneous wood product manufacturing 3.74 33 5.3 1.4 1.5 162,167 43,129
Cut stone and stone product manufacturing 3.69 12 1.7 0.5 0.7 137,606 37,863
Beef cattle ranching and farming, including feedlots and dual-purpose ranching and farming3.36 114 34.5 5.4 13.9 303,938 47,116
Meat processed from carcasses 3.03 179 83.9 8.5 12.5 468,546 47,335
Truck trailer manufacturing 2.94 18 5.1 0.6 0.9 279,084 33,149
Stationery product manufacturing 2.93 21 7.4 1.6 1.7 345,628 76,083
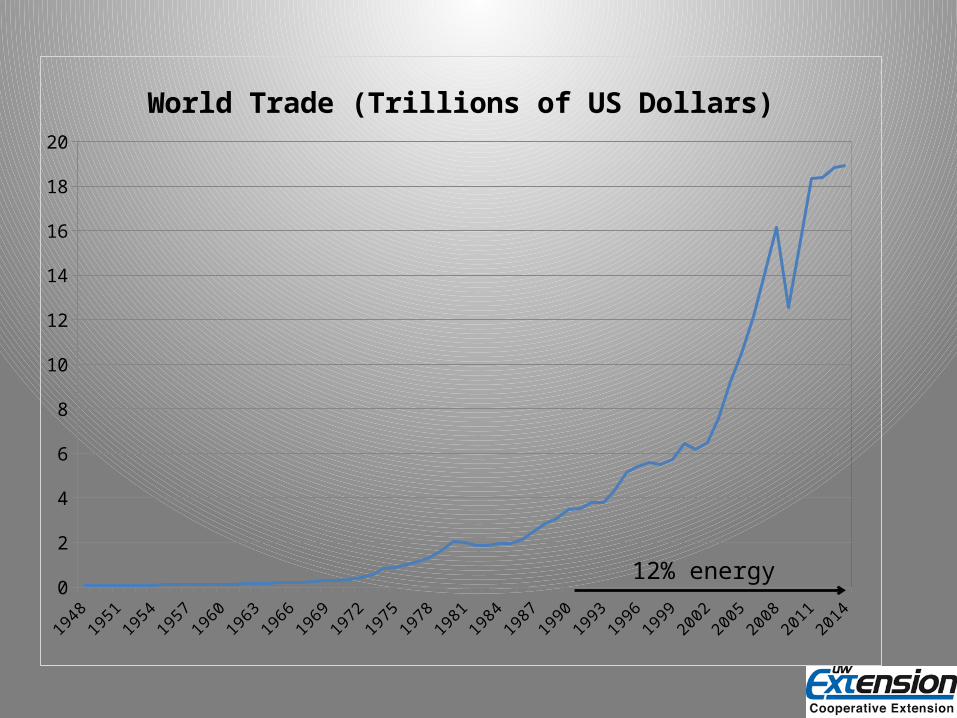
19481950
19521954
19561958
19601962
19641966
19681970
19721974
19761978
19801982
19841986
19881990
19921994
19961998
20002002
20042006
20082010
20122014
0
2
4
6
8
10
12
14
16
18
20
World Trade (Trillions of US Dollars)
12% energy

1992-01-01
1992-10-01
1993-07-01
1994-04-01
1995-01-01
1995-10-01
1996-07-01
1997-04-01
1998-01-01
1998-10-01
1999-07-01
2000-04-01
2001-01-01
2001-10-01
2002-07-01
2003-04-01
2004-01-01
2004-10-01
2005-07-01
2006-04-01
2007-01-01
2007-10-01
2008-07-01
2009-04-01
2010-01-01
2010-10-01
2011-07-01
2012-04-01
2013-01-01
2013-10-01
2014-07-01-90,000
-80,000
-70,000
-60,000
-50,000
-40,000
-30,000
-20,000
-10,000
0
Trade Balance: Goods, Balance of Payments Basis (MM$)
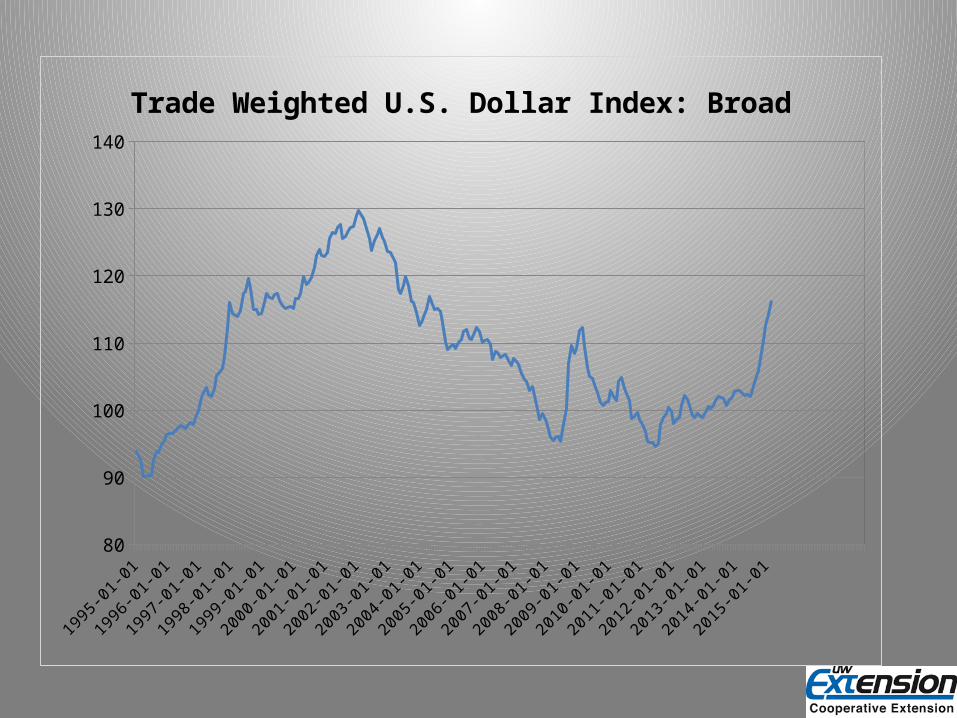
1995-01-01
1995-09-01
1996-05-01
1997-01-01
1997-09-01
1998-05-01
1999-01-01
1999-09-01
2000-05-01
2001-01-01
2001-09-01
2002-05-01
2003-01-01
2003-09-01
2004-05-01
2005-01-01
2005-09-01
2006-05-01
2007-01-01
2007-09-01
2008-05-01
2009-01-01
2009-09-01
2010-05-01
2011-01-01
2011-09-01
2012-05-01
2013-01-01
2013-09-01
2014-05-01
2015-01-0180
90
100
110
120
130
140
Trade Weighted U.S. Dollar Index: Broad
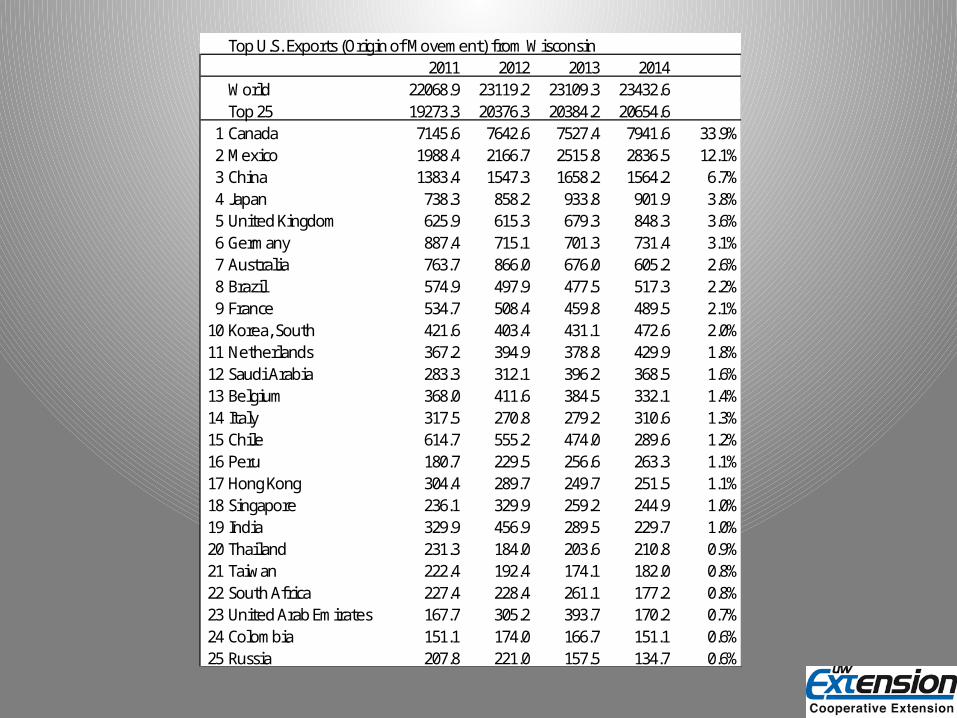
Top U.S. Exports (Origin of Movement) from Wisconsin2011 2012 2013 2014
World 22068.9 23119.2 23109.3 23432.6Top 25 19273.3 20376.3 20384.2 20654.6
1 Canada 7145.6 7642.6 7527.4 7941.6 33.9%2 Mexico 1988.4 2166.7 2515.8 2836.5 12.1%3 China 1383.4 1547.3 1658.2 1564.2 6.7%4 Japan 738.3 858.2 933.8 901.9 3.8%5 United Kingdom 625.9 615.3 679.3 848.3 3.6%6 Germany 887.4 715.1 701.3 731.4 3.1%7 Australia 763.7 866.0 676.0 605.2 2.6%8 Brazil 574.9 497.9 477.5 517.3 2.2%9 France 534.7 508.4 459.8 489.5 2.1%
10 Korea, South 421.6 403.4 431.1 472.6 2.0%11 Netherlands 367.2 394.9 378.8 429.9 1.8%12 Saudi Arabia 283.3 312.1 396.2 368.5 1.6%13 Belgium 368.0 411.6 384.5 332.1 1.4%14 Italy 317.5 270.8 279.2 310.6 1.3%15 Chile 614.7 555.2 474.0 289.6 1.2%16 Peru 180.7 229.5 256.6 263.3 1.1%17 Hong Kong 304.4 289.7 249.7 251.5 1.1%18 Singapore 236.1 329.9 259.2 244.9 1.0%19 India 329.9 456.9 289.5 229.7 1.0%20 Thailand 231.3 184.0 203.6 210.8 0.9%21 Taiwan 222.4 192.4 174.1 182.0 0.8%22 South Africa 227.4 228.4 261.1 177.2 0.8%23 United Arab Emirates 167.7 305.2 393.7 170.2 0.7%24 Colombia 151.1 174.0 166.7 151.1 0.6%25 Russia 207.8 221.0 157.5 134.7 0.6%
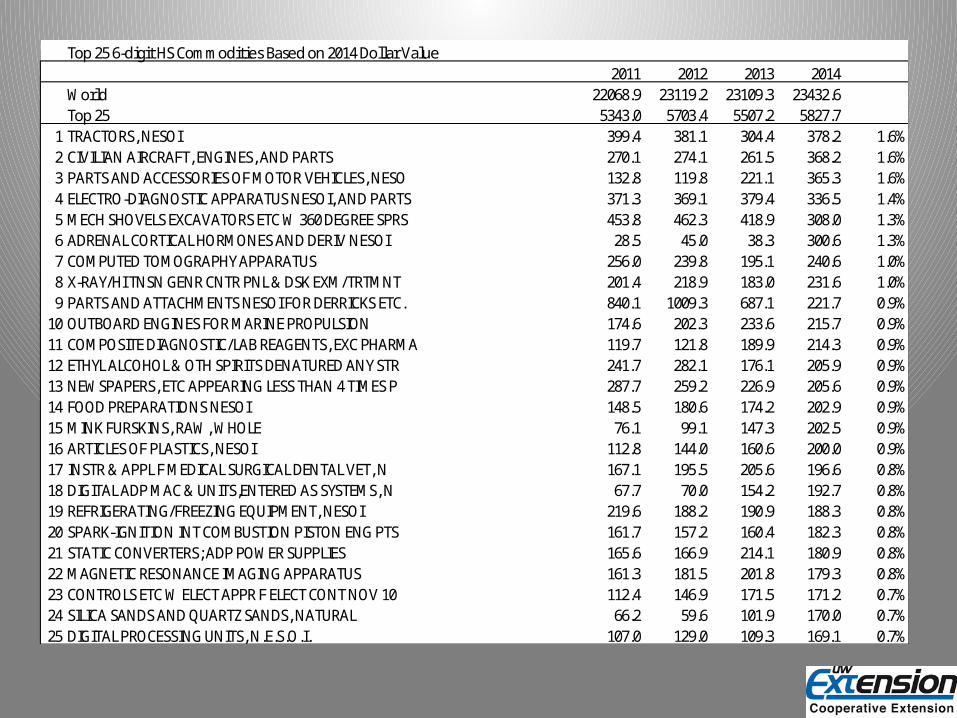
Top 25 6-digit HS Commodities Based on 2014 Dollar Value2011 2012 2013 2014
World 22068.9 23119.2 23109.3 23432.6Top 25 5343.0 5703.4 5507.2 5827.7
1 TRACTORS, NESOI 399.4 381.1 304.4 378.2 1.6%2 CIVILIAN AIRCRAFT, ENGINES, AND PARTS 270.1 274.1 261.5 368.2 1.6%3 PARTS AND ACCESSORIES OF MOTOR VEHICLES, NESO 132.8 119.8 221.1 365.3 1.6%4 ELECTRO-DIAGNOSTIC APPARATUS NESOI, AND PARTS 371.3 369.1 379.4 336.5 1.4%5 MECH SHOVELS EXCAVATORS ETC W 360 DEGREE SPRS 453.8 462.3 418.9 308.0 1.3%6 ADRENAL CORTICAL HORMONES AND DERIV NESOI 28.5 45.0 38.3 300.6 1.3%7 COMPUTED TOMOGRAPHY APPARATUS 256.0 239.8 195.1 240.6 1.0%8 X-RAY/HI TNSN GENR CNTR PNL & DSK EXM/TRTMNT 201.4 218.9 183.0 231.6 1.0%9 PARTS AND ATTACHMENTS NESOI FOR DERRICKS ETC. 840.1 1009.3 687.1 221.7 0.9%
10 OUTBOARD ENGINES FOR MARINE PROPULSION 174.6 202.3 233.6 215.7 0.9%11 COMPOSITE DIAGNOSTIC/LAB REAGENTS, EXC PHARMA 119.7 121.8 189.9 214.3 0.9%12 ETHYL ALCOHOL & OTH SPIRITS DENATURED ANY STR 241.7 282.1 176.1 205.9 0.9%13 NEWSPAPERS, ETC APPEARING LESS THAN 4 TIMES P 287.7 259.2 226.9 205.6 0.9%14 FOOD PREPARATIONS NESOI 148.5 180.6 174.2 202.9 0.9%15 MINK FURSKINS, RAW, WHOLE 76.1 99.1 147.3 202.5 0.9%16 ARTICLES OF PLASTICS, NESOI 112.8 144.0 160.6 200.0 0.9%17 INSTR & APPL F MEDICAL SURGICAL DENTAL VET, N 167.1 195.5 205.6 196.6 0.8%18 DIGITAL ADP MAC & UNITS,ENTERED AS SYSTEMS, N 67.7 70.0 154.2 192.7 0.8%19 REFRIGERATING/FREEZING EQUIPMENT, NESOI 219.6 188.2 190.9 188.3 0.8%20 SPARK-IGNITION INT COMBUSTION PISTON ENG PTS 161.7 157.2 160.4 182.3 0.8%21 STATIC CONVERTERS; ADP POWER SUPPLIES 165.6 166.9 214.1 180.9 0.8%22 MAGNETIC RESONANCE IMAGING APPARATUS 161.3 181.5 201.8 179.3 0.8%23 CONTROLS ETC W ELECT APPR F ELECT CONT NOV 10 112.4 146.9 171.5 171.2 0.7%24 SILICA SANDS AND QUARTZ SANDS, NATURAL 66.2 59.6 101.9 170.0 0.7%25 DIGITAL PROCESSING UNITS, N.E.S.O.I. 107.0 129.0 109.3 169.1 0.7%