what’s new with chopin technologies : let’s
TRANSCRIPT

" WHAT’S NEW WITH CHOPIN
TECHNOLOGIES : LET’S
BRING THE ULTIMATE TOOLS
TO MAKE YOUR LIFE EASIER"
Charles Loubersac d'Hotel,EXPORT SALES MANAGER, Chopin Technologies SAS

Chopin Technologies, part of Tripette & Renaud group, has been one of the leader
for the equipment of the milling industries since 1836
The unique position of Chopin Technologies on the market is to be innovative leader
with the largest range of products throughout all the quality control cereal industry.
CHOPIN Technologies being one of the leading companies in the field of laboratory
equipment for quality control of grain and its derivatives is proud to share its latest
innovations.

Chopin Innovations :
Infraneo : The milling-minded infrared
Mixolab Profiler
New objectives in QC & Chopin’s answers

Control & optimization of your milling
process with the CHOPIN
Technologies Infraneo® Junior
=>

Infraneo :The milling-minded infrared
• Intake, conditioning, milling, by-product flours ;
the Infraneo tune your control at each step of
wheat transformation

Select your requirements
Product Parameters
Wheat Moisture, Proteins, wet Gluten, Zeleny, W
FlourMoisture, Proteins, ash, wet gluten, zeleny, water absorption, starch damage, W
Bran Moisture, Proteins, ash, starch, Cellulose
Midlings Moisture, Proteins, ash, starch, Cellulose
Wheat gluten Moisture, Proteins,
Barley Moisture, Proteins,
Corn Moisture, Proteins, starch, fat
…/… …/…
Large choice of available calibration Calibrations developped on the Infraneo Senior

The Mixolab
ICC Standard N° 173
AACC 54-60.01

The Mixolab System
Mixolab System
Mixolab Standard Mixolab Simulator Mixolab Profiler
0,0
1,0
2,0
3,0
4,0
5,0
6,0
7,0
8,0
9,0
Indice absorption
Indice Petrissage
Indice gluten
indice viscosité
Indice résistance amylolyse
Indice rétrogradation
Mini
Maxi
Ideal tool for your own
R&D,
the Mixolab Standard
brings the entire & detailed
information on your raw
material. (protocol with
standard ICC n° 173 AACC
54-60.01) both flour &
grinded wheat
Comparative tool for the
Quality control,
the Mixolab simulator let you
compare your data with your
commercial partners, by using
the regular existing analytical
tools.
Perfect tool for the Quality
control of your raw
materials. With the Mixolab
profiler, you control, select,
discrimitate & improve your
raw material safely.

Mixolab Profiler
The consistency tool
Mixolab Profiler
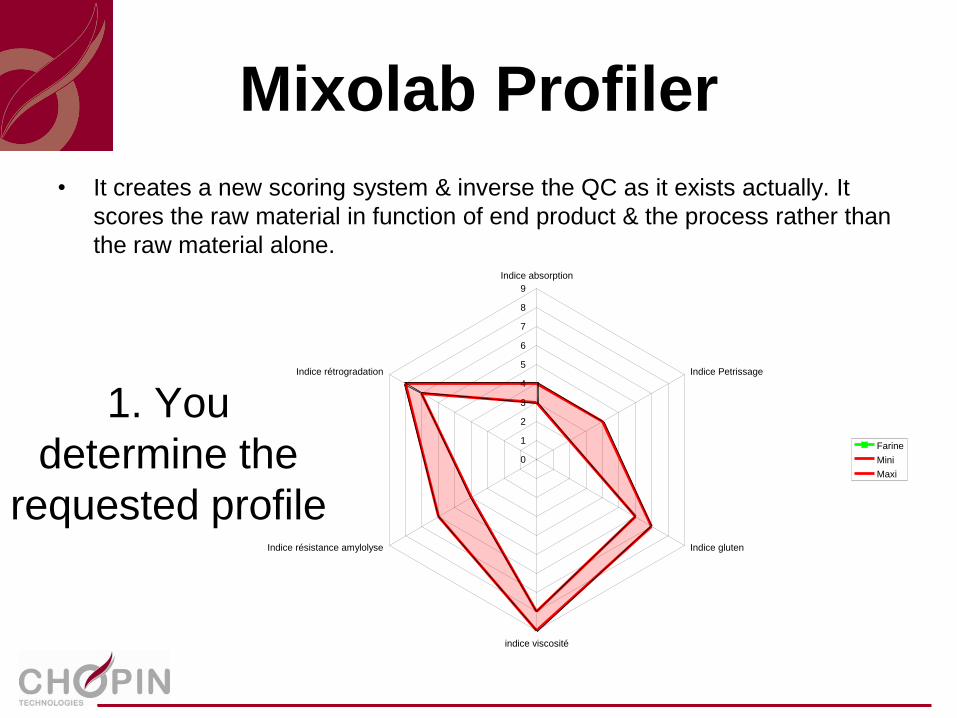
• It creates a new scoring system & inverse the QC as it exists actually. It
scores the raw material in function of end product & the process rather than
the raw material alone.
1. You
determine the
requested profile
0
1
2
3
4
5
6
7
8
9
Indice absorption
Indice Petrissage
Indice gluten
indice viscosité
Indice résistance amylolyse
Indice rétrogradation
Farine
Mini
Maxi
Mixolab Profiler
• Based on the complete rheological analysis of the dough - the
Mixolab Profiler displays the Mixolab Standard (ICC 173 AACC 54-
60.01) curve in functional and understandable way.
• With the standard test, you obtain the comprehensive analysis of :
water absorption, development time, stability and weakening of
gluten, gluten resistance to heating, gelatinization of starch, amylase
activity during baking, retrogradation of starch.
• With the profiler there are functional parameters of quality scored
from 0 to 9 and displayed on a 6 axis graph creating the quality
Profile.

How to create a profile
• its creation is easy : it can be done with a dozen of analyses of flours that bring satisfaction.
• The profile is based on the maximum & minimum values of each index.
• It discriminate accurately a flour according to its end use.
0
1
2
3
4
5
6
7
8
9
Indice absorption
Indice Petrissage
Indice gluten
indice viscosité
Indice résistance amylolyse
Indice rétrogradation
Farine
Mini
Maxi

2 : run the test…
the index step by step
0
10
20
30
40
50
60
70
80
90
100
0 500 1000 1500 2000 2500
0
0,5
1
1,5
2
2,5
3
3,5
4
3
0
1
2
3
4
5
6
7
8
9
Indice absorption
Indice Petrissage
Indice gluten
indice viscosité
Indice résistance amylolyse
Indice rétrogradation
Farine
Mini
Maxi
1st index :
Water absoption.
According to the flour
components (proteines,
starch, fibers…).
Influence on the dough
yield (benefit).
Higher is the index
more your flour
absorbs water

2 : run the test…
the index step by step
0
10
20
30
40
50
60
70
80
90
100
0 500 1000 1500 2000 2500
0
0,5
1
1,5
2
2,5
3
3,5
4
3
3
0
1
2
3
4
5
6
7
8
9
Indice absorption
Indice Petrissage
Indice gluten
indice viscosité
Indice résistance amylolyse
Indice rétrogradation
Farine
Mini
Maxi
2nd index:
Mixing behaviour.
This index gives an
information on the
behaviour of the flour
when kneading at 30°C. It
manages the stability,
DDT and weakening…
The higher is the index
the more stable will be
the flour when
kneading.

2 : run the test…
the index step by step
0
10
20
30
40
50
60
70
80
90
100
0 500 1000 1500 2000 2500
0
0,5
1
1,5
2
2,5
3
3,5
4
3
7
3
0
1
2
3
4
5
6
7
8
9
Indice absorption
Indice Petrissage
Indice gluten
indice viscosité
Indice résistance amylolyse
Indice rétrogradation
Farine
Mini
Maxi
3rd index:
Gluten index.
This is for the behaviour
of the gluten when
heating the dough.
The higher is the index
the more resistant to
constraint the gluten
will be.

2 : run the test…
the index step by step
0
10
20
30
40
50
60
70
80
90
100
0 500 1000 1500 2000 2500
0
0,5
1
1,5
2
2,5
3
3,5
4
3
8
7
3
0
1
2
3
4
5
6
7
8
9
Indice absorption
Indice Petrissage
Indice gluten
indice viscosité
Indice résistance amylolyse
Indice rétrogradation
Farine
Mini
Maxi
4th index:
The viscosity.
The increase of the
viscosity during that
phase relies on both the
amylasic activity & the
starch quality.
The higher is the index
the more viscous the
dough facing heating
will be.

2 : run the test…
the index step by step
0
10
20
30
40
50
60
70
80
90
100
0 500 1000 1500 2000 2500
0
0,5
1
1,5
2
2,5
3
3,5
4
3
8
5
7
3
0
1
2
3
4
5
6
7
8
9
Indice absorption
Indice Petrissage
Indice gluten
indice viscosité
Indice résistance amylolyse
Indice rétrogradation
Farine
Mini
Maxi
5th index:
Amylolysis resistance.
This is according to the
starch ability to
« resist » to the
amylolysis.
The higher is the index
the lower is the
amylasic acitvity.

2 : run the test…
the index step by step
0
10
20
30
40
50
60
70
80
90
100
0 500 1000 1500 2000 2500
0
0,5
1
1,5
2
2,5
3
3,5
4
3
8
5
7
38
0
1
2
3
4
5
6
7
8
9
Indice absorption
Indice Petrissage
Indice gluten
indice viscosité
Indice résistance amylolyse
Indice rétrogradation
Farine
Mini
Maxi
Mixolab index
37-858(3)
6th index :
Set back or
retrogradation.
The set back is
according to the starch
and its hydrolysis during
the test.
The higher is the index
the shorter will be the
final product shelf life.

Is the profiler an added value for
your lab ?
By creating the requested quality profile and checking if
grain or flour perfectly matches it, you avoid problems on
production line. It guarantees 100% consistency.
If not matching, the system suggests which points must be
improved and even how!
Due to its versatility, comprehensive & accurate way of
reversing the dough rheology for the functionalities of the
flours, you improve and manage the quality of your
production in perfect accordance to customer’s needs.
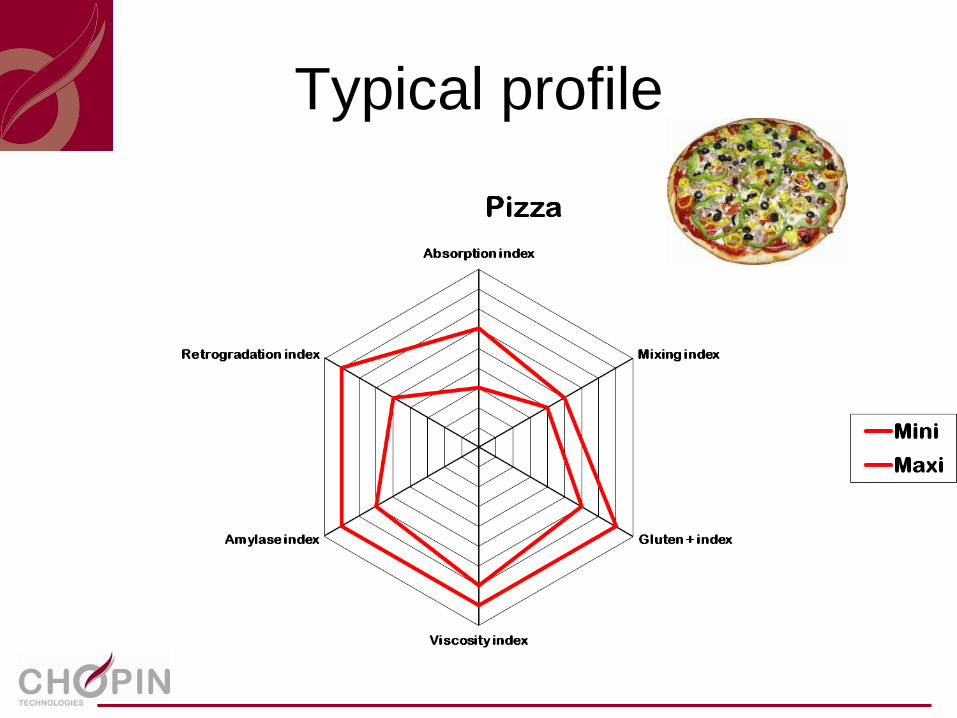
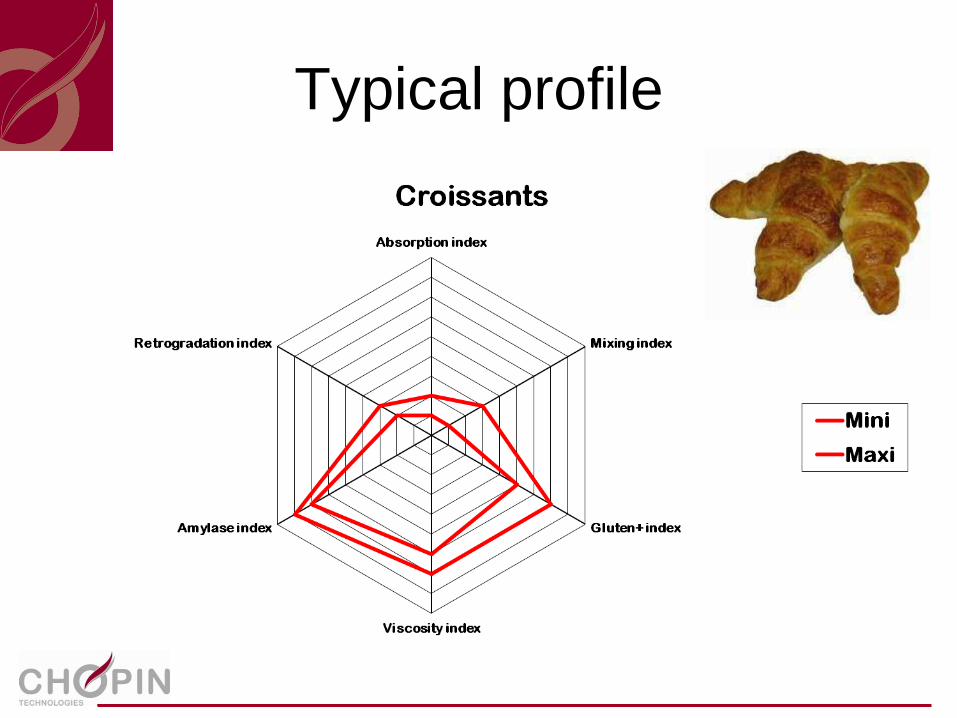
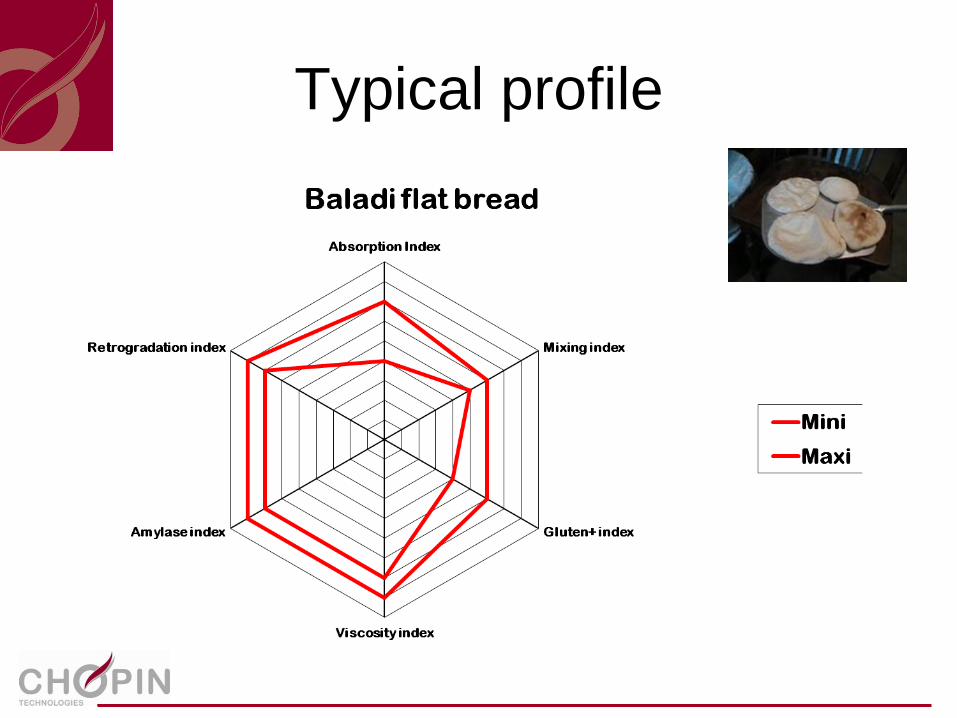
Typical profile
Typical profile
Typical profile

Typical profile

Typical profile

Typical profile, according to the
process

Typical profile, according to the
process

The entire profile completely discriminates the 3 types of flour.
Some examples & profiles

New objective in QC
Dietary fiber : Whole meal &
Fiber trend, digestilibity,
gluten free
On the alveograph
On the Mixolab
On the Sdmatic
../..

Why Whole Grain becomes a Hot Fashion?
• It sounds good
• It looks good
• It is indeed good for you!
Scientific Evidences have Suggested:
• Improve Heart Health and Control Blood Pressure
• Control Body Weight
• Reduce the Risk of Diabetes
• Reduces Risk of Certain Cancers
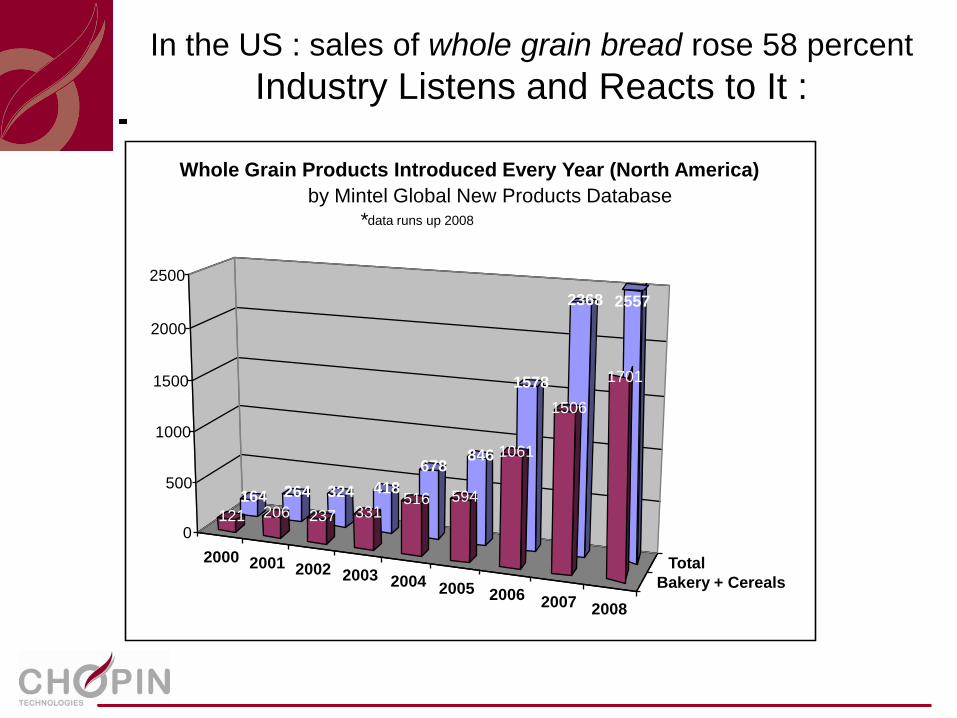
In the US : sales of whole grain bread rose 58 percent
Industry Listens and Reacts to It :
2000 2001 2002 2003 2004 2005 2006 2007 2008
Bakery + Cereals
Total
164 264 324 418
678846
1578
2368 2557
121 206 237 331516 594
1061
1506
1701
0
500
1000
1500
2000
2500
Whole Grain Products Introduced Every Year (North America)
by Mintel Global New Products Database
*data runs up 2008

So, go Whole grain ! !
Whole grain ingredients and products is good for your health : more vitamins, minerals, phytochemicals and complex carbohydrates.
But the challenge is : - Keep excellent eating quality as well. Whole Grain flour shall not
impact good taste, texture and appearance.
- Physical properties of whole grain flour must be maintained toassure quality & consistency. Absorption, particle size distribution,macroscopic nutrient retention (i.e. fiber) influence baking functionand finished product attributes such as color, geometry, and bakedmoisture loss. Freshness/shelf-life shall remain as good.
- Functional attributes of whole grain flour and potential methods toassess whole grain flour quality BUT most of available devices areonly considering flour properly

Chopin’s answers to new
challenges in QC
1- CT center : a dedicated application laboratory
for our customers
2- partnerships with the Industry : millers & bakers
3- dedication, listening user’s needs and R&D
4- international lobbying & standardization

Safety,
innovation,
confort &
savings
Thank you for
your attention…
Questions ?
See us Booth 40