what’s so special about special economic zones? china’s ...web.isanet.org/web/conferences/ap...
TRANSCRIPT
What’s So Special about Special Economic Zones?China’s National and Provincial-Level Development Zones
April A. Herlevi ∗
June 18, 2016
Abstract
The competition for capital is a key facet of the global economic system. Countries increasinglyuse special economic zones (SEZs) to attract foreign direct investment (FDI) and achieve othereconomic objectives. China’s Shenzhen is often cited as the original SEZ model but China hasover 1,500 zones and more than seven different zone programs. This paper addresses several keyresearch questions. First, what are the characteristics of China’s various zone programs? Are theresubstantive differences between these programs and, if so, what are they? To answer these ques-tions, I conducted a review of China’s zone programs and compared zones within one province,Zhejiang. By properly characterizing zones and conducting an intra-provincial comparison, thispaper provides a foundation to assess the effects of SEZs on FDI, capital formation, and other eco-nomic outcomes. As such, it directly engages two key themes of the ISA Asia-Pacific conference:the rise of China and the nature of global economic transformation.
1 Introduction: Why China?
Shenzhen is easily China’s most famous SEZ but using Shenzhen as a development model is prob-
lematic. Shenzhen’s attributes during its period of enactment are incredibly unique - not every SEZ
has a financial hub as well-developed as Hong Kong right next door - but Shenzhen is also only
one model in a country with vast internal variation in SEZs. According to a senior economist at
∗Ms. Herlevi is a doctoral candidate in the Department of Politics at the University of Virginia (UVA). Thisresearch has been supported by UVA’s Bankard Fund for Political Economy and the Dumas Malone Graduate ResearchFellowship. Please send comments and feedback to [email protected].
1

the World Bank, “Many academics, practitioners, and policymakers cite Shenzhen as the exemplar
of zone policies but the single-minded focus on this one example belies the tremendous hetero-
geneity of outcomes in China.”1 There is no question that China is often cited as a model for other
developing and emerging market countries but is China’s development path generalizable? What
is the lesson other countries should take from China? Are individual zone models replicable and,
if so, which ones? Within China, development zones have been a magnet for FDI but this has been
much more important in the post-1992 period.2 By the mid-2000s, it is estimated that development
zones in China accounted for “about one third China’s FDI stock.”3
China is a key case for the study of SEZs for three reasons. First, China has the most variation
along the dependent variable both spatially and temporally. There are over 1,500 zones and seven
distinct zone programs within China. Second, China is a microcosm of the global competition for
investment and has gone through periods that resemble the “race to the bottom” theorized in the
cross-national context. By examining subnational differences within one country we are able to
hold international factors, such as regime type, currency system, preferential trade agreements, and
membership in international organizations, constant. Third, China is now “exporting” its model of
zone development, most clearly in Africa.4 However, it is not clear what internal model (or models)
best correspond to theses overseas development zones. Thus, understanding China’s internal zone
programs helps us better understand how Chinese-run overseas zones may evolve.
This paper will proceed as follows. The next section will discuss both the China-specific and
1 Author interview; Washington, DC; July 2015.2 Huang (2003).3 Fu and Gao (2007, 22).4 Brautigam and Tang (2011); Brautigam and Tang (2013).
2

then the broader SEZ literature to address why the under-emphasis on origins and characteristics of
zone is problematic for our understanding of their effectiveness. I will conclude this section with
a discussion of the data problems unique to China and discuss why establishing these descriptive
details is vital. The third section will review China’s seven distinct national-level zone programs
focusing on their enactment goals and other characteristics, such as size. The fourth section is
the Zhejiang intra-provincial study. The unique dataset created for this analysis is a pilot study
to evaluate the efficacy of conducting a nationwide analysis of China’s provincial-level economic
development zones.
2 Theory and Methods
2.1 Origins Before Effectiveness
A key question for any incentive policy is whether the policy is effective. This debate remains far
from settled at the cross-national level5 but studies based on China seem promising. Wang (2013)
finds that within China, SEZs increase FDI and total factor productivity. Alder, Shao and Zili-
botti (2013) find differing effects among zones types and level of analysis but argue that state-level
zones have a positive effect on GDP levels even if some categories of zones have distinct effects.
For example, Economic and Technological Development Zones (ETDZs) and High-Tech Indus-
trial Development Zones (HIDZs) have a positive effect on GDP but traditional export-processing
zones (EPZs)6 have no effect on growth. This finding is puzzling but may also be a facet of the
5 Most single-country studies find mixed results (Warr (1987); Kearney (1990); Dowla (1997)) and cross-nationalcomparisons have been primarily qualitative or are limited in the number of countries examined quantitatively(World Bank (2008); Farole (2011)).
6 The zone terminology within China is not necessarily consistent with zone terminology used in the literature orby organizations such as the ILO. In this paper, I will use the China specific nomenclature for distinct programs
3

methods used. When EPZs were created in 2000, the national-level guidance stated that all EPZs
should be placed within the confines of an existing ETDZ.7 Thus EPZs should, by default, be
within the confines of an ETDZ, resulting in policy-derived spatial overlap. Statistical tests with
this sort of spatial and temporal overlap are problematic, limiting our ability to rely on statistical
models alone to identify the mechanisms causing the economic outcomes. I argue that if we are
to understand which policies are causally-related to the economic outcomes of interest, we must
integrate qualitative and quantitative analysis of these policies over time. By doing so, we can
develop a mechanisms-based approach to analysis of the origins, evolution, and effects over time.8
For instance, using the Alder, Shao and Zilibotti (2013) study on the role of Chinese zones on
GDP, if the pathway to higher growth is via public goods provision and building of infrastructure,
then it is likely that the ETDZs are the reason for the growth and would explain why EPZs alone do
not show much of an effect. Alternately, if the source of the increased GDP was related primarily
to technological and knowledge spillovers from export manufacturing then the EPZ could be the
root cause but the results are showing up as an effect of an ETDZ because of the spatial overlap in
the two types of zones. Or, a third possibility is that both mechanisms are required for growth, in
which case the presence of both an ETDZ and an EPZ would be necessary for the growth outcomes
observed in this study. To disaggregate these distinct mechanisms, I believe we must more closely
examine the origins of zones in order to combine qualitative context with quantitative data to fully
flesh out the mechanisms that lead from a policy choice to an economic outcome.
As such, this paper will discuss both the origins of national-level zone programs and the
but use the term SEZ more generally to describe all of these types of enclaves.7 Guo Ban Han 2005, No. 538 Gingerich (2013) discusses a mechanism-based approach to institutional analysis on pages 51-54.
4

characteristics of provincial-level zones in China. However, to put the China-specific analysis in
context, it is necessary to first review the overall literature on SEZs. The China scholarly commu-
nity already has extensive knowledge on the role and use of SEZs (in China) but it is the broader
political economy literature that is lacking in a refined theory and the attendant empirical tests
necessary to fully evaluate the effects of these policies. Moreover, economic, business, and policy-
oriented studies have neglected the origins of zones in favor of a focus on the effects of zones.
2.2 Literature Review
There are at least four bodies of scholarship that address various facets of SEZs, including eco-
nomics,9 political science, business-oriented studies, and urban planning. If you include the China-
specific scholarship then there are at least five distinct literatures.10 Within economics, and espe-
cially the FDI literature, the focus has been on aggregate outcomes and explicit policy measures
have been less readily available and thus under-examined.11 Studies of FDI incentives focus heav-
ily on regime type and other country characteristics but pay less attention to measures of policy.12
In terms of economic theory, SEZs are viewed as a “second-best” policy option.13 The
policy-oriented analysis takes the notion of SEZs as “second-best” without fully addressing why
9 I include policy-oriented research from the World Bank and IMF in this category since they are derivedprimarily from economic theory.
10 For early accounts of Shenzhen, see Vogel (1989) and Chen (1993). For analysis of zones more broadly, see Ge(1999). For an example of the urban planning literature based on a Chinese case, Wenzhou, see Wei, Li andWang (2007).
11 In the case of China, Huang (2008) argues that economists focus too much attention on GDP as a measure whilecross-national political economy studies of FDI are often limited to national-level FDI data.
12 See Pandya (2014b) for an exception.13 This assessment is based on economic models of duty-free zones in the 1970s (Hamada (1974); Miyagiwa
(1993)) but nearly every World Bank or OECD report on the subject uses exactly this vernacular; see Madani(1999); Engman, Onodera and Pinali (2007); World Bank (2008); Farole and Akinci (2011); Jenkins, Esquiveland Larraın B (1998) for examples.
5
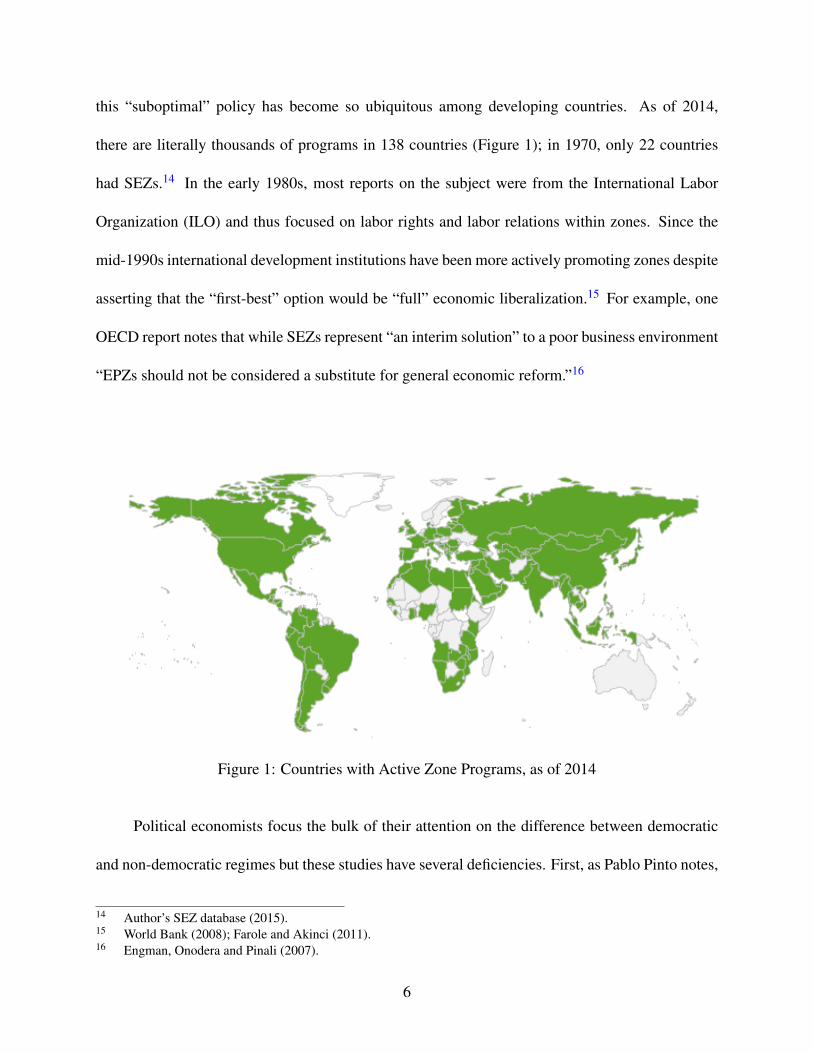
this “suboptimal” policy has become so ubiquitous among developing countries. As of 2014,
there are literally thousands of programs in 138 countries (Figure 1); in 1970, only 22 countries
had SEZs.14 In the early 1980s, most reports on the subject were from the International Labor
Organization (ILO) and thus focused on labor rights and labor relations within zones. Since the
mid-1990s international development institutions have been more actively promoting zones despite
asserting that the “first-best” option would be “full” economic liberalization.15 For example, one
OECD report notes that while SEZs represent “an interim solution” to a poor business environment
“EPZs should not be considered a substitute for general economic reform.”16
Figure 1: Countries with Active Zone Programs, as of 2014
Political economists focus the bulk of their attention on the difference between democratic
and non-democratic regimes but these studies have several deficiencies. First, as Pablo Pinto notes,
14 Author’s SEZ database (2015).15 World Bank (2008); Farole and Akinci (2011).16 Engman, Onodera and Pinali (2007).
6

“these explanations treat host governments as passive actors”17 and ignore the active incentive poli-
cies that countries use to influence foreign investors. Second, by focusing on aggregate FDI flows,
these studies often conflate political and economic fundamentals and pay insufficient attention to
specific policies.18 Regime type and policy choices do not capture the same political concepts nor
are they interchangeable. The related body of literature on political constraints, which acknowl-
edges the importance of veto players and property rights, also focuses on macro-level institutions
vice specific policy measures.19 A generic conception of property rights is not only problematic
for the study of China but for emerging markets more generally.20 Focusing solely on GDP, as
Huang (2008) notes, also underemphasizes the importance of distinct policy choices over time.
Within the FDI literature, there has been a lack of explicit measures of policy so we know little
about how policy effects FDI more broadly.
Geography and urban planning address two other themes in their analysis of SEZs. First, it
is these literatures that deal most directly with issues of land and land rights.21 In particular, they
grapple with the conversion of agricultural land to industrial enclaves and the “commodification
of space.”22 This type of “spatially selective development”23 pits various localities against one
another in a competition for resources and benefits from the central government. Some of these
debates mirror the political economy theories of the global “race to the bottom” but may also
be conceptualized as a “race to the top” for political patronage (i.e. which area or jurisdiction
17 Pinto (2013, 5).18 Pandya (2014b); Pandya (2014a).19 Henisz (2000); Henisz and Zelner (2010); North and Weingast (1989); Weingast (1995); Goldsmith (1995);
Leblang (1996).20 See Rithmire (2015) for defining property rights regimes in China. In my larger dissertation project I argue that
these same issues with land rights influence the nature of SEZ policies in the Middle East as well.21 Rithmire (2015) is an exception in the political science literature.22 Cavanagh (2013, 235).23 Debruyne (2013-2014, 209).
7

can garner the most benefits from national politicians). The second theme emphasized in the urban
planning and some development literature is the concept of an SEZ “life cycle.”24 These debates are
shaped by which patterns of industrial development are most conducive to growth. For example,
geography scholars have reinvigorated debates about “Marshallian industrial districts” and what
the “optimal” pattern of industrial areas should be.25 This debate is particularly relevant for any
discussion of China since Reform-era modernization prompted a wide variety of distinct “models”
of development.26
2.3 My Approach
Current scholarship on SEZs neither integrates the unique perspectives described above nor ac-
knowledges the importance differences between different types of zones and changes over time. In
the 1970s and 1980s, traditional EPZs were focused on manufacturing, often in the textiles indus-
try, but the latest iterations of SEZs have a entirely new set of goals and priorities, including use as
a service-sector hub or as an environmental tourist destination. SEZ policies have changed dramat-
ically emphasizing the importance of examining zone policies over time. For example, Shenzhen
has shifted from a traditional export manufacturing hub to the an innovative enclave home to brand
names such as Huawei, Tencent, Vanke, and Ping’an insurance.27 As such, this project is meant
to not only shed light on the vast internal variation in China but to provide a set of measures and
techniques to analyze SEZs across different countries. China scholars may find the zone program
24 Omar and Stoever (2008).25 Wei, Li and Wang (2007, 422).26 For example, the three most well-known models in China are the Pearl River Delta or Shenzhen, Sunan, and
Wenzhou models. See Chen (1993); Shen et al. (2000); Naughton (2007); or Wei, Li and Wang (2007) for moreon these individual models.
27 Huang (2008) characterizes both Guangdong and Zhejiang as “entreprenuerial” provinces.
8
summaries familiar but the purpose is to systematically review the China experience in order to
determine which patterns are generalizable to other countries, and thus to the political economy
literature more broadly, and which are unique to China. As such, the larger purpose of this analysis
is to inform the international and comparative political economy literature28 while also developing
more explicit measures of policy within China.
The primary differences between national and provincial-level zone programs in China are
the level of incentives and the sectoral focus. Both provincial and state-level zones29 are officially
approved by the central government but each has distinct forms of management, depending on the
location of the zone. To my knowledge, no studies have been conducted on the sectoral compo-
sition of zones at either level but, theoretically, the provincial-level zones should be much more
focused and less comprehensive than national zones. Since national-level zones are meant to foster
comprehensive economic growth, national zones should be larger in size and offer more generous
incentives packages. The program origins section below will focus on the first variable, size, in
order to compare national-level zone programs to one another but also to compare their scale with
provincial-level zones.
I am pairing the intra-provincial case study with the cross-program analysis for several rea-
sons. First, I think we need to more accurately assess the variation in China’s zone programs over
time. In the international context, the EPZs of the 1970s are not the same as today’s service-sector
or other niche SEZs.30 I argue that this same phenomenon exists in China; the zones of the 1980s
28 Kennedy (2011).29 I use the terms state and national-level zones interchangeably but differentiate between provincial and local
zones to make the level of analysis clear and explicit. See Figure 2 for a summary.30 For example, the United Arab Emirates is now specializing in “media” free zones and countries such as the
Philippines are experimenting with eco-SEZs that focus on protecting the environment alongside encouragingtourism.
9

Figure 2: National, Provincial, and Local Zones in China
are not the same as urban-centered enclaves of the 1990s nor the latest round of new zones. Follow-
ing a comprehensive, three-year long audit by the National Development and Reform Commission
(NDRC), it appears that provincial-level zones also came under far more scrutiny. To understand
this over time variation we must examine the impetus for the creation of the zone programs. As
such, the cross-program analysis examines the approximately 225 national-level zones and sum-
marizes their size, origins, and basic characteristics.
Second, national and provincial-level zones are not the same so we must better understand
their similarities, differences, and administrative overlap. I think this step is necessary to inform
the broader political economy literature and evaluate what programs are comparable across coun-
tries. However, given the vast number of provincial zones, 1355 as of 2006, it is not possible to
examine all these zones in depth. Thus, the Zhejiang intra-provincial study is the first step of what
is envisioned as a larger project to characterize all provincial-level zones in China. Provincial zones
10

are supposed to be more industry-specific and only maintain incentive programs for certain sec-
tors but, to my knowledge, the sectoral composition of zones has not been examined empirically.
Many of the infrastructure-related incentives are the same in provincial zones but other preferen-
tial policies are supposed to be more limited. According to the State Administration of Taxation,
“policies given to the province-level development zones should not be comparable to those given
to the state-level ones.”31 This first cut analysis is designed to build a measure of industrial policy
to more accurately understand the range and scope of zones.32 The focus on size helps us com-
pare across zones and zone programs but is also relevant to debates about land-use.33 The sectoral
composition measure is being evaluated as potential policy measure that can later be used to test
theories related to agglomeration effects and knowledge spillovers in industrial enclaves.34
In terms of locational choice, one of most prominent debates is about the balance between ur-
ban and rural interests. Wallace (2014) argues that the urban bias has gone through several phases
in China and helps explain the emergence and evolution of the hukou system, noting that these
policies are also a kind of Faustian bargain for authoritarian regimes. Huang (2008) draws a strict
bifurcation between reforms in the 1980s as rural and entrepreneurial whereas the 1990s were
a shift back to urban-focused industrial policy.35 Huang’s explicit comparisons are Guangdong
and Zhejiang as exemplars and Shanghai as a “heavy-handed” interventionist as well as the city
with “the most blatant anti-rural bias in its policy orientation in the country.”36 Instead of allowing
31 Alder, Shao and Zilibotti (2013, 8).32 As noted above, both Huang (2008) and Pandya (2014) note the dearth of explicit policy measures in the
economics, political economy, and FDI literature. By coding zones at the provincial, prefecture, and countylevels we can attempt to narrow-in on the potential overlapping effects of zones described above.
33 Mattingly (2016); Rithmire (2015); Baland and Robinson (2008).34 Branstetter (1998); Branstetter (2000); Alfaro and Chen (2014); Wellhausen (2013).35 Huang (2008).36 Huang (2008, Chapter 4). Naughton (2016) provides an alternate reading of stalled reforms, arguing that
competition between the State Council, lead by Premier Li Keqiang, and the Party-led organs (Leadership Small
11

the growth of private entrepreneurship, Huang argues that Shanghai’s focus on FDI and external
financing generated more entrenched state-owned enterprises (SOEs) and is more a sign of struc-
tural economic weakness than strength.37 As such, the Zhejiang pilot study will include a set of
urban-rural variables as a proof of concept to examine zones are urban bias in other jurisdictions.
Thus, the hypotheses to be examined will focus on the size, location, and changes over time
and are as follows:
• H1: National-level zones, since they are intended to be more comprehensive in scope, shouldbe larger in size than provincial-level zones.
• H2a: Over time, the size of zones has decreased. Specifically, zones created in the 1990swill be larger in size than zones created after 2003.
• H2b: Industrial parks will be smaller in size, on average, than other economic developmentzones.
• H3: Zones in Zhejiang are primarily rural, consistent with the literature that entrepreneurialprovinces fostered both urban and rural economic development.
3 Program Origins
The purpose of this section is two-fold. First, as already discussed, political economy and policy
analysis of SEZs has under-emphasized SEZ variation both spatially and temporally. As such,
this section is written primarily for non-China scholars who want to understand the origins and
differences between China’s national-level zones.38 For China scholars, this may serve as a useful
summary but is not likely to introduce fundamentally new information, with the size discussion
Groups) are generating uncertainty and thus limiting reform. However, Naughton’s analysis applies to the XiJinping era and does not necessarily explain reform tendencies in previous administrations.
37 Huang (2008) discusses Shanghai in ”Chapter 4: What is wrong with Shanghai?” For the distorting effects ofFDI in the Chinese system more generally, see Huang (2003). Branstetter and Feenstra (1999) find a similarbifurcated system where foreign firms benefit to the detriment of their domestic counterparts in their analysis oftrade and FDI and the balance between SOEs and consumer interests.
38 Since the audience is the broader IPE/CPE community, I have excluded Mandarin translations from the maintext. For a summary of both English and Chinese terms, see Appendix A.
12

being one potential exception. Second, in order to make the case that the impetus for zones has
changed over time we must establish the descriptive facts about origins and evolution over time.
I will briefly describe each program, including the enactment dates, administrative structure, and
some key examples where appropriate. The program comparisons allow us to more systematically
address the appropriateness of program comparisons within China and across countries. At present,
there are at least seven distinct zone programs currently in operation in China. The following
nomenclature will be used for these programs:
• Comprehensive special economic zones (SEZs)
• Economic and technological development zones (ETDZs)
• High-tech industrial development zones (HIDZs)
• Border economic cooperation zones (BECZs)
• Export-processing zones (EPZs)
• Bonded zones (BZs)
• “Pilot” free trade zones (PFTZs).39
3.1 SEZs: The Original
The first four SEZs in China were created in Guangzhou and Fujian Provinces. These four, Shen-
zhen, Zhuhai, Shantou, and Xiamen,40 are the ones most often referenced in the collective imagi-
nation of economists. These zones serve as the typical comparison, either implicit or explicit, when
scholars are discussing China’s “SEZs.” There is an enormous literature on these early zones.41 A
39 Some older zones were also termed FTZs but in practice were actually one of the other zones categories. PFTZsare those approved in 2013 and thereafter.
40 The first three were in Guangzhou while Xiamen was established in Fujian. Hainan is an SEZ as well but theHainan SEZ was not established until the mid-1980s. but given its later enactment date I do not categorize it asone of the four “originals.”
41 For the canonical work on Guangzhou’s zones, see Vogel (1989). For a legal summary of the enactmentpolicies, see Fenwick (1984).
13

cursory search of “Shenzhen special economic zone” (in both English and Chinese) returns over
23,000 articles. A search for Xiamen SEZ returns about 14,000 articles.42
To summarize, the legal regulations governing the original SEZ grew out of a series of de-
cisions focused primarily on the zones in Guangdong and were officially promulgated in August
1980. The “Regulations on Special Economic Zones in Guangdong Province” were approved
during the Fifth National People’s Congress and addressed labor management, administrative or-
ganization, and autonomy of the newly created zones.43 The zones were expressly intended to
“encourage foreign citizens, overseas Chinese, compatriots from Hongkong and Macao . . . to
open factories and set up enterprises.”44 Key provisions in the early zones were the ability for
foreign investors to establish operations, more flexible labor market rules, and lower corporate
taxes.45
The average size of the original SEZs (at their outset) was approximately 85 square kilome-
ters.46 This is enormous when compared to the average size of EPZs in the developing world at that
time, which was approximately 2 square kilometers. However, the SEZ figure for China is heavily
skewed because of Shenzhen. In 1980, Shenzhen was 327.5 square kilometers. The other three
zones ranged from between 1.6 square kilometers (Shantou) and 6.8 square kilometers (Zhuhai),
which is more consistent with the size of EPZs in the rest of the developing world, although larger
42 “New Areas”, such as Shanghai’s Pudong are a hybrid of SEZs and other industrial policies approved by theState Council. While addressed separately in some studies (Zhong 2010), the purpose and intent of the newareas (if not the results) are similar to SEZs.
43 Vogel (1989); Fenwick (1984); Ge (1999).44 English translation of original regulations obtained from the Asian Legal Information Institute,
http://www.asianlii.org.45 For the latter, the corporate tax rates were 15 percent within SEZs whereas joint ventures elsewhere were taxed
at 33 percent (Fenwick 1984, 383).46 Author’s calculation based on data from Vogel (1989) and Naughton (2007).
14
than Taiwan’s early zones.47 Prior to the creation of Shenzhen, the largest EPZ in the developing
world was the Phividec Industrial Estate created in Mindanao in the Philippines in 1974, which
was approximately 30 square kilometers.48 Five years later, Shenzhen remained the same size but
each of the other original zones had grown so that the average size was now approximately 132
square kilometers. By 1990, that number had grown to 158 square kilometers not including Hainan
Island.49 The largest expansion in size among the original four was Xiamen in Fujian province,
increasing from 2.5 to 131 square kilometers; Xiamen is now home to several other types of zones
in close proximity to one another.
3.2 ETDZs and Open Cities
The next major set of officially-designated development zones in China are the coastal open cities.
In 1984 the first round of 14 cities were designated, although some did not become fully operational
until the late 1980s.50 Legally, these zones are now officially known as “economic and technolog-
ical development zones” (ETDZs). The policy guidance for ETDZs was released in April 1988 by
the Customs Administration.51 Following the initial round of approvals, there were two additional
waves of expansion, in period from 1992 to 1994 and from 2000 to 2002.52 The second wave
47 The Taichung EPZ was only 0.23 square kilometers (Frobel, Heinrichs and Kreye 1980) and “Taiwan’s threeexport-processing zones . . . together constituted less than 3.0 square kilometers” (Vogel 1989, 127).
48 Author’s “Early Adopters SEZ/EPZ Dataset.” See also Phividec Industrial Estate for further information,http://www.piamo.gov.ph/pia/, accessed 6 December 2015.
49 The total area of Hainan is 33,900 square kilometers so this figure is not included in the size averages for theoriginal zones. If Hainan was included, the average size would be approximately 6900 square kilometers.
50 The original cities are referred to as “port,” “open,” or “coastal economic” cities and include Dalian, Tianjin,Qinhuangdao, Yantai, Qingdao, Lianyungang, Fuzhou, Guangzhou, Shanghai, Zhanjiang, Nantong, Ningbo,Wenzhou, and Beihai.
51 General Customs Administration, “Provisions of the General Administration of Customs of the People’sRepublic of China on the Administration of Inbound and Outbound Goods at the Economic and TechnologicalDevelopment Zones,” 26 April 1988.
52 Ministry of Commerce (2015).
15

includes additional coastal locations but also more inland locations while the third wave consists
primarily of inland and western areas. The expansion in the early 1990s brought the total num-
ber of national-level ETDZs to 49.53 According to a 2012 report by Renmin University, the total
number of ETDZs is now 128.54
Tax rates in the ETDZ depend on both the type of enterprise, the amount of exports, and
several other factors55 but on average are around 15 percent.56 Prior to 2000, the share of China’s
total FDI inflows into ETDZs was around 8 percent; thereafter it rose greatly reaching a peak of
nearly 16 percent of FDI.57 Unsurprisingly given the pattern of China’s economic development and
opening, the coastal eastern ETDZs account for over 87 percent of total FDI stock in ETDZs (in
2005).58 In terms of size, ETDZs are smaller than HIDZs, both in terms of total proportion and on
average. The largest ETDZ is the one established in Beijing, which is nearly 40 square kilometers,
but on average ETDZs are typically close to 12 square kilometers in size.
3.3 High-Technology Zones
The official nomenclature for this category of zone program is High-Technology Industrial Devel-
opment Zone (HIDZ). This program developed in the 1980s under the purview of the Ministry of
Science and Technology and the first such zone was established in Beijing.59 As of 2011, there
53 State Council (2006).54 Zeng et al. (2012, 4).55 China Association of Development Zones, “Tax Policies Concerning Foreign-funded Enterprises and Foreign
Enterprises in National ETDZs, http://www.china.org.cn/english/difang/76259.htm, accessed 30September 2014.
56 Nominal business tax rates outside of zones are around 33 percent (Fu and Gao 2007). Fu and Gao (2007) alsoestimate that the real average tax rate in ETDZs is approximately 11 percent.
57 Fu and Gao (2007, 20), see Figure 3.58 Fu and Gao (2007, 21).59 Zeng (2011). The area is known as Zhongguancun.
16
were 54 HIDZs with zones in both coastal and inland provinces but the distinction between these
zones and the ETDZs described above seems to have blurred over the years.60 Despite only repre-
senting 0.01 percent of China’s land area,61 HIDZs make an outsized contribution to the economy.
For example, “nearly 5 percent of China’s total industrial labor market” is within an HIDZ, the
value of their exports increased over 12 percent in the period from 1995-2005, and HIDZs account
for nearly 11 percent of China’s FDI stock (as of 2006).62
In terms of incentives, tax policies are somewhat similar to other zones but the comparative
advantage for HIDZs appears to be research and development (R&D) expenditures. Corporate tax
rates for foreign-invested enterprises range from 7.5 to 15 percent, depending on a variety of char-
acteristics associated with the company.63 R&D expenditures in 2002 were over 31 billion RMB,
nearly 25 percent of total R&D expenditures in China.64 Skilled workers are also an important
attraction for foreign-invested firms to operate in these zones. Scientists and technicians represent
6.4 percent of China’s labor force but they are over 22 percent of the workforce in HIDZs.65
When comparing the size and make-up of these zones there are some issues with compara-
bility. The first zone, Zhongguancun in Beijing, is now made up of eight different enclaves such
that the grand total of the area within the confines of the zone is now over 230 square kilometers.66
None of the other HIDZs are nearly this large with the average size of an HIDZ reaching about 18
square kilometers.67 There are also some discrepancies in the official start date of Zhongguancun.
60 Zeng (2011).61 Fu and Gao (2007, 20).62 Fu and Gao (2007, 21).63 “State Preferential Tax Policies for High-Tech Zones,” Xian Outsourcing Service, 20 June 2012.64 Fu and Gao (2007, 28).65 Fu and Gao (2007, 28).66 State Council (2006).67 Author calculations. The smallest is only 2 square kilometers; a technology park located on Hainan Island.
17
Zeng (2011) states that the zone began in 1988 but the State Council Directory (2006) claims the
zone was officially inaugurated in November 1992. According to the NDRC, all zones but two
were approved in either 1991 or 1992. However, as is often the case in China, the initiation of
economic policies often precedes the official promulgation of formal legal regulations, as seems to
be the case with the initial swath of HIDZs.68
While the substantive policies associated with ETDZs and HIDZs are quite similar the
slightly better innovation incentives in HIDZs may have a discernible effect on economic growth
for the city in which the zone resides. Mendoza (2014) finds that cities with ETDZs and HIDZs
have higher incomes and lower income inequality than cities without these programs. With respect
to HIDZs, using cross-sectional household income data for 1995 and 2002, cities with HIDZs saw
a decrease in inequality. However, there may be a point of diminishing returns since Mendoza also
finds that cities with only one zone, whether it be an ETDZ or HIDZ, “have higher income and
lower inequality measures than cities that have both.69 This could indicate that having multiple
zones in one city creates competition between them thus dampening the positive economic ben-
efits of these zones. However, additional research on the mechanisms leading to these outcomes
needs to be done for this assertion to be evaluated.
68 State Council (2006) lists the approval dates for the first 53 HIDZs. The Yangling Agricultural DemonstrationArea was created in 1997 (State Council 2006). The Ningbo HIDZ (for the grand total of 54) was approved inJanuary 2007 (Zeng 2011, Footnote 4).
69 Mendoza (2014, 1).
18

3.4 Border Zones
During Deng Xiaoping’s Southern Tour, the coastal south received the bulk of attention and much
of the focus for continued reform and opening70 but, concurrently, 15 border economic coopera-
tion zones (BECZs) were also established.71 BECZs were managed directly by the State Council
until 2007 but are now under the purview of the Ministry of Commerce. Given the preferential
coastal policies of the 1980s, Chung (1998) argues that inland provinces developed two strategies
for their own economic development. The first strategy was to create their own set of incentive
policies to attract investment while the second focused on “collective efforts to compete against
their coastal counterparts by forming regionally-based organizations.”72 Chung notes that in 1994,
party officials in Shaanxi, Gansu, Qinghai, Ningxia, and Xinjiang “held a ‘summit meeting’ where
they agreed to join in efforts to obtain more preferential policies from Beijing.”73 These efforts
continue today; in 2012, a joint meeting was held in Kunming to discuss measures to promote
these areas.74 Despite modest gains over the past several decades, the re-emphasis on the west-
ern regions under the purview of Xi Jinping’s One Belt, One Road (OBOR) strategy may provide
renewed resources for at least a subset of these border zones.75
70 Zhao (1993).71 For a full list of the 15 BECZs, see Appendix A, Figure 5.72 Chung (1998, 434).73 Ibid.74 Dezan Shira and Associates, China Briefing, “China to Support Development of Border Economic Cooperation
Zones,” 10 December 2012, http://www.china-briefing.com/news/2012/12/10/china-to-support-development-of-border-economic-cooperation-zones.html, last accessed 1October 2014.
75 Most likely the Xinjiang zones but other zones could benefit from infrastructure financing associated with theoverall policy. For more on OBOR, see National Development Reform Commission (2015) and Herlevi (2016).
19

Province Number of Zones Average SizeXinjiang 3 7Yunnan 3 5Guangxi 2 5.6Heilongjiang 2 6.3Inner Mongolia 2 3.7Liaoning 1 6.3Jilin 1 5
Table 1: Border Economic Cooperation Areas
3.5 EPZs
Like most reform programs in China, the export processing zone (EPZ) program initially began
as a “pilot” project in 2000. After a conference which included eight ministries and commissions,
EPZs were established “on a trial basis in an effort to regulate processing trade from the existing
scattered operation to a closed, centralized management.”76 Essentially, an EPZ in China is “a
special industrial zone marked off in [an already] built developing zone . . . whose functions
are limited to processing trade for export.”77 Then, in 2005, a large expansion in the number of
zones occurred. As of 2006, the State Council listed 58 nationally-approved active EPZs across
the country.78 Despite the official program start date being recognized as 2000, there are a couple
anomalies such as the Shanghai Caohejing EPZ, which began operations in 1992.79
Unlike many other developing countries where the EPZ nomenclature and concept was com-
76 Hong Kong Trade Development Council (HKTDC), “China Establishes 15 Pilot Processing Zones,” Policy andLaw, Issue 2, 15 July 2000, http://info.hktdc.com/alert/cba-e0007a.htm. Among the organizationsin attendance at the conference, the HKTDC makes note of only the General Administration of Customs, StateEconomic and Trade Commission, Ministry of Foreign Trade and Economic Cooperation (MOFTEC) and StateAdministration of Taxation.
77 Zeng et al. (2012, 4).78 State Council (2006).79 Caohejing is both an ETDZ and an EPZ (State Council 2006). In total, there are 41 development zones in
Shanghai, 15 state-level and 26 provincial or city-level (Shanghai Editorial Committee 2010, 6).
20

Year Number of Zones1992 12000 152001 32002 82003 132005 18Total 58
Table 2: EPZ Start Dates
monly applied in the 1970s, EPZs arose much later in China. Elsewhere in the world, EPZs were
typically smaller with a much more limited scope; in fact, many EPZs were literally only a single
factory.80 In contrast, China began with the comprehensive SEZ concept but later chose to enact a
form of EPZs to streamline export procedures. This raises questions both about the comparability
of China’s programs to other EPZs globally but also the larger question of why enact this specific
program when it already had a successful, much more comprehensive, economic development zone
model. Unlike EPZs meant to leverage cheap labor and promote export-oriented growth, I argue
that later programs, EPZs in particular, may actually be an indication of the state attempting to
re-assert control rather than further promoting reform and opening. In various policy documents,
the issue of smuggling and tax collection are raised as issues of concern and the desire to stream-
line administration and prevent smuggling may be behind the origins of this particular program.
The Hong Kong Trade and Development Council (HKTDC) notes that Customs supervision across
localities is not been unified stating that “some use ‘registration handbooks’ as the official record,
and some use ‘tax collection and exemption certificates,’ [and] there are yet others who simply put
their comments on the approval document.”81
80 Frobel, Heinrichs and Kreye (1980) include single-factory programs in their review of early EPZs.81 HKTDC, “China Establishes 15 Pilot Processing Zones,” 2000.
21
Moreover, despite the fact that it is ostensibly a separate program, “processing zones can
only be set up in existing ETDZs that have been approved by the State Council, and must not be
established elsewhere.”82 Thus, one problem with studies attempting to disentangle the effects of
various programs on FDI, employment, inequality, and other economic outcomes is this spatial and
temporal overlap. EPZs will, by design, have geographic overlap with an existing ETDZ; thus, it is
difficult to isolate the mechanisms leading to various outcomes. Future empirical analysis should
more fully address these issues of spatial overlap.
3.6 Bonded Zones
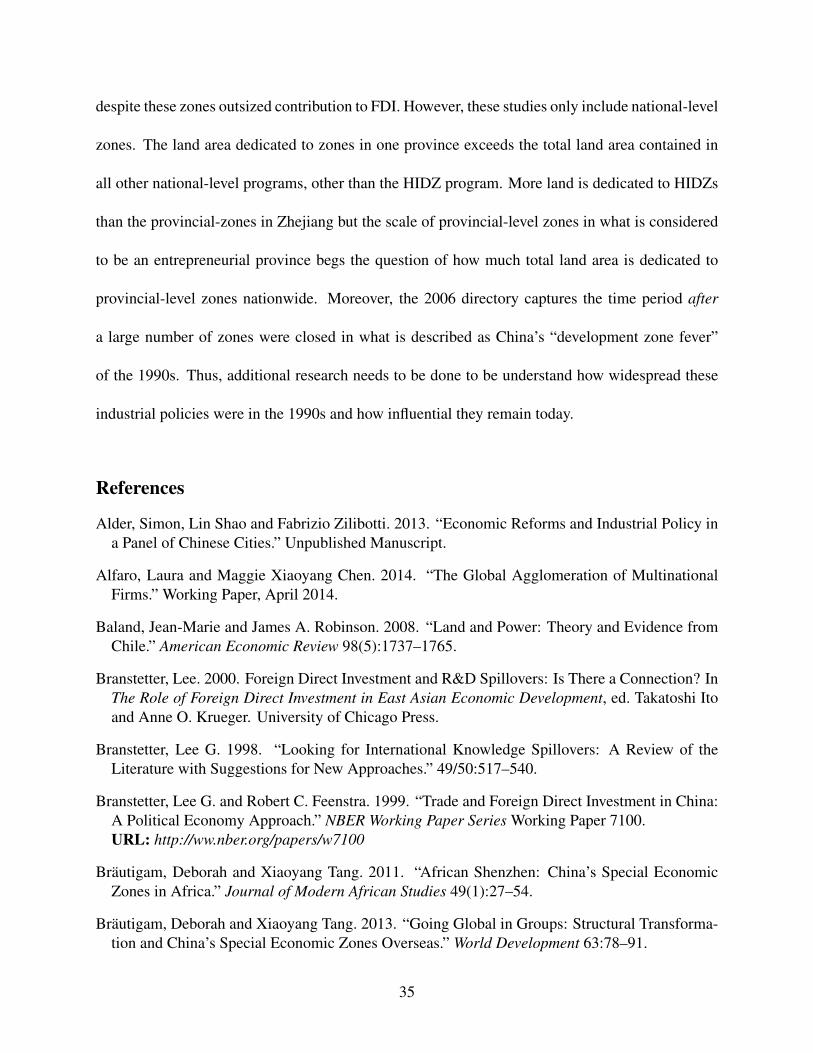
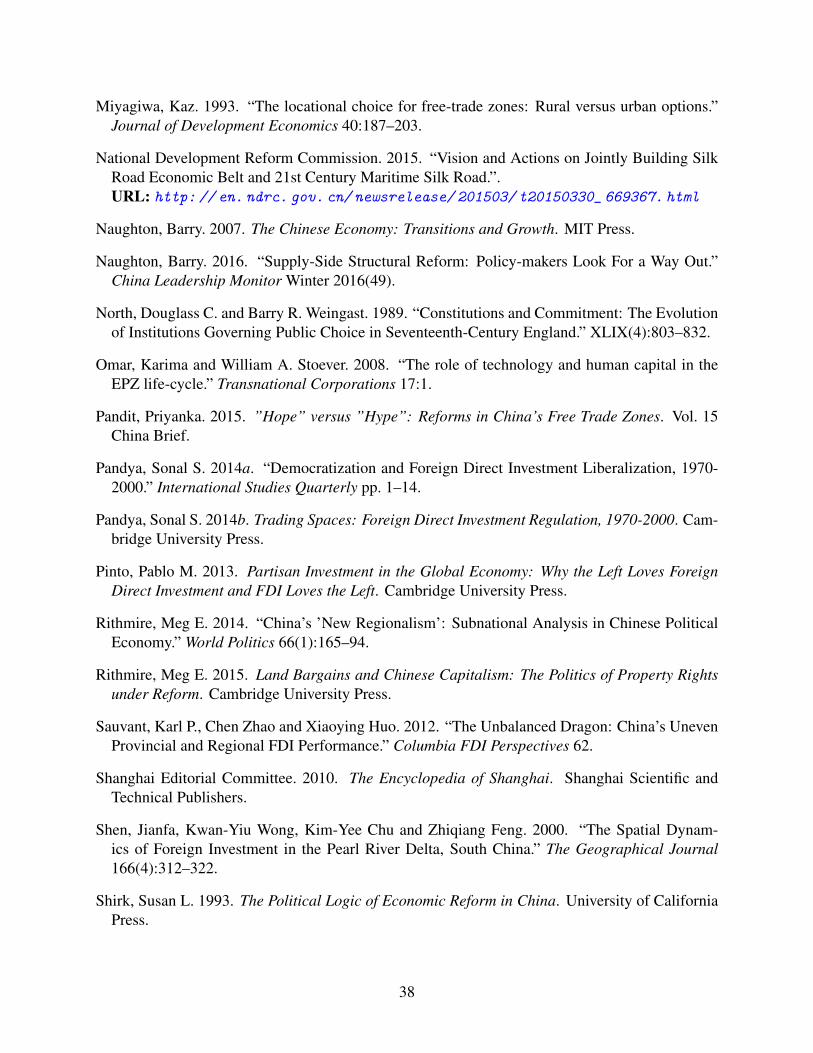
In the category of “bonded zones,” there are actually three different programs, which ostensibly
all attempt to serve the same purpose and are all run by the customs authorities. Bonded zones
began in 1990, bonded logistics zones in 2003, and bonded port areas were enacted in 2005.83
The average size of the initial bonded zones is approximately 2.64 square kilometers.84 As would
be expected for a bonded zone, these areas are quite small and nearly always located within the
confines of some other type of development zone. For example, the original SEZs all now have
bonded zones within their confines. The bonded port areas created in the mid-2000s, are slightly
larger with an average size of 7.82 square kilometers.85
82 This policy is laid out in Guo Ban Han 2005, No. 53. The quote is from HKTDC, “China Establishes 15Processing Zones,” 2000.
83 Zeng et al. (2012).84 Average size is based on author dataset coded from State Council (2006). Zhong (2010) reports size according
to both “program” area and “development area.” Using the 2010 figures, the average size is approximately 3square kilometers.
85 For a list of bonded zones and bonded port areas, see Appendix A.
22

3.7 “Pilot” Free Trade Zones
The latest addition to the family of zone programs is the pilot free trade zone (PFTZ), with the first
approved in Shanghai (SPFTZ) in 2013. At the outset, “senior policymakers indicate[d] that there
[would] be no other FTZs of the same type”86 but recently more have been announced. In 2015,
eight additional PFTZs were approved, often encompassing areas previously established as other
types of national-level zones. Three other provinces have also submit applications for approval
to the central government.87 This policy reversal has made some observers question whether the
latest zone program is “hope or hype”88 but is likely a facet of continuing debates about the pace
and nature of reform.89
Arguably, the goals of the FTZ are different from previous zone programs and speculation
is two-fold. First, some believe the zone is about building a platform for Chinese firms to export
and engage with economies outside China.90 A second argument is that this latest zone is a way to
“test” reforms proposed as part of bilateral investment treaty (BIT) negotiations with the US.91 A
third view is that Shanghai is actually one of the least “reformed” economic markets in China and
thus most in need.92 If the third perspective is accurate then this latest zone program may simply
be an indication of the stagnation of previously-proposed reforms, especially since much of the
86 Huang (2013, 1).87 Shanghai Daily, “New FTZs to follow Shanghai’s lead,” 25 March 2015,
http://coverage.shanghaidaily.com/shdailyftz/news/, last accessed 31 March 2015.88 Pandit (2015).89 Or, as Naughton (2016) and others argue a stagnation of reform (see Kennedy (2016) for a recent debate).90 This perspective is based on discussions with academics based primarily in Europe. Changing Asia Conference:
Perspectives on Regional and Global Cooperation; German Institute for Global & Area Studies (GIGA),Hamburg, Germany; April 2015.
91 Author interviews; Shanghai, China; April 2016.92 Huang (2008).
23
rhetoric sounds strikingly similar to the language used to promote the original Pudong develop-
ment project. Or, consistent with Huang (2008), it could be an attempt at consolidation by local
authorities to shape the next stage of Shanghai’s industrial policy.
4 Zhejiang Comparison
Zhejiang Province was selected as a case for several reasons. First, Zhejiang has over 100 dif-
ferent SEZs within the province and thus provides a large amount of variation on the dependent
variable.93 Zhejiang as a whole is also understudied compared to provinces such as Jiangsu and
cities such as Beijing and Shanghai.94 Second, a cross-provincial study comparing zone policies
is the longer-term goal of this research project but feasibility demanded a more limited scope ini-
tially.95 The overall pilot study examines the origins, type, size, location, and sectoral composition
of zones and could be expanded to encompass all provinces with provincial-level zones. Third, the
“Wenzhou model” is an important example of economic development within China and, as such,
there is a secondary literature on Wenzhou to draw from. While there is not an equally developed
literature on other jurisdictions within the province, the availability of materials on Wenzhou pro-
vides a solid foundation to explore issues in the broader development literature, such as the nature
and character of an SEZ “life cycle.”96 Finally, focusing on a province vice a direct-controlled
municipality provides a better foundation for generalizability to other provinces.97
93 See Appendix B for the number of zones per province and their distribution in 2006.94 Huang (2008).95 The original pilot also included coding of the provincial-level zones in Hainan and Qinghai because the small
number of zones in each of these provinces was easier to tackle as a proof of concept.96 Omar and Stoever (2008).97 Rithmire (2014) argues that selecting a large, urban metropolis may be problematic given the unique status of
these cities within the Chinese political economy.
24

After describing some basic background details, I will address the pilot study characterizing
the case study specific hypotheses followed by a description of the coding schemes for size, loca-
tion, and sectoral composition of zones. I will then conclude with some initial observations on the
hypotheses described above.
Figure 3: Map of Zhejiang
In terms of overall GDP, Zhejiang Province is similar in size to Austria even though the
province’s population is roughly equivalent to Myanmar.98 Using GDP per capita vice total GDP,
Zhejiang is closer to Azerbaijan and Zhejiang’s exports, at least in 2009, were roughly equivalent
to Thailand.99 Some may argue that Zhejiang is not a good case because it is a high FDI performer
and one of the wealthiest coastal provinces.100 However, since the level of analysis is the zone,
98 The Economist, “All the parities in China: Comparing Chinese provinces with countries,”http://www.economist.com/content/chinese_equivalents.
99 Ibid.100 Sauvant, Zhao and Huo (2012).
25
we are not comparing Zhejiang’s ability to attract FDI to other provinces, at least not at this stage.
Instead, we are trying to learn about the spatial and temporal composition of zones in the province
to better understand the differences in investment across space and time.101 One of the key reasons
for focusing on one province is feasibility but doing so also avoids several other pitfalls. First,
Zhejiang is in the eastern coastal region which means that reform and opening has a longer history
there than in the central or western regions. Moreover, Zhejiang represents an example of one of
China’s “regional economic fiefdoms.”102 Thus, while the patterns in Zhejiang may not be perfectly
generalizable to other provinces I think they are more generalizable than findings from one of the
direct-control municipalities.
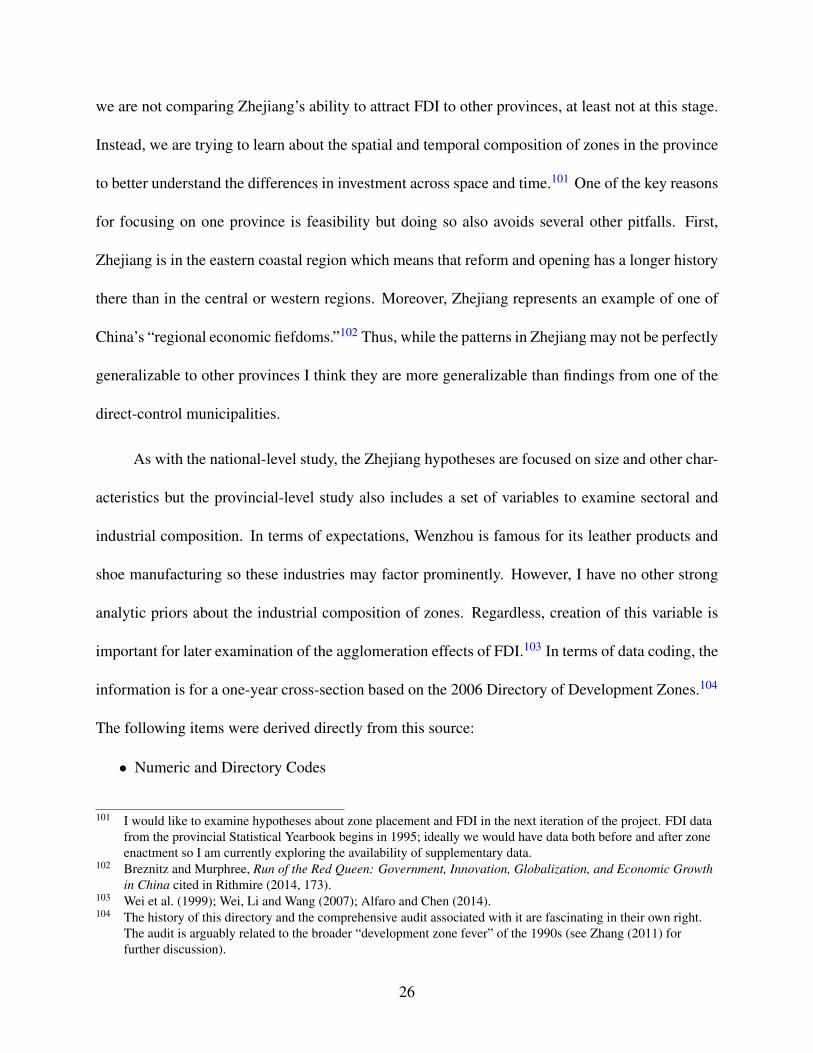
As with the national-level study, the Zhejiang hypotheses are focused on size and other char-
acteristics but the provincial-level study also includes a set of variables to examine sectoral and
industrial composition. In terms of expectations, Wenzhou is famous for its leather products and
shoe manufacturing so these industries may factor prominently. However, I have no other strong
analytic priors about the industrial composition of zones. Regardless, creation of this variable is
important for later examination of the agglomeration effects of FDI.103 In terms of data coding, the
information is for a one-year cross-section based on the 2006 Directory of Development Zones.104
The following items were derived directly from this source:
• Numeric and Directory Codes
101 I would like to examine hypotheses about zone placement and FDI in the next iteration of the project. FDI datafrom the provincial Statistical Yearbook begins in 1995; ideally we would have data both before and after zoneenactment so I am currently exploring the availability of supplementary data.
102 Breznitz and Murphree, Run of the Red Queen: Government, Innovation, Globalization, and Economic Growthin China cited in Rithmire (2014, 173).
103 Wei et al. (1999); Wei, Li and Wang (2007); Alfaro and Chen (2014).104 The history of this directory and the comprehensive audit associated with it are fascinating in their own right.
The audit is arguably related to the broader “development zone fever” of the 1990s (see Zhang (2011) forfurther discussion).
26

• Zone Name (Current and Previous Names, in Mandarin)
• Approval Mechanism (i.e. whether it is a State or Provincial-level zone)
• Approval Date (Official Founding)
• Approved Area (Size)
• Leading Industries
• Announcement Number (relevant NDRC policy guidance)
In terms of size, the directory listed the size in hectares so all figures were converted to
square kilometers for consistency with the national-level program coding. Variables generated
from other information include prefecture, type of zone, administrative level of the jurisdiction
responsible for managing the zone, two urban-rural indicators, and the total number of industries
in the zone. The approval mechanism variable in the directory only codes whether the zone is
a national or provincial-level zone. To understand enactment and management of zones, I also
coded the administrative level of the zone since the urban-rural variable does not provide much
granularity for the scale between a tier two city and a township. To do so, I verified the location of
the specific zone and then coded the prefecture and whether the zone was in a prefecture-level city,
a county-level city, or county. After the initial coding, it became clear that so-called “industrial
parks” became common after 2005. To assess whether industrial parks are qualitatively different
from the other types of zones, promulgated primarily in the early 1990s, I coded a binary variable
for whether or not the zone was an industrial park.
The urban-rural character of the zone is captured by both a binary and ordinal scale. The
binary variable, urban, captures whether a zone is in proximity to a city (either tier one or tier two)
or not.105 The second urban-rural variable is an ordinal scale, which seemingly runs in the opposite
direction of the binary variable, but is done in order to capture tier one and two cities in the interests
105 Thus, the scale is 1 = Urban and 0 = Rural.
27
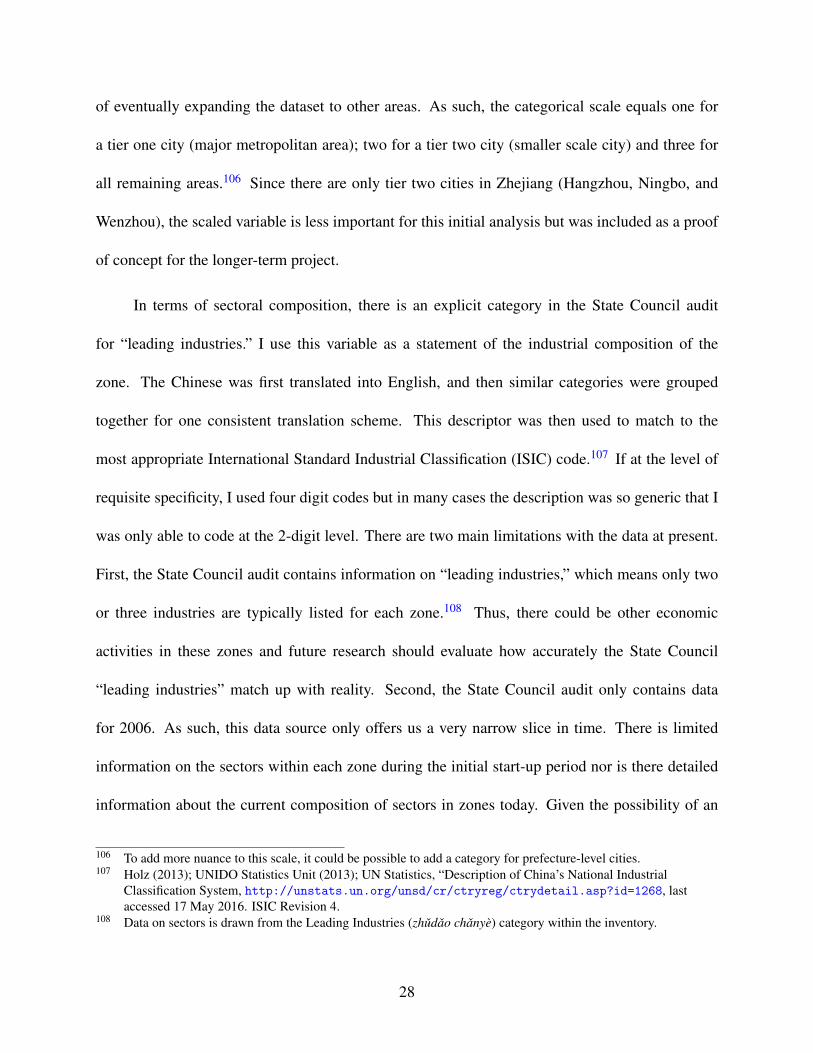
of eventually expanding the dataset to other areas. As such, the categorical scale equals one for
a tier one city (major metropolitan area); two for a tier two city (smaller scale city) and three for
all remaining areas.106 Since there are only tier two cities in Zhejiang (Hangzhou, Ningbo, and
Wenzhou), the scaled variable is less important for this initial analysis but was included as a proof
of concept for the longer-term project.
In terms of sectoral composition, there is an explicit category in the State Council audit
for “leading industries.” I use this variable as a statement of the industrial composition of the
zone. The Chinese was first translated into English, and then similar categories were grouped
together for one consistent translation scheme. This descriptor was then used to match to the
most appropriate International Standard Industrial Classification (ISIC) code.107 If at the level of
requisite specificity, I used four digit codes but in many cases the description was so generic that I
was only able to code at the 2-digit level. There are two main limitations with the data at present.
First, the State Council audit contains information on “leading industries,” which means only two
or three industries are typically listed for each zone.108 Thus, there could be other economic
activities in these zones and future research should evaluate how accurately the State Council
“leading industries” match up with reality. Second, the State Council audit only contains data
for 2006. As such, this data source only offers us a very narrow slice in time. There is limited
information on the sectors within each zone during the initial start-up period nor is there detailed
information about the current composition of sectors in zones today. Given the possibility of an
106 To add more nuance to this scale, it could be possible to add a category for prefecture-level cities.107 Holz (2013); UNIDO Statistics Unit (2013); UN Statistics, “Description of China’s National Industrial
Classification System, http://unstats.un.org/unsd/cr/ctryreg/ctrydetail.asp?id=1268, lastaccessed 17 May 2016. ISIC Revision 4.
108 Data on sectors is drawn from the Leading Industries (zhudao chanye) category within the inventory.
28

SEZ life-cycle and studies that have pointed out the changing composition of production in areas
such as Wenzhou, the change in the sectoral composition of zones should be explored more fully.
4.1 Initial Analysis: Size and Composition
Consistent with the overall reform and policy process in China, there are standard set of dates
associated with zone expansions but there are also some interesting anomalies. The bulk of eco-
nomic zones began in the period between 1992 and 1994, consistent with Deng’s Southern Tour.109
However, nearly all industrial parks were created in 2006, with the exception of the areas specifi-
cally identified as HIDZs. In terms of distribution across the province (Table 3 below), the balance
across prefectures is relatively even. The northern provinces (those in closer proximity to the bor-
der with Shanghai) have slightly more zones than areas in the south and east but the difference in
number is not significant.
27
20
2 3 24
45
010
2030
4050
Num
ber o
f Zon
es
1992 1994 1996 1998 2000 2002 2004 2006
Official Year of Enactment
Provincial-Level Zones in Zhejiang
109 Zhao (1993); Author’s coding of Zhejiang zones based on State Council (2006).
29

Prefecture NumberJinhua 12Jiaxing 11Ningbo 11Shaoxing 11Taizhou 11Lishui 10Wenzhou 10Hangzhou 9Huzhou 7Quzhou 7Zhoushan 4Total 103
Table 3: Zhejiang Zones By Prefecture
For hypothesis one above, zones in 1990s were larger than in the post-2003 sample. In
the period before the audit (prior to 2003), the average size of an economic development zone
was 8.3 square kilometers. After 2003, the average size of zone is 4.9 square kilometers but the
number of observations are roughly equivalent (58 versus 45, respectively). I attribute this both
to the tendency to use industrial parks in the post-audit environment and because the Hu/Wen
administration seemed more concerned about the conversion of rural land for industrial use.
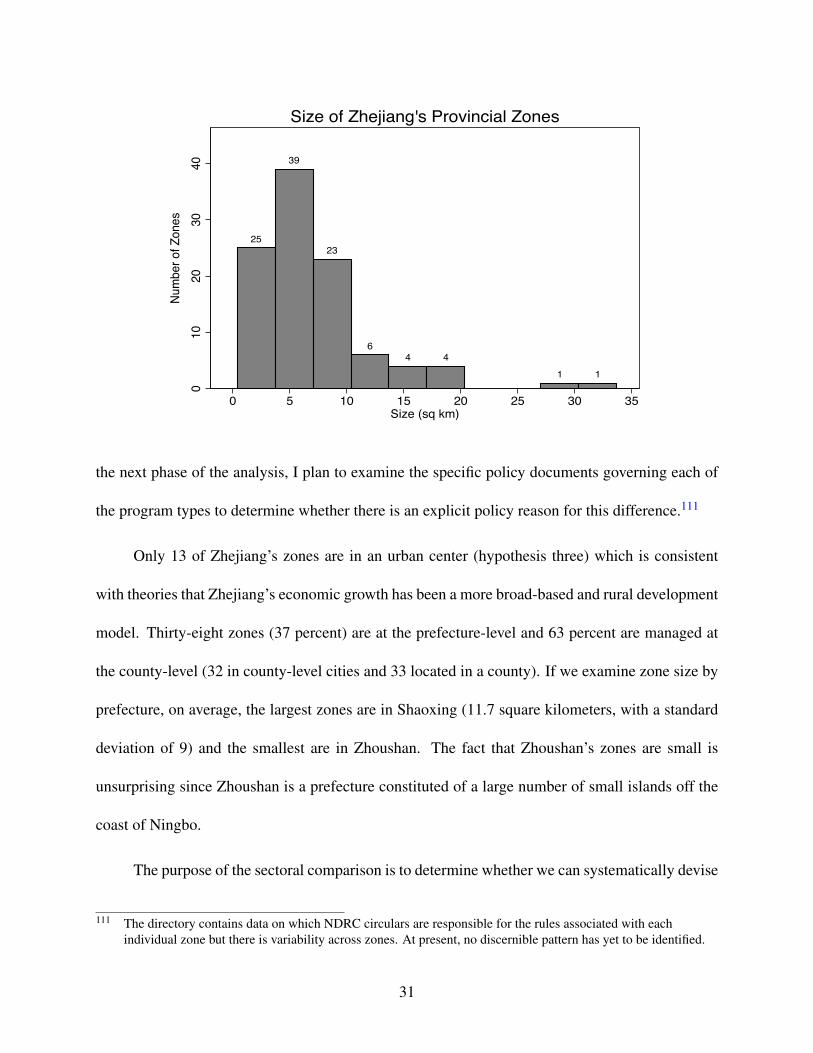
In terms of zone type, nearly half of all zones in Zhejiang are industrial parks created in
or after 2005. As compared to the other provincial-level zones, industrial parks are, on average,
smaller than other economic development zones but do exhibit slightly more variability in size.110
The overall average size (for all time periods) is 6.8 square kilometers whereas industrial parks
are, on average, about 5 square kilometers. Thus, hypothesis 2b is confirmed, but I attribute this
primarily to the over time variation rather than zone type per se but the two are likely related. In
110 The standard deviation for industrial parks is 5.7, with a minimum size of 0.4 square kilometers and a maximumof 33.7.
30
25
39
23
64 4
1 1
010
2030
40Nu
mbe
r of Z
ones
0 5 10 15 20 25 30 35Size (sq km)
Size of Zhejiang's Provincial Zones
the next phase of the analysis, I plan to examine the specific policy documents governing each of
the program types to determine whether there is an explicit policy reason for this difference.111
Only 13 of Zhejiang’s zones are in an urban center (hypothesis three) which is consistent
with theories that Zhejiang’s economic growth has been a more broad-based and rural development
model. Thirty-eight zones (37 percent) are at the prefecture-level and 63 percent are managed at
the county-level (32 in county-level cities and 33 located in a county). If we examine zone size by
prefecture, on average, the largest zones are in Shaoxing (11.7 square kilometers, with a standard
deviation of 9) and the smallest are in Zhoushan. The fact that Zhoushan’s zones are small is
unsurprising since Zhoushan is a prefecture constituted of a large number of small islands off the
coast of Ningbo.
The purpose of the sectoral comparison is to determine whether we can systematically devise
111 The directory contains data on which NDRC circulars are responsible for the rules associated with eachindividual zone but there is variability across zones. At present, no discernible pattern has yet to be identified.
31

a measure of the composition of zones. The initial pilot study confirms the validity of being able
to devise this measure but there were numerous discrepancies in the vernacular used to describe
industries so the second phase of this project will include further refinement of the industry coding
to ensure consistency both within the source data, as well as consistency with the ISIC coding
schemes. As Table 4 shows, leather products and apparel are prominent local industries in Zhejiang
but, at least as of 2006, not the most important sectors within zones. Machinery and machinery
manufacturing is by far the largest industry within zones in the province but given the limited
nature of the directory data, it is not clear whether this is a new phenomenon (industrial upgrading)
nor how early this trend began.
Primary Industry Number of ZonesMachinery 18Spinning and weaving 13Auto parts and components 7Electronics 7Building materials 5Clothing and apparel 5Electrical appliances 4Food products processing 4Leather products 4Other manufacturing 4
Table 4: Zhejiang Zones By Prefecture
5 Comparisons and Further Research
SEZs, ETDZs, and HIDZs are all approved by the State Council but run by local administrative
committees. Bonded zones and EPZs are run by the General Administration of Customs. BECZs
were originally under the State Council (from 1992-2007) but are now run by the Ministry of
32

Commerce.112 Provincial-level zones are run by local governments at various administrative levels.
In some ways, all the various zones are distinct ways for government agencies to have control over
different elements of China’s industrial policy. The timing of expansions of several zone programs
coincides with major leadership transitions so as Shirk (1993) noted, these policies allow leaders
to take “a more active and direct role” in economic reform while still claiming that their policies
are innovative or new.113
Table 5 below summarizes the size for all of China’s national-level zone programs.114 Two
caveats need to be made with respect to the size comparisons across programs. First, size data for
the SEZs is based on 1990 but does not include Hainan Island despite the entirety of the island
being designated as a zone in 1988.115 The second caveat is the size figure for the PFTZ is only
for the Shanghai zone. All other data is based on the size of zones in 2006. Bonded areas includes
size estimates for bonded zones (early 1990s) and bonded port areas (established mid-2000s). Per
the size hypotheses above, the original SEZs are by far the largest and subsequent zone programs
were much smaller in size. The PFTZs may be reversing that trend as their purpose seems to be
consolidation of zones into one larger administrative structure. However, it is too early to assess
the administrative structure of PFTZs as many are still taking shape.
In terms of whether or not zones “cause” FDI, in the case of Zhejiang, increases in FDI
preceded the spike in industrial zones in the mid-2000s but it is possible that this is a result of
112 Dezan Shira & Associates,“China to Support Development of Border Economic Cooperation Zones, ChinaBriefing, 10 December 2012.
113 Shirk (1993, 68).114 Data compiled by author based on NDRC Directory of Development Zones. SEZ size data is for 1990 and is
derived from Vogel (1989) and Naughton (2007).115 Concurrent with its upgrade in status to a separate province; if the total land area of Hainan was included, total
land area for SEZs would be 34,532 square kilometers and the average size of an SEZ would be 6906 squarekilometers.
33
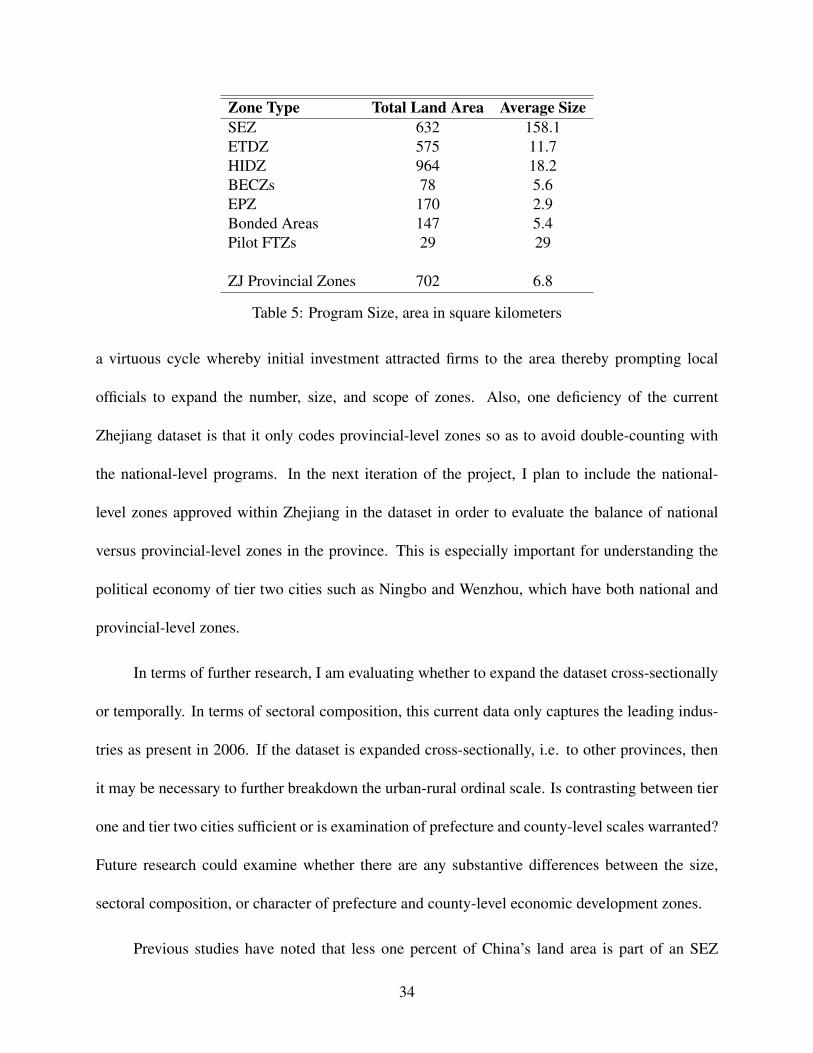
Zone Type Total Land Area Average SizeSEZ 632 158.1ETDZ 575 11.7HIDZ 964 18.2BECZs 78 5.6EPZ 170 2.9Bonded Areas 147 5.4Pilot FTZs 29 29
ZJ Provincial Zones 702 6.8
Table 5: Program Size, area in square kilometers
a virtuous cycle whereby initial investment attracted firms to the area thereby prompting local
officials to expand the number, size, and scope of zones. Also, one deficiency of the current
Zhejiang dataset is that it only codes provincial-level zones so as to avoid double-counting with
the national-level programs. In the next iteration of the project, I plan to include the national-
level zones approved within Zhejiang in the dataset in order to evaluate the balance of national
versus provincial-level zones in the province. This is especially important for understanding the
political economy of tier two cities such as Ningbo and Wenzhou, which have both national and
provincial-level zones.
In terms of further research, I am evaluating whether to expand the dataset cross-sectionally
or temporally. In terms of sectoral composition, this current data only captures the leading indus-
tries as present in 2006. If the dataset is expanded cross-sectionally, i.e. to other provinces, then
it may be necessary to further breakdown the urban-rural ordinal scale. Is contrasting between tier
one and tier two cities sufficient or is examination of prefecture and county-level scales warranted?
Future research could examine whether there are any substantive differences between the size,
sectoral composition, or character of prefecture and county-level economic development zones.
Previous studies have noted that less one percent of China’s land area is part of an SEZ
34
despite these zones outsized contribution to FDI. However, these studies only include national-level
zones. The land area dedicated to zones in one province exceeds the total land area contained in
all other national-level programs, other than the HIDZ program. More land is dedicated to HIDZs
than the provincial-zones in Zhejiang but the scale of provincial-level zones in what is considered
to be an entrepreneurial province begs the question of how much total land area is dedicated to
provincial-level zones nationwide. Moreover, the 2006 directory captures the time period after
a large number of zones were closed in what is described as China’s “development zone fever”
of the 1990s. Thus, additional research needs to be done to be understand how widespread these
industrial policies were in the 1990s and how influential they remain today.
References
Alder, Simon, Lin Shao and Fabrizio Zilibotti. 2013. “Economic Reforms and Industrial Policy ina Panel of Chinese Cities.” Unpublished Manuscript.
Alfaro, Laura and Maggie Xiaoyang Chen. 2014. “The Global Agglomeration of MultinationalFirms.” Working Paper, April 2014.
Baland, Jean-Marie and James A. Robinson. 2008. “Land and Power: Theory and Evidence fromChile.” American Economic Review 98(5):1737–1765.
Branstetter, Lee. 2000. Foreign Direct Investment and R&D Spillovers: Is There a Connection? InThe Role of Foreign Direct Investment in East Asian Economic Development, ed. Takatoshi Itoand Anne O. Krueger. University of Chicago Press.
Branstetter, Lee G. 1998. “Looking for International Knowledge Spillovers: A Review of theLiterature with Suggestions for New Approaches.” 49/50:517–540.
Branstetter, Lee G. and Robert C. Feenstra. 1999. “Trade and Foreign Direct Investment in China:A Political Economy Approach.” NBER Working Paper Series Working Paper 7100.URL: http://ww.nber.org/papers/w7100
Brautigam, Deborah and Xiaoyang Tang. 2011. “African Shenzhen: China’s Special EconomicZones in Africa.” Journal of Modern African Studies 49(1):27–54.
Brautigam, Deborah and Xiaoyang Tang. 2013. “Going Global in Groups: Structural Transforma-tion and China’s Special Economic Zones Overseas.” World Development 63:78–91.
35

Cavanagh, Kimberly K. 2013. Shifting Landscapes: The Social and Economic Development ofAqaba, Jordan PhD thesis University of South Carolina.
Chen, Jinghan. 1993. “Social Cost-Benefit Analysis of China’s Shenzhen Special Economic Zone.”Development Policy Review 11(3):261–71.
Chung, Jae Ho. 1998. Provincial Strategies of Economic Reform in Post-Mao China: Leadership,Politics, and Implementation. M.E. Sharpe chapter Appendix: Study of Provincial Politics andDevelopment in the Post-Mao Reform Era.
Debruyne, Pascal. 2013-2014. Spatial rearticulations of statehood: Jordan’s geographies of powerunder globalization. PhD thesis Ghent University.
Dowla, Asif. 1997. “Export Processing Zones in Bangladesh: The Economic Impact.” AsianSurvey 37(5):561–574.
Engman, Michael, Osamu Onodera and Enrico Pinali. 2007. “Export Processing Zones: Past andFuture Role in Trade and Development.” OECD Trade Policy Working Paper (53).
Farole, Thomas. 2011. Special Economic Zones in Africa: Comparing Performance and Learningfrom Global Experience. World Bank.
Farole, Thomas and Gokhan Akinci, eds. 2011. Special Economic Zones: Progress, EmergingChallenges, and Future Directions. The World Bank.
Fenwick, Ann. 1984. “Evaluating China’s Special Economic Zones.” Berkeley Journal of Interna-tional Law 2(2):376–397.
Frobel, Folker, Jurgen Heinrichs and Otto Kreye. 1980. The new international division of labor:Structural unemployment in industrialized countries and industrialization in developing coun-tries. Cambridge University Press. Translated by Pete Burgess. Original German published in1977 by the Max Planck Institute, Starnberg.
Fu, Xiaolan and Yuning Gao. 2007. Export Processing Zones in China: A Survey. Technical Report31/10/2007 International Labor Organization.
Ge, Wei. 1999. “Special Economic Zones and the Opening of the Chinese Economy: SomeLessons for Economic Liberalization.” World Development 27(7):1267–1285.
Gingerich, Daniel W. 2013. Political Institutions and Party-Directed Corruption in South America:Stealing for the Team. Cambridge University Press.
Goldsmith, Arthur. 1995. “Democracy, Property Rights and Economic Growth.” 32(2):157–75.
Hamada, Koichi. 1974. “An economic analysis of the duty-free zone.” Journal of InternationalEconomics 4(3):225–241.
Henisz, Witold J. 2000. “The Institutional Environment for Multinational Investment.” Journal ofLaw, Economics, and Organization 16(2):334–364.
36

Henisz, Witold J. and Bennet A. Zelner. 2010. “Measures of Political Risk.” POLCON Codebook,2010 Release .URL: http://www-management.wharton.upenn.edu/henisz/
Herlevi, April A. 2016. “China and the United Arab Emirates: Sustainable Silk Road Partnership?”China Brief XVI(2):14–17.
Holz, Carsten A. 2013. Chinese statistics: classification systems and data sources. Working Paper43869 Stanford Center for International Development.
Huang, Yasheng. 2003. Selling China: Foreign Direct Investment during the Reform Era. Cam-bridge University Press.
Huang, Yasheng. 2008. Capitalism with Chinese Characteristics: Entrepreneurship and the State.Cambridge University Press.
Huang, Yiping. 2013. “Can China’s new economic reform policies get in the zone?” East AsiaForum .URL: http://www.eastasiaforum.org/2013/10/20/can-chinas-new-economic-reform-policies-get-i n-the-zone/
Jenkins, Mauricio, Gerardo Esquivel and Felipe Larraın B. 1998. “Export Processing Zones inCentral America.” Development Discussion Papers, Central America Project Series .
Kearney, Richard C. 1990. “Mauritius and the NIC Model Redux: Or, How Many Cases Make aModel?” The Journal of Developing Areas 24(2):195–216.
Kennedy, Scott. 2011. Beyond the Middle Kingdom: Comparative Perspectives on China’s Cap-italist Transformation. Stanford University Press chapter six. Fragmented Influence: BusinessLobbying in China in Comparative Perspective, pp. 113–135.
Kennedy, Scott, ed. 2016. State and Market in Contemporary China: Towards the 13th Five-YearPlan. A Report of the CSIS Freeman Chair in China Studies. CSIS and Rowman & LittlefieldPublishers.
Leblang, David. 1996. “Property Rights, Democracy and Economic Growth.” Political ResearchQuarterly 49:5–27.
Madani, Dorsati. 1999. “A Review of the Role and Impact of Export Processing Zones.”.
Mattingly, Daniel C. 2016. “Elite Capture: How Decentralization and Informal Institutions WeakenProperty Rights in China.” World Politics 68(3):383–412.
Mendoza, Octasiano M. Valerio. 2014. “Income Inequality in China’s Economic and Techno-logical Development Zones and High-Tech Industrial Development Zones, 1995-2002.” ChinaEconomic Policy Review 3(2):1–22.
Ministry of Commerce. 2015. “A Brief Introduction of National Economic and TechnologicalDevelopment Zones in China.”.URL: http://www.china.org.cn/english/SPORT-c/76751.htm
37
Miyagiwa, Kaz. 1993. “The locational choice for free-trade zones: Rural versus urban options.”Journal of Development Economics 40:187–203.
National Development Reform Commission. 2015. “Vision and Actions on Jointly Building SilkRoad Economic Belt and 21st Century Maritime Silk Road.”.URL: http: // en. ndrc. gov. cn/ newsrelease/ 201503/ t20150330_ 669367. html
Naughton, Barry. 2007. The Chinese Economy: Transitions and Growth. MIT Press.
Naughton, Barry. 2016. “Supply-Side Structural Reform: Policy-makers Look For a Way Out.”China Leadership Monitor Winter 2016(49).
North, Douglass C. and Barry R. Weingast. 1989. “Constitutions and Commitment: The Evolutionof Institutions Governing Public Choice in Seventeenth-Century England.” XLIX(4):803–832.
Omar, Karima and William A. Stoever. 2008. “The role of technology and human capital in theEPZ life-cycle.” Transnational Corporations 17:1.
Pandit, Priyanka. 2015. ”Hope” versus ”Hype”: Reforms in China’s Free Trade Zones. Vol. 15China Brief.
Pandya, Sonal S. 2014a. “Democratization and Foreign Direct Investment Liberalization, 1970-2000.” International Studies Quarterly pp. 1–14.
Pandya, Sonal S. 2014b. Trading Spaces: Foreign Direct Investment Regulation, 1970-2000. Cam-bridge University Press.
Pinto, Pablo M. 2013. Partisan Investment in the Global Economy: Why the Left Loves ForeignDirect Investment and FDI Loves the Left. Cambridge University Press.
Rithmire, Meg E. 2014. “China’s ’New Regionalism’: Subnational Analysis in Chinese PoliticalEconomy.” World Politics 66(1):165–94.
Rithmire, Meg E. 2015. Land Bargains and Chinese Capitalism: The Politics of Property Rightsunder Reform. Cambridge University Press.
Sauvant, Karl P., Chen Zhao and Xiaoying Huo. 2012. “The Unbalanced Dragon: China’s UnevenProvincial and Regional FDI Performance.” Columbia FDI Perspectives 62.
Shanghai Editorial Committee. 2010. The Encyclopedia of Shanghai. Shanghai Scientific andTechnical Publishers.
Shen, Jianfa, Kwan-Yiu Wong, Kim-Yee Chu and Zhiqiang Feng. 2000. “The Spatial Dynam-ics of Foreign Investment in the Pearl River Delta, South China.” The Geographical Journal166(4):312–322.
Shirk, Susan L. 1993. The Political Logic of Economic Reform in China. University of CaliforniaPress.
38
State Council. 2006. Directory of Development Zones. National Development and Reform Com-mission.
UNIDO Statistics Unit. 2013. Industrial Statistics Database, User’s Guide. Technical reportUNIDO.
Vogel, Ezra F. 1989. One Step Ahead in China: Guangdong Under Reform. Harvard UniversityPress.
Wallace, Jeremy L. 2014. Cities and Stability: Urbanization, Redistribution, and Regime Survivalin China. Oxford University Press.
Wang, Jin. 2013. “The economic impact of Special Economic Zones: Evidence from Chinesemunicipalities.” Journal of Development Economics 101:133–147.
Warr, Peter G. 1987. “Export Promotion via Industrial Enclaves: The Philippines’ Bataan ExportProcessing Zone.” pp. 220–41.
Wei, Yehua Dennis, Wangming Li and Chunbin Wang. 2007. “Restructuring Industrial Districts,Scaling Up Regional Development: A Study of the Wenzhou Model, China.” Economic Geog-raphy 83(4):421–444.
Wei, Yingqi, Xiaming Liu, David Parker and Kirit Vaidya. 1999. “The Regional Distribution ofForeign Direct Investment in China.” Regional Studies 33(9):857–867.
Weingast, Barry R. 1995. “The Economic Role of Political Institutions: Market-Preserving Feder-alism and Economic Development.” Journal of Law, Economics, and Organization 11(1):1–31.
Wellhausen, Rachel. 2013. “Innovation in Tow: R&D FDI and Investment Incentives.” Businessand Politics 15(4):467–491.
World Bank. 2008. “Special Economic Zones: Performance, Lessons Learned, and Implicationsfor Zone Development.”.
Zeng, Douglas Zhihua. 2011. “How Do Special Economic Zones and Industrial Clusters DriveChina’s Rapid Development?” World Bank Policy Research Working Paper 5583 .
Zeng, Xiangquan, Chenggang Zhang, Liwen Chen, Xue Yang and Yichen Su. 2012. Export Pro-cessing Zones in China: A Survey Report and a Case Study. Technical report Renmin Universityof China and ILO.
Zhang, Junfu. 2011. “Interjurisdictional competition for FDI: The case of China’s “developmentzone fever”.” Regional Science and Urban Economics 41:145–159.
Zhao, Suisheng. 1993. “Deng Xiaoping’s Southern Tour: Elite Politics in Post-Tiananmen China.”Asian Survey 33(8):739–756.
Zhong, Jian, ed. 2010. Annual Report on the Development of China’s Special Economic Zones.Blue Book of Special Economic Zones, Social Sciences Academic Press (China).
39

6 Appendix A: National-Level Zones
Chinese English Acronym Used"��� Special Economic Zone SEZ"���� � Economic and Technological Development Zone ETDZ+%����� � High-Tech Industrial Development Zone HIDZ+���� High-Tech Park n/a)�"���� Border Economic Cooperation Zone BECZ���� Export Processing Zone EPZ#�(�� Free Trade Zone FTZ� � Bonded Zone BZ#�(�'*� Pilot Free Trade Zone PFTZ�!"�� � Provincial-Level Economic Development Zone n/a�!+������� Provincial-Level High-Tech Industrial Park n/a�!�$���� Provincial-Level Special Industrial Park n/a&���� Central Economic Cities CEC��� Zhongguancun n/a
Figure 4: China’s Development Zone Terminology
Zone Province Size (sq km)Manchuria Inner Mongolia 1992 3 6.4Erenhot Inner Mongolia 1992 3 1Dandong Liaoning 1992 7 6.3Hunchun Jilin 1992 3 5Suifenhe Heilongjiang 1992 3 5Heihe Heilongjiang 1992 3 7.63Pingxiang Guangxi 1992 9 7.2Dongxing Guangxi 1992 9 4.07Ruili Yunnan 1992 9 6Wanting Yunnan 1992 6 5Heikou Yunnan 1992 6 4.02Bole Xinjiang 1992 6 7.82Yining Xinjiang 1992 12 6.5Tacheng Xinjiang 1992 12 6.5
Founded (Year, Month)
Figure 5: Border Economic Cooperation Zones
40
Zone NameProvince or
MunicipalityYear Founded Size (sq km)
Xiamen Xiangyu Bonded Zone Fujian 1992 1.8Fuzhou Bonded Zone Fujian 1992 1.8Shenzhen Shatoujiao Bonded Zone Guangdong 1991 0.37Shenzhen Futian Bonded Zone Guangdong 1991 1.68Guangzhou Bonded Zone Guangdong 1992 2Shantou Bonded Zone Guangdong 1993 2.34Shenzhen Yantian Port Bonded Zone Guangdong 1996 0.85Zhuhai Bonded Zone Guangdong 1996 3Haikou Bonded Zone Hainan 1992 1.93Zhangjia Port Bonded Zone Jiangsu 1992 4.1Dalian Bonded Zone Liaoning 1992 5.7Qingdao Bonded Zone Shandong 1992 2.5Shanghai Waigaoqiao Bonded Zone Shanghai 1990 10Tianjin Port Bonded Zone Tianjin 1991 5Ningbo Bonded Zone Zhejiang 1992 2.3
Figure 6: Bonded Zones
Zone NameProvince or
MunicipalityYear ZoneFounded
Size (sq km)
Chongching Cuntan Chongqing 2008 8.37Xiamen Haicang Fujian 2008 9.51Shenzhen Guangdong 2008 3.71Guangzhou Nansha Guangdong 2008 7.06Guangxi Qinzhou Guangxi 2008 10Hainan Yangpu Hainan 2007 9.21Zhangjiagang Jiangsu 2008 4.1Liaoning Dalian Liaoning 2006 6.88Qingdao Qianwan Shandong 2008 9.72Yantai Shandong 2009 7.26Shanghai Waigaoqiao Shanghai 2005 8.14Tianjin DongJiang Tianjin 2006 10Ningbo Meishandao Zhejiang 2008 7.7
Figure 7: Bonded Port Areas
41

7 Appendix B: Provincial-Level Zones
The histogram below summarizes the number of provincial-level zones by jurisdiction. For a
summary of the number of zones in each province, see Table 4 on the final page.
Figure 8: Provincial Level Zones Per Province, 2006
42
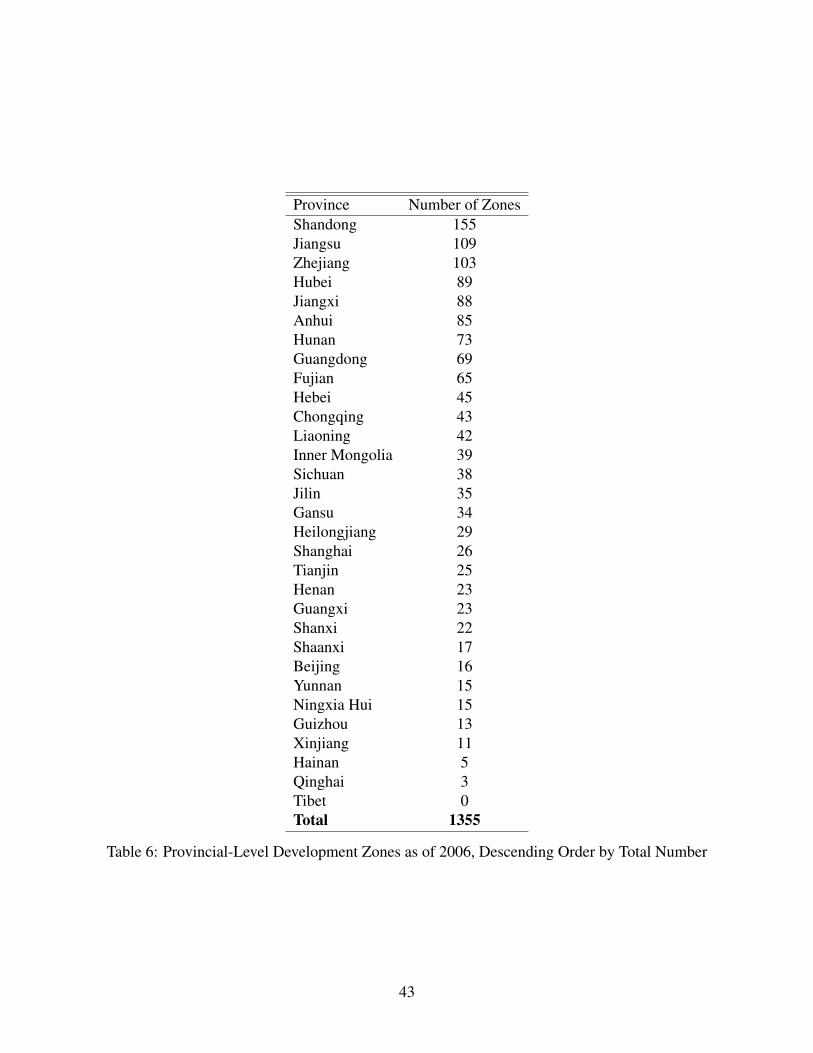
Province Number of ZonesShandong 155Jiangsu 109Zhejiang 103Hubei 89Jiangxi 88Anhui 85Hunan 73Guangdong 69Fujian 65Hebei 45Chongqing 43Liaoning 42Inner Mongolia 39Sichuan 38Jilin 35Gansu 34Heilongjiang 29Shanghai 26Tianjin 25Henan 23Guangxi 23Shanxi 22Shaanxi 17Beijing 16Yunnan 15Ningxia Hui 15Guizhou 13Xinjiang 11Hainan 5Qinghai 3Tibet 0Total 1355
Table 6: Provincial-Level Development Zones as of 2006, Descending Order by Total Number
43