what’s the deal with (elective) labor...
TRANSCRIPT

What’s the Deal With (Elective) Labor Inductions?
Ware Branch, MD
“At the heart of obstetrical care is a seemingly simple calculus: when are the benefits of delivery [and for whom] greater than the benefits of continued care [for the mother and baby]?”
William Grobman, MD

Disclosures• UCB Pharmaceuticals Advisory Board, 2016

Objectives• Evaluate the evidence for and against elective
induction of labor• Assess the cost of elective labor inductions• Compare the methods of cervical ripening and
labor induction• Discuss future needs regarding elective labor
induction

Elective Induction
Why?Patient desire and conveniencePhysician work efficiency and lifestyle? Improved outcomes? Improved L&D efficiency
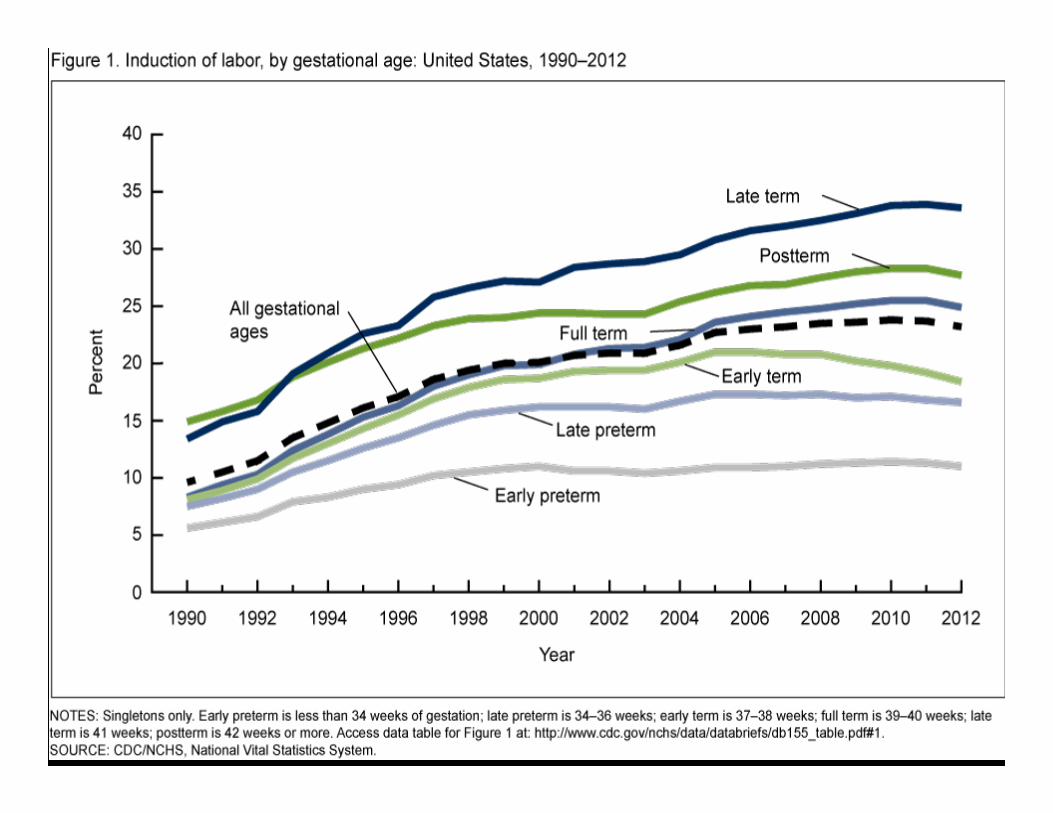

Prevalence of induction of labor in six U.S. health plans, 2001–2007
J Women’s Health 204; 23:904


Elective Induction Versus Expectant Management
Pertinent Outcomes• Cesarean delivery (CD)• Operative vaginal delivery
(OVD) and serious obstetrical lacerations
• PP hemorrhage• Infection
– Chorioamnionitis– Sepsis
• Time in labor• Hospital length of stay
• Feto-neonatal death• Feto-neonatal morbidities
– Hypoxic encephalopathy• Poor Apgar scores, abn
cord gases, seizures/organ dysfunction
– Respiratory morbidities– Infection– Hyperbilirubinemia
• NICU admission / LOS• Hospital LOS

Systematic Review: Elective Induction of Labor Versus Expectant Management of Pregnancy
• Analysis of 11 RCTs and 25 observational studies– Only included studies of pregnancies 370 – 416 weeks– Of RCTs, control groups: expectant management in 9
and spontaneous labor in 2• Most RCTs were of pregnancies beyond 40
weeks• Details of only 506 nulliparous women were
reported in the trials
Ann Intern Med. 2009;151(4):252-263

Systematic Review: Elective Induction of Labor Versus Expectant Management of Pregnancy
Ann Intern Med. 2009;151(4):252-263
Comparison of cesarean delivery reported by the randomized, controlled trials of elective induction of labor versus expectant management, stratified by study
location
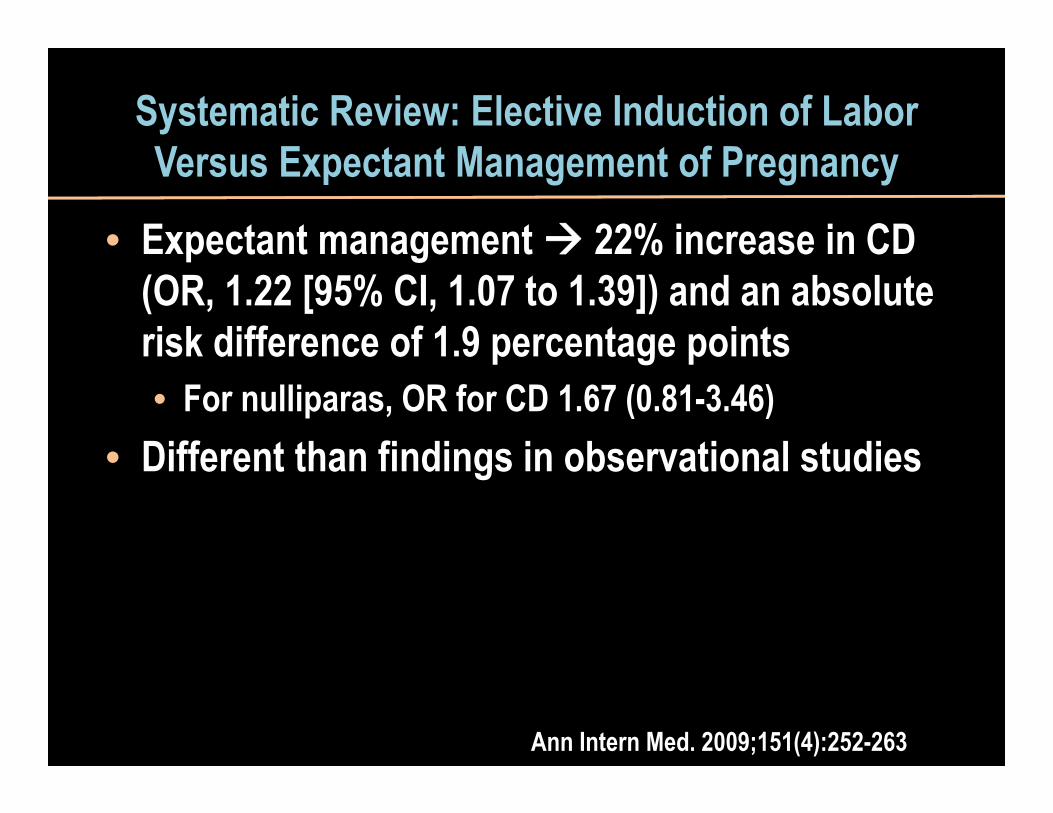
Systematic Review: Elective Induction of Labor Versus Expectant Management of Pregnancy
• Expectant management 22% increase in CD (OR, 1.22 [95% CI, 1.07 to 1.39]) and an absolute risk difference of 1.9 percentage points • For nulliparas, OR for CD 1.67 (0.81-3.46)
• Different than findings in observational studies
Ann Intern Med. 2009;151(4):252-263

• “Beyond [CD], …examination of most other outcomes demonstrates no statistically significant differences and provides low or insufficient evidence. Thus, the safety of elective induction labor requires further investigation.”
Ann Intern Med. 2009;151(4):252-263
Systematic Review: Elective Induction of Labor Versus Expectant Management of Pregnancy

Maternal and Neonatal Outcomes in Electively Induced Low Risk Pregnancies
• Retrospective, cross-sectional study from 12 US institutions 2002-2008 (Consortium on Safe Labor)– 13,242 term electively induced labors in low risk,
term pregnancies (~10% of low risk deliveries)– Compared to expectantly managed pregnancies
Am J Obstet Gynecol. 2014;211:249.e1

Maternal and Neonatal Outcomes in Electively Induced Low Risk Pregnancies
Am J Obstet Gynecol. 2014;211:249.e1
Neonatal Complication Composite
Week of Gestation Elective InductionExpectant
Management Adj OR (95% CI)Nulliparous39 109/1576 2451/26,605 0.750 (0.613-0.917) 40 137/2124 743/7447 0.652 (0.535-0.795)Multiparous39 179/5987 988/19,749 0.590 (0.494-0.705)
40 75/1987 232/4645 0.756 (0.564-1.012)

Maternal and Neonatal Outcomes in Electively Induced Low Risk Pregnancies
• For maternal and neonatal morbidities, no outcome was worse with elective induction
• The composite neonatal morbidity was reduced with elective induction at term
• Several maternal outcomes were reduced with elective induction– Infectious morbidity– Obstetrical lacerations– Shoulder dystocia
Am J Obstet Gynecol. 2014;211:249.e1

• Retrospective cohort study of nulliparous women at 390-405 weeks at a single institution– Elective induction group
• Bishop score of at least 5 (medical record review)• No indication for induction
– Randomly selected controls were women at 39+ weeks being expectantly managed
• Primary outcome = cesarean delivery
Elective Induction Compared with Expectant Management in Term Nulliparas with a
Favorable Cervix
Osmundson et al. Obstet Gynecol 2010;116:601

Elective Induction Compared with Expectant Management in Term Nulliparas with a
Favorable CervixMaternal Outcomes Stratified by Study Group
Outcome Expectantly Managed(N=294)
Elective Induction(N=295)
P
Cesarean 20.1% 20.8% 0.84Chorioamnionitis 9.5% 10.9% 0.59Operative vaginal delivery
21.3% 20.2% 0.77
3rd or 4th degree laceration
12.6% 9.5% 0.24
Postpartumhemorrhage
3.4% 4.1% 0.66
Osmundson et al. Obstet Gynecol 2010;116:601

Elective Induction Compared with Expectant Management in Term Nulliparas with a
Favorable CervixNeonatal Outcomes Stratified by Study Group
Outcome Expectantly Managed(N=294)
Elective Induction(N=294)
P
Apgar <7 at 5 min 0.7% 0.7% >0.99NICU admission 1.4% 1.7% 0.73UmA pH <7 1.2% 0.5% 0.34
Osmundson et al. Obstet Gynecol 2010;116:601

Randomized Trial of Labor Induction in Women 35 Years of Age or Older
• Patients– Low risk primigravidas ≥35 yrs old– Singleton, cephalic fetus – Without regard to Bishop Score
• Intervention– Induction at 390-396
• Controls– Expectant management until 410
• Primary outcome– Cesarean delivery
N Engl J Med. 2016;374:813

Randomized Trial of Labor Induction in Women 35 Years of Age or Older
N Engl J Med. 2016;374:813
0
5
10
15
20
25
30
35
40
CesareanDelivery
AssistedVaginalDelivery
Fetal Distress MaternalComplications*
Induction (N=304)Expectant (N=314)
* Hemorrhage requiring transfusion, systemic infection

Randomized Trial of Labor Induction in Women 35 Years of Age or Older
N Engl J Med. 2016;374:813
Neonatal OutcomesOutcome Induction
(N=304)Expectant
(N=314)Relative Risk
(95% CI)Liveborn 304 314Low birth weight(<2500 g)
4 6 0.68 (0.19–2.4)
UmA pH <7.0 1 1 0.89 (0.05–14.6)Adm to NICU >4 days 6 7 0.88 (0.26–3.06)Hypoxia 2 2 1.03 (0.14–7.50)Suppl oxygen required 9 7 1.32 (0.58–2.99)

Elective Induction of Labor Compared vs Expectant Management of Nulliparous Women at 39 Weeks
• RCT of 161 nulliparas with BS of 5 or less– Randomized in 38th week; induction in 39th week– Foley or misoprostol oxytocin
• Primary outcome: Cesarean delivery
Obstet Gynecol 2015; 126:1258

Obstet Gynecol 2015; 126:1258
Outcome Induction(N=82)
Expectant Care(N=79
RR (95% CI) or P Value
Cesarean Delivery 25 (31%) 14 (18%) 1.72 (0.97-3.06)NR FHRT 4 (16%) 5 (36%) 0.49 (0.14-1.40)Arrest of dilation 18 (72%) 5 (36%) 2.02 (0.96-4.24)Arrest of descent 3 (12%) 3 (21%) 0.56 (0.13-2.4)
Apgar < 5 at 5 min 0 1 (1%) 0.49NICU Admission 5 (6%) 5 (6%) 0.96 (0.29-3.2)
Elective Induction of Labor Compared vs Expectant Management of Nulliparous Women at 39 Weeks

Economic Implications of Method of Delivery
• Population-based cohort study (1985-2002) of low risk gravidas at term in Nova Scotia (N=27,614)– Spontaneous labor– Induced labor– Cesarean without labor
• Compared costs that included– Physician fees, nursing hours in L&D, postpartum and
neonatal intensive care units, epidural use, induction of labor agents, and consumables
Am J Obstet Gynecol 2005;193:192

Economic Implications of Method of Delivery
Am J Obstet Gynecol 2005;193:192
• Compared to spontaneous labor, induced labor was 16% more costly per case– Cesarean without labor only 4% more costly per
case• No accounting for long term implications of cesarean

Elective Induction Compared with Expectant Management in Term Nulliparas with a
Favorable Cervix
Labor Characteristics Stratified by Study GroupOutcome Expectantly Managed
(N=294)Elective Induction
(N=295)P
Hours in L&D 9.0 (±5.1) 12.7 (±4.8) <0.001Labor > 12 hours 30.3% 47.6% <0.001Delivery 6 am – 6 pm 54% 48% 0.20
Osmundson et al. Obstet Gynecol 2010;116:601

Obstet Gynecol 2015; 126:1258
Outcome Induction(N=82)
Expectant Care(N=79
RR (95% CI) or P Value
Cesarean Delivery 25 (31%) 14 (18%) 1.72 (0.97-3.06)NR FHRT 4 (16%) 5 (36%) 0.49 (0.14-1.40)Arrest of dilation 18 (72%) 5 (36%) 2.02 (0.96-4.24)Arrest of descent 3 (12%) 3 (21%) 0.56 (0.13-2.4)
Apgar < 5 at 5 min 0 1 (1%) 0.49NICU Admission 5 (6%) 5 (6%) 0.96 (0.29-3.2)LOS in L&D (min) 1,521 ± 567 1,068 ± 553 <0.001
Elective Induction of Labor Compared vs Expectant Management of Nulliparous Women at 39 Weeks

Risk of Stillbirth and Infant Death by GA
Obstet Gynecol 2012;120:76

Cost-Effectiveness of Elective Induction in Nulliparas at 41 Weeks
• Decision analysis comparing induction to expectant management in 200,000 women
• Assumptions– Fetal demise rate of 0.12% in 41st wk– CS rate of 27% in induced women– Others
• Probability of preeclampsia• Probability of maternal mortality• Probability of spontaneous labor• Probability of non-reassuring fetal surveillance
Kaimal et al. Am J Obstet Gynecol 2011;204:137.e1-9

Cost-Effectiveness of Elective Induction in Nulliparas at 41 Weeks
• Induction superior to expectant management with regard to health effectiveness– Fetal death– Shoulder dystocia– Meconium aspiration syndrome
• Induction slightly more expensive, but with favorable cost ($10,945) per Quality-Adjusted Life Year
Kaimal et al. Am J Obstet Gynecol 2011;204:137.e1-9

Elective Induction vs Expectant Management
Where Are We?• Similar CD rates• No obvious increase in maternal or fetal-
neonatal morbidity– But studies underpowered
• Increased time and materials in L&D more expensive per case, but
• Favorable cost per QALY (at least by 41 weeks)

• Better understanding of potential benefits vs risks of elective induction – Especially in unfavorable patients
• Better understanding of costs of elective induction
Elective Induction vs Expectant Management
What We Could Really Use
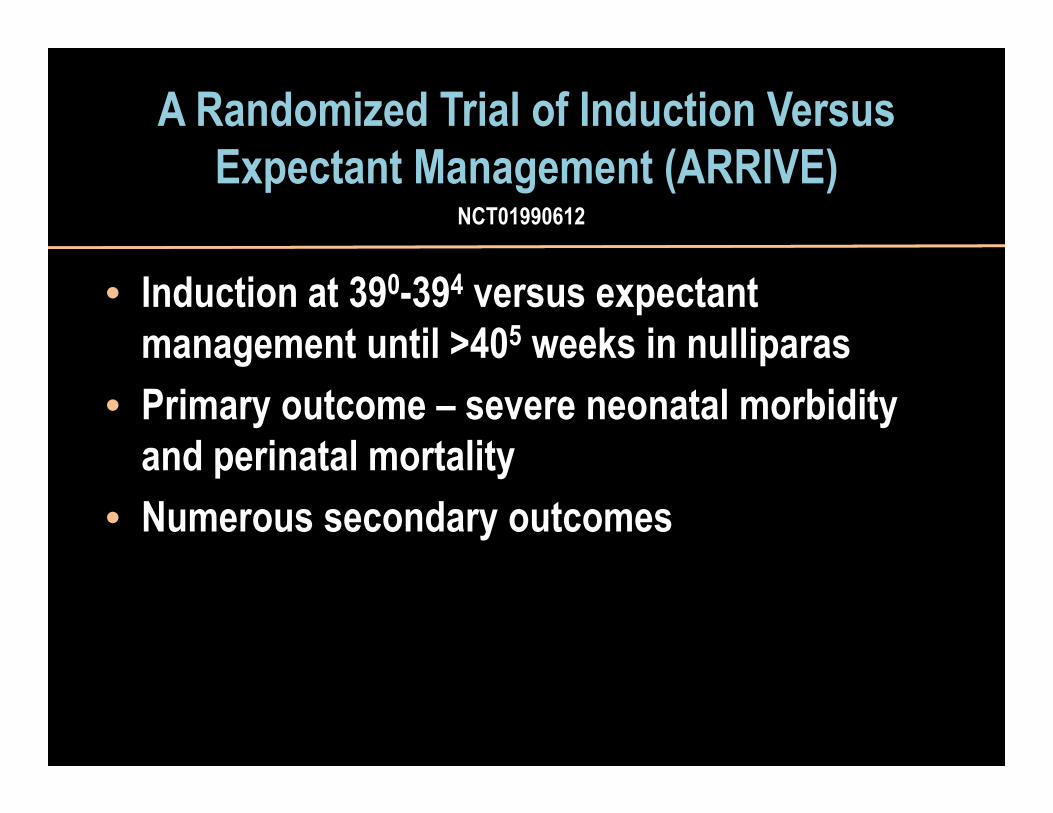
A Randomized Trial of Induction Versus Expectant Management (ARRIVE)
• Induction at 390-394 versus expectant management until >405 weeks in nulliparas
• Primary outcome – severe neonatal morbidity and perinatal mortality
• Numerous secondary outcomes
NCT01990612

We all want favorable maternal and neonatal outcomes, but what are the real goals of elective labor induction?
• Patient convenience and satisfaction• Physician convenience and satisfaction• Nurse convenience and staffing efficiency• Facility convenience and budgetary
accommodation


The Goals for Most Patients and Providers
≤

What are the Real Goals of the Labor Induction?
Same day delivery(≤6-8 hours)?
Next day delivery(≤12-24 hours)?
Ground shipping delivery(within 2-4 days)?

Same day delivery(≤6-8 hours)?
Next day delivery(≤12-24 hours)?
Ground shipping delivery(within 2-4 days)?

The Easy Case(Same day delivery)
• Healthy, term multipara with previous term vaginal deliveries, favorable cx (Bishop score >8)
• Needed:– Room in the inn among other guests and tasks– Adequate nursing staff– Induction with oxytocin– Timely (and safe) amniotomy


Feto-Neonatal and Maternal Risks at Term
RISK
32 y/o P2 (vag), BMI 26, no medical problems, cx 3 cm
35 y/o P1 (vag), BMI 30, no medical problems, cx 1/50 and soft
37 y/o G1, BMI 35, GDM on oral agent and insulin, cx closed/50
42 y/o G1 (IVF-ET), BMI 43, mild GHTN, cx closed and thick
24 y/o G1, BMI 30, no medical problems, cx 1/long

The Problem


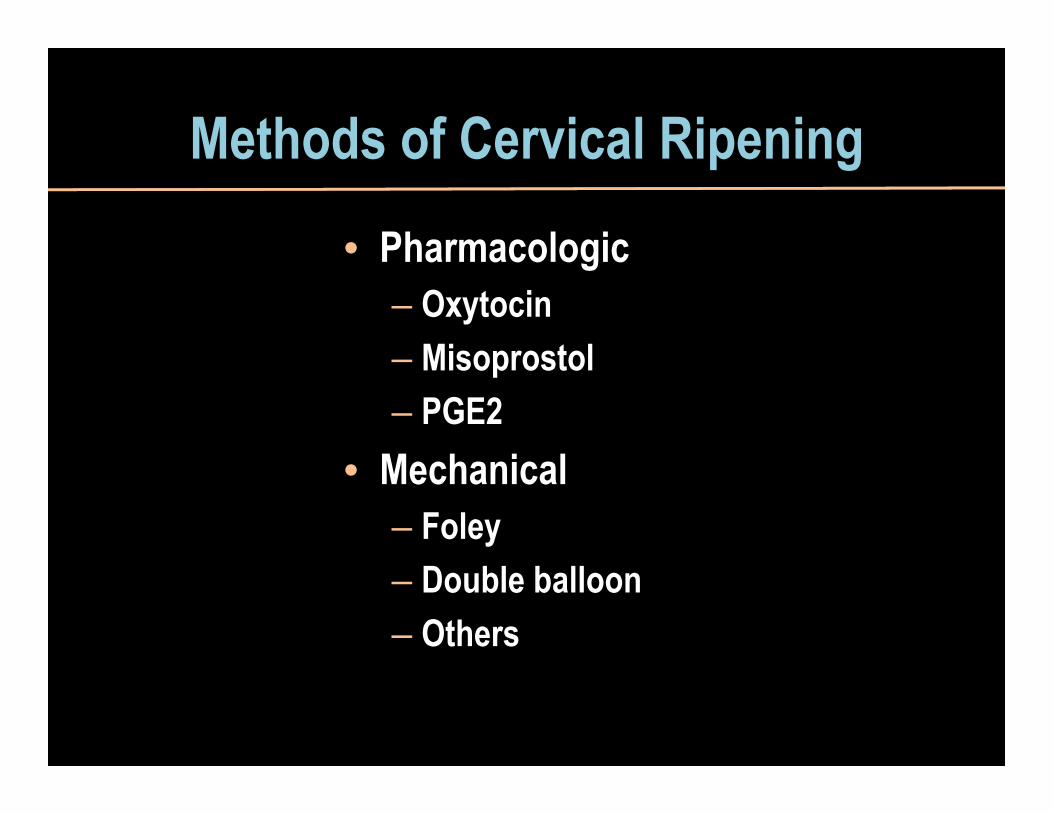
Methods of Cervical Ripening• Pharmacologic
– Oxytocin– Misoprostol– PGE2
• Mechanical– Foley– Double balloon– Others

Effectiveness
Safety
Ease of Procurement and Administration
Cost
Patient Satisfaction

ACOG Practice Bulletin 107August 2009
• Effective methods of cervical ripening include– PGE1 (misoprostol) and PGE2 (dinoprostone)– Mechanical dilation, including Foley catheters (14-26
French with inflation volumes of 30-80 mL)• Insufficient evidence regarding delivery <24 hrs
comparing mechanical methods to prostaglandins
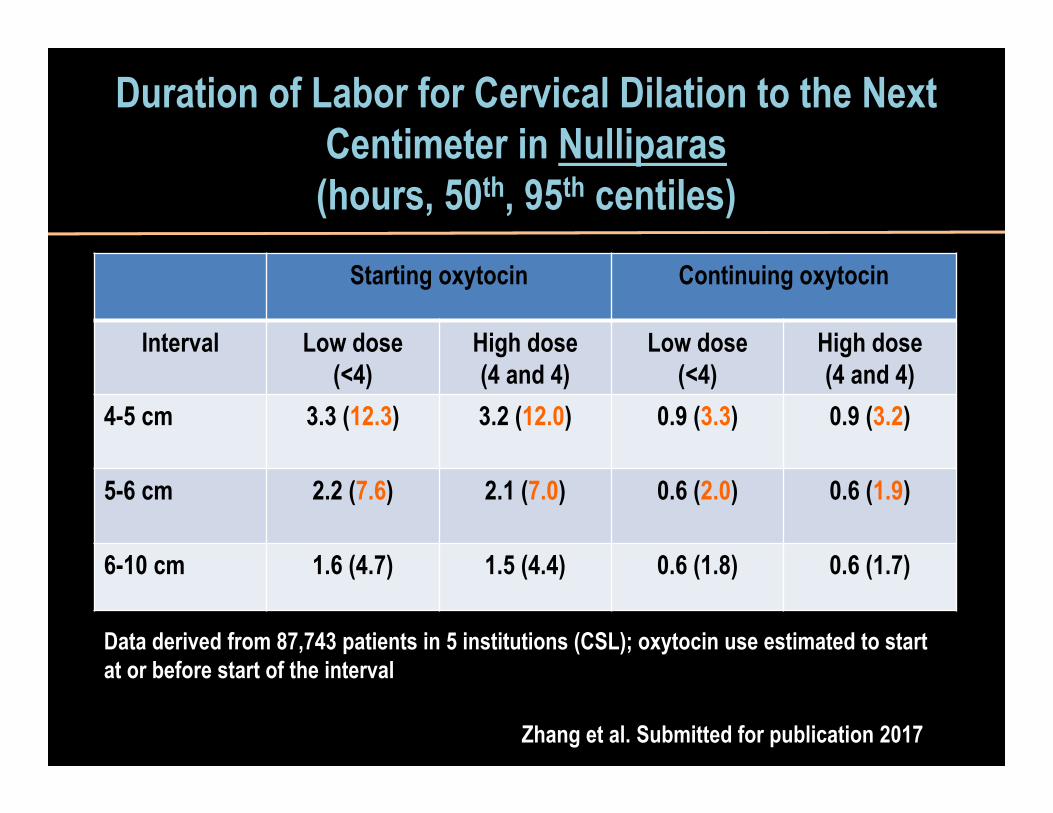
Duration of Labor for Cervical Dilation to the Next Centimeter in Nulliparas(hours, 50th, 95th centiles)
Starting oxytocin Continuing oxytocin
Interval Low dose(<4)
High dose(4 and 4)
Low dose(<4)
High dose(4 and 4)
4-5 cm 3.3 (12.3) 3.2 (12.0) 0.9 (3.3) 0.9 (3.2)
5-6 cm 2.2 (7.6) 2.1 (7.0) 0.6 (2.0) 0.6 (1.9)
6-10 cm 1.6 (4.7) 1.5 (4.4) 0.6 (1.8) 0.6 (1.7)
Data derived from 87,743 patients in 5 institutions (CSL); oxytocin use estimated to start at or before start of the interval
Zhang et al. Submitted for publication 2017
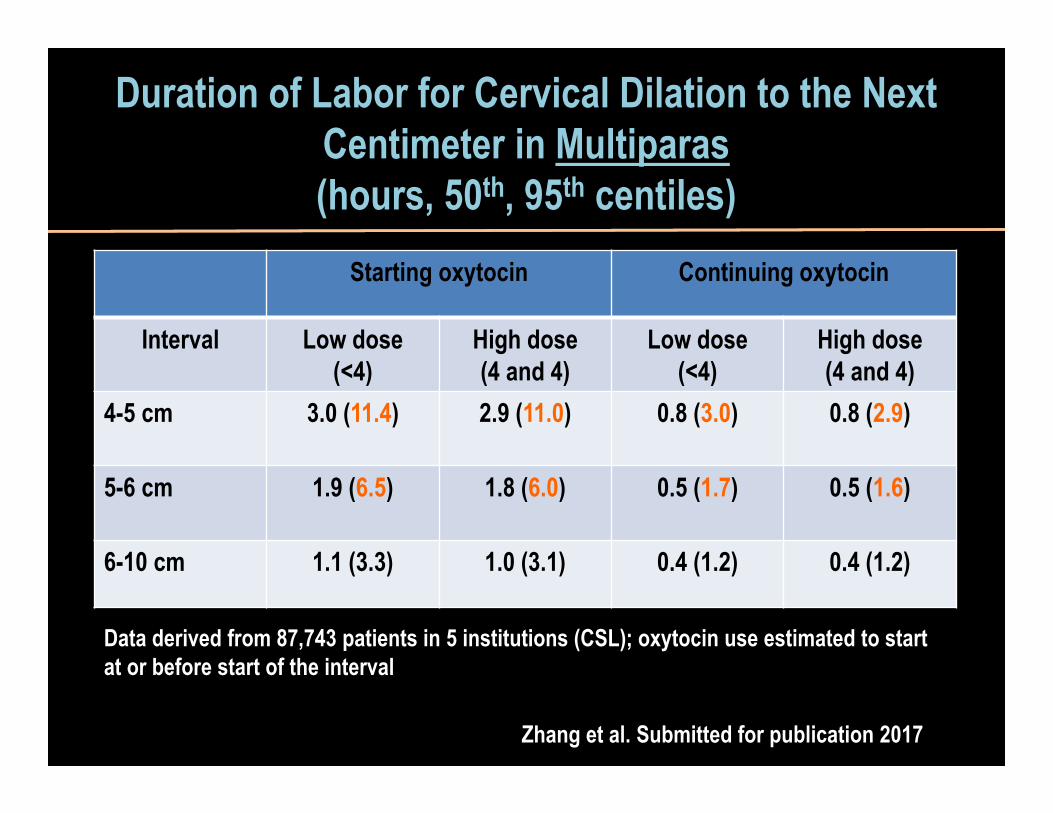
Duration of Labor for Cervical Dilation to the Next Centimeter in Multiparas(hours, 50th, 95th centiles)
Starting oxytocin Continuing oxytocin
Interval Low dose(<4)
High dose(4 and 4)
Low dose(<4)
High dose(4 and 4)
4-5 cm 3.0 (11.4) 2.9 (11.0) 0.8 (3.0) 0.8 (2.9)
5-6 cm 1.9 (6.5) 1.8 (6.0) 0.5 (1.7) 0.5 (1.6)
6-10 cm 1.1 (3.3) 1.0 (3.1) 0.4 (1.2) 0.4 (1.2)
Data derived from 87,743 patients in 5 institutions (CSL); oxytocin use estimated to start at or before start of the interval
Zhang et al. Submitted for publication 2017

Cervical RipeningThe Current Bottom Line
• Mechanical versus Pharmacologic – Similar outcomes with regard to cesarean and
length of labor– More hyperstimulation/tachysystole with
prostaglandins• Patience is a virtue
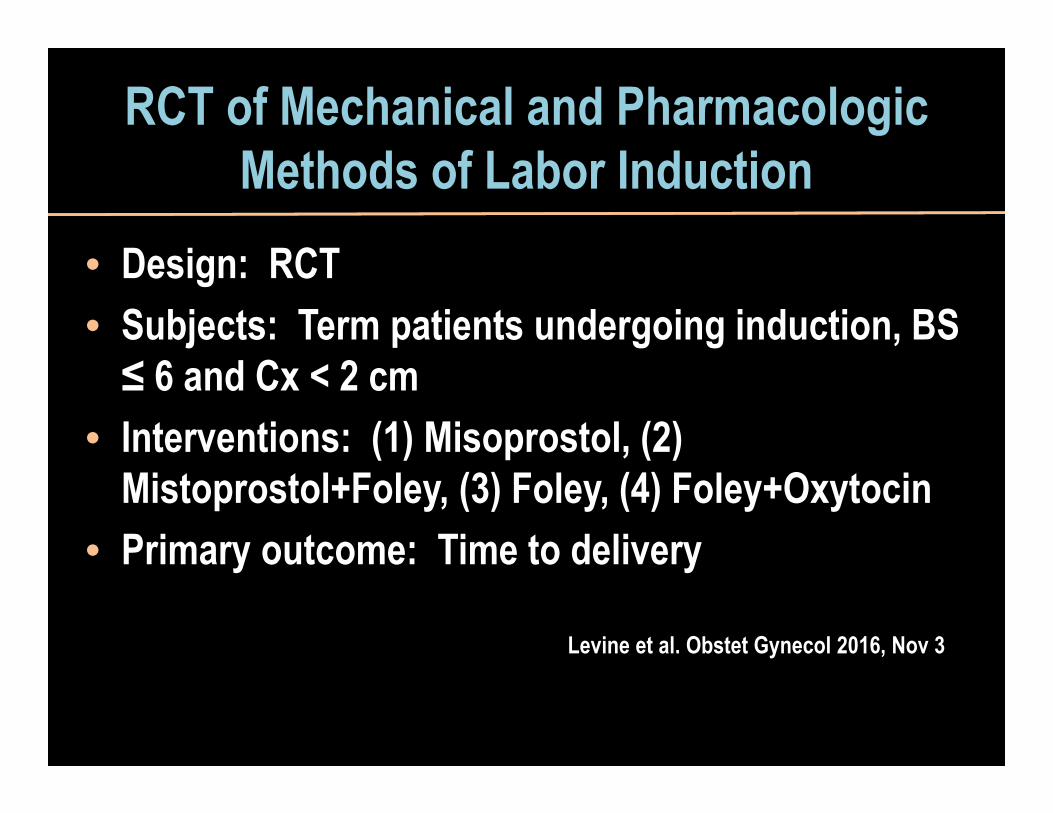
RCT of Mechanical and Pharmacologic Methods of Labor Induction
• Design: RCT• Subjects: Term patients undergoing induction, BS ≤ 6 and Cx < 2 cm
• Interventions: (1) Misoprostol, (2) Mistoprostol+Foley, (3) Foley, (4) Foley+Oxytocin
• Primary outcome: Time to delivery
Levine et al. Obstet Gynecol 2016, Nov 3

Outcome Misoprostol(N=120)
Misoprostol+Foley
(N=123)Foley
(N=123)
Foley+Oxytocin(N=125)
Cesarean (%)NulliparousMultiparous
24%33%12%
28%44%
4%
28.5%41%10%
30%40.5%16%
Time to VD (med h)NulliparousMultiparous
17.6 [11.9-26.7]21.4 [15.6–33.3]12.9 [9.9–18.7]
13.1 [9.1-18.3]16.2 [11.5–21.6]
9.3 [6.7–13.0]
17.7 [12.6-24.9]21.0 [15.8–26.4]15.5 [10.1–18.2
14.5 [9.3-20.0]17.7 [11.9–22.0]10.4 [6.8–14.8]
VD <24 hrs (%)NulliparousMultiparous
70%54%92%
88%81%98%
73%57.5%96%
84%78%92%
VD <12 hrs (%)NulliparousMultiparous
26%13%44%
45%27%70%
22%11%38%
41%26%63%
RCT of Mechanical and Pharmacologic Methods of Labor Induction
Levine et al. Obstet Gynecol 2016, Nov 3

Outpatient Cervical RipeningRauf and Alfirevic, 2014
Method HS/TS with CTG
Changes
Overall CD CD for fetal distress
AS < 7 at 5 min
Arterial Cord pH<7.10
NICU
Foley (N=111 in 2 studies)
0 32% NA NA NA 1%
Dinoprostone insert (N=728 in 3 studies)
5% 30% NA 0.9% NA 13%
Intracx PGE2 (N=334 in 6 studies)
1% 27% 4% 4% NA 4%
Intravag PGE2 (282 in 5 studies)
NA 9% NA 1% NA 2%
Intravag misoprostol (N=197 in 5 studies
2.2% 20% 6.8% 1% NA 10%
Oral misoprostol(N=99 in 2 studies)
NA 19% NA 1% NA 5%

ACOG Practice Bulletin 107August 2009
• Outpatient cervical ripening– Limited safety information available– Larger controlled studies needed to establish an
effective and safe dose and vehicle for PGE2 • Outpatient use may be appropriate in carefully selected
patients– Mechanical methods may be particularly appropriate
in the outpatient setting

ACOG Practice Bulletin 107August 2009
• Recommended fetal surveillance with prostaglandin agents– General
• Uterine activity and FHR monitoring continuously for an initial observation period - further monitoring governed by individual indications for induction and fetal status
– PGE2 gel• Continuous FHR and uterine activity monitoring for 30 minutes
- 2 hrs– Uterine contractions usually are evident in the first hour and exhibit
peak activity in the first 4 hours• FHR monitoring should be continued if regular uterine
contractions persist

• Open-label, randomized trial in 29 facilities • Subjects scheduled for induction
– Term with Bishop score <6– Scheduled for induction
• Interventions: oral misoprostol vs foley• Primary outcome – a composite
– Neonatal asphyxia (UmbA pH ≤7.05 or 5-min Apgar <7– Postpartum hemorrhage (1000 mL or more)
• Numerous secondary outcomes
Induction of labour at term with oral misoprostol versus a Foley catheter (PROBAAT-II): a multicentre randomised
controlled non-inferiority trial
Lancet 2016;387:1619

• Oral misoprostol– 50 mcg q4 hrs up to 3 times daily– Fetal condition and uterine activity monitor X 1 hr before
each dose– Continued up to 4 days or until Bishop score 6 or greater
• Foley– 16 or 18 F filled with 30 mL– External end taped to subject thigh without traction– Cx ripeness assessed every 12 hrs or when Foley expelled
• Routinely replaced at 48 hrs– Continued up to 4 days or until Bishop score 6 or greater
Induction of labour at term with oral misoprostol versus a Foley catheter (PROBAAT-II): a multicentre randomised
controlled non-inferiority trial
Lancet 2016;387:1619

OutcomeMisoprostol
(N=924)Foley
(N=921)Relative Risk
(95% CI)Primary Composite 113 (12.2%) 106 (11.5%) 1·06 (0·86–1·31)Hyperstimulation with FHRT changes
26 (2.8%) 22 (2.4%) 1.18 (0.67–2.06)
Cesarean delivery 155 (16.8%) 185 (20.1%) 0.84 (0.69–1.02)Operative vaginal delivery
125 (13.5%) 88 (9.6%) 1.41 (1.09–1.83)
Induction of labour at term with oral misoprostol versus a Foley catheter (PROBAAT-II): a multicentre randomised
controlled non-inferiority trial
Lancet 2016;387:1619

OutcomeMisoprostol(N=924)
Foley(N=921)
Relative Risk(95% CI)
FTP in 1st stage CD 57 (6.2%) 98 (10.6%) 0.58 (0.42–0.79)
NRFHT operative vaginal delivery in 2nd
stage
32 (3.5%) 13 (1.4%) 2.45 (1.30–4.64)
Oxytocin use 623 (68.4%) 740 (80.3%) 0.85 (0.81–0.90)
SROM 258 (27.9%) 91 (9.9%) 2.84 (2.27–3.54)
Induction of labour at term with oral misoprostol versus a Foley catheter (PROBAAT-II): a multicentre randomised
controlled non-inferiority trial
Lancet 2016;387:1619

OutcomeMisoprostol
(N=924)Foley
(N=921)Relative Risk
(95% CI)Induction to birth (hrs) 29 (17-48) 30 (20-40) NADelivery <24 hrs 367 (39.7%) 278 (30.2%) 1.32 (1.16-1.49)
Delivery <36 hrs 575 (62.2%) 623 (67.6%) 0.92 (0.86-0.98)Delivery <48 hrs 690 (74.7%) 740 (80.3%) 0.93 (0.89-0.98)
Induction of labour at term with oral misoprostol versus a Foley catheter (PROBAAT-II): a multicentre randomised
controlled non-inferiority trial
Lancet 2016;387:1619

• An easy to implement, safe, and reasonably inexpensive method of outpatient cervical ripening that – Results in or allows active labor within a predictable
time-frame• An efficient, strategically-scheduled L&D that
– Easily adjusts beds and staffing to account for scheduled inductions and spontaneous labors
• Provider scheduling/care that– Accommodates scheduling concerns and ensures
proper oversight and immediate presence for labor complications and deliveries
Elective Induction vs Expectant Management
What We Could Really Use
