when average is not average: large response time fluctuations
TRANSCRIPT

When Average is Not Average: Large Response TimeFluctuations in n-Tier Systems
Qingyang Wang 1, Yasuhiko Kanemasa 2, Motoyuki Kawaba 2, Calton Pu 1
1College of Computing, Georgia Institute of Technology2Cloud Computing Research Center, FUJITSU LABORATORIES LTD.
AbstractSimultaneously achieving good performance and high re-source utilization is an important goal for production cloudenvironments. Through extensive measurements of an n-tierapplication benchmark (RUBBoS), we show that system re-sponse time frequently presents large scale fluctuations (e.g.,ranging from tens of milliseconds up to tens of seconds) dur-ing periods of high resource utilization.
Except the factor of bursty workload from clients, wefound that the large scale response time fluctuations canbe caused by some system environmental conditions (e.g.,L2 cache miss, JVM garbage collection, inefficient schedul-ing policies) that commonly exist in n-tier applications. Theimpact of these system environmental conditions can largelyamplify the end-to-end response time fluctuations becauseof the complex resource dependencies in the system. Forinstance, a 50ms response time increase in the database tiercan be amplified to 500ms end-to-end response time increase.We evaluate three heuristics to stabilize response time fluc-tuations while still achieving high resource utilization in thesystem. Our results show that large scale response timefluctuations should be taken into account when designingeffective autonomous self-scaling n-tier systems in cloud.
1. INTRODUCTIONSimultaneously achieving good performance and high re-
source utilization is an important goal for production cloudenvironments. High utilization is essential for high returnon investment for cloud providers and low sharing cost forcloud users [11]. Good performance is essential for mission-critical applications, e.g., web-facing e-commerce applica-tions with Service Level Agreement (SLA) guarantees suchas bounded response time. Unfortunately, simultaneouslyachieving both objectives for applications that are not em-barrassingly parallel has remained an elusive goal. Con-sequently, both practitioners and researchers have encoun-tered serious difficulties in predicting response time in cloudsduring periods of high utilization. A practical consequence
Permission to make digital or hard copies of all or part of this work forpersonal or classroom use is granted without fee provided that copies arenot made or distributed for profit or commercial advantage and that copiesbear this notice and the full citation on the first page. To copy otherwise, torepublish, to post on servers or to redistribute to lists, requires prior specificpermission and/or a fee.ICAC-12, September 16-20, 2012, San Jose, CA, USA.Copyright 2012 ACM 978-1-59593-998-2/09/06 ...$10.00.
of this problem is that enterprise cloud environments havebeen reported to have disappointingly low average utiliza-tion (e.g., 18% in [19]).
In this paper, we describe concrete experimental evidencethat shows an important contributing factor to the apparentunpredictability of cloud-based application response timewhen under high utilization conditions. Using extensivemeasurements of an n-tier benchmark (RUBBoS [1]), wefound the presence of large scale response time fluctuations.These fluctuations, ranging from tens of milliseconds up totens of seconds, appear when workloads become bursty [15],as expected of web-facing applications. The discovery ofthese (now predictable) large scale response time fluctu-ations is important as it will have significant impact onthe autonomous performance prediction and tuning of n-tier application performance, even for moderately burstyworkloads. Specifically, a distinctly bi-modal distributionwith two modes (that span a spectrum of 2 to 3 orders ofmagnitude) can cause significant distortions on traditionalstatistical analyses and models of performance that assumeuni-modal distributions.
One of the interesting facts that made this research chal-lenging is that the long queries (that last several seconds) arenot inherently complex in their nature, i.e., they are normalqueries that would finish within tens of milliseconds whenrun by themselves. Under a specific (and not-so-rare) set ofsystem environmental conditions, these queries take severalseconds. The detailed analysis to reveal these system envi-ronmental conditions in an n-tier system is non-trivial con-sidering that classical performance analysis techniques thatassume uni-modal distributions are inapplicable. Our ap-proach recorded both application level and system level met-rics (e.g., response time, throughput, CPU, and disk I/O) ofeach tier in an n-tier system at fine-grained time granularity(e.g., 100ms). Then we analyzed the relationship of thesemetrics among each tier to identify the often shifting andsometimes mutually dependent bottlenecks. The complex-ity of this phenomenon is illustrated by a sensitivity studyof soft resource allocation (number of threads in the weband application servers and DB connection pool that con-trols the number of active threads in the database server)on system performance and resource utilization.
The first contribution of the paper is an experimental il-lustration of the large scale response time fluctuations ofsystems under high resource utilization conditions using then-tier RUBBoS benchmark. Due to the large fluctuations,the average system response time is not representative ofthe actual system performance. For instance, when the sys-

Function
Web Server
Application Server
Cluster middleware
Software
Apache 2.0.54
Apache Tomcat 5.5.17
C-JDBC 2.0.2
System monitor Sysstat 10.0.02, Collectl 3.5.1
Database server MySQL 5.0.51a
Sun JDK jdk1.6.0_14
Operating system RHEL Server 5.7 (Tikanga)
Transaction monitor Fujitsu SysViz
(a) Software setup
Hardware
Medium (M)
Small (S)
Large (L)
# cores Freq.L2
Cache
Processor
2 2.27GHz 2M
1 2.26GHz 512k
1 2.4 GHz 4M
Memory
2GB
1GB
2GB
Disk
200GB
80GB
200GB
Network
1Gbps
1Gbps
1Gbps
(b) Hardware node setup
WebServer
App.Servers
Cluster-middle-ware
DBServers
L
L
L L
S
LHTTPRequests
(c) 1L/2L/1S/2L sample topology
Figure 1: Details of the experimental setup.
tem is under a moderately bursty workload and the averageutilization of the bottleneck resource (e.g., MySQL CPU) isaround 90%, the end-to-end response time shows a distinctlybi-modal distribution (Section 2.2).
The second contribution of the paper is a detailed analy-sis of several system environmental conditions that causethe large scale response time fluctuations. For instance,some transient events (e.g., CPU overhead caused by L2cache miss or Java GC, see Section 4.1) in the tier underhigh resource utilization conditions significantly impact theresponse time fluctuations of the tier. Then the in-tier re-sponse time fluctuations is amplified to the end-to end re-sponse time due to the complex resource dependencies acrosstiers in the system (Section 4.2). We also found that the op-erating system (OS) level “best” scheduling policy in eachindividual tier of an n-tier system may not achieve the bestoverall application level response time (Section 4.3).
The third contribution of the paper is a practical solu-tion for stabilizing the large scale response time fluctuationsof systems under high resource utilization conditions (Sec-tion 5). For instance, our experimental results show thatthe CPU overhead caused by transient events can be re-duced by limiting the concurrency of request processing inthe bottleneck tier (heuristic ii) while the limitations of OSlevel scheduling policies can be overcome through applica-tion level transaction scheduling (heuristic i).
The rest of the paper is organized as follows. Section 2shows the large scale response time fluctuations using a con-crete example. Section 3 illustrates the large response timefluctuations using a fine-grained monitoring technique. Sec-tion 4 shows some system environmental conditions for thelarge scale response time fluctuations. Section 5 explains thethree heuristics in detail. Section 6 summarizes the relatedwork and Section 7 concludes the paper.
2. BACKGROUND AND MOTIVATION
2.1 Background InformationIn our experiments we adopt the RUBBoS n-tier bench-
mark, based on bulletin board applications such as Slash-dot [1]. RUBBoS can be configured as a three-tier (webserver, application server, and database server) or four-tier(addition of clustering middleware such as C-JDBC [13]) sys-tem. The workload includes 24 different interactions such as“register user” or “view story”. The benchmark includes twokinds of workload modes: browse-only and read/write inter-action mixes. We use browse-only workload in this paper.
Mi et al. [15] proposed a bursty workload generator whichtakes into account the Slashdot effect, where a web pagelinked by a popular blog or media site suddenly experiencesa huge increase in web traffic [7]. Unlike the original work-load generator which generates a request rate that follows a
Poisson distribution parameterized by a number of emulatedbrowsers and a fixed user think time E[Z] 1, the bursty work-load generator generates request rates in two modes: a fastmode with short user think time and a slow mode with longuser think time. The fast mode simulates the Slashdot effectwhere the workload generator generates traffic surges for thesystem. The bursty workload generator uses one parameterto characterize the intensity of the traffic surges: index ofdispersion, which is abbreviated as I. The larger the I is,the longer the duration of the traffic surge. In this paper,we use both the original workload generator (with I = 1)and the bursty workload generator (with I = 100, 400, and1000) to evaluate the system performance.
Figure 1 outlines the details of the experimental setup. Wecarry out the experiments by allocating a dedicated physicalnode to each server. A four-digit notation #W/#A/#C/#Dis used to denote the number of web servers, applicationservers, clustering middleware servers, and database servers.We have three types of hardware nodes: “L”, “M”, and “S”,each of which represents a different level of processing power.Figure 1(c) shows a sample 1L/2L/1S/2L topology. Hard-ware resource utilization measurements are taken during theruntime period using collectl [3] at different time granular-ity. We use Fujitsu SysViz [4], a prototype tool developedby Fujitsu laboratories, as a transaction monitor to preciselymeasure the response time and the number of concurrent re-quests in each short time window (e.g., every 100ms) withrespect to each tier of an n-tier system.
2.2 MotivationIn this section, we give one example to show that the aver-
age of measured performance metrics may not be represen-tative of the actual system performance perceived by clientswhen the system is under high utilization conditions. Theresults shown here are based on 10-minute runtime experi-ments of RUBBoS benchmark running in a four-tier system(see Figure 1(c)) with different burstiness levels of workload.
Figure 2 shows the system response time distribution withfour different burstiness levels of workload. The sum of thevalue of each bar in a subfigure is the total system through-put. We note that in all these four cases, the CPU utilizationof the bottleneck server (the CJDBC server) of the system is90%. This figure shows that the response time distributionin each of these four cases has a distinctly bi-modal charac-teristic; while majority of requests from clients finish withina few hundreds of milliseconds, a few percentage finish longerthan three seconds. Furthermore, this figure shows the morebursty the workload, the more requests there will be withresponse time longer than 3 seconds.
Large scale response time fluctuations have significant neg-
1User think time approximates the waiting time betweentwo consecutive requests sent by a client.
2

0.1 0.3 0.5 0.7 0.9 1.1 1.3 1.5 1.7 1.9 2.1 2.3 2.5 2.7 2.9 3.110
0
101
102
103
Response time [s]
Thro
ug
hp
ut
[req
s/s] Average RT is in
this range
(a) I = 1 (original workload generator); average RT= 0.068s
0.1 0.3 0.5 0.7 0.9 1.1 1.3 1.5 1.7 1.9 2.1 2.3 2.5 2.7 2.9 3.110
0
101
102
103
Response time [s]
Thro
ug
hp
ut
[req
s/s] Average RT is in
this range
(b) I = 100; average RT = 0.189s
0.1 0.3 0.5 0.7 0.9 1.1 1.3 1.5 1.7 1.9 2.1 2.3 2.5 2.7 2.9 3.110
0
101
102
103
Response time [s]
Thro
ug
hp
ut
[req
s/s]
Average RT is in this range
(c) I = 400; average RT = 0.439s
0.1 0.3 0.5 0.7 0.9 1.1 1.3 1.5 1.7 1.9 2.1 2.3 2.5 2.7 2.9 3.110
0
101
102
103
Response time [s]
Thro
ug
hp
ut
[req
s/s]
Average RT is in this range
(d) I = 1000; average RT = 0.776s
Figure 2: End-to-end response time distribution of the system in workload 5200 with different burstiness levels; the
average CPU utilization of the bottleneck server is 90% in 10 minutes runtime experiments for all the four cases.
I=1 I=100 I=400 I=10000
2
4
6
8
10
Burstiness level
Res
pons
e tim
e [s
]
95 percentile98 percentile
Figure 3: The percentiles of system response time in
workload 5200 with different burstiness levels.
ative impact on the performance of a system requiring strictService Level Agreement (SLA) guarantees such as boundedresponse time. Figure 3 shows the 95- and 98-percentiles ofthe end-to-end response time under different levels of burstyworkload. For the original workload (I = 1) case and thebursty workload (I = 100) case, the 95th percentile is verylow (less than 200ms) while the 98th percentile is over 3 sec-onds. As the burstiness level of workload increases, even the95-percentile’s response time is beyond 3 seconds, and the98-percentile’s for bursty workload (I = 1000) case exceeds 9seconds. Some web-facing applications have strict responsetime requirement, for example, Google requires clients’ re-quests to be processed within one second [2]. Thus, responsetime with large scale fluctuations may lead to severe SLAviolations though the average response time is small.
3. FINE-GRAINED ANALYSIS FOR LARGERESPONSE TIME FLUCTUATIONS
In this section we show the cause of the distinctly bi-modalresponse time distribution as introduced in the motivationcase through fine-grained analysis. The results here arebased on the same configuration as shown in the motivationcase. We use the original workload generator (I = 1), whichis an extension analysis for the case as shown in Figure 2(a).
Figure 4(a) shows the average throughput and responsetime of the system from workload 5000 to 5800. The re-sponse time distribution shown in Figure 2(a) is based onthe result of workload 5200, where the average response timeis 0.068s and the average CPU utilization of CJDBC serveris about 90% (see Figure 4(d)). Next, we zoom in the highlyaggregated average of the application/system metrics mea-sured in workload 5200 through fine-grained analysis.
Figure 4(b) and 4(c) show the average system responsetime and throughput aggregated at 100ms and 10s timegranularities respectively. Figure 4(b) shows both the sys-tem response time and throughput present large fluctuationswhile such fluctuations are highly blurred when 10 secondtime granularity is used (Figure 4(c)). Figure 4(e) and 4(f)show the similar graphs for the CJDBC (the bottleneckserver) CPU utilization. Figure 4(e) shows the CJDBC CPUfrequently reaches 100% utilization if monitored at 100msgranularity while such CPU saturation disappears if 10s timegranularity is used 2, which gives system administrators theimpression that the system is always not saturated.
Figure 4(h) and 4(i) show the number of concurrent re-quests on the Apache web server aggregated at 100ms and10s time granularity in workload 5200. Concurrent requestson a server refer to the requests that have arrived, but havenot departed from the server; these requests are being pro-cessed concurrently by the server due to the multi-threadingarchitecture adopted by most modern internet server de-signs (e.g., Apache, Tomcat, and MySQL). We note that thethread pool size we set for the Apache web server in this setof experiments is 50; considering the underlying operatingsystem has a buffer (TCP backlog, the default size is 128) forincoming TCP connection requests from clients, the maxi-mum number of concurrent requests the Apache web servercan handle is 178. Once the server reaches the limit, the newincoming requests will be dropped and TCP retransmission
210 seconds or even longer control interval is frequently usedby the state of the art research on automatic self-scalingsystems [6, 14, 17, 22].
3

0
100
200
300
400
500
600
]sm[ e
mit e sn
opseR
5000 5200 5400 5600 5800680
700
720
740
760
780
800
uor
hTg
hp
tu
[er
qs/s]
Workload [# Users]
ThroughputResponse time
Zoom in
(a) End-to-end RT and TP; subfigureson the right show the “zoom in” results.
0
0.2
0.4
0.6
0.8
1
Res
pons
e tim
e [s
]
0 1200 2400 3600 4800 60000
300
600
900
1200
1500
Thr
ough
put [
reqs
/s]
Timeline [0.1s]
ThroughputResponse time
(b) Large fluctuations of RT and TP (av-erage in each 100ms).
0
0.2
0.4
0.6
0.8
1
Res
pons
e tim
e [s
]
0 1200 2400 3600 4800 60000
300
600
900
1200
1500
Thr
ough
put [
reqs
/s]
Timeline [0.1s]
ThroughputResponse time
(c) Relatively stable RT and TP (aver-age in each 10s).
5000 5200 5400 5600 580075
80
85
90
95
100
Workload [# users]
%[ litu
UPC
]
Zoom in
(d) Bottleneck server CPU usage; sub-figures on the right show the “zoom in”results.
0 1200 2400 3600 4800 60000
20
40
60
80
100
Timeline [0.1s]
CP
U u
til. [
%]
(e) Large fluctuations of CPU usage (av-erage in each 100ms).
0 1200 2400 3600 4800 600050
60
70
80
90
100
Timeline [0.1s]
CP
U u
til. [
%]
(f) Relatively stable CPU usage (averagein each 10s).
1 2 3 4 5 6 7 8 9 100
200
400
600
800
1000
1200
1400
Timeline [min]
# of
TC
P r
etra
nsm
issi
on
(g) # of TCP retransmission in eachminute.
0 1200 2400 3600 4800 60000
50
100
150
200
Timeline [0.1s]
Con
curr
ent a
ctiv
e re
ques
ts. [
#]
(h) Large concurrent request fluctua-tions in Apache (average in each 100ms).
0 1200 2400 3600 4800 60000
50
100
150
200
Timeline [0.1s]C
oncu
rren
t act
ive
requ
ests
. [#]
(i) Relatively stable concurrent requestsin Apache (average in each 10s).
Figure 4: Analysis of system/application level metrics for the large response time fluctuations of the system
(1L/2L/1S/2L config.). Requests with long response time are caused by TCP transmissions as shown in subfigure
(g), which are caused by the large fluctuations of concurrent requests in Apache web tier as shown in subfigure (h).
Burstiness level Threshold WL Bottleneck server CPU util.I =1 5000 88.1%I =100 4800 86.3%I =400 4400 80.4%I =1000 3800 74.6%
Table 1: Workload (with different burstiness levels) be-
yond which more than 1% TCP retransmission happens.
happens, which causes the long response time perceived bya client 3. Figure 4(h) shows that the concurrent requests,if aggregated at 100ms time granularity, frequently presenthigh peaks which are close to the limit. Such high peakscause large number of TCP retransmissions as shown in Fig-ure 4(g), which counts the number of TCP retransmissionsin every minute during the 10-minute runtime experiment.
3.1 Sensitivity Analysis of Large Fluctuationswith Different Bursty Workloads
System administrators may want to know under whichworkload(s) the large scale response time fluctuations hap-
3TCP retransmission is transparent to clients; the waitingtime is three seconds for the first time and is exponentiallyincreased for the consecutive retransmissions (RFC 2988).
pen. Table 1 shows the minimum workload (with differentburstiness levels) under which the system has at least 1%requests that encounter TCP retransmissions. This tableshows that both the threshold workload and the correspond-ing average CPU utilization of the bottleneck server decreaseas the burstiness level of workload increases. This furtherjustifies that the evaluation of the large scale response timefluctuations using fine-grained monitoring is an importantand necessary step in autonomic system design.
4. SYSTEM ENVIRONMENTAL CONDITIONSFOR LARGE RESPONSE TIME FLUC-TUATIONS
Understanding the exact causes of large scale responsetime fluctuations of an n-tier system under high utilizationconditions is important to efficiently utilize the system re-sources while achieving good performance. In this sectionwe will discuss some system environmental conditions thatcause large scale response time fluctuations even under themoderately bursty workload from clients. We note that allthe experimental results in this section are based on theoriginal RUBBoS browse-only workload (I = 1).
4
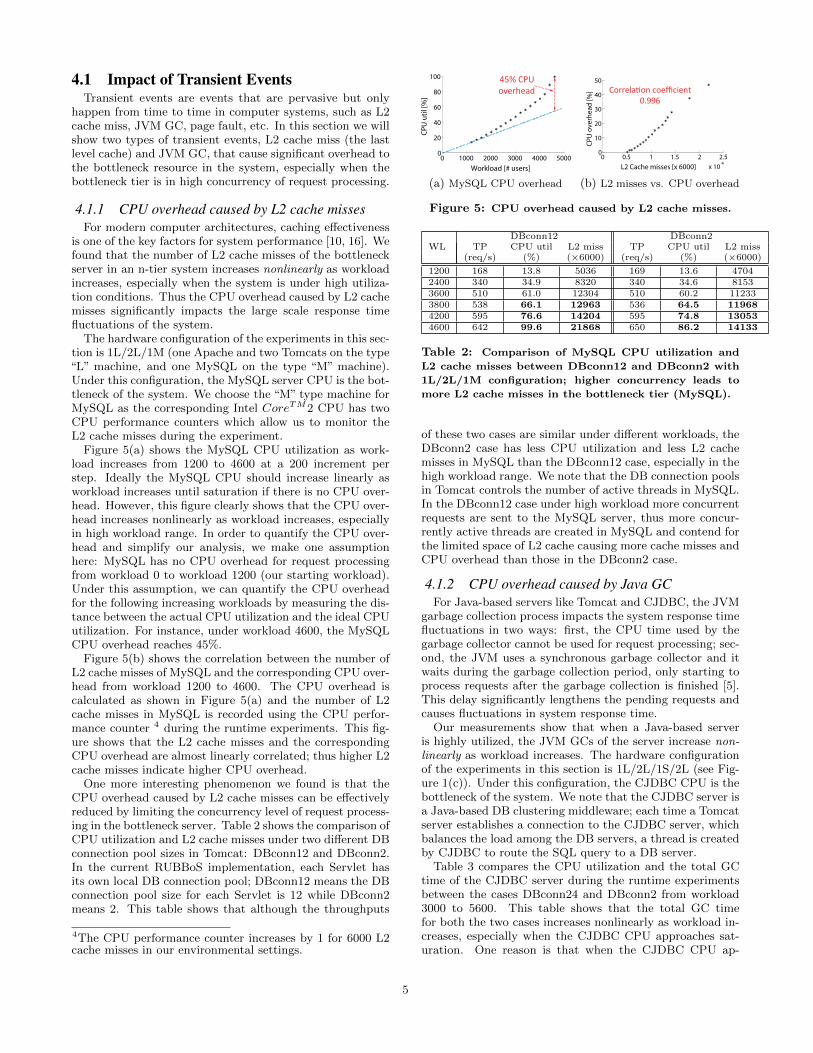
4.1 Impact of Transient EventsTransient events are events that are pervasive but only
happen from time to time in computer systems, such as L2cache miss, JVM GC, page fault, etc. In this section we willshow two types of transient events, L2 cache miss (the lastlevel cache) and JVM GC, that cause significant overhead tothe bottleneck resource in the system, especially when thebottleneck tier is in high concurrency of request processing.
4.1.1 CPU overhead caused by L2 cache missesFor modern computer architectures, caching effectiveness
is one of the key factors for system performance [10, 16]. Wefound that the number of L2 cache misses of the bottleneckserver in an n-tier system increases nonlinearly as workloadincreases, especially when the system is under high utiliza-tion conditions. Thus the CPU overhead caused by L2 cachemisses significantly impacts the large scale response timefluctuations of the system.
The hardware configuration of the experiments in this sec-tion is 1L/2L/1M (one Apache and two Tomcats on the type“L” machine, and one MySQL on the type “M” machine).Under this configuration, the MySQL server CPU is the bot-tleneck of the system. We choose the “M” type machine forMySQL as the corresponding Intel CoreTM2 CPU has twoCPU performance counters which allow us to monitor theL2 cache misses during the experiment.
Figure 5(a) shows the MySQL CPU utilization as work-load increases from 1200 to 4600 at a 200 increment perstep. Ideally the MySQL CPU should increase linearly asworkload increases until saturation if there is no CPU over-head. However, this figure clearly shows that the CPU over-head increases nonlinearly as workload increases, especiallyin high workload range. In order to quantify the CPU over-head and simplify our analysis, we make one assumptionhere: MySQL has no CPU overhead for request processingfrom workload 0 to workload 1200 (our starting workload).Under this assumption, we can quantify the CPU overheadfor the following increasing workloads by measuring the dis-tance between the actual CPU utilization and the ideal CPUutilization. For instance, under workload 4600, the MySQLCPU overhead reaches 45%.
Figure 5(b) shows the correlation between the number ofL2 cache misses of MySQL and the corresponding CPU over-head from workload 1200 to 4600. The CPU overhead iscalculated as shown in Figure 5(a) and the number of L2cache misses in MySQL is recorded using the CPU perfor-mance counter 4 during the runtime experiments. This fig-ure shows that the L2 cache misses and the correspondingCPU overhead are almost linearly correlated; thus higher L2cache misses indicate higher CPU overhead.
One more interesting phenomenon we found is that theCPU overhead caused by L2 cache misses can be effectivelyreduced by limiting the concurrency level of request process-ing in the bottleneck server. Table 2 shows the comparison ofCPU utilization and L2 cache misses under two different DBconnection pool sizes in Tomcat: DBconn12 and DBconn2.In the current RUBBoS implementation, each Servlet hasits own local DB connection pool; DBconn12 means the DBconnection pool size for each Servlet is 12 while DBconn2means 2. This table shows that although the throughputs
4The CPU performance counter increases by 1 for 6000 L2cache misses in our environmental settings.
0 1000 2000 3000 4000 50000
20
40
60
80
100
Workload [# users]
CPU
uti
l [%
]
45% CPU overhead
(a) MySQL CPU overhead
0 0.5 1 1.5 2 2.5
x 104
0
10
20
30
40
50
L2 Cache misses [x 6000]
CPU
ove
rhea
d [%
] Correla�on coefficient 0.996
(b) L2 misses vs. CPU overhead
Figure 5: CPU overhead caused by L2 cache misses.
WLDBconn12 DBconn2
TP CPU util L2 miss TP CPU util L2 miss(req/s) (%) (×6000) (req/s) (%) (×6000)
1200 168 13.8 5036 169 13.6 47042400 340 34.9 8320 340 34.6 81533600 510 61.0 12304 510 60.2 112333800 538 66.1 12963 536 64.5 119684200 595 76.6 14204 595 74.8 130534600 642 99.6 21868 650 86.2 14133
Table 2: Comparison of MySQL CPU utilization and
L2 cache misses between DBconn12 and DBconn2 with
1L/2L/1M configuration; higher concurrency leads to
more L2 cache misses in the bottleneck tier (MySQL).
of these two cases are similar under different workloads, theDBconn2 case has less CPU utilization and less L2 cachemisses in MySQL than the DBconn12 case, especially in thehigh workload range. We note that the DB connection poolsin Tomcat controls the number of active threads in MySQL.In the DBconn12 case under high workload more concurrentrequests are sent to the MySQL server, thus more concur-rently active threads are created in MySQL and contend forthe limited space of L2 cache causing more cache misses andCPU overhead than those in the DBconn2 case.
4.1.2 CPU overhead caused by Java GCFor Java-based servers like Tomcat and CJDBC, the JVM
garbage collection process impacts the system response timefluctuations in two ways: first, the CPU time used by thegarbage collector cannot be used for request processing; sec-ond, the JVM uses a synchronous garbage collector and itwaits during the garbage collection period, only starting toprocess requests after the garbage collection is finished [5].This delay significantly lengthens the pending requests andcauses fluctuations in system response time.
Our measurements show that when a Java-based serveris highly utilized, the JVM GCs of the server increase non-linearly as workload increases. The hardware configurationof the experiments in this section is 1L/2L/1S/2L (see Fig-ure 1(c)). Under this configuration, the CJDBC CPU is thebottleneck of the system. We note that the CJDBC server isa Java-based DB clustering middleware; each time a Tomcatserver establishes a connection to the CJDBC server, whichbalances the load among the DB servers, a thread is createdby CJDBC to route the SQL query to a DB server.
Table 3 compares the CPU utilization and the total GCtime of the CJDBC server during the runtime experimentsbetween the cases DBconn24 and DBconn2 from workload3000 to 5600. This table shows that the total GC timefor both the two cases increases nonlinearly as workload in-creases, especially when the CJDBC CPU approaches sat-uration. One reason is that when the CJDBC CPU ap-
5
WLDBconn24 DBconn2
TP CPU util GC TP CPU util GC(req/s) (%) (s) (req/s) (%) (s)
3000 428 49.6 0.05 428 49.2 0.054000 572 69.0 0.07 571 68.8 0.075000 721 86.1 1.06 719 84.8 0.195200 738 91.2 1.51 737 87.4 0.375400 759 94.3 1.72 767 91.1 0.405600 779 98.8 2.15 795 96.6 0.45
Table 3: Comparison of CJDBC CPU utilization and
JVM GC time between DBconn24 and DBconn2 with
1L/2L/1S/2L configuration; higher concurrency leads to
longer JVM GC time in the bottleneck tier (CJDBC).
proaches saturation, the available CPU for GC shrinks; thuscleaning the same amount of garbage takes longer time thanin the non-saturation situation. Accordingly, the impact ofJVM GC on system response time fluctuations is more sig-nificant when CJDBC approaches saturation.
Table 3 also shows that the total GC time of the CJDBCserver in the DBconn24 case is longer than that in the DB-conn2 case from workload 5000 to 5600. The reason is simi-lar to the L2 cache miss case as introduced in Section 4.1.1.Compared to the DBconn2 case, the Tomcat App tier inthe DBconn24 case is able to send more concurrent requeststo the CJDBC server under high workload, which in turncreates more concurrent threads for query routing and con-sumes more memory. Thus the CJDBC server performsmore GCs for cleaning garbage in memory in the DBconn24case than that in the DBconn2 case.
4.2 Fluctuation Amplification Effect in n-TierSystems
Unlike some embarrassingly parallel “web indexing” ap-plications using MapReduce and Hadoop, an n-tier appli-cation is unique in its amplification effect among differenttiers due to the complex resource dependencies across tiersin the system. For instance, small request rate fluctuationsfrom clients can be amplified to a bottom tier (e.g., DB tier),which causes significant response time fluctuation in the bot-tom tier; on the other hand, response time fluctuations inthe bottom tier can be amplified to the front tiers. In thissection we will discuss these two types of amplification ef-fects.
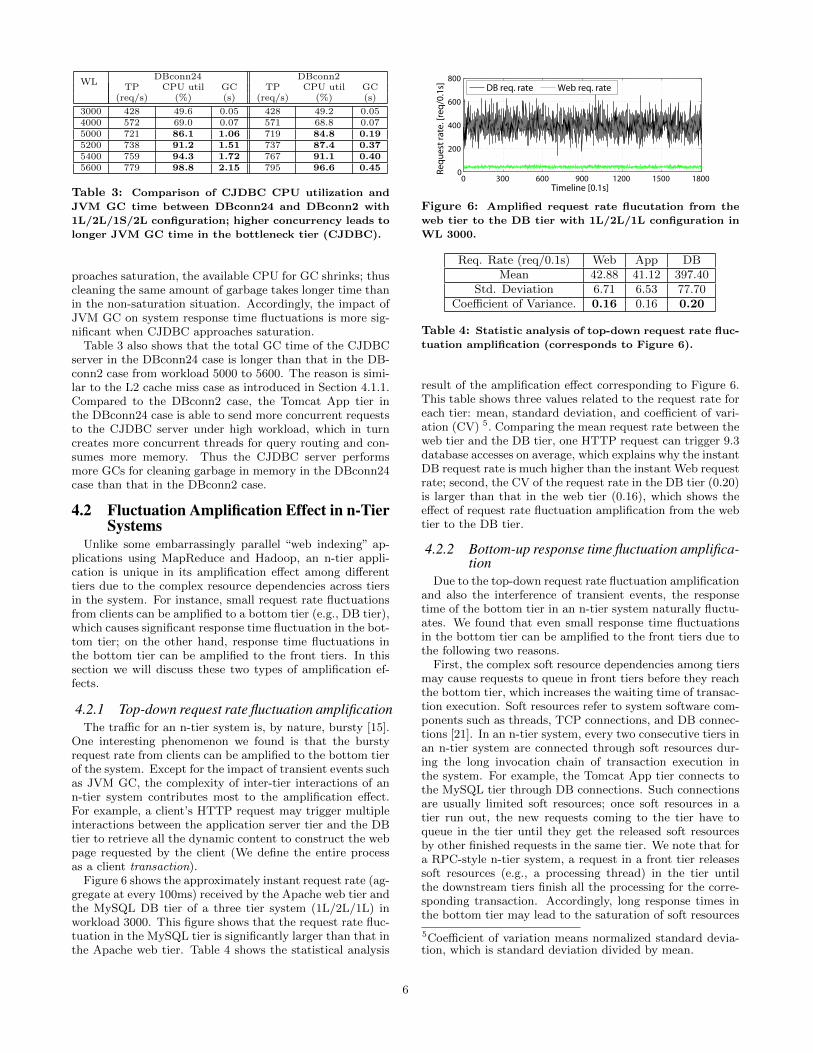
4.2.1 Top-down request rate fluctuation amplificationThe traffic for an n-tier system is, by nature, bursty [15].
One interesting phenomenon we found is that the burstyrequest rate from clients can be amplified to the bottom tierof the system. Except for the impact of transient events suchas JVM GC, the complexity of inter-tier interactions of ann-tier system contributes most to the amplification effect.For example, a client’s HTTP request may trigger multipleinteractions between the application server tier and the DBtier to retrieve all the dynamic content to construct the webpage requested by the client (We define the entire processas a client transaction).
Figure 6 shows the approximately instant request rate (ag-gregate at every 100ms) received by the Apache web tier andthe MySQL DB tier of a three tier system (1L/2L/1L) inworkload 3000. This figure shows that the request rate fluc-tuation in the MySQL tier is significantly larger than that inthe Apache web tier. Table 4 shows the statistical analysis
0 300 600 900 1200 1500 18000
200
400
600
800
Timeline [0.1s]
Req
ues
t ra
te. [
req
/0.1
s]
DB req. rate Web req. rate
Figure 6: Amplified request rate flucutation from the
web tier to the DB tier with 1L/2L/1L configuration in
WL 3000.
Req. Rate (req/0.1s) Web App DBMean 42.88 41.12 397.40
Std. Deviation 6.71 6.53 77.70Coefficient of Variance. 0.16 0.16 0.20
Table 4: Statistic analysis of top-down request rate fluc-
tuation amplification (corresponds to Figure 6).
result of the amplification effect corresponding to Figure 6.This table shows three values related to the request rate foreach tier: mean, standard deviation, and coefficient of vari-ation (CV) 5. Comparing the mean request rate between theweb tier and the DB tier, one HTTP request can trigger 9.3database accesses on average, which explains why the instantDB request rate is much higher than the instant Web requestrate; second, the CV of the request rate in the DB tier (0.20)is larger than that in the web tier (0.16), which shows theeffect of request rate fluctuation amplification from the webtier to the DB tier.
4.2.2 Bottom-up response time fluctuation amplifica-tion
Due to the top-down request rate fluctuation amplificationand also the interference of transient events, the responsetime of the bottom tier in an n-tier system naturally fluctu-ates. We found that even small response time fluctuationsin the bottom tier can be amplified to the front tiers due tothe following two reasons.
First, the complex soft resource dependencies among tiersmay cause requests to queue in front tiers before they reachthe bottom tier, which increases the waiting time of transac-tion execution. Soft resources refer to system software com-ponents such as threads, TCP connections, and DB connec-tions [21]. In an n-tier system, every two consecutive tiers inan n-tier system are connected through soft resources dur-ing the long invocation chain of transaction execution inthe system. For example, the Tomcat App tier connects tothe MySQL tier through DB connections. Such connectionsare usually limited soft resources; once soft resources in atier run out, the new requests coming to the tier have toqueue in the tier until they get the released soft resourcesby other finished requests in the same tier. We note that fora RPC-style n-tier system, a request in a front tier releasessoft resources (e.g., a processing thread) in the tier untilthe downstream tiers finish all the processing for the corre-sponding transaction. Accordingly, long response times inthe bottom tier may lead to the saturation of soft resources
5Coefficient of variation means normalized standard devia-tion, which is standard deviation divided by mean.
6

0 100 200 300 400 500 6000
50
100
150
200
250Browse−only mix transactions
Timeline [0.1s]
Con
curr
ent r
eque
sts
[#]
WebAppDB
(a) Approximately instant # of concurrent requests in each tier
0 100 200 300 400 500 6000
50
100
150
200
250ViewStory transactions
Timeline [0.1s]
Con
curr
ent r
eque
sts
[#]
WebAppDB
(b) Approximately instant # of concurrent ViewStory requests ineach tier
0 100 200 300 400 500 6000
0.2
0.4
0.6
0.8
1
Timeline [0.1s]
Res
pons
e tim
e [s
]
WebAppDB
(c) Approximately instant response time in each tier
0 100 200 300 400 500 6000
0.2
0.4
0.6
0.8
1
Timeline [0.1s]
Res
pons
e tim
e [s
]
WebAppDB
(d) Approximately instant response time for ViewStory requestsin each tier
Figure 7: Amplified response time fluctuations from the DB tier to the web tier with 1L/2L/1L (DBconn24) config-
uration in WL 5400.
(and thus a large number of queued requests) in front tiers.Figure 7(a) shows the approximately instant number of
concurrent requests (aggregated every 100ms) in each tierof a three-tier system (1L/2L/1L, MySQL is the bottlenecktier) under workload 5400. This figure shows that when thenumber of concurrent requests in MySQL reaches about 90,requests start to queue in the front tiers due to the scarcityof DB connections in Tomcat. Figure 7(c) shows the approx-imately instant response time in each tier. This figure showsthat very small response time fluctuations (within 50ms) inMySQL lead to large response time fluctuations in Tomcatand Apache; the high peaks of response time in Figure 7(c)match well with the high peaks of queued requests in fronttiers as shown in Figure 7(a). This indicates the waitingtime of requests in front tiers largely contributes to the longresponse time of transaction execution.
Second, multi-interactions between tiers of an n-tier sys-tem amplify the bottom-up response time fluctuations. Inan n-tier system it is natural that some transactions in-volve more interactions between different tiers than the othertransactions. For example, in the RUBBoS benchmark, aViewStory request triggers an average of twelve interactionsbetween Tomcat and MySQL; a small response time incre-ment in MySQL leads to a largely amplified response time inTomcat and thus longer occupation time of soft resources inTomcat. In such case, soft resources such as DB connectionsin Tomcat are more likely to run out, which leads to longerwaiting time of the queued requests in Tomcat.
Figure 7(b) and 7(d) show the similar graphs as shown inFigure 7(a) and 7(c), but only for ViewStory transactions.Compared to Figure 7(c), Figure 7(d) shows that the re-sponse time of ViewStory requests in the Apache tier fluctu-ates more significantly. This is because ViewStory requestsinvolve more interactions between Tomcat and MySQL thanthe average and run out their local DB connections earlierthan the other types of requests; thus new incoming View-Story requests have to wait longer in the Tomcat App tier
(or in the Apache web tier if the connection resources be-tween Apache and Tomcat also run out).
4.3 Impact of Mix-Transactions Scheduling inn-Tier Systems
Scheduling polices impacting web server performance havebeen widely studied [12, 18]. These previous works mainlyfocus on a single web server and show that the performancecan be dramatically improved via a kernel-level modifica-tion by changing the scheduling policy from the standardFAIR (processor-sharing) scheduling to SJF (shortest-job-first) scheduling. However, for more complex n-tier systemswhere a completion of a client transaction involves complexinteractions among tiers, the best OS level scheduling policymay increase the overall transaction response time.
The main reason for this is because the operating systemof each individual server in an n-tier system cannot distin-guish heavy transactions from light transactions without ap-plication level knowledge. A transaction being heavier thana light transaction can be caused by the heavy transactionhaving more interactions between different tiers than thelight one. However, in each individual interaction the pro-cessing time of the involved tiers for a heavy transaction canbe even smaller than that for a light transaction. Since theoperating system of a tier can only schedule a job based onthe processing time of the current interaction, applying SJFscheduling policy to the operating system of each tier mayactually delay the application level light transactions.
Figure 8 shows sample interactions between a TomcatApp tier and a MySQL tier for a ViewStory transaction(heavy) and a StoryOfTheDay transaction (light) specifiedin the RUBBoS benchmark. A ViewStory transaction in-volves multiple interactions between Tomcat and MySQL(see Figure 8(a)) while a StoryOfTheDay transaction in-volves only one interaction (see Figure 8(b)). Suppose MySQLis the bottleneck tier. Our measurements show that a singlequery from a ViewStory transaction has similar execution
7

MySQL V1 V3V2
HTTP call HTTP return
V4
Tomcat
time
processing time
Response time
(a) A sample ViewStory (heavy) transaction processing
MySQL
HTTP call HTTP return
Tomcat
timeS1
(b) A sample StoryOfTheDay (light) transaction processing
Figure 8: ViewStory vs. StoryofTheDay, different in-
teraction pattern between Tomcat and MySQL.
time in MySQL as a query from a StoryOfTheDay transac-tion. During each interaction, a thread in the MySQL tierreceives a query from Tomcat and returns a response afterthe query processing, regardless of which servlet sends thequery. From MySQL’s perspective, MySQL cannot distin-guish which transaction is heavy and which transaction islight. Thus either FAIR or SJF scheduling in the MySQLtier can delay the processing of the light transactions.
We note that once the waiting time of queries from lighttransactions increases in MySQL, the total number of queuedlight requests in upper tiers also increases. Since each queuedrequest (regardless if entailing heavy or light transactions)in upper tiers occupies soft resources such as threads andconnections, soft resources in upper tiers are more likely torun out under high workload. In this case, the response timefluctuations in a bottom tier are more likely to amplified toupper tiers (see Section 4.2.2).
5. SOLUTION AND EVALUATIONSo far we have discussed some system environmental con-
ditions causing the large scale response time fluctuationsunder high utilization conditions and explained the uniqueamplification effect inside an n-tier system. In this sectionwe will evaluate three heuristics to help stabilizing the largescale response time fluctuations.
Heuristic (i): We need to give higher priority to lighttransactions than heavy transactions to minimize the totalamount of waiting time in the whole n-tier system. We needto schedule transactions in an upper tier which can distin-guish light transactions from heavy transactions.
Heuristic (i) is essentially an extension of applying the SJFscheduling policy in the context of n-tier systems. Supposethe MySQL tier is the bottleneck tier; as explained in sec-tion 4.3, applying SJF scheduling policy to MySQL throughthe kernel-level modification may not reduce the overall sys-tem response time because MySQL cannot distinguish appli-cation level heavy transactions and light transactions. Thuswe need to schedule transactions in an upper tier that canmake such distinction in order to apply SJF scheduling pol-icy properly in an n-tier system. We define such schedulingas cross-tier-priority (CTP) based scheduling.
Figure 9 illustrates how to apply the CTP scheduling toa simple two-tier system. This figure shows only requestsfor two servlets (the RUBBoS browse-only workload con-
…
…heavy
transactions
light
transactions
Tomcat App tier MySQL DB tier
Local DB
connection pool
high priority queue
low priority queue
Thread
pool
sent query
first!
sent query
second…
…
…
…
Figure 9: Illustration of applying CTP scheduling policy
across tiers (only 2 servlets shown).
sists of requests for eight servlets): ViewStory (heavy) andStoryOfTheDay (light). Once ViewStory requests and Sto-ryOfTheDay requests reach the Tomcat App tier at the sametime, we give StoryOfTheDay requests higher priority tosend queries to MySQL. In this case the waiting time of thelight StoryOfTheDay transactions can be reduced and theoverall waiting time for all transactions is reduced 6.
Figure 10 shows the response time stabilization by apply-ing the CTP scheduling to a three-tier system (1L/2L/1Lwith DBconn2) in workload 5800. Under this configura-tion, the MySQL CPU is the bottleneck in the system. Fig-ure 10(a) and 10(c) show the results of the original RUB-BoS implementation (using the default OS level scheduling)and Figure 10(b) and 10(d) show the results after the CTPscheduling is applied to the Tomcat App tier and the MySQLDB tier (see Figure 9).
Figure 10(a) and Figure 10(b) show the number of concur-rent requests in each tier of the three-tier system for thesetwo cases. Although in both cases the number of concurrentrequests in the MySQL tier is very small (around eight),the fluctuations of the number of concurrent requests in theTomcat App tier and the Apache web tier are much higherin the original case than those in the CTP scheduling case.This is because in the original case more light requests arequeued in the upper tiers due to the increased waiting timeof light requests in the MySQL tier.
Figure 10(c) and Figure 10(d) show that the approxi-mately instant response time in the Apache web tier in theoriginal case has much larger fluctuations than that in theCTP scheduling case, which validates that CTP schedulingactually reduces the overall waiting time of all transactionsin the system. In fact the high peaks of response time inthese two figures perfectly matches the high peaks of thenumber of queued requests in upper tiers as shown in Fig-ure 10(a) and Figure 10(b).
Heuristic (ii): We need to restrict the number of concur-rent requests to avoid overhead caused by high concurrencyin the bottleneck tier.
Heuristic (ii) is illustrated by Figure 11. The hardwareconfiguration is 1L/2L/1S/2L where the CJDBC server CPUis the bottleneck of the system. We choose DBconn24 andDBconn2 for each servlet in Tomcat; the CPU utilizationand JVM GC time of the CJDBC server under differentworkloads are shown in Table 3.
Figure 11(a) and 11(b) show the approximately instantresponse time in the Apache web tier for the DBconn24 caseand the DBconn2 case in workload 5600 respectively. Thesetwo figures show that the response time in the DBconn24
6Heavy transactions are only negligibly penalized or not pe-nalized at all as a result of SJF-based scheduling [12].
8

0 300 600 900 1200 1500 18000
100
200
300
Original DBconn2 Case
Timeline [0.1s]
Con
curr
ent r
eque
sts
[#]
WebAppDB
(a) Approximately instant # of concurrent requests in each tier
0 300 600 900 1200 1500 18000
100
200
300
DBconn2 CTP Scheduling Case
Timeline [0.1s]
Con
curr
ent r
eque
sts
[#]
WebAppDB
(b) Approximately instant # of concurrent requests in each tier
0 300 600 900 1200 1500 18000
0.2
0.4
0.6
0.8
1
Timeline [0.1s]
Res
pons
e tim
e. [s
]
(c) Approximately instant response time in Apache web tier
0 300 600 900 1200 1500 18000
0.2
0.4
0.6
0.8
1
Timeline [0.1s]
Res
pons
e tim
e. [s
]
(d) Approximately instant response time in Apache web tier
Figure 10: Response time stabilization by applying CTP scheduling in 1L/2L/1L configuration in WL 5800.
case present much larger fluctuations than that in the DB-conn2 case. As shown in Table 3, the DBconn24 case inworkload 5600 has significantly longer JVM GC and highCPU utilization in CJDBC than those in the DBconn2 case.This set of results clearly shows that higher concurrency inthe bottleneck tier causes many more transient events suchas JVM GC, which in turn cause more CPU overhead in thetier and lead to large end-to-end response time fluctuations.
We note that lower concurrency in the bottleneck tier isnot always better; too low concurrency in the bottlenecktier may under-utilize the hardware resource in the tier anddegrade the overall system performance. Interested readerscan refer to [21] for more information.
Heuristic (iii): We need to allocate enough amount ofsoft resources in front tiers (e.g., web tier) to buffer largefluctuations of concurrent requests and avoid TCP retrans-mission.
This heuristic is illustrated in the motivation case. Thoughthe average concurrent requests over a long time windowis low (see Figure 4(i)), the approximately instant concur-rent requests may present high peaks that can be 10 timeshigher than the average (see Figure 4(h)) due to the impactof system environmental conditions discussed in this paper.Thus, allocating a large number of soft resources in fronttiers is necessary to buffer such high peaks of concurrent re-quests and avoid TCP retransmission. A reasonable alloca-tion should also be hardware dependent since soft resourcesconsume hardware resources such as memory.
6. RELATED WORKAutonomic self-scaling n-tier systems based on elastic work-
load in cloud for both good performance and resource effi-ciency has been studied intensively before [14, 17, 22, 23].The main idea of these previous works is to propose adaptivecontrol to manage application performance in cloud by com-bining service providers’ SLA specifications (e.g., boundedresponse time) and virtual resource utilization thresholds.Based on the average of the monitored metrics (e.g., re-sponse time, CPU) over a period of time (a control interval),
the controller of the system allocates necessary hardware re-sources to the bottleneck tier of the system once the targetthreshold is violated. However, how long a proper controlinterval should be is an open question and sometimes diffi-cult to determine. As shown in this paper, the average ofmonitored metrics based on inappropriately long control in-tervals may blur the large performance fluctuations causedby factors such as bursty workload or JVM GC.
The performance impact of bursty workloads for the tar-get n-tier system has been studied before. The authorsin [8, 15] observed that it is important to consider differ-ent time scales when the system is under bursty workload;though the system CPU utilization may be low at a coarsetime granularity, the CPU utilization fluctuates significantlyif observed at a finer time granularity, and such large fluctu-ation significantly impacts the n-tier system response time.Different from the previous works which mainly focus onbursty workload, we focus more on system aspects such asJVM GC, scheduling policy, and fluctuation amplificationeffects in n-tier systems. As shown in this paper, the end-to-end response time presents large scale fluctuations becauseof system environmental conditions even under the moder-ately bursty workload.
Analytical models have been proposed for performanceprediction and capacity planning of n-tier systems. Chen etal. [9] present a multi-station queuing network model withregression analysis to translate the service providers’ SLAspecifications to lower-level policies with the purpose of op-timizing resource usage of an n-tier system. Thereska etal. [20] propose a queuing modeling architecture for clus-tered storage systems which constructs the model duringthe system design and continuously refines the model duringoperation for better accuracy due to the changes of system.Though these models have been shown to work well for par-ticular domains, they are constrained by rigid assumptionssuch as normal/exponential distributed service times, disre-gard of some important factors inside the system which cancause significant fluctuations of both application level andsystem level metrics.
9

0 300 600 900 1200 1500 18000
0.5
1
1.5Original DBconn24 Case
Timeline [0.1s]
Res
pons
e tim
e. [s
]
(a) Approximately instant response time in Apache web tier
0 300 600 900 1200 1500 18000
0.5
1
1.5Original DBconn2 Case
Timeline [0.1s]
Res
pons
e tim
e. [s
]
(b) Approximately instant response time in Apache web tier
Figure 11: Response time stabilization by limiting bottleneck tier concurrency in 1L/2L/1S/2L config. in WL 5600.
7. CONCLUSIONSWe studied the large scale response time fluctuations of
n-tier systems in high resource utilization using the n-tierbenchmark RUBBoS. We found that the large scale responsetime fluctuations can be caused by some system environ-mental conditions such as L2 cache miss, JVM GC, andlimitations of OS level scheduling policies in the system, inaddition to the bursty workload from clients. We showedthat because of the complex resource dependencies acrosstiers, a small response time fluctuation in a bottom tier canbe amplified to front tiers and eventually to clients. Tomitigate the large scale response time fluctuations, we eval-uated three heuristics to stabilize the response time fluctua-tions while still achieving efficient resource utilization. Ourwork is an important contribution to design more effectiveautonomous self-scaling n-tier systems in cloud to achieveboth good performance and resource efficiency under elasticworkloads.
8. ACKNOWLEDGEMENTThis research has been partially funded by National Sci-
ence Foundation by IUCRC/FRP (1127904) , CISE/CNS(1138666), RAPID (1138666), CISE/CRI (0855180), NetSE(0905493) programs, and gifts, grants, or contracts fromDARPA/I2O, Singapore Government, Fujitsu Labs, WiproApplied Research, and Georgia Tech Foundation throughthe John P. Imlay, Jr. Chair endowment. Any opinions,findings, and conclusions or recommendations expressed inthis material are those of the author(s) and do not necessar-ily reflect the views of the National Science Foundation orother funding agencies and companies mentioned above.
References[1] Rice University Bulletin Board System. "http://jmob.
ow2.org/rubbos.html", 2004.
[2] What is the average response time for display-ing results. "http://support.google.com/mini/bin/answer.py?hl=en&answer=15796", 2004.
[3] collectl: Versatile Resource monitoring Tool. "http://collectl.sourceforge.net/", 2010.
[4] Fujitsu SysViz. "http://www.google.com/patents?id=0pGRAAAAEBAJ&zoom=4&pg=PA1#v=onepage&q&f=false", 2010.
[5] Java SE 6 Performance White Paper. http://java.sun.com/performance/reference/whitepapers/6_performance.html, 2010.
[6] T. Abdelzaher, Y. Diao, J. Hellerstein, C. Lu, andX. Zhu. Introduction to control theory and its appli-
cation to computing systems. SIGMETRICS Tutorial,2008.
[7] S. Adler. The Slashdot Effect: An Analysis ofThree Internet Publications. http://stephenadler.org/tiki-index.php?page=The+Slashdot+Effect.
[8] P. Bodik, A. Fox, M. J. Franklin, M. I. Jordan, andD. A. Patterson. Characterizing, modeling, and gener-ating workload spikes for stateful services. SoCC ’10.
[9] Y. Chen, S. Iyer, X. Liu, D. Milojicic, and A. Sahai.Translating service level objectives to lower level poli-cies for multi-tier services. Cluster Computing, 2008.
[10] S. Cho and L. Jin. Managing distributed, shared l2caches through os-level page allocation. MICRO ’06.
[11] T. Forell, D. Milojicic, and V. Talwar. Cloud manage-ment: Challenges and opportunities. In IPDPSW ’11.
[12] M. Harchol-Balter, B. Schroeder, N. Bansal, andM. Agrawal. Size-based scheduling to improve web per-formance. ACM Trans. Comput. Syst., 2003.
[13] E. C. Julie, J. Marguerite, and W. Zwaenepoel. C-JDBC: Flexible Database Clustering Middleware. 2004.
[14] H. C. Lim, S. Babu, and J. S. Chase. Automated controlfor elastic storage. ICAC ’10.
[15] N. Mi, G. Casale, L. Cherkasova, and E. Smirni. In-jecting realistic burstiness to a traditional client-serverbenchmark. ICAC ’09.
[16] K. S. Min Lee. Region scheduling: Efficiently using thecache architectures via page-level affinity. ASPLOS ’12.
[17] P. Padala, K.-Y. Hou, K. G. Shin, X. Zhu, M. Uysal,Z. Wang, S. Singhal, and A. Merchant. Automatedcontrol of multiple virtualized resources. EuroSys ’09.
[18] B. Schroeder, A. Wierman, and M. Harchol-Balter.Open versus closed: a cautionary tale. NSDI’06.
[19] B. Snyder. Server virtualization has stalled, despite thehype. InfoWorld, 2010.
[20] E. Thereska and G. R. Ganger. Ironmodel: robust per-formance models in the wild. SIGMETRICS ’08.
[21] Q. Wang, S. Malkowski, Y. Kanemasa, D. Jayasinghe,P. Xiong, M. Kawaba, L. Harada, and C. Pu. Theimpact of soft resource allocation on n-tier applicationscalability. IPDPS ’11.
[22] P. Xiong, Z. Wang, S. Malkowski, Q. Wang, D. Jayas-inghe, and C. Pu. Economical and robust provision-ing of n-tier cloud workloads: A multi-level control ap-proach. ICDCS ’11.
[23] X. Zhu, M. Uysal, Z. Wang, S. Singhal, A. Merchant,P. Padala, and K. Shin. What does control theory bringto systems research? SIGOPS Oper. Syst. Rev., 2009.
10