when does product liability risk chill innovation
TRANSCRIPT

When does product liability risk chill innovation? Evidence from
medical implants∗
Alberto Galasso† Hong Luo‡
August 20, 2021
Abstract
Liability laws designed to compensate for harms caused by defective products may also affect in-
novation. We examine this issue by exploiting a major quasi-exogenous increase in liability risk faced
by US suppliers of polymers used to manufacture medical implants. Difference-in-differences analyses
show that this surge in suppliers’ liability risk had a large and negative impact on downstream innovation
in medical implants, but it had no significant effect on upstream polymer patenting. Our findings suggest
that liability risk can percolate throughout a vertical chain and may have a significant chilling effect on
downstream innovation.
Keywords: product liability, innovation, tort, medical devices, vertical foreclosure
JEL Codes: O31, O32, O34, K13.
The relationship among risk, uncertainty and investments is fundamental to understanding economic
growth and technological change (e.g., Bernanke, 1983; Bloom, 2009; Fernandez-Villaverde and Rubio-
Ramirez, 2015). A major source of risk faced by firms are product liability laws that are designed to protect
customers from defective or dangerous products (Jarrell and Peltzman, 1985; Daughety and Reinganum,
1995; Hay and Spier, 2005). In 2016, product liability cases accounted for roughly 70 percent of the personal
injury civil cases filed in US district courts. Cases such as these often make the headlines because of their
∗We thank Philippe Aghion, James Dana, Michael Frakes, Matt Grennan, Deepak Hegde, Curtis Huttenhower, Craig Garthwaite,Ben Jones, Kyle Myers, Arti Rai, Kathryn Spier, Ross Schmucki, Ariel Stern, Martin Watzinger, Rosemarie Ziedonis and seminarparticipants at Columbia Business School, Kellogg, Iowa State University, University of Toronto, University of Minnesota, DukeEmpirical Health Law conference, Innovation conference at the London School of Economics, IFN Stockholm Entrepreneurship andInnovation conference, NBER Productivity Lunch Seminar, NBER Summer Institute, NBER-AIEA Conference, REER conferenceat Georgia Tech, 2018 ASSA annual meeting in Philadelphia, and the Role of Technological Change in Driving Health TrendsConference at University of Chicago for helpful comments. Madeleine Rawling, Taro Tan, Melanie Vig, Esther Yan, Louise Yu,and Darya Zotova provided excellent research assistance. We are grateful for financial support from the Michael Lee-Chin FamilyInstitute for Corporate Citizenship at the University of Toronto and the Social Sciences and Humanities Research Council of Canada.
†University of Toronto, CEPR, and NBER; email: [email protected].‡Harvard Business School; email: [email protected].
1
large damage awards. For example, General Motors recently paid about $2.5 billion in penalties and settle-
ments in cases involving faulty ignition switches linked to 124 deaths and 275 injuries. Recently, advances in
fields such as artificial intelligence and sophisticated robotics (e.g., driverless cars, robot-assisted surgeries,
and robot caregivers for the elderly and disabled) have rekindled lively policy debates over whether existing
liability systems constrain technological progress and present an opportunity to redesign liability rules.1
Theoretical models in law and economics suggest that the impact of liability risk on innovation is am-
biguous (e.g., Daughety and Reinganum, 2013). On the one hand, higher liability may reduce innovation
incentives by raising the costs of or chilling the demand for new technologies associated with greater risk.
On the other hand, it may also increase the profitability of and the demand for risk-mitigating technologies
and safer product designs that reduce the likelihood of injuries. This theoretical ambiguity highlights the
importance of empirical research to identify conditions under which the liability system may incentivize or
chill innovation and to examine the underlying economic mechanisms.
The dominant view in the policy debate has been that, for the U.S. liability regime, the chilling effect on
innovation outweighs the positive incentivizing effect. In an influential book examining more than 100 in-
dustries across major trading nations, Porter (1990) recommends “a systematic overhaul of the U.S. product
liability system,” arguing that in the U.S., “product liability is so extreme and uncertain as to retard innova-
tion.” This view is also common in the legal literature (e.g., Huber, 1989; Parchomovsky and Stein, 2008;
Priest, 2011); has shaped high-profile legal cases (e.g., the 2007 Riegel v. Medtronic Supreme Court case);
and often underlies the arguments by proponents of tort reforms.2 Despite its intuitive appeal, this negative
view does not seem to find support in the scarce empirical evidence linking liability risk and innovation. If
anything, the two empirical studies examining this issue—Viscusi and Moore (1993) and Galasso and Luo
(2017)—show that, on average, higher liability risk induces higher R&D spending and more patenting.
In this paper, we provide the first set of large-sample evidence of a substantial chilling effect in an
economically and socially important sector. Importantly, we show that this effect is driven primarily by
a specific mechanism—the surge in upstream liability that led to extensive vertical foreclosure by large
suppliers, which, in turn, negatively affected downstream investments in innovation. Vertical production and
distribution chains are common in many modern industries, and how liability burdens should be allocated
across parties in these chains is a critical feature of tort law. Theoretical models have shown that, in many
settings, different allocation rules matter for social efficiency (Marchand and Russell, 1973; Posner, 1986;
1Indeed, in February 2017, the European Parliament adopted—by a large majority—a resolution containing recommendationsfor EU-wide legislation to regulate “sophisticated robots, bots, androids and other manifestations of artificial intelligence” and toestablish legislative instruments related to the liability for their actions (European Parliament, 2017).
2For example, in August 2017, the American Tort Reform Association (ATRA) filed an amicus brief in the Massachusetts caseof Rafferty vs. Merck, arguing that excessive liability risk “would substantially disrupt innovators’ ability to invest in furtherinnovation and their incentive to innovate.”
2
Hay and Spier, 2005), but empirical analysis of these questions is extremely limited. This paper provides
novel evidence on how liability risk can percolate through the vertical chain and impact innovation by firms
and in segments that are not directly targeted by litigation.
Our analysis exploits a quasi-exogenous surge in the liability risk faced by large, common input suppliers
to medical implants in the early 1990s. Medical implants such as heart valves, pacemakers, replacement
joints, and intraocular lenses save or improve the lives of millions of people every year. According to
industry reports, the U.S. implantable device market was about $71 billion in 2016, and implants account
for roughly 20 percent of medical device patenting and about 60 percent of Food and Drug Administration
(FDA) Class III device applications.3 Medical implants are manufactured using biomaterials that are direct or
modified applications of common materials such as metals, polymers and ceramics. These raw materials are
often produced by large companies that supply to a wide range of sectors in the economy. During the 1970s
and 1980s, large firms, such as DuPont and Dow Chemicals, were the dominant suppliers of polymers and
silicone used in many implants, including prostheses, body tissues, pacemakers, and heart valves (Aronoff,
1995). The standard policy for these large companies was to not withhold materials from the medical sector
and to warn device producers that suppliers were not responsible for testing and determining the safety of
implants (Kerouac, 2001).
In the late 1980s, a series of unexpected and widespread problems arose with temporomandibular joint
(TMJ) jaw implants and silicone breast implants. Vitek, the leading producer of TMJ implants at the time,
filed for bankruptcy in 1990, thus inducing a large number of TMJ implant recipients to file lawsuits against
DuPont, which was ‘deep-pocket’ polymer supplier of Vitek’s. During the same time period, a leading
manufacturer of silicone breast implants also filed for bankruptcy, and silicone suppliers were named as
defendants in numerous lawsuits (Feder, 1994). We present a variety of evidence based on historical industry
accounts, congressional hearings, discussions with industry insiders, courts dockets, and media mentions,
documenting how Vitek’s bankruptcy in 1990 and the TMJ and breast implant litigations against material
suppliers dramatically raised liability concerns for all material suppliers (not just suppliers directly involved
in these litigations) that sold to all implant manufacturers (not just the two types of devices). The focus of
our analysis will be the impact that this surge in upstream suppliers’ liability risk had on medical implant
innovation overall (specifically, on types of implant products that were not involved in the litigations).
To illustrate the key mechanism at work, we propose a simple model in which innovation can take place
at both the upstream and downstream stages of a vertical chain. In our model, an upstream supplier sells
a homogeneous and necessary input to multiple downstream markets. We show that when serving one of
3Class-III devices are devices used to support or sustain human life; devices of substantial importance in preventing impairmentof human health; or devices that present a potential, unreasonable risk of illness or injury.
3
the markets generates a high liability risk for the upstream supplier, it may choose to withdraw from (i.e.,
foreclose) the risky downstream market. This would have a strong negative impact on downstream firms’
profits and innovation incentives in the foreclosed market. At the same time, when the foreclosed market
accounts for only a small fraction of upstream revenues, the upstream supplier’s innovation incentives are
only marginally affected.
Our empirical analysis focuses on the impact of this surge in liability risk on implant technologies,
using non-implant technologies as the control. Our main sample includes the universe of granted medical
device patents applied for at the United States Patent and Trademark Office (USPTO) between 1985 and
1995. We develop a textual analysis algorithm to identify patents related to implant technologies, exploiting
the written description of the invention. We then use the detailed USPTO classification system to identify
a set of implant subclasses—i.e., technological subclasses containing a large fraction of implant patents.
Importantly, we exclude patenting related to TMJ and breast implants and focus on the impact on other
implant technologies.
Our main finding, based on a series of difference-in-differences regressions, is that medical implant
patenting decreased by 35 percent relative to patenting in other medical device technologies after 1990. We
show that this decline was not driven by differential patenting trends in implant and non-implant subclasses
before 1990. Dynamically, the effect was immediate but small and grew larger over time. The increasing
magnitude is compatible with implant innovators gradually reducing their patent applications as an increas-
ing number of polymer and silicone suppliers withdrew from the market.
We examine the extent to which our finding is driven by firms that could reallocate R&D resources from
implant to non-implant technologies. Our estimates suggest that even if such within-firm substitution took
place, its influence was likely to be small, implying an overall decline in medical device innovation. We
then subject our data to a variety of tests to i) control for potential confounding factors, such as demand and
technology trends that affect implant and non-implant innovation differently; and ii) isolate alternative mech-
anisms, such as a greater concern about lawsuits among implant producers themselves and a potential decline
in the demand for implant devices, given the failures of TMJ and breast implants. Among a collective body
of evidence, triple-differences regressions—which control for common technology or demand trends taking
place in the same technological areas—show that implant patenting by US firms experienced a large and
statistically significant decline relative to patenting by foreign firms in the same technology classes. Industry
reports describing the events suggest that these heterogeneous effects were likely driven by differences in
access to foreign material suppliers, which supports the predictions of our theoretical framework.
Using FDA device approval data, we show that the significant decline in implant innovation is present
4
not only at the research stage, but also at the commercialization stage. The FDA data also help us to consider
alternative mechanisms. First, taking advantage of data on adverse events that form the basis for lawsuits,
we show not only that the large decline in implant innovation is robust to controlling for the extent of adverse
events associated with a given product type, but also that it holds for product types about which there should
be little concern about downstream liability. Second, we show that data on FDA approval time do not suggest
a significant change in regulatory concerns over implant safety in general.
Having documented a large and significant decline in implant innovation, we then explore what hap-
pened to innovation by upstream suppliers of polymers used in medical implants. We find no evidence of
a negative impact on upstream innovation, even for DuPont. This is consistent with our theoretical model
and confirms that the innovation incentives of these large firms were driven by the aggregate demand from
multiple downstream markets.
To restore the supply incentive of material producers, Congress passed the Biomaterials Access Assur-
ance Act (BAAA) in 1998. This Act exempted material suppliers from liability risk as long as they were
not engaged in the design and production of the implants, and the inputs themselves were not dangerous or
defective. A precise estimate of the policy’s impact on the industry is outside the scope of this paper, but we
provide an illustrative analysis indicating that, relative to non-implant technologies, implant patenting re-
covered gradually four to five years after the BAAA. This finding suggests that federal exemption regulation
could be a useful policy instrument when state product liability laws are insufficient to insulate important
players in the value chain from high uncertainty about liability. Moreover, we do not observe an overshoot of
implant patenting in the longer run, suggesting that the decline observed in the early 1990s does not capture
simply a delayed investment.
Taken together, our findings show that liability risk can percolate throughout an industry’s vertical chain
and may have a significant chilling effect on downstream innovation. The mechanism we document in this
paper can be rather general: large suppliers of general-purpose inputs interacting with many downstream
industries may restrict their supply to segments in which liability risk and uncertainty are the highest. In
particular, they may do so if (i) the extent of harms and their probabilities are difficult to predict; and (ii)
many downstream innovators are small and are likely to resort to bankruptcy when liability claims exceed the
value of the firm. Nascent domains such as artificial intelligence and robotics, for which start-up innovation
can be critical, are natural settings in which these concerns may emerge. More broadly, our paper provides
new evidence for how the tort system may affect innovation incentives and suggests that these policies should
be designed with such dynamic effects in mind (Finkelstein, 2004).
5
1 Related literature
We are aware of only two empirical studies in economics and management linking liability and innova-
tion: Viscusi and Moore (1993) and Galasso and Luo (2017). In their pioneering work, Viscusi and Moore
(1993) examine the relationship between product liability insurance costs for manufacturers and their R&D
investments. Theoretically, higher liability decreases R&D because of higher costs, but it also encourages in-
novation that increases product safety. Using a cross-sectional dataset covering large US firms in the 1980s,
Viscusi and Moore (1993) document a strong positive correlation between liability insurance expenditures
and firms’ R&D intensity, suggesting that, on average, product liability promotes rather than discourages
innovation. Galasso and Luo (2017) explore a demand channel and also derive theoretically offsetting ef-
fects: higher liability exposure of physicians chills demand for new technologies associated with greater
risk but increases demand for risk-mitigating technologies that reduce injuries. Empirically, they also show
that the positive effect dominates: on average, states passing tort reforms that decrease physicians’ exposure
to medical malpractice liability experience a significant decrease in medical-device patenting.4 Our paper
contributes to this line of research by providing new, causal estimates of a large chilling effect of liability on
innovation and by identifying a novel mechanism—upstream liability percolating through the value chain.
Our paper also contributes to the broader economic literature on product liability, a key question of
which is how alternative liability rules affect the incentives to take precautions; see Shavell (2007) for a
survey. Many empirical studies related to this question focus on the link between legal liabilities and med-
ical practice (e.g., Kessler and McClellan, 1996; Currie and MacLeod, 2008; Frakes, 2013; Avraham and
Schanzenbach, 2015; Frakes and Jena, 2016). These studies tend to focus on the liability cost faced by
a single party, with Hay and Spier (2005) and Helland et al. (2020) being the exceptions. Hay and Spier
(2005) study, theoretically, the optimal allocation of tort liabilities between manufacturers and consumers,
when consumers are insolvent and their use of a product may cause harms to third parties. They show that
even though it may be optimal for manufacturers to share the residual liability under certain conditions,
a consumer-only liability regime may be preferable when consumers are heterogeneous or possess private
information. Helland et al. (2020) show that because drug companies’ prices need to be uniform across
jurisdictions, shifting liability towards them in a small jurisdiction will actually increase physicians’ pre-
scriptions of a potentially harmful product. Our paper differs from Helland et al. (2020) in its focus on
vertical foreclosure and the effect of liability shift on innovation investments.
A related set of studies examines the safety-access trade-off generated by the FDA approval process:
4Relatedly, Galasso and Luo (2021) show that following an increase in customers’ (and physicians’) perceived risk of radiationdiagnostic devices, which was triggered by wide media coverage of a series of over-radiation accidents, CT producers increasedinnovation, in particular in features and technologies that mitigate radiation risk.
6
more-stringent regulations create value by inducing greater safety and higher quality, but they may also lead
to fewer available products in the market. In an influential paper, Peltzman (1973) shows that the 1962
drug amendments requiring proof of efficacy in addition to safety led to a significant decrease in welfare.
In contrast, Grennan and Town (2020) find that for coronary stents, the efficacy requirement in the U.S. is
critical for reducing quality uncertainty and facilitating adoption. Their counterfactual analysis shows that
the U.S. policy is close to optimal, while the European Union, which currently requires only safety, would
benefit from additional efficacy testing. Our paper differs from the above papers in two aspects: we focus
on product liability risk, which stems from an ex-post policy rather than from an ex-ante regulation; and we
study how misallocation of liability risk across market players may matter.
Finally, our paper is related to studies examining how public policies focusing on achieving social goals
other than innovation affect the rate and direction of innovation. In the health sector, Finkelstein (2004)
finds that policy changes designed to increase the usage of pre-existing vaccines are associated with a 2.5-
fold increase in clinical trials for new vaccines. Acemoglu et al. (2006) find that the introduction of Medicare
is not associated with an increase in drug consumption among the elderly; and, consistent with this, they find
no evidence of an increase in the approval of new drugs targeting diseases that affect the elderly.
2 Medical implants, biomaterials, and liability risk
The FDA defines medical implants as devices or tissues that are placed inside or on the surface of the body.
Typically, implants are prosthetics (i.e., replacements of body parts) but may also deliver medication, monitor
body functions, or provide support to organs and tissues. Silicone breast implants, hip replacement joints
and artificial heart valves are all examples of implantable medical devices. Implants are produced using
synthetic biomaterials that replace or restore function to body tissue (Davis, 2003). Biomaterials are direct
or modified applications of common materials (such as metals, polymers, ceramics, and their composites)
that can sustain continuous or intermittent contact with body fluids. These common materials are often
produced by large companies that supply a wide range of industrial sectors.
TMJ implants are intended to replace (entirely or in part) the temporomandibular joint (jaw). In the
1980s, Vitek was the leading producer of TMJ implants in the US. Its product obtained FDA approval
in 1983 after expert panels reviewed a series of scientific reports and clinical trial results. Oral surgeons
across the US liked Vitek’s product, which quickly became the state-of-the-art device in the field (Schmucki,
1999). Several years later—unexpectedly and despite the initial positive response—surgeons started to notice
widespread problems with Vitek’s implants, including fragmentation, bone resorption and delamination. In
January 1990, the FDA issued a letter to Vitek advising them to warn surgeons against implanting further
devices. In June 1990, Vitek filed for bankruptcy under a deluge of lawsuits.
7
After Vitek’s bankruptcy, implant recipients started to file a large number of lawsuits against DuPont,
the polymer supplier for Vitek’s implants and a large firm with a ‘deep pocket.’ A total of 651 lawsuits were
filed, involving 1,605 implant recipients and their spouses across more than 40 states (Schmucki, 1999).
Eventually, DuPont won all the suits that went on trial, but the process took ten years and cost the company
over $40 million.5 This was a large sum compared to the revenue that DuPont obtained from TMJ implants
(a few thousand dollars in total, as each device that Vitek produced contained only about five cents’ worth
of DuPont’s raw material).
Contemporaneously with the TMJ litigation, problems also surfaced with silicone breast implants, with
numerous recipients reporting joint soreness and body pain allegedly related to leakages (Czuba, 2016).
Again due to widespread litigation, one of the leading implant manufacturers, Dow Corning, filed for
bankruptcy in May 1995. Silicone suppliers, including Dow Corning’s parent companies—Dow Chemicals
and Corning—and other suppliers such as General Electric and Union Carbide, became targets of litigation
by implant recipients (Feder, 1994).6
These litigations had significantly affected raw material producers’ assessment of their liability when
supplying to implant manufacturers. As a result, many suppliers changed their supply policies. For 30
years, the common supply policy had been to not withhold materials from the medical sector, even though,
for many large firms, the revenue from this sector was negligible in comparison to their revenues from
other applications (e.g., automotive, electrical or textile markets). According to Aronoff (1995), the implant
markets accounted for only 0.005% of the total revenues from other industries for polymer producers. A
common practice was to state that the materials were not made for medical applications and that medical
implant manufacturers would have to rely upon their own independent medical judgment. Such supply
policy relied on common law protections for component and raw-material suppliers.7
The TMJ and breast implant litigations implied that these industry practices may not have been sufficient
to keep the suppliers’ liability risk commensurate with their expected revenue. Following these events, many
material producers dramatically changed their policy for supplying permanent implant producers (Service,
5“Biomaterials Access Assurance Act of 1997,” Hearing Before the Subcommittee on Commercial and Administrative Law ofthe Committee on the Judiciary, House of Representatives, One Hundred Fifth Congress, First Session, on H.R. 872, June 12 1997.
6At the time of these events, both TMJ and breast implants were classified as Class-II devices, without a stringent requirementof demonstration of safety and effectiveness. In response to emergent safety concerns, the FDA reclassified TMJ devices intoClass III—the highest risk category—in 1993 and called for submission of Premarket Approval Applications (PMAs) from allmanufacturers of these devices in 1998. For breast implants, the reclassification took place in 1988 and the call for submission ofPMAs occurred in 1991.
7In particular, the ‘component parts’ and ‘sophisticated purchaser’ doctrines stipulate that the suppliers are not liable unless thecomponent or material per se is defective, or the process of integrating them has caused the adverse effect (Kerouac, 2001). Thebasic rationales are that if the supplier sells a product that has widespread use in many industries, it would have no specializedknowledge of how the buyer would use the product and could not foresee and remedy the potential hazards. Similarly, if the buyersubstantially altered the material, the material supplier would not be held liable to the ultimate consumer.
8
1994). In a new supply policy issued in January 1993 (see Appendix A), DuPont refused to sell materials
to all manufacturers of permanently implantable medical devices and restricted the supply to temporary
implants, while its old policy remained unchanged for non-implant devices. Because the use of polymeric
materials is extremely common for implants and their components, and DuPont was a primary supplier, this
affected a wide range of products, from sutures and fracture fixation devices to pacemakers and heart valves.
A number of other major suppliers also exited the market around the same time (RAND, 2000). Notably,
in 1990, Dow Chemicals announced that, starting in 1992, it would cease supplying materials to implant
producers (Borzo, 1994).8
Prompted by the withdrawal of these large suppliers, the Health Industry Manufacturers Association
(HIMA) commissioned a comprehensive report examining the status of the biomaterial market (Aronoff,
1995). A survey conducted for Aronoff’s (1995) study showed that about 60 percent of surveyed suppliers
were unwilling to supply medical implants producers and identified the fear of product liability suits as their
primary reason. Respondents were explicit about not wanting to find themselves in the same situation as
DuPont. Many of the remaining suppliers required purchasers to execute strong indemnification agreements.
They also required proof, in advance of sales, that buyers had enough insurance coverage and other assets to
honor those agreements (Baker, 1995).
This supply shift was, perhaps, the greatest for polymer and silicone materials, but anecdotal evidence
suggests that the liability concerns reached beyond polymeric materials; according to Citron (1994), for
example, a well-established manufacturer of integrated circuits refused to supply its chips for implanted
devices. On May 20, 1994, the US Senate Subcommittee on Regulation and Government Information heard
testimony regarding the availability of biomaterials. For example, James Benson, Senior VP of HIMA,
explained that “in many cases, there are no alternative suppliers for these materials.” Other testimonies
emphasized that even when alternatives existed, the costs required to identify suitable replacements and to
qualify them could be extremely high. Other statements in the hearings explained how device companies
were responding to these shortages by stockpiling resources that were still available or by signing more-
onerous contracts with the few suppliers willing to serve the market. Testifiers also claimed that these
reactions affected firms’ innovation investments by diverting resources away from the development of new
products toward finding and securing materials required for existing product lines (Aronoff, 1995).
8As a polymer supplier for medical implants, Dow Chemicals was not as dominant as DuPont, but its polymer products wereused in leads and connectors for pacemakers, defibrillators, and similar devices (Borzo, 1994).
9
3 Theoretical framework
In this section, we describe a simple model that captures some of the basic features of our empirical setting.
The framework illustrates the key channel through which a surge in liability risk faced by an upstream
supplier may affect innovation investments in our empirical context. We discuss many of the details that we
abstract away in Section 3.2.
An upstream (polymer) producer may develop a new product that can be used by manufacturers in
downstream market A (medical implants) and by many other industries (collectively denoted as market B).
Both the upstream firm and the downstream firms in market A can invest in innovation. For simplicity,
we assume that no innovation occurs in market B. In the absence of innovation, the upstream firm sells a
‘standard’ product in a competitive market and obtains zero profits. Innovation requires a fixed development
cost, IU . If successful, the upstream firm can now sell a new (high-quality) product as a monopolist in both
market A and market B. The marginal cost of production for the new product is equal to zero.
Market A comprises a continuum of downstream users of mass one. Buying one unit of the upstream
input, each user can obtain gross surplus v after sustaining a fixed development cost, ID. We assume that
v is uniformly distributed over[ID,1+ ID
]. This implies that when the input is sold at price p, only users
for which v− p− ID ≥ 0 buy the good, and that the downstream demand for market A is equal to DA(p) =
1−F(p+ ID) = 1− p. Similarly, we denote the demand curve for market B by DB(p) = θ(1− p), where
θ > 1. We can think of market B as the collection of θ downstream markets, each with demand 1− p. The
assumption that θ > 1 implies that market B captures a larger share of the upstream firm’s business. The
upstream firm can charge different prices in different markets. Profit maximization by the upstream firm
yields pA = pB = 1/2, which is intuitive because both markets have the same price elasticity. Thus, the total
profit of the upstream firm is Π0 = (1+θ)/4.
We now introduce a product liability risk that the upstream firm faces when serving market A. Specif-
ically, we assume that each unit sold in market A generates an expected loss of l for the upstream firm.
The simplest way to interpret l is that it captures the expected value of damages that the firm has to pay;
that is, l = E(d), where d is a random variable accounting for both the likelihood of being found liable and
the adjudicated amount. At the same time, l may also include additional costs sustained by the upstream
supplier, such as litigation costs and the opportunity cost of time and resources, as well as losses due to risk
aversion (the variance of d) and uncertainty aversion (inability to specify a unique probability distribution
for d), as modeled in Maccheroni and Ruffino (2013). We are agnostic about the exact nature of l, as Vitek’s
bankruptcy and the subsequent events increased both risk and uncertainty.
For simplicity, we assume that downstream firms cannot invest in R&D to identify substitute inputs or
10

to increase the safety of their products. This assumption is reasonable in our empirical setting, in which
DuPont and other large suppliers that withdrew from the market provided the majority of the supply; and,
even with substitute suppliers stepping in, medical implant producers were concerned about declining quality
standards as suppliers shifted from “large, sophisticated chemical companies with well-established quality
procedures” to “smaller, undercapitalized, and less sophisticated supply sources” (Citron, 1994). Moreover,
marginal improvements in the safety of medical implants were unlikely to change large suppliers’ foreclosure
decisions, as the expected liability costs far exceeded their profits from this small market.
Incorporating the liability risk, the upstream firm’s objective function in market A becomes (pA − l)(1−
pA). Consider, first, the case in which the liability risk is moderate (l < 1) such that it is still profitable to
serve market A. The profit-maximizing price in market A is pA = (1+ l)/2, and the upstream firm’s profit is
Π(l) = Π0 −∆(l),
where ∆(l) = l(2− l)/4, the profit difference with and without liability, is increasing in l.
However, if the liability risk is high (i.e., when l > 1), no increase in the input price would be large
enough to make market A profitable for the upstream firm.9 The upstream firm is, then, better off foreclosing
market A and focusing only on market B. In this case, the upstream firm’s profit will be πB = θ/4.
3.1 Liability risk and innovation incentives
To examine the impact of liability risk on innovation investments, we begin with an analysis of downstream
innovation incentives. Because we abstract away from the liability risk directly faced by market A firms,
they are affected only through the input price. When the input is sold at price pA, the total development cost
sustained by downstream firms is
RD = ID∫ 1+ID
pA+IDdx = ID(1− pA),
which decreases in pA. As the liability risk increases, downstream innovation decreases because the input
price, pA = (1+ l)/2, increases in l. Thus, fewer firms are actively innovating in the downstream market.
Moreover, when l > 1, RD = 0 because the upstream firm forecloses market A.
Consider, now, the innovation incentives for the upstream firm. In the absence of product liability risk,
innovation investment takes place if
Π(0)− IU ≥ 0;
9The case of a large shift in liability risk (l > 1) maps well to our empirical setting because the expected costs faced by theupstream suppliers—including losses due to risk and uncertainty aversion, their opportunity costs of time and resources, plus thepossibility of damage awards to compensate for the pain and suffering of implant patients—likely exceeded the market value of thefocal input (that is, the gross margin of the implant producers after excluding all other costs).
11
that is, if θ > 4IU −1. In the presence of product liability risk, l, innovation occurs if
max{
Π(0)−∆(l),πB}− IU ≥ 0.
This implies that as long as the profits from market B are large enough (i.e., πB ≥ IU or, equivalently,
θ > 4IU ), there will be no change in the upstream innovation activity.
3.2 Implications and discussion
In spite of its simplicity, our model delivers a number of insights into the impact of liability risk on innovation
incentives. First, the theoretical framework shows that, while liability risk related to supplying a specific
downstream market may affect upstream innovation incentives, its effect is likely to be limited when the
downstream market is substantially smaller than the other markets served by the upstream firm. Empirically,
this implies that, in our setting, we should expect a very small change in polymer (upstream) innovation
activity, despite the large shifts in liability risk perceived by upstream suppliers in the medical implant
(downstream) market.
Second, our model illustrates the rationale behind DuPont’s decision to foreclose the medical implant
market, which we documented in Section 2. The upstream firm may be able to compensate for the increase
in liability risk by charging a higher input price, but if the increase is too large, the supplier is better off
focusing on market B and foreclosing the riskier market A completely. Our model, thus, identifies a novel
factor—liability risk—that may induce market foreclosure.
Third, we show that the impact of liability risk may percolate throughout an industry’s vertical chain.
Even if only the upstream firm incurs the direct litigation costs, the drop in innovation investment could take
place in the downstream market. Empirically, this implies that an analysis of the firms directly targeted by
litigation may find no impact, missing significant effects taking place elsewhere in the value chain.
We intentionally make our model as simple as possible to illustrate the potential mechanism and its
effects. The setup abstracts away from a number of details that require discussion. First, we assume that
the shift in liability affects only the upstream firm, not the downstream firms in market A. This simplifying
assumption makes the point that liability risk can percolate throughout the vertical chain starker. A direct
increase in downstream liability is likely to reduce downstream innovation incentives even more.10
In our model, when liability risk is sufficiently high, the mechanism through which the upstream sup-
plier protects itself is to foreclose the risky downstream market. In principle, there exist other contractual
remedies that could be used to mitigate liability risks. For example, the upstream supplier may demand
10TMJ and breast implant litigations and the bankruptcies of their leading producers may, indeed, increase the (perceived) liabilityrisk faced by downstream firms directly. We aim to isolate this channel in our empirical analysis.
12
a stronger indemnification contract from the downstream firms or require larger product-liability insurance
coverage. As mentioned in Section 2, suppliers who chose to remain in the market made these arrangements.
Introducing these contractual solutions does not change the comparative statics of our model because they
reduce downstream firms’ margins, which, in turn, discourage innovation. There are a number of potential
explanations of why many suppliers in our empirical context did not choose these contractual solutions. The
transaction costs of writing complex contracts with many downstream buyers were probably very high rela-
tive to the profit margins obtained before the surge in liability risk. Furthermore, parties had to agree on the
riskiness of the transaction in order to specify the new contractual terms. This was probably challenging, as
uncertainty increased substantially after Vitek’s bankruptcy. Finally, according to Citron (1994), even with
contractual remedies, suppliers could still have been joined in the lawsuits and would have had to “put up
with the expense of discovery procedures and the great inconvenience it entails, as well as adverse publicity.”
We also assume that the upstream firm can charge different prices in different markets. Conversations
with industry practitioners suggest that price discrimination was not common in our context for two main
reasons: i) downstream firms could potentially access the homogeneous inputs in secondary markets, as
distribution is often through large wholesalers; and (ii) transaction costs of writing different contracts with a
large number of customers are generally high. If, instead, we restrict the input price to be the same across
different markets in the model, the incentive to foreclose market A will be even stronger. This is because
a higher uniform price, as a result of the liability risk in market A, will also negatively affect the upstream
firm’s profitability in its larger market B.
Finally, our framework assumes a continuum of downstream firms. Our results are robust to considering
a downstream oligopoly market, the typical setting studied in the industrial organization literature on vertical
foreclosure. When the increase in liability risk is moderate, it may affect the upstream monopoly’s ability to
commit to restricting supplies, especially when the contract is not observable (Rey and Tirole, 2007). When
the liability increase is sufficiently large that market A becomes unprofitable, the upstream firm may exit
market A entirely, as it does in our baseline model, and downstream innovation does not take place.
4 Data and methods
Our main source of data is the patent record database from the United States Patent and Trademark Office
(USPTO) (USPTO, 2016). Each patent is classified using the US patent classification (USPC) system, a
detailed scheme of classes and subclasses. Classes typically demarcate broad technological boundaries,
whereas subclasses delineate technical features within the scope of a class. A class/subclass pair uniquely
identifies a subclass within a class (for example, within class 623 “Prosthesis,” one can find subclass 623/5.12
“Corneal ring” and subclass 623/10 “Ear or nose prosthesis”). Henceforth, for simplicity, we refer to these
13
class/subclass pairs as subclasses. The USPTO provides a comprehensive list of the subclasses related to
medical devices (USPTO, 2015). To identify medical device patents, we use the primary subclass to which
each patent is assigned.
To categorize subclasses into treatment and control groups, we first identify technologies that are related
to medical implants at the patent level. We use a two-step textual analysis procedure to determine whether a
patent is an implant patent. First, from the FDA’s product classification database (FDA, 2015c), we retrieve a
comprehensive list of device names, each corresponding to a unique product code that identifies the generic
category of a device. For each device name, the data provide an “implant flag,” indicating whether the
FDA considers it a medical implant. In total, the data comprise 6,044 unique device names in 20 medical
specialties. Of these, 567 device names in 11 specialties are flagged as implanted devices. From these
567 implanted device names, we construct a dictionary of keywords capturing the underlying device types.
Examples of such keywords are: “stent,” “knee,” “hip,” and “catheter.” Second, we develop an algorithm
to scan the text of the titles, abstracts, and the first claims for each of the 226,624 medical device patents
(in 2,712 subclasses) applied for between 1976 and 2015 for which these textual variables are available
(USPTO, 2021). We classify a patent as an implant patent if it contains at least one of the keywords in the
abovementioned dictionary, together with one of the following terms: “implant,” “implanted,” “implantable,”
“implantation,” “prosthetic,” “prosthesis,” and “graft.”
We then calculate the fraction of implant patents at the subclass level. On average, about 19 percent
of the patents in each subclass are identified as implant patents, but the variance is substantial. In roughly
67 percent of the subclasses, the fraction of implant patents is below 0.1, and in 17 percent, it is above
0.5. We define a subclass as an implant subclass if at least 80 percent of the patents belonging to this class
are implant patents. This corresponds to roughly the top decile of the distribution of the shares of implant
patents across subclasses. We conduct our analysis at the subclass level, instead of at the patent level, mainly
to take advantage of the extensive expertise at the USPTO. As mentioned above, patents are classified by
the USPTO based on their technological similarity. Therefore, a patent that is not identified as an implant
by our algorithm, but is in a subclass consisting mostly of implant patents, is likely to be either an implant
patent whose texts are not explicitly written as such or an invention that is related to implant technologies
and, hence, is potentially affected by our shock.
Examples of implant subclasses include: 623/19.14 “Implantable humeral bone” (96.3 percent implant
patents) and 623/14.11 “Artificial vocal cords” (87.5 percent implant patents). Three subclasses are associ-
ated with the jaw and breast implants involved in the litigations, and their fractions of implant patents are,
respectively, 83, 88, and 92 percent.11 Examples of subclasses with a minimal fraction of implant patents in-11As additional supporting evidence for our textual analysis, consider the primary patent class 623, titled “Prosthesis (i.e., artificial
14

clude: 128/201.21 “Respiratory devices using liquefied oxygen” (0 percent); 602/22 “Orthopedic bandages
for fingers” (1.3 percent); and 606/36 “Surgical instruments for depilation” (3.1 percent).12
The main sample for our empirical analysis is a panel that tracks patenting activities in each of the
medical device subclasses for the period 1985-1995. Because of granting delays, we date the patents using
their application year rather than their grant year. The 11-year window 1985-1995 has been chosen to
capture a symmetric window around 1990. We end our sample in 1995 because suppliers’ liability concerns
probably changed around that time. This is partly because major industry lobbying efforts resulted in two
congressional hearings in 1995 and 1997, which eventually led to the passage of the BAAA in 1998, and
partly because DuPont won critical lawsuits in 1995 (Schmucki, 1999). It is important to note that, as we
discuss in Section 7.1, industry players still faced significant uncertainty after 1995. In that section, we
extend the sample to 2010 for an analysis of the longer-run outcomes. To address potential endogeneity
concerns, we drop the three patent subclasses related to jaw and breast implants from our analysis. The
11-year window includes 46,696 patents, with which we construct the panel dataset of our main sample.
The total number of subclasses in our main dataset is 2,703, and the number of observations is 29,733.
Table 1 provides summary statistics of the main sample. On average, there are 1.57 patent applications
per year in each of the medical device subclasses in our sample. Within-subclass variation in patenting
(the standard deviation is 2.06) is slightly smaller than between-subclass variation (the standard deviation is
2.63). Figure 1 plots the average number of patent applications in implant and non-implant subclasses during
our sample period. The figure shows that patenting in non-implant subclasses grew faster than patenting in
implant subclasses. Moreover, the two groups of subclasses started to diverge around 1990. This figure
provides a first look at our main result; in the next section, we turn to regression analysis to control for other
factors that might also contribute to the differential growth rates between the two groups.
In Section 5.3, we also use the FDA device application data as an alternative measure of innovation.
Apart from a more accurate identification of implant devices, a strength of the FDA data is that they are
more closely linked to the final products than the patent data are and that they potentially capture non-
patentable technologies. Moreover, the adverse-events data linkable to product codes help to control for
downstream direct liability risk. On the other hand, there are important merits associated with using the
body members), parts thereof, or aids and accessories therefor,” which includes 376 subclasses. About 14 percent of the patents inthis class belong to subclasses that include only implant patents. Roughly 54 percent of the patents belong to subclasses in whichthe fraction of implant patents is greater than 0.8, and about 90 percent belong to subclasses in which the fraction of implant patentsis above 0.5.
12We also employed a team of graduate students with degrees in kinesiology and biochemistry to manually classify a random sub-sample of 520 patents. The algorithm classifies 19 percent of these patents as implants, whereas the manual classification resulted in23 percent, though the difference between the two proportions is not statistically significant (p-value = 0.11). This exercise suggeststhat, if anything, our algorithm might undercount the number of implant patents; and our control subclasses are likely to containmore implant patents than we currently measure. This, again, suggests that our estimate may be conservative.
15

patent data. First, relative to alternative measures, the application date of a patent probably captures the
closest point to the origin of innovation activities; in practice, patent attorneys strongly recommend filing
patent applications in advance of FDA filings (Arora and Schmidt, 2012), and there is evidence of strategic
delays in the introduction of medical devices in the U.S. market relative to the European markets Grennan
and Town (2020). Second, patents are more disaggregated and, hence, more likely to capture innovations
about specific features of a product. In contrast, the FDA device applications are at the product level, making
it more difficult to discern the amount of innovation associated with one device. Third, relatedly, patent data
also capture innovation responses by firms specializing in research activities or the development of specific
components. Finally, in Section 6, we also examine the effect of the liability shock on upstream innovation
(polymers). Patenting data and similar textual algorithms allow us to generate an innovation metric that
is consistent across upstream and downstream technologies, which would not be possible with FDA data
because they capture only downstream medical devices. The availability of multiple innovation measures is
a merit of the medical sectors, and our paper exploits both data types to provide a comprehensive picture of
the impact of the liability shock.
4.1 Econometric model
Following Moser and Voena (2012), our empirical strategy compares changes in innovative activity between
1985 and 1995 across medical device patent subclasses that were differentially affected by the increase in the
liability risk faced by upstream material suppliers in supplying medical implants. The dependent variable is
the number of patents per USPTO subclass and year:
Patentsc,t = α+βImplantc ×A f ter1990t +δt + fc + εc,t , (1)
where Implantc equals 1 if subclass c is an implant subclass; A f ter1990t equals 1 for every year after (and
including) 1990; and δt and fc are year and subclass fixed effects. The coefficient β of the interaction
term between Implantc and A f ter1990t is the standard difference-in-differences estimator. We cluster the
standard errors at the subclass level for all regressions.
A f ter1990t captures the post-period in which the uncertainty about liability risk of supplying to medical
implant producers became higher for material suppliers. Numerous industry and academic studies stress
that the industry did not foresee the surge in litigation against DuPont in 1990 after Vitek’s bankruptcy.
We confirmed this in conversations with Ross Schmucki, senior counsel of DuPont at the time, who stated:
“This sort of mass tort product liability litigation against a raw material supplier was unprecedented and
unexpected by the medical device industry and by material suppliers such as DuPont.” These conversations
also suggest that after the surge of lawsuits, DuPont (and possibly its large wholesalers) became cautious
16
about supplying to new customers or for new products by existing customers, even though their supply
policies towards existing customers and products did not officially change until January 1993. Moreover,
as mentioned in Section 2, in 1990, Dow Chemicals announced its intention to stop supplying materials to
implant producers, even though the implementation would not take place for another two years. To further
examine the timing of the liability shift, we also manually collected litigation and media-mention data,
focusing on DuPont, the primary supplier of a large variety of polymeric materials. Panel (a) of Appendix
Figure A1 plots the timing of TMJ lawsuits involving DuPont as one of the defendants, collected from
Bloomberg Law (Bloomberg Law, 2017). Only one case per year was recorded in 1987 and 1988, and 17
cases were filed in 1989. Starting in 1990, litigation increased dramatically, from 55 to 135 cases per year
by 1994. Panel (b) of Figure A1 plots the timing of news articles referring to DuPont’s implant litigation,
retrieved through keyword searches in the Factiva (Dow Jones) database. This figure shows that the media
coverage of implant-related litigation events involving DuPont increased substantially in 1991 and persisted
throughout the following years. The litigation and media-mention data provide additional support for our
choice of the treatment timing.13
It is important to note two types of concerns. The first is about identification: there may be concurrent
confounding factors that affect implant and non-implant innovation differently, leading to correlation be-
tween A f ter1990t and the error term, εc,t . For example, there may have been technological breakthroughs
in non-implant technologies that drove up the growth of the control group after 1990. It is also possible that
implant products began to fail more generally in the early 90s, leading to a disruption or a decline in demand.
The second type of concerns are related to the interpretation of the identified effect. TMJ and breast implant
litigations and the bankruptcies of the leading producers may also have generated (i) a decline in implants’
demand driven by consumers’ concerns about implant failures in general (Jarrell and Peltzman, 1985); (ii)
an increase in the liability risk that downstream implant producers perceived for themselves; and (iii) a more
stringent regulatory oversight for other implants (Dranove and Olsen, 1994). All of these additional effects
could also have generated a decline in downstream innovation, but through mechanisms different from the
upstream-supply channel proposed in our theoretical framework.
In the paper, we rely on a collective set of evidence to address both types of concerns. First, we exclude
the three patent subclasses related to TMJ and silicone breast implants from all of our regressions. Industry
accounts and congressional documents suggest that implant failures and the corresponding litigation trig-
gering the surge in liability concerns were concentrated in these two fields. The exclusion of these fields
makes our approach similar to a reduced-form regression, in which the variation in TMJ and breast implant
13Furthermore, the wide media coverage supports the idea that information on DuPont’s legal battle spread across all industryparticipants, affecting all participants’ perception about liability risk.
17

litigation is used as an instrument for the increase in liability risk for other types of implants. Second, indus-
try reports suggest that foreign implant producers had easier access to foreign polymer suppliers than their
US counterparts had. Building on this observation, we perform triple-differences regressions using foreign
patents of each subclass as a benchmark. These regressions help to control for confounding trends—for
either the supply or the demand side—that are common to US and foreign patentees in the same patent sub-
class, and they provide additional support for the upstream-supply mechanism. Third, we use adverse-events
data to directly control for potential liability concerns that downstream producers face themselves. Finally,
in Section 7.2, we discuss additional evidence that helps us isolate the upstream-foreclosure mechanism
explored in our theoretical framework.
Another complication in our setting is that the control group might be ‘contaminated’ in certain ways,
which could affect the interpretation of our estimated effect. This may happen for a number of reasons. First,
medical device firms patenting in both implant and non-implant subclasses may respond to the liability shift
in implant technologies by reallocating their resources from implant to non-implant technologies. Such a
substitution effect would generate an increase in patenting in the control group, indicating a change in the
direction of R&D rather than a reduction in innovation overall. In the analysis, we explicitly examine the
extent to which such a substitution effect, if it exists, might affect the magnitude of the estimated effect on
implant technologies. Second, because of the threshold approach that we use to define the treatment and
control groups, the control subclasses also include implant patents. In principle, this will cause attenuation
bias and lead to an underestimation of the impact of the increase in liability. For robustness, we use the
implant fraction as a continuous treatment variable and also vary the threshold separating the two groups.
5 Downstream effect on implant innovation
Table 2 presents the first set of estimates quantifying the relationship between the increase in the liability risk
after 1990 and the patenting activities in implant devices. Column 1 presents the difference-in-differences
estimate based on equation (1). The result shows that, after 1990, implant subclasses experienced a reduction
of roughly 0.53 patents per year, on average, relative to non-implant subclasses; and the estimate is statisti-
cally significant at the one-percent level. Assuming the same difference between implant and non-implant
subclasses before and after 1990, the average decline in implant patenting after 1990 is about 35 percent.14
Column 2 interacts the treatment indicator After1990 with the fraction of implant patents of the subclass.
Recall that the fraction of implant patents of a subclass is calculated using the data from 1976-2015 and,
hence, is constant over time. The estimate confirms our baseline finding and shows that doubling the mean
14The average number of patents for non-implant subclasses after 1990 is 2.03, and the pre-1990 difference between implant andnon-implant subclasses is -0.51 patents per year. The ‘hypothetical’ average number of patents for implant subclasses would havebeen 1.52 per year after 1990.
18

value of the fraction of implant devices in the subclass, from 0.2 to 0.4, reduces patenting in implant classes
by about 0.075 patents per year after 1990. Column 3 shows that the result is robust to dropping patent
subclasses for which the fraction of implant patents is between 0.02 (median of the subclass distribution)
and 0.8. This regression exploits a more demanding control group (with a fraction of implant patents below
0.02), which is more likely to be totally unaffected by the liability change.
As discussed in Section 4.1, if some medical device firms have shifted their research efforts from implant
to non-implant technologies, the observed decline in implant patenting may not indicate an overall decline
in innovation. In column 4 of Table 2, we exclude patenting by assignees active in both the implant and
non-implant subclasses.15 The estimated coefficient is -0.35 patents per year. This suggests that while
within-firm substitution between implant and non-implant patenting may play some role, it accounts for a
relatively small part of the decline in overall innovation.16 In the appendix, we show that our result is also
robust to using an alternative control group—patenting in subclasses that include only pharmaceutical drug
innovations—for which contamination concerns are less severe.
In the Appendix, we provide additional robustness checks that confirm our findings. These include
regressions that use different cutoffs to define the implant subclasses, that exploit alternative econometric
models, and that use more-aggregate technology classifications by the USPTO. We also show that, while the
effect is the biggest for the largest patent subclasses, it is also significant for the middle two quartiles of the
pre-shock patenting distribution. Overall, the results in this section show a statistically and economically
significant decline in medical implant patenting after 1990, relative to non-implant patenting. This is consis-
tent with the idea that the increase in the liability risk faced by upstream suppliers had a large chilling effect
on downstream innovations. In the following, we subject this basic result to a number of additional tests.
5.1 Pre-treatment trend and time-specific treatment effects
To check the common-trends assumption, we estimate the year-specific differences between the treatment
and control subclasses, βt , in the following regression (1989 is the baseline year).
Patentsc,t = α+βtImplantc ×Yeart +δt + fc + εc,t . (2)
Figure 2 plots the estimated coefficients and their 95-percent confidence intervals. The estimated dif-
ferences between the implant and non-implant subclasses are small before the liability shift; they bounce
15Seven percent of the unique assignees in our sample patented in both treatment and control technology classes and that theseassignees account for roughly 30 percent of the sample patents.
16The magnitude of the difference between the two coefficients provides an upper bound to the impact of the shift in patentingfrom implant to non-implant technologies by firms operating in both technology areas. Our estimates suggest that such substitutionmay account for, at most, 36 percent of the total effect estimated in the full sample.
19
around zero and are statistically insignificant. The results, which show that the decline in implant patenting
did not start until 1990, support the common-trends assumption. The relative decline in implant patenting
was small but statistically significant in 1990. The size of the negative effect became larger and statistically
more significant over time. By 1995, the average yearly decrease relative to non-implant subclasses was
close to 0.9 patents, four times as large as the effect in 1990.
We also estimated a version of equation (2) in which the interaction terms are between year fixed effects
and the fraction of implant patents in a subclass, as suggested by Finkelstein (2007). The estimates, reported
in the Appendix, show a more gradual effect—the negative effect does not become statistically significant
until 1992—but the overall pattern is similar to that in Figure 2, with the size of the negative effect becoming
increasingly larger over time.
Even though the exact start differs by specification, the overall pattern of the effect is compatible with
implant innovators gradually reducing their patent applications as an increasing number of suppliers with-
drew from the market. Patent application costs are typically small relative to R&D expenditures, and patents
provide the benefits of optionality; however, the quick but small reaction early on is consistent with the idea
that, at the margin, the decrease in expected profits and increase in costs—in the face of increased uncer-
tainty and diversion of resources and engineering time towards securing materials for existing products—are
sufficient to lead some firms to give up or postpone their patenting applications and R&D. Consistent with
what we might expect, we show in the Appendix that the early effect is driven by patent applications that are
more likely to be at the margin—that is, by smaller firms and for less-valuable technologies.
5.2 Patents by foreign firms as the control and triple-differences
In this section, we examine the impact of the increase in liability risk, distinguishing between patents by US
and foreign firms. This analysis further mitigates identification concerns about potential confounding factors
differentially affecting implant versus non-implant innovation—as discussed previously, there may be tech-
nological breakthroughs for non-implant technologies, or implant products may have begun to experience
failures more generally in the early 90s. Patenting by foreign firms helps to control for trends taking place
in a given technology area that are common to US and foreign patentees.
We expect foreign firms to be less affected by the TMJ and breast implant litigations and the resulting
disruption to the industry’s supply chain for a number of reasons. Even though foreign producers selling
products in the US generally face the same product liability rules as domestic producers, US plaintiffs face
complexities and additional legal costs (such as matters of personal jurisdiction, conflicts of laws, and greater
difficulties in enforcing judgment) that make foreign producers less concerned about liability risk (Klerman,
2012).
20

Moreover, Aronoff (1995) (the HIMA-commissioned industry report) specifically points out that “for-
eign medical implant manufacturers will have an easier time obtaining replacement materials from foreign
suppliers, as sales to these manufacturers are apparently not considered as risky as sales to their United States
counterparts.”17 An important driver of this asymmetry may be the high legal costs and complexities that US
plaintiffs face in holding upstream suppliers liable for product failures when both parties of the supply con-
tracts are foreign entities. Apart from legal reasons, there may be other transactions costs that make it easier
for foreign suppliers to supply to foreign implant producers than to US implant producers. These include
trust and reputation developed over past business relationships that are especially important under height-
ened uncertainty. Our theoretical model suggests that these differences in material access should generate a
heterogeneous effect on innovation of US firms relative to foreign firms.
We base our identification of US versus foreign medical device innovators mainly on the country of
patent assignees reported by the USPTO. Unfortunately, this requires us to drop 30 percent of the patents in
our sample because they are unassigned; and for patents with assignee information, 72 percent belong to a
US assignee and 28 to a foreign one. As an alternative, we show that the results are similar when we classify
patents using the information on the country of the first inventor, which is available for all patents.
Our first set of regressions is the baseline difference-in-differences analysis with patents by US firms
in a subclass-year as the dependent variable. Patents by foreign firms serve as an additional explanatory
variable that controls for unobservable factors affecting the overall innovation activity in each subclass (such
as common technology or demand shocks and litigation’s direct impact on implant producers’ liability risk).
Column 1 of Table 3 reports the results using the assignees’ country of origin to define US versus foreign
patents. Consistent with our baseline result, we see that, relative to non-implant technologies, US implant
patenting experienced a large and significant decline after 1990. In column 2 of Table 3, we show that this
result is robust to using the inventor’s country of origin to categorize the patents.18
The second set of regressions goes a step further and uses a triple-differences approach. Specifically,
for each subclass-year, we generate two observations, one for patents with US assignees and the other with
foreign assignees. Therefore, the total number of observations is twice as many as that in column 1 of
Table 3. Column 3 reports the triple-differences results based on the assignees’ country of origin. The
coefficient of the triple-interaction term (-0.307) is the differential effect of the increase in liability risk on
implant patenting by US versus foreign firms. Specifically, after isolating the change experienced by foreign
17This report was also cited in the legislative history of the Biomaterials Access Assurance Act that was enacted in 1998 to ensurethe supply of biomaterials (which we will describe and analyze in Section 7.1): “75 percent of the suppliers of biomaterials requiredfor implantable medical devices have banned sales to U.S. device manufacturers.” H.R. Rep. No. 105-549, pt. 2, at 11 (1998).
18We re-estimated the time-specific treatment effects (equation 2) using only patents by US assignees as the dependent variable.The results, reported in the Appendix, appear to be sharper than those in Figure 2, which uses all patents.
21
innovators, this estimate captures the decrease in implant patenting by US firms. Column 4 of Table 3
replicates column 3, using the inventor’s country of origin to categorize the patents, and the results are
similar. In the Appendix, we plot the triple-interaction coefficients in a year-specific version of column 4 of
Table 3. This figure illustrates a pattern that is qualitatively consistent with that in Figure 2; the estimated
differential effects on implant patenting experienced by US firms are slightly smaller and slightly more
delayed (the negative effect becomes significant in 1991). This is consistent with the idea that our liability
shock had a substantially lower impact on foreign firms that commercialize in the US.
To further examine the effect of our liability shock on foreign inventors, we also examine datasets of
medical device patents granted by UK, French and German patent offices to non-US applicants (European
Patent Office , 2016). Different from foreign patentees of US patents, these foreign firms pool together
firms that do and do not commercialize in the U.S. As an example, Appendix Figure A5 shows small and
statistically insignificant differences between implant and non-implant subclasses for the UK data. These
findings provide further support for the idea that the increase in liability risk affected mainly American
patentees’ innovation incentives.
Overall, the results in this section help to isolate potential confounding factors that differentially affect
implant and control technologies. As discussed above, the finding supports our proposed upstream-supply
mechanism to the extent that differences between U.S. and foreign patenting reflects producers’ differential
access to materials. That said, this finding alone does not necessarily isolate the alternative mechanisms com-
pletely, and the fact that foreign and US device producers compete with each other may also entail a general
equilibrium effect that potentially overestimates the relative decline in U.S. medical implant innovation. We
provide additional evidence for assessing alternative mechanisms in the next section and collectively discuss
the body of evidence in Section 7.2.
5.3 Liability risk and FDA applications
So far, we have used patents as our measure of innovation. In this section, we examine whether our baseline
result holds when using the product-level innovation measure—the medical-device application data from the
FDA (FDA, 2015a,b). We focus on devices that the FDA designates as class III: these are defined as devices
used to support or sustain human life; devices of substantial importance in preventing impairment of human
health; or devices that present a potential, unreasonable risk of illness or injury. The FDA classifies each
device with a specific product code that identifies the generic category of the device. After excluding TMJ
and breast implants, we have 304 unique product codes for class III devices between 1985 and 1995; thus,
the unit of analysis is the number of FDA applications in each product code-year. For each product code, the
FDA data also provide an “implant” flag indicating implant devices. About 37 percent of the 304 class III
22
product codes for the sample period were for implant devices.
Column 1 of Table 4 confirms (at the 0.1 level) a decline in implant-device commercialization after
1990, relative to non-implant devices. In column 2, we match each FDA implant code with a non-implant
code, minimizing the differences in the levels of FDA applications before the shock. This matched control
group generates a larger coefficient, which is now statistically significant at the 0.05 level. In column 3,
we drop two outlier product codes that have the largest number of applications per year (pulse-generators
and electrode components of pacemakers). Dropping these outliers reduces the magnitude of the coefficient
but confirms the negative impact of liability risk on innovation. At the same time, removing these outliers
reduces the residual variance of our dependent variable and helps sharpen the statistical precision of our
estimate. Assuming the same difference between implant and non-implant product codes after 1990, the
estimated effect of -0.141 in column 3 implies a 50-percent reduction in implant innovation.
Apart from confirming that implant innovation experienced a decline relative to non-implant medical
device innovation, the FDA data also help us to address two potential downstream mechanisms. First, the
FDA Medical Device Reporting Program (MDR) database provides reports on deaths, injuries and malfunc-
tions that are associated with a specific FDA product code (FDA, 2017). Because the presence of adverse
events provides the basis for lawsuits, this information helps to control for the extent of liability risk faced
by downstream producers themselves. Column 4 of Table 4 shows that our results are robust to including
Adverse events reports, which equal the total number of reports in year t for the product code. Column 5
includes only product codes that are associated with zero adverse event reports throughout 1985-1995. For
producers of these products, jaw and breast implant litigations presumably had little impact on their own
perceived liability risk, given that these products were never associated with any adverse events. The esti-
mated coefficient is statistically significant, and the economic magnitude remains large relative to the low
baseline level of applications for these products.19 The finding of a large and significant negative effect on
implant innovation, even for products that raise minimal concerns about direct liability risk, provides further
evidence that the upstream supply channel is an important driver of the relative decline in implant innovation.
Second, we find that the amount of time the FDA takes to approve a device does not change differentially
for implant versus non-implant product codes after 1990. In the Appendix, we report application-level
regressions using devices applied between 1985 and 1995. The estimates indicate that application time is
not significantly longer for implant devices than for non-implant devices. If anything, the coefficients suggest
that implant devices, on average, experience a shorter approval time after 1990. This result is inconsistent
with the alternative explanation that the drop in innovation is driven by a significant change in regulatory
19Assuming the same difference between implant and non-implant product codes in this subsample after 1990, the estimatedeffect in column 5 implies a reduction of about 60 percent in implant innovation.
23
scrutiny of medical implants.
Overall, our analysis using product-based measures of innovation shows that the relative decline in im-
plant innovation took place not only in the early-invention stages but also the commercialization stages.
5.4 Heterogeneous effects
The preceding analysis shows that, on average, the liability shock affected patenting activity during our study
period. In this section, we explore how the impact may depend on firm size and patent quality.
We use the number of medical device patents by each assignee between 1985 and 1995 to measure firm
size. Because the distribution is skewed, we allocate patentees into three groups: ‘small patentees’ (assignees
with one to four patents) cover 50.5% of the patents; ‘medium patentees’ (five to 40 patents) cover 24.2% of
the patents; and ‘large patentees’ (more than 40 patents) cover the remaining 25.2% of the patents. We create
two additional groups to capture the largest patentees: the ‘Top 16 patentees’ group covers roughly 10% of
the patents, and the ‘Top six patentees’ group covers roughly 5% of the patents. Panel A of Appendix Table
A8 estimates our baseline regression separately for these five groups of patentees. Taking into consideration
the average level of patenting across different groups, the effect ranges from -16.5 to -38.8 percent, all
economically large and statistically significant. Even though the effect is industry-wide, it is smaller for
the six largest assignees than for the rest of the sample. This is consistent with industry accounts, which
suggest that the largest firms had the financial resources to provide contractual and insurance remedies to the
remaining polymer suppliers in the U.S. They also could have had easier access to polymer suppliers outside
the U.S. than smaller firms had because these large firms were less likely to be insolvent and more likely to
honor their contractual obligations.
We next explore whether the shock had differential impacts across patents of different quality. The
welfare interpretation would differ greatly, depending on whether it affected high-quality patents or only
marginal patents with limited impact. The innovation literature has often used the number of citations that a
patent receives as an indirect measure of patent value (Pakes and Griliches, 1980). We remove application-
year and (two-digit) technology class effects and identify the (filtered) citation quintile to which each patent
belongs. Panel B of Appendix Table A8 reports our baseline regressions using these quality-quintile subsam-
ples. The coefficients are also negative and statistically significant across all five quality quintiles, with the
magnitude of the effect being the smallest for the intermediate-quality range. With a more restrictive input
supply (and, hence, higher development and production costs), it is not surprising that R&D and patenting
activities that are more likely to result in the lowest-value patents are terminated. With risk-averse innova-
tors and ex-ante uncertainty about the value of innovation, a higher development cost may discourage the
exploration of risky projects, which may also lead to a reduction in breakthrough innovations (Aguiar and
24
Waldfogel, 2018).
Overall, these results indicate that the liability shock had a broad impact: its effects spanned the entire
medical device industry, as well as technologies’ quality distribution.
6 Upstream effect on material innovation
We have documented a negative impact of the increase in liability risk on medical implant patenting. In
this section, we examine the effect of this increase on ‘upstream’ innovation related to the polymers used
as material inputs for inventing and manufacturing medical implants. Because the change in litigation risk
around 1990 affected mainly the upstream suppliers, one might expect such a change to also have affected
the innovation incentives behind these basic technologies.
To explore this issue, we use an approach similar to the one we employed in the analysis of implant
innovation in Section 5. We start with the sample of 297,842 chemical patents that belong to the NBER patent
subcategories of resins and organic compounds (NBER, 2006). These patents span 8,988 unique USPTO
subclasses. To identify the patents related to generic polymers employed in medical implants, we exploit the
information provided in the transcript of the August 1, 1995 congressional hearing on the FDA Regulation of
Medical Devices, in which various subcommittees discussed the impact of breast and TMJ implant litigation
on the medical device industry (House of Representatives, 1995). Among the documents submitted for the
record is a comprehensive list of the generic polymers used in medical implants and affected by the vertical
foreclosure. These polymers include urethane, polyurethane, silicone and polyvinylchloride. We identify all
the patents that refer to one of these materials in the patent’s title, abstract, or first claim, and we label them
as “affected-polymer patents.” We then classify each of the 8,988 USPTO subclasses as an affected-polymer
vs. a control subclass, depending on whether at least 80 percent of the patents are identified as polymer
patents involved in medical implants.
Table 5 examines the relationship between the increase in liability risk and polymer patenting. Column
1 shows a positive and statistically insignificant coefficient, suggesting that patenting in affected-polymer
subclasses did not decline relative to control chemical subclasses after 1990. To remove the impact of
differential pre-trends between affected-polymer and control subclasses, in column 2, we contrast patenting
in affected-polymer subclasses with patenting in a matched control group of chemical subclasses chosen
to minimize pre-trend differences. The coefficient remains statistically insignificant, confirming the finding
of no effect on upstream innovation. Appendix Figure A6 illustrates the coefficient of a regression run on
this sample, including separate dummies for each year before and after the change in liability risk. All
coefficients are statistically insignificant and of small magnitude, further corroborating our finding of no
effect. Columns 3 and 4 of Table 5 show that we also do not observe any decline in patenting in affected-
25

polymer subclasses relative to other subclasses by DuPont, the most important polymer supplier at the time
and the target of the TMJ implant litigation.
Overall, our finding of no impact on upstream innovation is consistent with our model, which suggests
that suppliers’ innovation incentives were driven by the aggregate demand from multiple downstream mar-
kets. It also demonstrates that the impact of liability may not show up for those directly targeted by litigation,
but elsewhere in the value chain.
7 Discussion and policy implications
Our main empirical finding is that the increase in liability risk faced by upstream suppliers after 1990 is
associated with a substantial reduction in implant innovation. The reduction appears to have occurred across
firms of all sizes and technologies of all values, and it took place at both the invention and the commer-
cialization stages. This section complements our analysis by (i) examining the longer-run outcomes after a
federal policy was implemented to address the shortage of biomaterials; (ii) providing additional support for
the idea that restricted access to upstream suppliers was an important driver of the decline in downstream
innovation; and (iii) discussing the external validity of our findings and their welfare implications.
7.1 Policy remedy: the 1998 Biomaterials Access Assurance Act
To restore the supply incentive of raw-material producers, the U.S. Congress passed the Biomaterial Access
Assurance Act (BAAA) in August 1998. BAAA came about after a number of failed attempts to address
the potential shortage of biomaterial supplies through federal product-liability reforms.20 The main goal
of the BAAA was to “safeguard the availability of a wide variety of lifesaving and life-enhancing medical
devices” (U.S.C. §1601(15)). The Act provides liability exemption for the suppliers of bulk components
and raw materials for implants, as long as they do not engage in the design, testing, and production of the
implants, and the inputs themselves are not dangerous or defective.21 BAAA is one of few federal liability
reforms, an area of legislation typically reserved for the states (Kerouac, 2001). Potential material-supplier
plaintiffs may invoke the Act to request early dismissal from the court, avoiding the costly and lengthy
litigation process. According to Czuba (2016), during the 18 years (at the time his article was published)
since BAAA’s passage, it had been tested five times. The same article quotes Frederick Stearns of Keller
and Heckman LLP: “...in each case the Biomaterials Act was invoked and each was resolved in favor of the
20In March 1996, both the House and the Senate passed the Common Sense Product Liability and Legal Reform Act, whichPresident Clinton vetoed on May 2, 1996. “Biomaterials Access Assurance Act of 1997,” Hearing Before the Subcommittee onCommercial and Administrative Law of the Committee on the Judiciary, House of Representatives, One Hundred Fifth Congress,First Session, on H.R. 872, June 12 1997.
21The rationale of the BAAA is similar to that underlying common-law protection for suppliers: imposing liability on raw-material suppliers would require them to retain expertise in a large variety of areas in order to determine the possible risks associatedwith each potential use. In contrast, finished-product manufacturers know what they intend to do and, therefore, are in a betterposition to guarantee that the material is suitable for their particular applications.
26
materials supplier. I see no reason to expect a different outcome in similar cases in the future.”
Figure 3 plots the average patenting in implant and non-implant subclasses by US firms (based on the
assignee’s country of origin) between 1985 and 2010. The raw data suggest that implant patenting started to
recover shortly after 1998 (i.e., the growth rate for implant patents appeared greater than that for non-implant
patents) and that four or five years later, it was restored to a level comparable to that of non-implant patents
(i.e., the relative difference between implant and non-implant patents became the same as that before 1990).
We extended our baseline difference-in-differences regression to include both shifts in the liability risk:
the first increased the liability risk faced by upstream suppliers following Vitek’s bankruptcy in 1990; and
the second reduced the risk to a low level following the passage of the BAAA in 1998. This regression used
only patents assigned to US firms. The results show that, relative to the default years (before 1990), implant
patenting decreased significantly between 1990 and 1998 (the coefficient of the interaction term is -0.233,
and the p-value < 0.001, confirming our main result), and it recovered after the BAAA (the coefficient is
-0.091, but not statistically different from the default years before 1990). We see similar results with the
FDA data: the coefficients of the two interaction terms are, respectively, -0.133 (p-value < 0.05) and 0.194
(statistically insignificant). In the Appendix, we plot the year-specific difference-in-differences coefficients;
the graph shows that the negative effect of our liability shock is sustained after 1995 and remains similar in
magnitude until the end of the 90s. The effect turns small and positive in 2002. The coefficients afterwards
are statistically similar to the baseline year, 1989 (the year before our liability shock).
Although these empirical patterns are only suggestive, they are consistent with the federal exemption
law helping to restore the pace of implant innovation. As discussed previously, common law does provide
protection for component and material suppliers, and these provisions were in place throughout our entire
sample period. Our finding is consistent with the idea that additional ex-ante regulation can encourage
innovation investment by mitigating the uncertainty over the litigation process (Kaplow, 1992). Finally,
notice that we do not observe an overshoot of implant patenting in the longer run, which suggests that the
decline in the intervening years, which lasted more than a decade, was a real loss rather than a delay in
investment. While we should not view these results as the causal effect of the law—as the industry also took
measures to identify alternative supply sources or substitute materials, and DuPont’s important wins in 1995
and 1997 might also have helped to reduce the uncertainty over supplier liability—it is plausible that without
the policy intervention, industry self-adjustments would have taken a much longer time.
7.2 Assessing alternative mechanisms
Our interpretation of the empirical findings has been guided by a theoretical model in which liability risk
induces an upstream supplier to foreclose a risky downstream market. As discussed in Section 4.1, litigations
27
over TMJ and breast implant failures may have led to an overall decline in implant innovation through
other mechanisms—in particular, a drop in the overall demand for implants; an increase in the liability risk
perceived by implant producers; or more-stringent oversight by the regulators. In this section, we collect
a body of evidence—results from prior sections as well as additional evidence—supporting the idea that
market foreclosure driven by upstream suppliers’ concern over liability risk is an important, though not
necessarily the only, mechanism behind the decline in innovation.
First, industry reports describing the status of the implant industry, as well as the congressional testi-
monies of medical device manufacturers (large and small) reflect concerns about the lack of suppliers rather
than about downstream litigation or the decline in demand. For example, in her 1994 congressional testi-
mony, Eleanor Gackstatter, President and COO of Meadox Medicals, asked “When supplies are vanishing,
how can we choose to provide R&D supplies for future innovative products when the surgeon needs our prod-
ucts to save a life today?” In the same hearing, Paul Citron, VP for Science and Technology at Medtronic,
testified that a “remedy must be found which will provide the protection necessary to assure that suppliers
will continue to provide materials to manufacturers. Unless such a remedy is put in place, we will experience
inexorable declines in medical device innovation.”
To provide more-direct evidence for this mechanism, we further exploit the 1995 congressional hearing
documents (House of Representatives, 1995), which include a list of implant devices that rely on polymers.
Mapping the device names on this list to patent classes and to FDA product codes is not a straightforward
exercise, and it is not entirely clear how exhaustive the list is. Moreover, as discussed in Section 2, the
increasing reluctance to supply went beyond polymeric materials (Citron, 1994). Nonetheless, we show in
the Appendix that implant patent subclasses and FDA product codes that are more likely to rely on polymeric
materials are more negatively (marginally significant) affected than those that likely do not use polymers.
Second, we collect additional data measuring the demand for implants and show that there is no signifi-
cant demand drop after 1990. In particular, we collect data for 32 procedures that are consistently reported
throughout the period of 1987-1995 by the National Hospital Discharge Survey and identify those involving
medical implants. Difference-in-differences regressions for the number of services and the rate (i.e., number
per 100,000 population) do not show significant differences before and after 1990 between these two types of
procedures.22 This evidence, albeit based on relatively coarse data, is inconsistent with the idea that demand
drop is a key driver of the decline in innovation.
Third, as noted before, our analysis excludes TMJ and silicone breast implants, which were the source
of most implant failures and where downstream litigation was concentrated. As reported in Section 5.3,
22The DID coefficient for the number of services (in thousands) provided is 41.9 (p-value is 0.40); and the DID coefficient forthe rate is 0.13 (p-value = 0.548).
28

data on the FDA’s approval time do not reveal significant regulatory concerns over implant safety in general.
Furthermore, using adverse-events data that form the basis for lawsuits, we show that the large decline in
implant innovation not only is robust to controlling for the extent of adverse events associated with a given
product type, but also holds for product types for which there should be little concern about downstream
liability. Overall, these findings help isolate the mechanism of a heightened downstream liability risk and
support the conclusion that the upstream-supply mechanism plays an important role.
Finally, as discussed previously, the triple-differences results showing that higher liability risk signif-
icantly reduced patenting by US firms relative to foreign innovators. To the extent that this differential
effect reflects a greater willingness of foreign polymer producers to continue supplying foreign device
manufacturers—as the comprehensive industry report points out—this is additional support for our pro-
posed mechanism. We also conducted a triple-differences regression analysis to estimate the differential
patterns of foreign and US innovation after the BAAA in 1998. The (unreported) estimates show a larger
increase for US producers and confirm that implant patenting by US producers reached a level comparable
to that before 1990 a few years after the BAAA was implemented. This reversal pattern is also consistent
with our theoretical model and points to the importance of supply restriction driven by upstream liability
risk.
7.3 External validity and welfare implications
Our analysis helps to identify situations in which liability risk may negatively affect innovation incentives
and percolate throughout a vertical chain. In particular, this appears to be the case when (i) some of the
critical inputs are supplied by large multi-market firms with deep pockets and the ability to foreclose a
risky downstream segment; (ii) many downstream innovators are small and are likely to resort to bankruptcy
when liability claims exceed firm values; and (iii) there exist sufficient informational frictions (including
asymmetric information and uncertainty over the likelihood of product failures and the extent of harms) and
transactions costs such that it is hard for downstream producers to be fully insured and for the parties to write
complete contracts regarding the allocation of liability.
These conditions are likely to hold in economically important and technologically vibrant industries that
are associated with high inherent risks, such as healthcare, transportation, and energy. The first condition is
rather common given the prevalent use of mass-produced general-purpose inputs, including basic materials
and components such as chips, engines, and batteries (Helpman, 1998). Moreover, such liability concerns
may go beyond suppliers and also apply to other critical players in the value chain (e.g., a large distributor).
Finally, even if large suppliers can be replaced by smaller and more-specialized firms, or even by the down-
stream players through vertical integration, innovation may still suffer when scale and experience from other
29

domains are important for efficiency and quality.
Ex-ante regulations can play an important role in mitigating uncertainty over safety (e.g., Stern, 2017;
Grennan and Town, 2020). In this respect, in the pharmaceutical and commercial aviation industries—
which are characterized by a combination of extremely stringent ex-ante standard setting, testing, and federal
preemption (of state laws)—the role of the channel we have described in this paper is more limited. Our
results are more likely to be relevant in industries in which regulation is less stringent or new technologies
are at any early stage, given that regulation often takes years to develop.23 The medical device industry
during our sample period is an example of such environments because product liability laws and the court
system tend to play a substantial role in governing liability events in an ex-post fashion, even in the presence
of FDA regulation.
A full welfare analysis of our findings requires contrasting two forces: (i) the surplus lost from fewer new
devices; and (ii) the social gains due to greater safety (either because fewer harmful products are developed
or because the new products are safer). In the appendix, we leverage our estimates to assess the first force—
the magnitude of the potential welfare costs associated with the decline in implant innovation. To do this,
we exploit the estimates by Grennan and Swanson (2017) on the increase in total surplus per procedure
when physicians have access to an additional medical device. Back-of-the-envelope calculations suggest
that potential welfare costs associated with the lost devices could be between $4.1B and $11.9B per year for
four prominent implant device types (pacemakers, catheters, and knee and hip prostheses).
The above estimates do not fully account for potential social gains from greater safety.24 That said, it
seems reasonable to expect that the negative impact on welfare dominates potential gains in our setting for
a number of reasons. In practice, the extensive foreclosure by large suppliers appeared to have disrupted
normal R&D activities by implant producers and limited their ability to develop new and safer products.
Switching to smaller suppliers is associated with a higher cost (due to the lack of scale) and inconsistent
quality control (Citron, 1994). More generally, the idea that a substantial increase in upstream liability may
23For example, as mentioned in Section 2, TMJ and breast implants were classified as Class-II devices at the time of the litigations.They were reclassified as Class-III (and, hence, subject to a stricter approval process and, potentially, federal preemption under theMedical Device Amendments of 1976) only a few years after Vitek’s bankruptcy. Even for Class-III devices, the exact scope offederal preemption remained unclear for a long time. In Medtronic Inc. v. Lohr (1996), the Supreme Court denied preemption fora number of claims related to a Class-III device marketed under 510(k), and legal uncertainty about federal preemption persisteduntil Riegel v. Medtronic, Inc. (2008). Consistent with this lack of clarity, historical documents and our conversations with industryinsiders also suggest that polymer suppliers at the time were concerned about potential liability risk related to devices such aspacemakers and heart valves, which were classified as Class-III at the time. In transportation, it also took the National HighwayTraffic Safety Administration, a federal agency, over a decade to establish the standards for conventional vehicles. The currentregulatory status for autonomous vehicles is still at the state level and is highly heterogeneous in terms of scope and clarity.
24This is a limitation that our analysis shares with much of the prior research on the safety-access trade-off (Peltzman, 1973;Grennan and Town, 2020). Galasso and Luo (2021) take a first step in addressing this problem by examining innovation in radiationdiagnostic devices, one setting in which it is possible to distinguish between new technologies affecting radiation risk and thoseaffecting image quality.
30

have been inefficient is also consistent with the law and economics literature. In a simple market setup in
which firms face no risk of insolvency or other frictions, the allocation of liability risk across the vertical
chain should have no impact on total welfare (Daughety and Reinganum, 2013). As we depart from the
benchmark case and consider scenarios involving downstream insolvency, the allocation of liability begins to
matter. When there are significant downstream firm heterogeneity, asymmetric information, and contractual
frictions, downstream-only liability can be a preferable policy (Hay and Spier, 2005).
Asymmetric information and contractual frictions are important features in contexts like ours, where
large upstream firms supply general-purpose inputs to a wide range of downstream markets. When upstream
suppliers do not possess the specialized knowledge required to understand the features of all the applications
using their inputs, information asymmetry may prevent differential pricing or contractual remedies that can
pass the upstream liability costs to downstream firms in a way that is specific to the safety levels of the final
products. Moreover, as we show in our theoretical model, when the total profits from supplying a given
risky market are sufficiently small relative to other revenue sources (as in the case of implants), upstream
firms may resort to vertical foreclosure. Overall, this suggests that in environments like ours, an increase in
upstream liability may inefficiently raise costs for all downstream firms, even those that are unlikely to be
insolvent and whose products are safe.
8 Conclusions
In this paper, we examine the relationship between product liability and innovation, taking advantage of
a quasi-exogenous surge in the liability risk that affected the medical implant industry in the early 1990s.
Our empirical analysis illustrates a decline in medical implant patenting relative to the patenting of other
medical devices, on the order of 35 percent. We show that the decline in innovation was concentrated
among downstream implant innovators, even if the liability litigation targeted mainly upstream suppliers of
polymers. Our findings, together with rich historical accounts, indicate an important mechanism behind this
decline—the surge in upstream liability risk led to vertical foreclosure, which, in turn, negatively affected
downstream innovation. Consistent with this mechanism, the decline in implant patenting appears to have
been industry-wide, involving firms of various sizes and patents of different values.
Our paper adds evidence to the scarce body of empirical work on the impact of liability risk on inno-
vation, and it also contributes to the industrial organization literature by studying a novel driver of vertical
foreclosure and spillover effects throughout industry linkages. An implication of our analysis is that prod-
uct liabilities may have a substantial impact on innovation when they affect suppliers of general-purpose
inputs and technologies. Large ‘deep-pocket’ upstream firms serving many downstream sectors may prefer
to foreclose market segments in which liability risk is the greatest, rather than face the risk of litigation. Our
31
analysis of the BAAA is only illustrative and does not allow us to make causal inferences. Nonetheless, the
patenting patterns that we document suggest that policy remedies that reduce uncertainty and protect input
suppliers from excessive liability risk can be critical for cultivating R&D investments. This insight may
be particularly valuable for regulators evaluating the role of a country’s liability systems and the associated
tradeoffs in its competitiveness, especially in emerging fields such as artificial intelligence and sophisticated
robotics and their various applications (Galasso and Luo, 2018).
ReferencesAcemoglu, D., D. Cutler, A. Finkelstein, and J. Linn (2006, May). Did medicare induce pharmaceutical
innovation? American Economic Review 96(2), 103–107.
Aguiar, L. and J. Waldfogel (2018). Quality predictability and the welfare benefits from new products:Evidence from the digitization of recorded music. Journal of Political Economy 126(2), 492–524.
Aronoff, M. (1995). Market study: biomaterials supply for permanent medical implants. Journal of Bioma-terials Applications 9, 205–260.
Arora, Suneel, T. J. C.-A. N. M. and A. Schmidt (2012). The interplay between fda and patent law: Infusingorganizational knowledge for medical device companies. Wm. Mitchell L.Rev. 39, 1176.
Avraham, R. and M. Schanzenbach (2015). The impact of tort reform on intensity of treatment: Evidencefrom heart patients. Journal of Health Economics 39, 273–288.
Baker, F. D. (1995). Effects of products liability on bulk suppliers of biomaterials. Food and Drug LawJournal 50(3), 455–460.
Bernanke, B. S. (1983). Irreversibility, uncertainty, and cyclical investment. The Quarterly Journal ofEconomics 98(1), 85–106.
Bloom, N. (2009). The impact of uncertainty shocks. Econometrica 77(3), 623–685.
Blundell, R., R. Griffith, and J. van Reenen (1999). Market share, market value and innovation in a panel ofbritish manufacturing firms. Review of Economic Studies 66, 529–554.
Borzo, G. (1994, September). Liability risk threatens a shortage of implants. American Medical News, 12.
Citron, P. (1994). Medical devices, component materials, and product liability. In J. Hunziker and T. Jones(Eds.), Product Liability and Innovation: Managing Risk in an Uncertain Environment. Washington, D.C.:National Academy of Engineering, National Academy Press.
Currie, J. and W. B. MacLeod (2008). First do no harm? tort reform and birth outcomes. The QuarterlyJournal of Economics 123(2), 795–830.
Czuba, L. (2016, January). Playing hard-to-get: Plastics for long-term implantation. Med Device Online.
Daughety, A. F. and J. F. Reinganum (1995). Product safety: Liability, r&d, and signaling. AmericanEconomic Review 85, 1187–1206.
32
Daughety, A. F. and J. F. Reinganum (2013). Economic analysis of products liability: theory. In ResearchHandbook on the Economics of Torts, pp. 69–96.
Davis, J. (2003). Overview of biomaterials and their use in medical devices. In Handbook of materials formedical devices. Ohio: ASM International.
Dranove, D. and C. Olsen (1994). The economic side effects of dangerous drug announcements. Journal ofLaw and Economics 37, 323–348.
FDA (2015a). 510(k) application data. Accessed March 2015. https://www.fda.gov/medical-devices/510k-clearances/downloadable-510k-files.
FDA (2015b). Pma application data. Accessed March 2015. https://www.fda.gov/medical-devices/device-approvals-denials-and-clearances/pma-approvals.
FDA (2015c). Product code classification. Accessed March 2015. https://www.fda.gov/medical-devices/classify-your-medical-device/download-product-code-classification-files.
FDA (2017). Medical device reporting program (mdr). Accessed September 2017.https://www.fda.gov/medical-devices/medical-device-reporting-mdr-how-report-medical-device-problems/mdr-data-files.
Feder, B. (1994). Implant industry is facing cutback by top suppliers. New York Times (April 25).
Fernandez-Villaverde, Jesus, P. G.-Q. K. K. and J. Rubio-Ramirez (2015). Fiscal volatility shocks andeconomic activity. American Economic Review 105, 3352–3384.
Finkelstein, A. (2004). Static and dynamic effects of health policy: Evidence from the vaccine industry.Quarterly Journal of Economics 119, 527–564.
Finkelstein, A. (2007, 02). The Aggregate Effects of Health Insurance: Evidence from the Introduction ofMedicare. The Quarterly Journal of Economics 122(1), 1–37.
Bloomberg Law (2017). Litigation docket data. Accessed September 2017 via Harvard Law School Sub-scription. www.Bloomberglaw.com.
European Patent Office (2016). Patstat global, autumn edition. Current version is accessible throughhttps://www.epo.org/searching-for-patents/business/patstat.html.
House of Representatives (1995). Fda regulation of medical devices, including the status of breast im-plants. Committee on Government Reform and Oversight House of Representatives, One Hundred FourthCongress, First Session. Two tables on potentially affected implants and polymers are on pages 12-16).
Frakes, M. (2013, February). The impact of medical liability standards on regional variations in physicianbehavior: Evidence from the adoption of national-standard rules. American Economic Review 103(1),257–76.
Frakes, M. and A. B. Jena (2016). Does medical malpractice law improve health care quality? Journal ofPublic Economics 143, 142–158.
Galasso, A. and H. Luo (2017). Tort reform and innovation. The Journal of Law and Economics 60(3),385–412.
33
Galasso, A. and H. Luo (2018). Punishing robots: Issues in the economics of tort liability and innovation inartificial intelligence. In A. Agrawal, J. Gans, and A. Goldfarb (Eds.), Economics of Artificial Intelligence:An Agenda. University of Chicago Press.
Galasso, A. and H. Luo (2021). Risk-mitigating technologies: The case of radiation diagnostic devices.Management Science 67(5), 3022–3040.
Grennan, M. and A. Swanson (2017). Quantifying the sources of price dispersion: Evidence from hospitalsupplies. working paper.
Grennan, M. and R. J. Town (2020, January). Regulating innovation with uncertain quality: Information,risk, and access in medical devices. American Economic Review 110(1), 120–61.
Hausman, J., B. Hall, and Z. Griliches (1984). Econometric models for count data with an application to thepatents-rd relationship. Econometrica 52, 909–38.
Hay, B. and K. E. Spier (2005, December). Manufacturer liability for harms caused by consumers to others.American Economic Review 95(5), 1700–1711.
Helland, E., D. Lakdawalla, A. Malani, and S. A. Seabury (2020, 11). Unintended consequences of productsliability: Evidence from the pharmaceutical market. The Journal of Law, Economics, and Organiza-tion 36(3), 598–632.
Helpman, E. (Ed.) (1998). General Purpose Technologies and Economic Growth. Cambridge, MA: TheMIT Press.
Huber, P. (1989). Liability: The Legal Revolution and Its Consequences. New York: Basic Books.
Jarrell, G. and S. Peltzman (1985). The impact of product recalls on the wealth of sellers. Journal of PoliticalEconomy 93(3), 512–536.
Kaplow, L. (1992). Rules versus standards: An economic analysis. Duke Law Journal 42, 557–629.
Kerouac, J. (2001). A critical analysis of the biomaterials access assurance act of 1998 as federal tort reformpolicy. Boston University Journal of Science and Technology Law 7, 327–371.
Kessler, D. and M. McClellan (1996). Do doctors practice defensive medicine? Quarterly Journal ofEconomics 111, 353–390.
Klerman, D. (2012). Personal jurisdiction and product liability. Southern California Law Review 85, 1551–1596.
Maccheroni, Fabio, M. M. and D. Ruffino (2013). Alpha as ambiguity: Robust mean-variance portfolioanalysis. Econometrica 81, 1075–1113.
Marchand, J. R. and K. P. Russell (1973). Externalities, liability, separability, and resource allocation.American Economic Review 63, 611–620.
Moser, P. and A. Voena (2012). Compulsory licensing: Evidence from the trading with the enemy act.American Economic Review 102, 396– 427.
NBER (2006). Nber patent data project portal. Accessed 2016.https://sites.google.com/site/patentdataproject/Home/downloads.
34

Pakes, A. and Z. Griliches (1980). Patents and r&d at the firm level: A first report. Economics Letters 5,377–381.
Parchomovsky, G. and A. Stein (2008). Torts and innovation. Michigan Law Review 107, 285–315.
Peltzman, S. (1973). An evaluation of consumer protection legislation: The 1962 drug amendments. Journalof Political Economy 81(5), 1049–1091.
Porter, M. (1990). The competitive advantage of nations. New York: Free Press.
Posner, R. (1986). Economic Analysis of Law (3rd ed.). Aspen.
Priest, G. (2011). The effects of modern tort law on innovation and economic growth. In Rules for Growth.Kauffman Task Force on Law, Innovation, and Growth.
RAND (2000). Biomaterials availability: Potential effects on medical innovation and health care. Technicalreport, Science and Technology Policy Institute. Issue Paper 194.
Rey, P. and J. Tirole (2007). A primer on foreclosure,. In Handbook of industrial organization, Volume 3,pp. 2145–2220.
Schmucki, R. (1999). Final status report on history of tmj litigation. DuPont, unpublished communication.
Service, R. (1994). Liability concerns threaten medical implant research. Science 266, 726–727.
Shavell, S. M. (2007). Liability for accidents. In A. M. Polinsky and S. Shavell (Eds.), Handbook of Lawand Economics, Volume 139. Elsevier.
Stern, A. D. (2017). Innovation under regulatory uncertainty: Evidence from medical technology. Journalof Public Economics 145, 181–200.
USPTO (2015). Medical devices, a patent technology monitoring team report. Accessed August 2017.https://www.uspto.gov/web/offices/ac/ido/oeip/taf/meddev.htm. .
USPTO (2016). Taf database multi-file dvd. The data are also available for download athttps://patentsview.org/download/data-download-tables.
USPTO (2021). Uspto patent title, abstract, and claim data (1976-2015). Accessed via PatentsViewin 2021 (data used in the working paper version were accessed in 2017 via Derwent Innovation).https://patentsview.org/download/data-download-tables.
Viscusi, K. and M. Moore (1993). Product liability, research and development, and innovation. Journal ofPolitical Economy 101, 161–184.
35
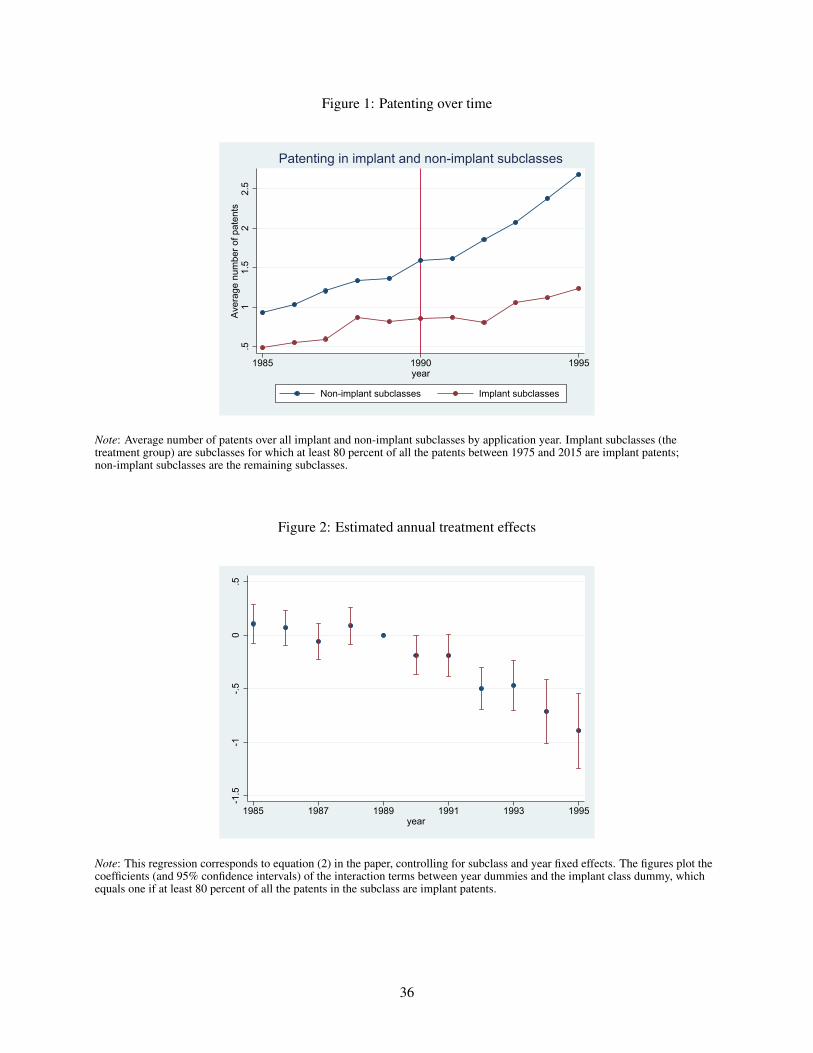
Figure 1: Patenting over time
.51
1.5
22.
5Av
erag
e nu
mbe
r of p
aten
ts
1985 1990 1995year
Non-implant subclasses Implant subclasses
Patenting in implant and non-implant subclasses
Note: Average number of patents over all implant and non-implant subclasses by application year. Implant subclasses (thetreatment group) are subclasses for which at least 80 percent of all the patents between 1975 and 2015 are implant patents;non-implant subclasses are the remaining subclasses.
Figure 2: Estimated annual treatment effects
-1.5
-1-.5
0.5
1985 1987 1989 1991 1993 1995year
Note: This regression corresponds to equation (2) in the paper, controlling for subclass and year fixed effects. The figures plot thecoefficients (and 95% confidence intervals) of the interaction terms between year dummies and the implant class dummy, whichequals one if at least 80 percent of all the patents in the subclass are implant patents.
36
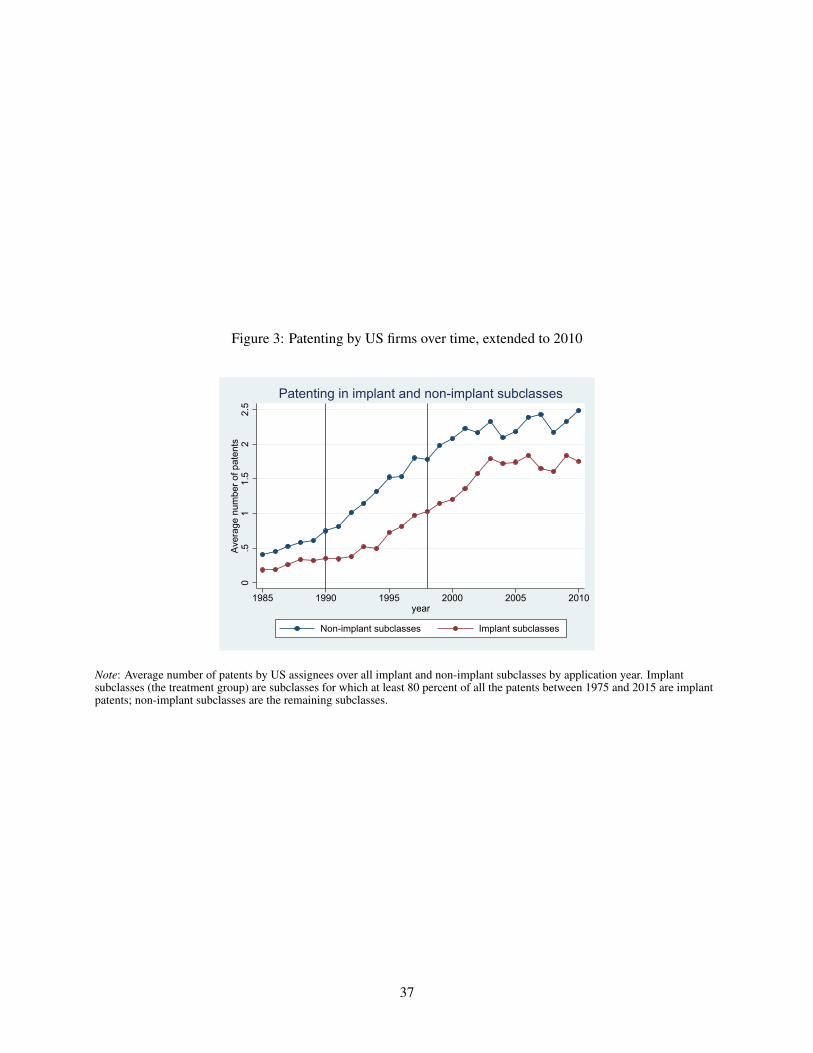
Figure 3: Patenting by US firms over time, extended to 2010
0.5
11.
52
2.5
Aver
age
num
ber o
f pat
ents
1985 1990 1995 2000 2005 2010year
Non-implant subclasses Implant subclasses
Patenting in implant and non-implant subclasses
Note: Average number of patents by US assignees over all implant and non-implant subclasses by application year. Implantsubclasses (the treatment group) are subclasses for which at least 80 percent of all the patents between 1975 and 2015 are implantpatents; non-implant subclasses are the remaining subclasses.
37

Table 1: Summary statistics
Obs. Mean Std. Dev. Min MaxPatents 29,733 1.571 3.343 0 102
Year 29,733 1990 3.162 1985 1995
Implant 29,733 0.089 0.285 0 1
Note: Patents = the number of patent applications in a subclass-year. Implant = 1 if at least 80 percent of all the patents in asubclass are implant patents.
Table 2: Liability risk and implant innovation
Dependent variable Patents Patents Patents Patents(1) (2) (3) (4)
Implant × After 1990 -0.533∗∗∗ -0.315∗∗∗ -0.354∗∗∗
(0.088) (0.090) (0.026)[1em] Implant fraction × After 1990 -0.374∗∗∗
(0.110)
Year effects YES YES YES YESSubclass effects YES YES YES YES
Sample Drop subclasses Drop assigneeswith implant-patent patenting in both
fraction between implant and0.02 and 0.8 non-implant
subclasses
Observations 29733 29733 17985 29733
Note: OLS regressions. Patents = the number of patent applications in a subclass-year. Implant = 1 if the fraction of implantpatents in a subclass exceeds 0.8. Robust standard errors clustered at the subclass level (in parentheses). * p < 0.10, ** p < 0.05,*** p < 0.01.
38
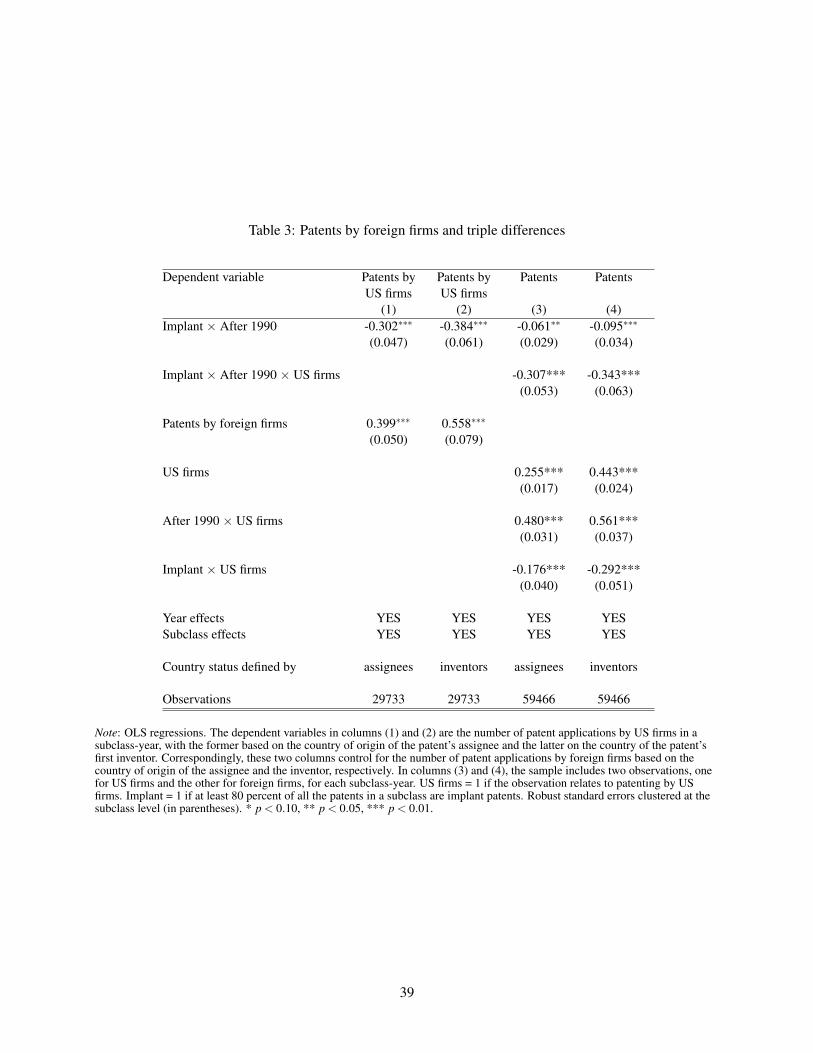
Table 3: Patents by foreign firms and triple differences
Dependent variable Patents by Patents by Patents PatentsUS firms US firms
(1) (2) (3) (4)Implant × After 1990 -0.302∗∗∗ -0.384∗∗∗ -0.061∗∗ -0.095∗∗∗
(0.047) (0.061) (0.029) (0.034)
Implant × After 1990 × US firms -0.307*** -0.343***(0.053) (0.063)
Patents by foreign firms 0.399∗∗∗ 0.558∗∗∗
(0.050) (0.079)
US firms 0.255*** 0.443***(0.017) (0.024)
After 1990 × US firms 0.480*** 0.561***(0.031) (0.037)
Implant × US firms -0.176*** -0.292***(0.040) (0.051)
Year effects YES YES YES YESSubclass effects YES YES YES YES
Country status defined by assignees inventors assignees inventors
Observations 29733 29733 59466 59466
Note: OLS regressions. The dependent variables in columns (1) and (2) are the number of patent applications by US firms in asubclass-year, with the former based on the country of origin of the patent’s assignee and the latter on the country of the patent’sfirst inventor. Correspondingly, these two columns control for the number of patent applications by foreign firms based on thecountry of origin of the assignee and the inventor, respectively. In columns (3) and (4), the sample includes two observations, onefor US firms and the other for foreign firms, for each subclass-year. US firms = 1 if the observation relates to patenting by USfirms. Implant = 1 if at least 80 percent of all the patents in a subclass are implant patents. Robust standard errors clustered at thesubclass level (in parentheses). * p < 0.10, ** p < 0.05, *** p < 0.01.
39
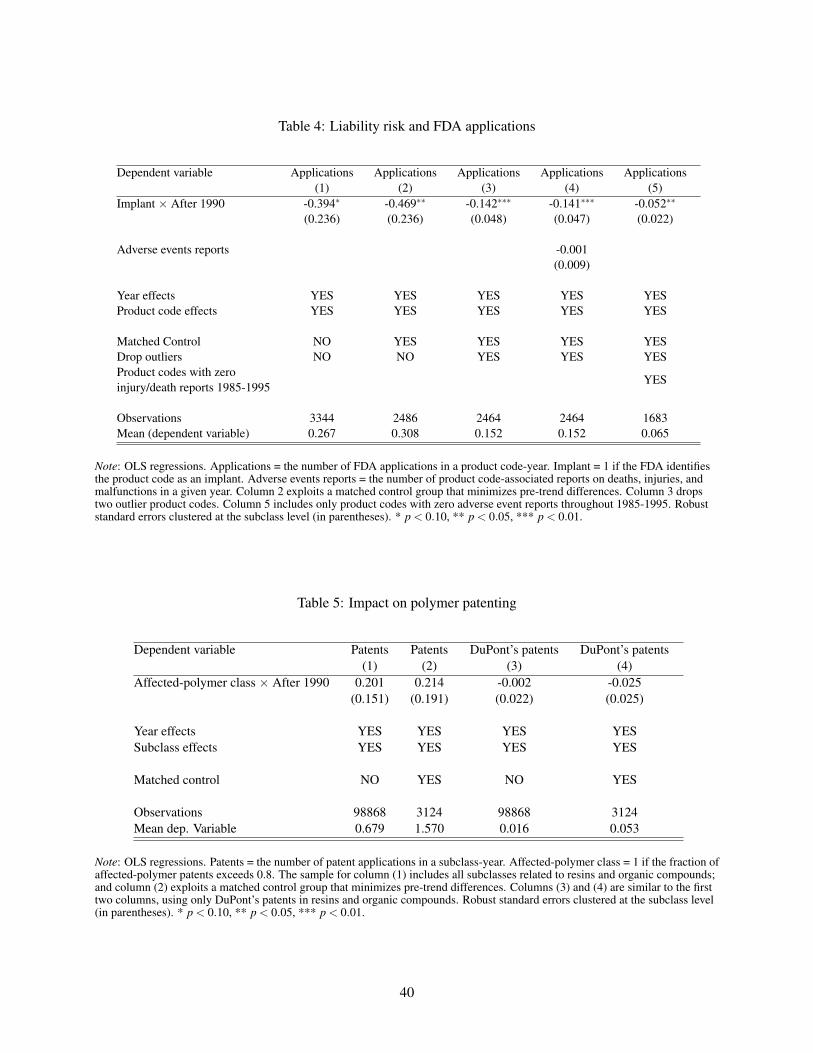
Table 4: Liability risk and FDA applications
Dependent variable Applications Applications Applications Applications Applications(1) (2) (3) (4) (5)
Implant × After 1990 -0.394∗ -0.469∗∗ -0.142∗∗∗ -0.141∗∗∗ -0.052∗∗
(0.236) (0.236) (0.048) (0.047) (0.022)
Adverse events reports -0.001(0.009)
Year effects YES YES YES YES YESProduct code effects YES YES YES YES YES
Matched Control NO YES YES YES YESDrop outliers NO NO YES YES YESProduct codes with zero
YESinjury/death reports 1985-1995
Observations 3344 2486 2464 2464 1683Mean (dependent variable) 0.267 0.308 0.152 0.152 0.065
Note: OLS regressions. Applications = the number of FDA applications in a product code-year. Implant = 1 if the FDA identifiesthe product code as an implant. Adverse events reports = the number of product code-associated reports on deaths, injuries, andmalfunctions in a given year. Column 2 exploits a matched control group that minimizes pre-trend differences. Column 3 dropstwo outlier product codes. Column 5 includes only product codes with zero adverse event reports throughout 1985-1995. Robuststandard errors clustered at the subclass level (in parentheses). * p < 0.10, ** p < 0.05, *** p < 0.01.
Table 5: Impact on polymer patenting
Dependent variable Patents Patents DuPont’s patents DuPont’s patents(1) (2) (3) (4)
Affected-polymer class × After 1990 0.201 0.214 -0.002 -0.025(0.151) (0.191) (0.022) (0.025)
Year effects YES YES YES YESSubclass effects YES YES YES YES
Matched control NO YES NO YES
Observations 98868 3124 98868 3124Mean dep. Variable 0.679 1.570 0.016 0.053
Note: OLS regressions. Patents = the number of patent applications in a subclass-year. Affected-polymer class = 1 if the fraction ofaffected-polymer patents exceeds 0.8. The sample for column (1) includes all subclasses related to resins and organic compounds;and column (2) exploits a matched control group that minimizes pre-trend differences. Columns (3) and (4) are similar to the firsttwo columns, using only DuPont’s patents in resins and organic compounds. Robust standard errors clustered at the subclass level(in parentheses). * p < 0.10, ** p < 0.05, *** p < 0.01.
40
Online Appendix
When does product liability risk chill innovation?Evidence from medical implants
Alberto Galasso and Hong Luo
1

Appendix A: DuPont’s revised supply policyBelow, we present the January 15, 1993 letter that DuPont sent to its customers describing the change in its
supply policy regarding implant manufacturers. The source of this letter is the May 20, 1994 hearing before
the Subcommittee on Regulation and Government Information of the Committee on Governmental Affairs
of the US Senate.
Dear (Customer’s Name):
This communication affects only those customers who use DuPont materials in implantable medical
devices.
Recently DuPont has determined that unpredictable and excessive costs of doing business with manu-
facturers of implantable medical devices no longer justifies unrestricted sale of standard raw materials to
such manufacturers at customary prices. Our new Policy and Caution Statement regarding these sales are
attached. Under DuPont’s new Policy there is a very strong presumption against sales to customers making
permanent implants.
Therefore, as of January 15, 1993, DuPont will begin to phase out sale of materials to customers using
our materials in medical articles intended for permanent implantation in the human body or in permanent
contact with internal body fluids or tissues. We intend to complete this phase out as soon as possible, but no
later than January 31, 1994.
To allow our customers time to locate alternate suppliers of materials, or alternate materials, during
this phase out period we will honor our existing customer/supplier relationships. Also, effective immediately
Du Pont will restrict sales of materials to companies who use those materials in medical articles intended
for brief or temporary implantation in the human body or in contact with internal body fluids or tissues.
DuPont will not supply the material to customers making temporary implants, unless the material comes
directly from DuPont under a contract which expressly acknowledges the contemplated use and contains
specific business risk management requirements.
Permission to refer to material Master Files will be withdrawn, and given only to direct customers
who are purchasing material from DuPont under contract. We intend to complete transition to this type of
supplier/customer relationship as soon as possible, but no later than January 31, 1994.
Unless expressly agreed by contract, do not make reference to the Du Pont name or any DuPont trade-
mark in association with any implantable medical device. Do not use a DuPont trademark as the descriptive
name of an implantable medical device. A copy of DuPont’s Policy and Caution are attached. We sincerely
regret any inconvenience this may cause you. If you have any questions, please contact me at (xxx-xxx-xxxx).
Sincerely.
2
Appendix B: Back-of-the-envelope welfare calculationThis Appendix explains in greater detail the welfare calculation conducted in Section 7.3. The calculation
follows four steps.
In step 1, we obtain the total surplus that would have been generated from having one new device.
This number is the product of the total number of procedures involving each of the four device types used
in the analysis—which are obtained from the 1992 annual summary of the National Hospital Discharge
Survey—and the increase in total surplus per procedure when physicians have access to a new medical
device, estimated by Grennan and Swanson (2017). Note that the increase in total surplus is the sum of the
increase in consumer surplus (physician, patient, and hospital combined) and producer gross profit (price
minus marginal cost). For example, for hip replacement, the total estimated increase in surplus is $7,233 +
$932 = $8,165 per procedure. The number of procedures in 1992 for hip replacement (ICD-9 code 81.51 in
Table 22) was 127K. Thus, the increase in total surplus is $1.03B per year for hip replacement. This number
for knee replacements, pacemakers, and cardiac catheterization is, respectively, $3.9B, $2.6B, and $4.2B.
In step 2, we derive the reduction in the total number of devices per year based on our estimates. Our
preferred model (column 3 of Table 6) implies an average reduction of 0.14 FDA device applications per
year for implant product codes relative to non-implant codes. Multiplying this average effect by the number
of product codes involving medical implants (107 codes), we obtain an estimated reduction of 15.96 implant
devices per year.
In step 3, we obtain the drop in the number of new devices associated with the four specific implant
types. Assuming that the drop in applications is distributed across categories in proportion to the level of
applications before the increase in liability risk (that is, between 1985-1989), the yearly reductions in the
number of applications are, respectively, 4.2, 0.1, 0.4, and 3.4 for hip implants, knee implants, pacemakers,
and catheters.
In step 4, multiplying the above numbers of yearly reductions in applications by the increase in total
surplus per new device per year yields the estimated reduction in total surplus due to the increase in liability
risk. The welfare loss for these four device types, in total, is $20.3B. Grennan and Swanson (2017) show that
for these four device categories, a typical product is in the consideration set of 56 percent to 91 percent of
hospitals. Taking these penetration rates into account, the decline in the total surplus for these four implant
categories combined is $11.9B per year.
Note that Grennan and Swanson (2017) provide estimates of the splits of the total surplus between
consumers surplus and producer gross profit for each device category. Repeating the above four steps using
each of the two components in Step 1 would provide us with an estimate of the loss in consumer surplus as
$10.6B per-year and the loss in producer gross profits as $1.2B per-year.25
If we use the lowest penetration rate documented by Grennan and Swanson (2017) across all Class-III
devices for all four categories, which is 20 percent, the decline in total surplus is $4.1B.
25For reference, one industry estimate suggests that the total sales of implant devices was $43B in 2011 (“Understanding themarket for implantable medical devices,” by Keith Lind, AARP Insights, August, 1-15, 2017). Assuming that the share of revenuescorresponds to the share of FDA application counts and that the average gross margin is 60 percent, an estimate of $1.2B lossin producer profit for these four product categories would suggest that the increased liability risk resulted in about 5.3 percent ofrevenue loss.
3
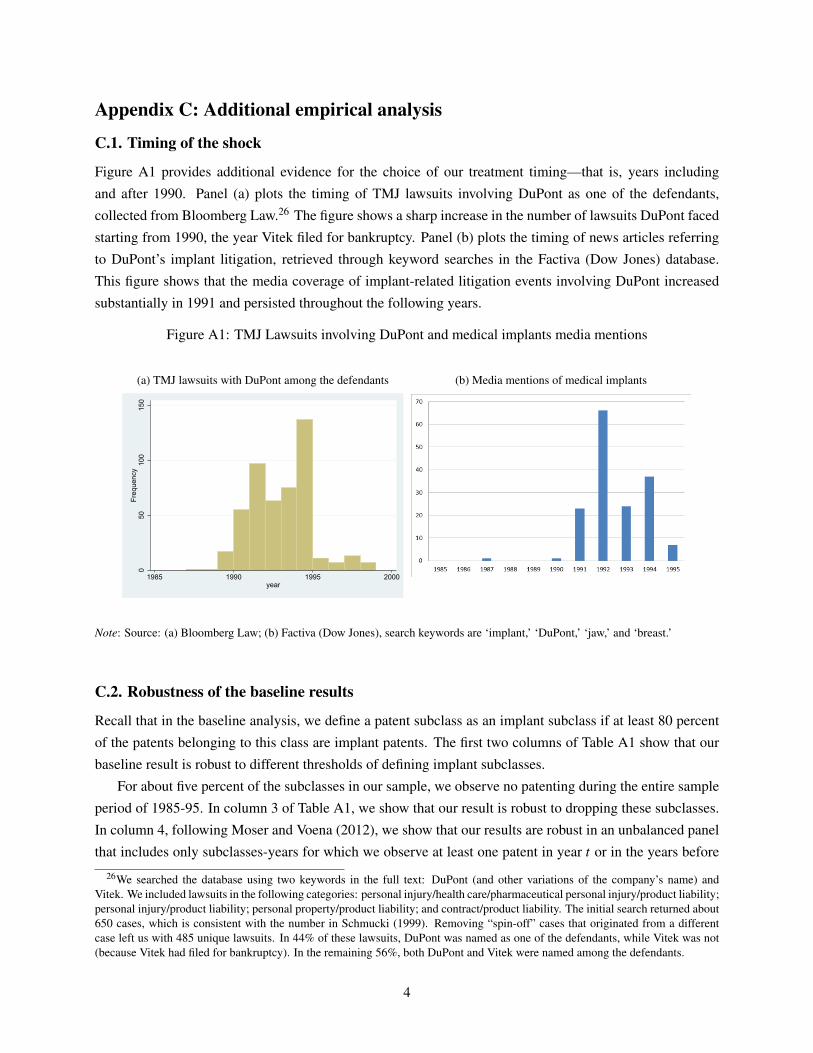
Appendix C: Additional empirical analysis
C.1. Timing of the shock
Figure A1 provides additional evidence for the choice of our treatment timing—that is, years including
and after 1990. Panel (a) plots the timing of TMJ lawsuits involving DuPont as one of the defendants,
collected from Bloomberg Law.26 The figure shows a sharp increase in the number of lawsuits DuPont faced
starting from 1990, the year Vitek filed for bankruptcy. Panel (b) plots the timing of news articles referring
to DuPont’s implant litigation, retrieved through keyword searches in the Factiva (Dow Jones) database.
This figure shows that the media coverage of implant-related litigation events involving DuPont increased
substantially in 1991 and persisted throughout the following years.
Figure A1: TMJ Lawsuits involving DuPont and medical implants media mentions
(a) TMJ lawsuits with DuPont among the defendants
050
100
150
Freq
uenc
y
1985 1990 1995 2000year
(b) Media mentions of medical implants
Note: Source: (a) Bloomberg Law; (b) Factiva (Dow Jones), search keywords are ‘implant,’ ‘DuPont,’ ‘jaw,’ and ‘breast.’
C.2. Robustness of the baseline results
Recall that in the baseline analysis, we define a patent subclass as an implant subclass if at least 80 percent
of the patents belonging to this class are implant patents. The first two columns of Table A1 show that our
baseline result is robust to different thresholds of defining implant subclasses.
For about five percent of the subclasses in our sample, we observe no patenting during the entire sample
period of 1985-95. In column 3 of Table A1, we show that our result is robust to dropping these subclasses.
In column 4, following Moser and Voena (2012), we show that our results are robust in an unbalanced panel
that includes only subclasses-years for which we observe at least one patent in year t or in the years before
26We searched the database using two keywords in the full text: DuPont (and other variations of the company’s name) andVitek. We included lawsuits in the following categories: personal injury/health care/pharmaceutical personal injury/product liability;personal injury/product liability; personal property/product liability; and contract/product liability. The initial search returned about650 cases, which is consistent with the number in Schmucki (1999). Removing “spin-off” cases that originated from a differentcase left us with 485 unique lawsuits. In 44% of these lawsuits, DuPont was named as one of the defendants, while Vitek was not(because Vitek had filed for bankruptcy). In the remaining 56%, both DuPont and Vitek were named among the defendants.
4
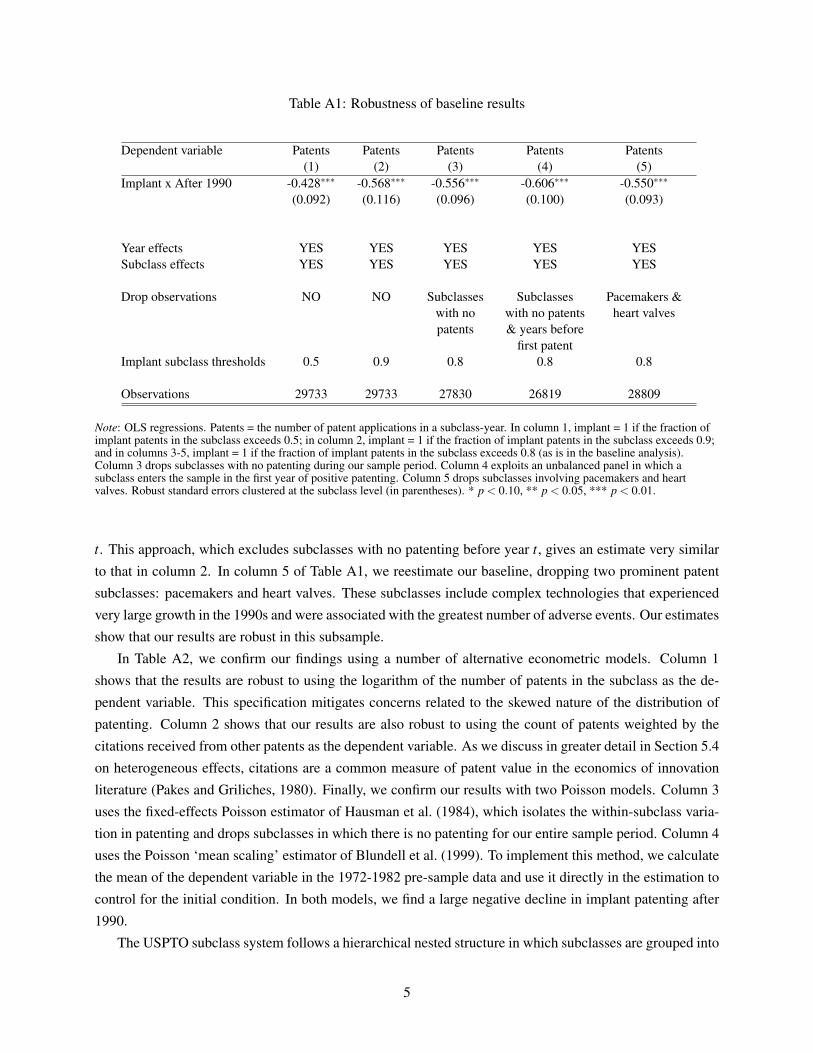
Table A1: Robustness of baseline results
Dependent variable Patents Patents Patents Patents Patents(1) (2) (3) (4) (5)
Implant x After 1990 -0.428∗∗∗ -0.568∗∗∗ -0.556∗∗∗ -0.606∗∗∗ -0.550∗∗∗
(0.092) (0.116) (0.096) (0.100) (0.093)
Year effects YES YES YES YES YESSubclass effects YES YES YES YES YES
Drop observations NO NO Subclasses Subclasses Pacemakers &with no with no patents heart valvespatents & years before
first patentImplant subclass thresholds 0.5 0.9 0.8 0.8 0.8
Observations 29733 29733 27830 26819 28809
Note: OLS regressions. Patents = the number of patent applications in a subclass-year. In column 1, implant = 1 if the fraction ofimplant patents in the subclass exceeds 0.5; in column 2, implant = 1 if the fraction of implant patents in the subclass exceeds 0.9;and in columns 3-5, implant = 1 if the fraction of implant patents in the subclass exceeds 0.8 (as is in the baseline analysis).Column 3 drops subclasses with no patenting during our sample period. Column 4 exploits an unbalanced panel in which asubclass enters the sample in the first year of positive patenting. Column 5 drops subclasses involving pacemakers and heartvalves. Robust standard errors clustered at the subclass level (in parentheses). * p < 0.10, ** p < 0.05, *** p < 0.01.
t. This approach, which excludes subclasses with no patenting before year t, gives an estimate very similar
to that in column 2. In column 5 of Table A1, we reestimate our baseline, dropping two prominent patent
subclasses: pacemakers and heart valves. These subclasses include complex technologies that experienced
very large growth in the 1990s and were associated with the greatest number of adverse events. Our estimates
show that our results are robust in this subsample.
In Table A2, we confirm our findings using a number of alternative econometric models. Column 1
shows that the results are robust to using the logarithm of the number of patents in the subclass as the de-
pendent variable. This specification mitigates concerns related to the skewed nature of the distribution of
patenting. Column 2 shows that our results are also robust to using the count of patents weighted by the
citations received from other patents as the dependent variable. As we discuss in greater detail in Section 5.4
on heterogeneous effects, citations are a common measure of patent value in the economics of innovation
literature (Pakes and Griliches, 1980). Finally, we confirm our results with two Poisson models. Column 3
uses the fixed-effects Poisson estimator of Hausman et al. (1984), which isolates the within-subclass varia-
tion in patenting and drops subclasses in which there is no patenting for our entire sample period. Column 4
uses the Poisson ‘mean scaling’ estimator of Blundell et al. (1999). To implement this method, we calculate
the mean of the dependent variable in the 1972-1982 pre-sample data and use it directly in the estimation to
control for the initial condition. In both models, we find a large negative decline in implant patenting after
1990.
The USPTO subclass system follows a hierarchical nested structure in which subclasses are grouped into
5
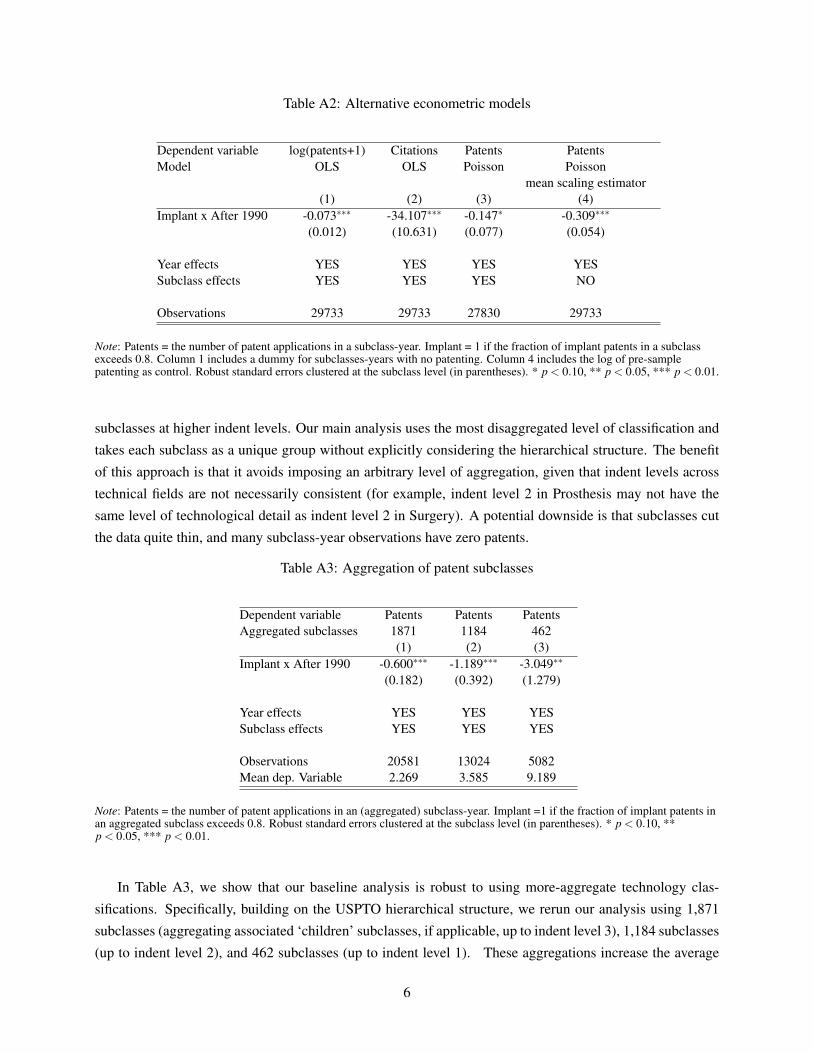
Table A2: Alternative econometric models
Dependent variable log(patents+1) Citations Patents PatentsModel OLS OLS Poisson Poisson
mean scaling estimator(1) (2) (3) (4)
Implant x After 1990 -0.073∗∗∗ -34.107∗∗∗ -0.147∗ -0.309∗∗∗
(0.012) (10.631) (0.077) (0.054)
Year effects YES YES YES YESSubclass effects YES YES YES NO
Observations 29733 29733 27830 29733
Note: Patents = the number of patent applications in a subclass-year. Implant = 1 if the fraction of implant patents in a subclassexceeds 0.8. Column 1 includes a dummy for subclasses-years with no patenting. Column 4 includes the log of pre-samplepatenting as control. Robust standard errors clustered at the subclass level (in parentheses). * p < 0.10, ** p < 0.05, *** p < 0.01.
subclasses at higher indent levels. Our main analysis uses the most disaggregated level of classification and
takes each subclass as a unique group without explicitly considering the hierarchical structure. The benefit
of this approach is that it avoids imposing an arbitrary level of aggregation, given that indent levels across
technical fields are not necessarily consistent (for example, indent level 2 in Prosthesis may not have the
same level of technological detail as indent level 2 in Surgery). A potential downside is that subclasses cut
the data quite thin, and many subclass-year observations have zero patents.
Table A3: Aggregation of patent subclasses
Dependent variable Patents Patents PatentsAggregated subclasses 1871 1184 462
(1) (2) (3)Implant x After 1990 -0.600∗∗∗ -1.189∗∗∗ -3.049∗∗
(0.182) (0.392) (1.279)
Year effects YES YES YESSubclass effects YES YES YES
Observations 20581 13024 5082Mean dep. Variable 2.269 3.585 9.189
Note: Patents = the number of patent applications in an (aggregated) subclass-year. Implant =1 if the fraction of implant patents inan aggregated subclass exceeds 0.8. Robust standard errors clustered at the subclass level (in parentheses). * p < 0.10, **p < 0.05, *** p < 0.01.
In Table A3, we show that our baseline analysis is robust to using more-aggregate technology clas-
sifications. Specifically, building on the USPTO hierarchical structure, we rerun our analysis using 1,871
subclasses (aggregating associated ‘children’ subclasses, if applicable, up to indent level 3), 1,184 subclasses
(up to indent level 2), and 462 subclasses (up to indent level 1). These aggregations increase the average
6
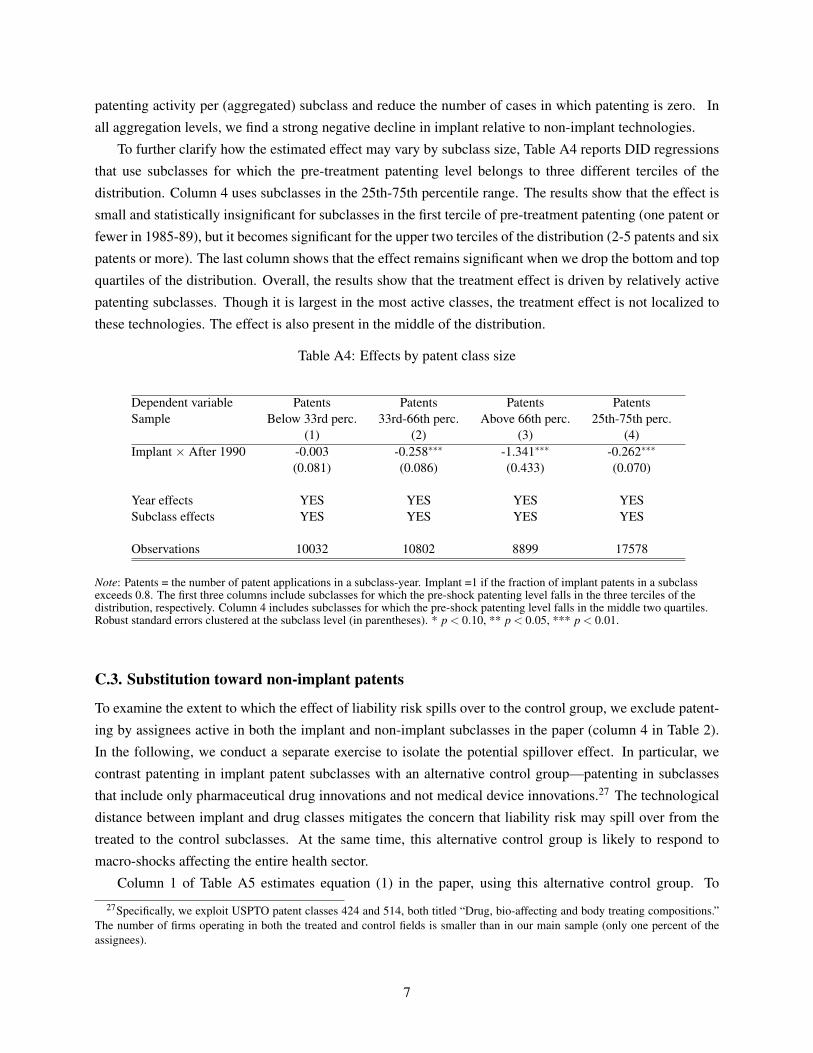
patenting activity per (aggregated) subclass and reduce the number of cases in which patenting is zero. In
all aggregation levels, we find a strong negative decline in implant relative to non-implant technologies.
To further clarify how the estimated effect may vary by subclass size, Table A4 reports DID regressions
that use subclasses for which the pre-treatment patenting level belongs to three different terciles of the
distribution. Column 4 uses subclasses in the 25th-75th percentile range. The results show that the effect is
small and statistically insignificant for subclasses in the first tercile of pre-treatment patenting (one patent or
fewer in 1985-89), but it becomes significant for the upper two terciles of the distribution (2-5 patents and six
patents or more). The last column shows that the effect remains significant when we drop the bottom and top
quartiles of the distribution. Overall, the results show that the treatment effect is driven by relatively active
patenting subclasses. Though it is largest in the most active classes, the treatment effect is not localized to
these technologies. The effect is also present in the middle of the distribution.
Table A4: Effects by patent class size
Dependent variable Patents Patents Patents PatentsSample Below 33rd perc. 33rd-66th perc. Above 66th perc. 25th-75th perc.
(1) (2) (3) (4)Implant × After 1990 -0.003 -0.258∗∗∗ -1.341∗∗∗ -0.262∗∗∗
(0.081) (0.086) (0.433) (0.070)
Year effects YES YES YES YESSubclass effects YES YES YES YES
Observations 10032 10802 8899 17578
Note: Patents = the number of patent applications in a subclass-year. Implant =1 if the fraction of implant patents in a subclassexceeds 0.8. The first three columns include subclasses for which the pre-shock patenting level falls in the three terciles of thedistribution, respectively. Column 4 includes subclasses for which the pre-shock patenting level falls in the middle two quartiles.Robust standard errors clustered at the subclass level (in parentheses). * p < 0.10, ** p < 0.05, *** p < 0.01.
C.3. Substitution toward non-implant patents
To examine the extent to which the effect of liability risk spills over to the control group, we exclude patent-
ing by assignees active in both the implant and non-implant subclasses in the paper (column 4 in Table 2).
In the following, we conduct a separate exercise to isolate the potential spillover effect. In particular, we
contrast patenting in implant patent subclasses with an alternative control group—patenting in subclasses
that include only pharmaceutical drug innovations and not medical device innovations.27 The technological
distance between implant and drug classes mitigates the concern that liability risk may spill over from the
treated to the control subclasses. At the same time, this alternative control group is likely to respond to
macro-shocks affecting the entire health sector.
Column 1 of Table A5 estimates equation (1) in the paper, using this alternative control group. To
27Specifically, we exploit USPTO patent classes 424 and 514, both titled “Drug, bio-affecting and body treating compositions.”The number of firms operating in both the treated and control fields is smaller than in our main sample (only one percent of theassignees).
7
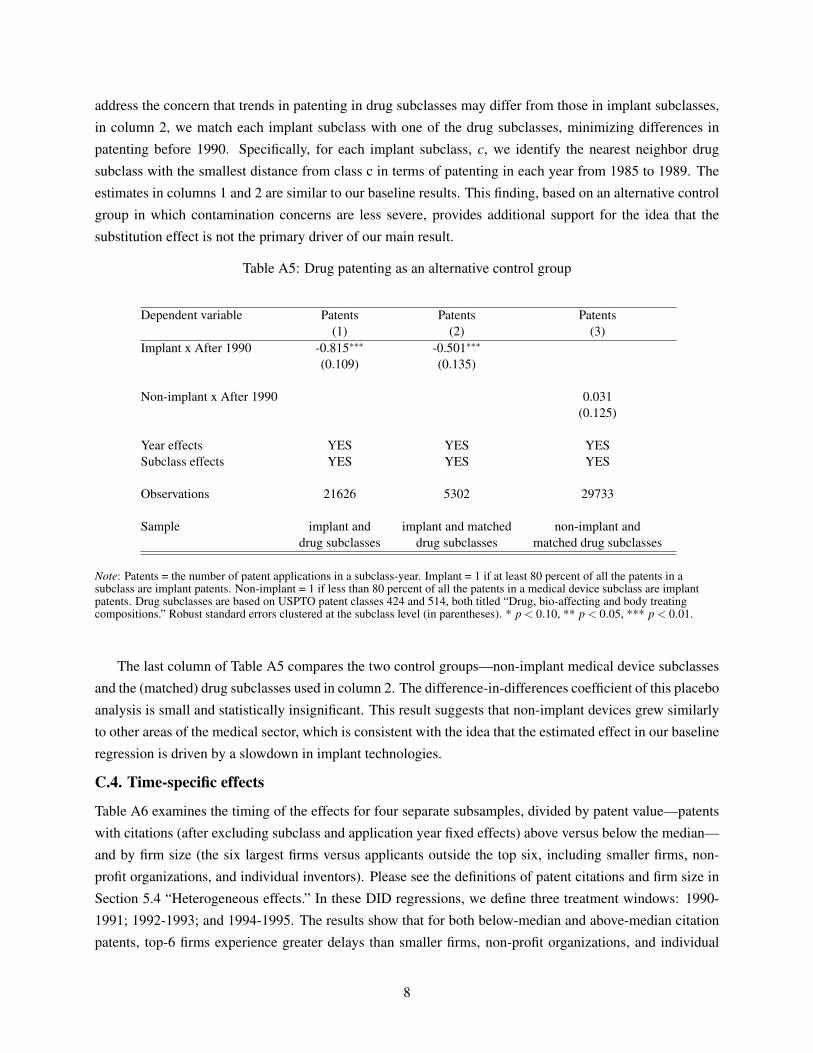
address the concern that trends in patenting in drug subclasses may differ from those in implant subclasses,
in column 2, we match each implant subclass with one of the drug subclasses, minimizing differences in
patenting before 1990. Specifically, for each implant subclass, c, we identify the nearest neighbor drug
subclass with the smallest distance from class c in terms of patenting in each year from 1985 to 1989. The
estimates in columns 1 and 2 are similar to our baseline results. This finding, based on an alternative control
group in which contamination concerns are less severe, provides additional support for the idea that the
substitution effect is not the primary driver of our main result.
Table A5: Drug patenting as an alternative control group
Dependent variable Patents Patents Patents(1) (2) (3)
Implant x After 1990 -0.815∗∗∗ -0.501∗∗∗
(0.109) (0.135)
Non-implant x After 1990 0.031(0.125)
Year effects YES YES YESSubclass effects YES YES YES
Observations 21626 5302 29733
Sample implant and implant and matched non-implant anddrug subclasses drug subclasses matched drug subclasses
Note: Patents = the number of patent applications in a subclass-year. Implant = 1 if at least 80 percent of all the patents in asubclass are implant patents. Non-implant = 1 if less than 80 percent of all the patents in a medical device subclass are implantpatents. Drug subclasses are based on USPTO patent classes 424 and 514, both titled “Drug, bio-affecting and body treatingcompositions.” Robust standard errors clustered at the subclass level (in parentheses). * p < 0.10, ** p < 0.05, *** p < 0.01.
The last column of Table A5 compares the two control groups—non-implant medical device subclasses
and the (matched) drug subclasses used in column 2. The difference-in-differences coefficient of this placebo
analysis is small and statistically insignificant. This result suggests that non-implant devices grew similarly
to other areas of the medical sector, which is consistent with the idea that the estimated effect in our baseline
regression is driven by a slowdown in implant technologies.
C.4. Time-specific effects
Table A6 examines the timing of the effects for four separate subsamples, divided by patent value—patents
with citations (after excluding subclass and application year fixed effects) above versus below the median—
and by firm size (the six largest firms versus applicants outside the top six, including smaller firms, non-
profit organizations, and individual inventors). Please see the definitions of patent citations and firm size in
Section 5.4 “Heterogeneous effects.” In these DID regressions, we define three treatment windows: 1990-
1991; 1992-1993; and 1994-1995. The results show that for both below-median and above-median citation
patents, top-6 firms experience greater delays than smaller firms, non-profit organizations, and individual
8
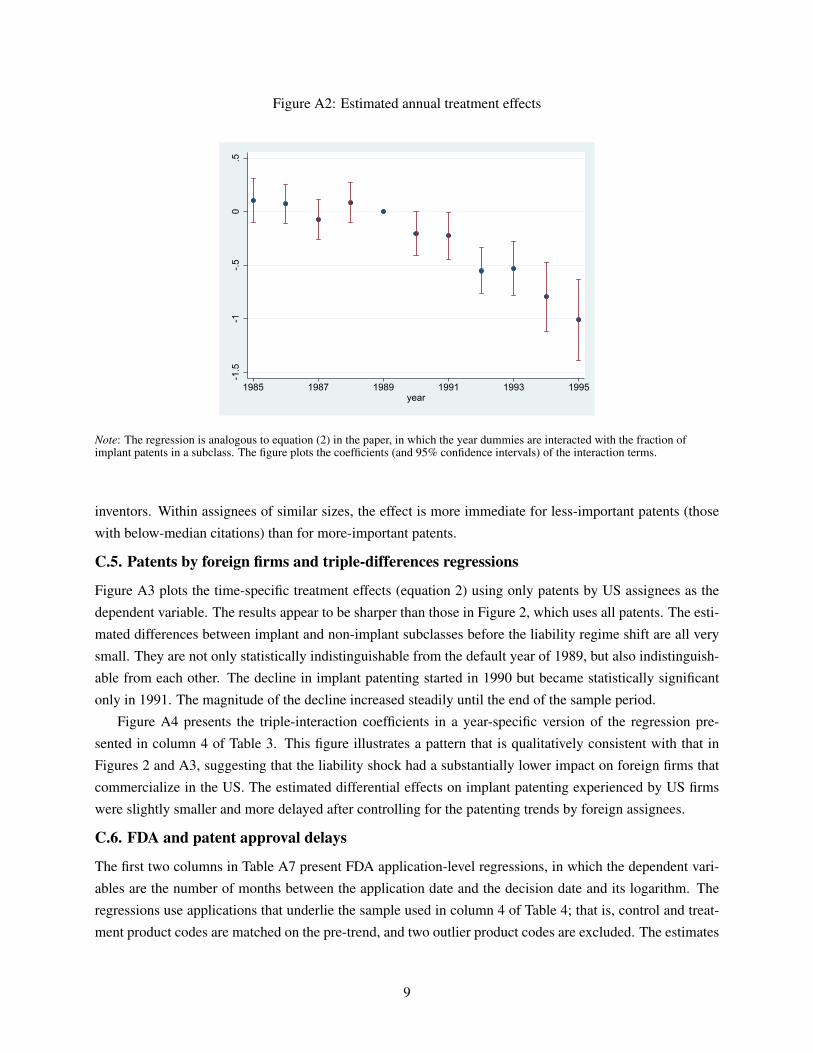
Figure A2: Estimated annual treatment effects
-1.5
-1-.5
0.5
1985 1987 1989 1991 1993 1995year
Note: The regression is analogous to equation (2) in the paper, in which the year dummies are interacted with the fraction ofimplant patents in a subclass. The figure plots the coefficients (and 95% confidence intervals) of the interaction terms.
inventors. Within assignees of similar sizes, the effect is more immediate for less-important patents (those
with below-median citations) than for more-important patents.
C.5. Patents by foreign firms and triple-differences regressions
Figure A3 plots the time-specific treatment effects (equation 2) using only patents by US assignees as the
dependent variable. The results appear to be sharper than those in Figure 2, which uses all patents. The esti-
mated differences between implant and non-implant subclasses before the liability regime shift are all very
small. They are not only statistically indistinguishable from the default year of 1989, but also indistinguish-
able from each other. The decline in implant patenting started in 1990 but became statistically significant
only in 1991. The magnitude of the decline increased steadily until the end of the sample period.
Figure A4 presents the triple-interaction coefficients in a year-specific version of the regression pre-
sented in column 4 of Table 3. This figure illustrates a pattern that is qualitatively consistent with that in
Figures 2 and A3, suggesting that the liability shock had a substantially lower impact on foreign firms that
commercialize in the US. The estimated differential effects on implant patenting experienced by US firms
were slightly smaller and more delayed after controlling for the patenting trends by foreign assignees.
C.6. FDA and patent approval delays
The first two columns in Table A7 present FDA application-level regressions, in which the dependent vari-
ables are the number of months between the application date and the decision date and its logarithm. The
regressions use applications that underlie the sample used in column 4 of Table 4; that is, control and treat-
ment product codes are matched on the pre-trend, and two outlier product codes are excluded. The estimates
9
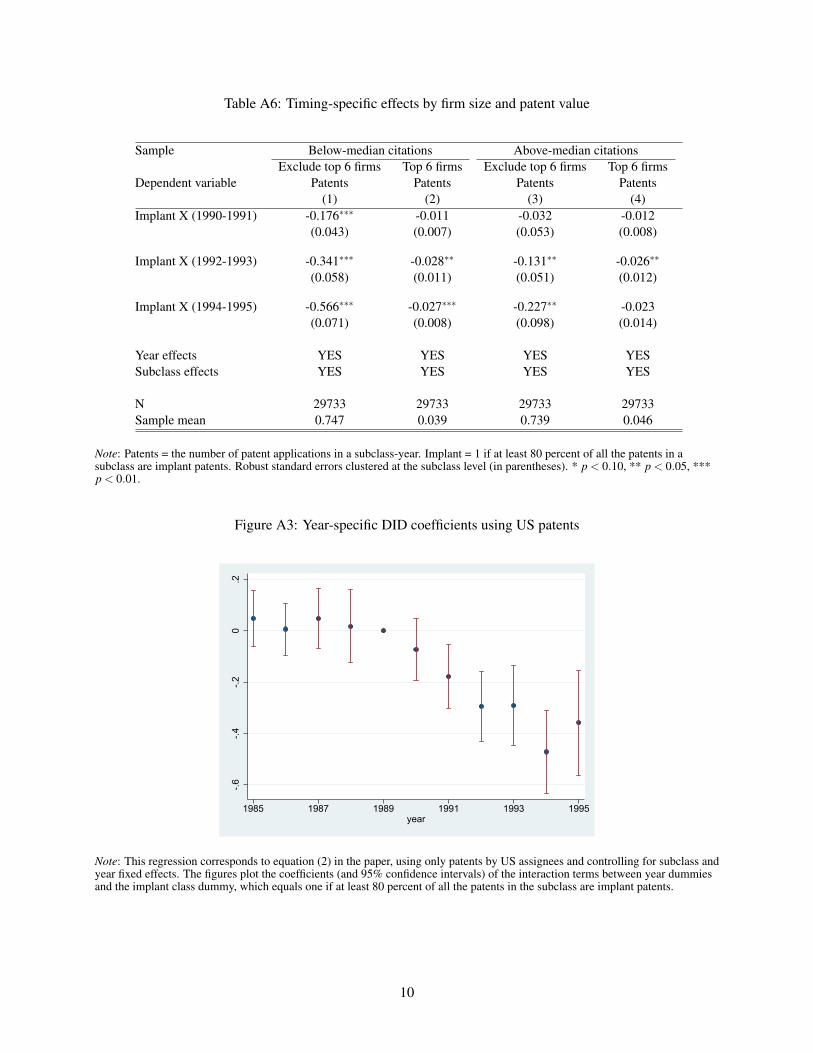
Table A6: Timing-specific effects by firm size and patent value
Sample Below-median citations Above-median citationsExclude top 6 firms Top 6 firms Exclude top 6 firms Top 6 firms
Dependent variable Patents Patents Patents Patents(1) (2) (3) (4)
Implant X (1990-1991) -0.176∗∗∗ -0.011 -0.032 -0.012(0.043) (0.007) (0.053) (0.008)
Implant X (1992-1993) -0.341∗∗∗ -0.028∗∗ -0.131∗∗ -0.026∗∗
(0.058) (0.011) (0.051) (0.012)
Implant X (1994-1995) -0.566∗∗∗ -0.027∗∗∗ -0.227∗∗ -0.023(0.071) (0.008) (0.098) (0.014)
Year effects YES YES YES YESSubclass effects YES YES YES YES
N 29733 29733 29733 29733Sample mean 0.747 0.039 0.739 0.046
Note: Patents = the number of patent applications in a subclass-year. Implant = 1 if at least 80 percent of all the patents in asubclass are implant patents. Robust standard errors clustered at the subclass level (in parentheses). * p < 0.10, ** p < 0.05, ***p < 0.01.
Figure A3: Year-specific DID coefficients using US patents
-.6-.4
-.20
.2
1985 1987 1989 1991 1993 1995year
Note: This regression corresponds to equation (2) in the paper, using only patents by US assignees and controlling for subclass andyear fixed effects. The figures plot the coefficients (and 95% confidence intervals) of the interaction terms between year dummiesand the implant class dummy, which equals one if at least 80 percent of all the patents in the subclass are implant patents.
10
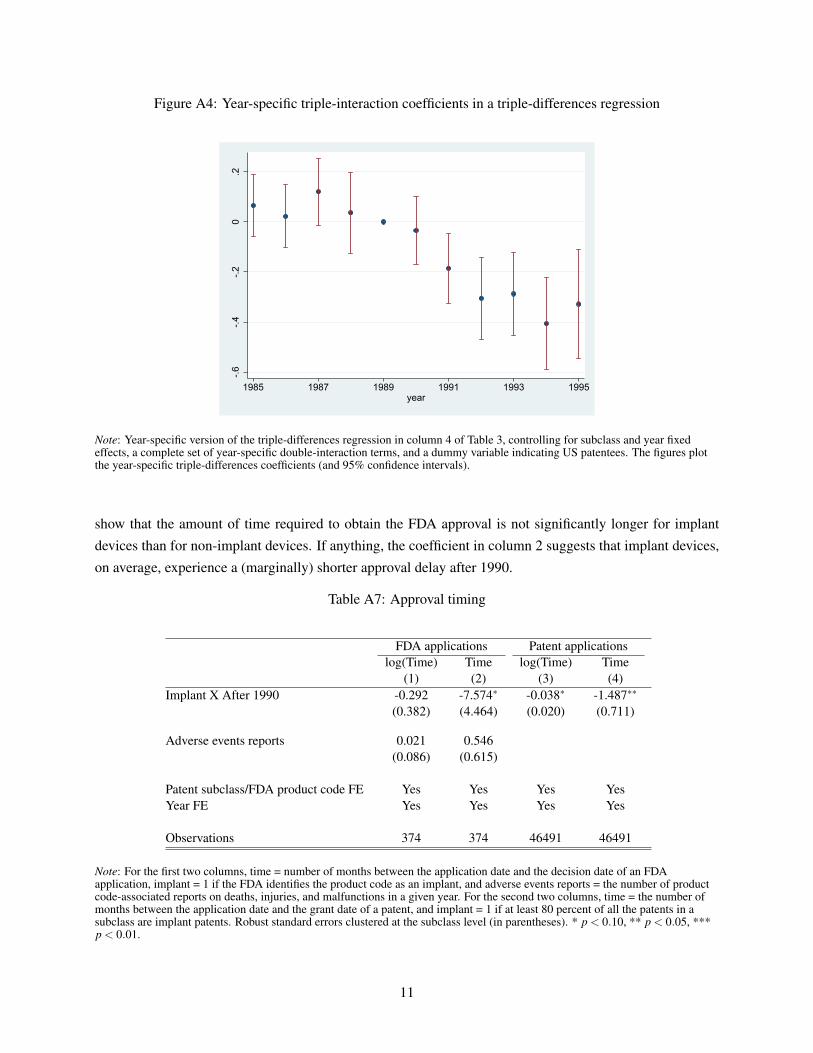
Figure A4: Year-specific triple-interaction coefficients in a triple-differences regression
-.6-.4
-.20
.2
1985 1987 1989 1991 1993 1995year
Note: Year-specific version of the triple-differences regression in column 4 of Table 3, controlling for subclass and year fixedeffects, a complete set of year-specific double-interaction terms, and a dummy variable indicating US patentees. The figures plotthe year-specific triple-differences coefficients (and 95% confidence intervals).
show that the amount of time required to obtain the FDA approval is not significantly longer for implant
devices than for non-implant devices. If anything, the coefficient in column 2 suggests that implant devices,
on average, experience a (marginally) shorter approval delay after 1990.
Table A7: Approval timing
FDA applications Patent applicationslog(Time) Time log(Time) Time
(1) (2) (3) (4)Implant X After 1990 -0.292 -7.574∗ -0.038∗ -1.487∗∗
(0.382) (4.464) (0.020) (0.711)
Adverse events reports 0.021 0.546(0.086) (0.615)
Patent subclass/FDA product code FE Yes Yes Yes YesYear FE Yes Yes Yes Yes
Observations 374 374 46491 46491
Note: For the first two columns, time = number of months between the application date and the decision date of an FDAapplication, implant = 1 if the FDA identifies the product code as an implant, and adverse events reports = the number of productcode-associated reports on deaths, injuries, and malfunctions in a given year. For the second two columns, time = the number ofmonths between the application date and the grant date of a patent, and implant = 1 if at least 80 percent of all the patents in asubclass are implant patents. Robust standard errors clustered at the subclass level (in parentheses). * p < 0.10, ** p < 0.05, ***p < 0.01.
11

Figure A5: Estimated annual treatment effects using patents published by the UK patent office
-.8-.6
-.4-.2
0.2
.4.6
.8
1985 1987 1989 1991 1993 1995year
Note: This regression uses medical device patents published by the UK patent office and applied for between 1985 and 1995. Theregression corresponds to equation (2) in the paper, controlling for subclass and year fixed effects. The figure plots the coefficients(and 95% confidence intervals) of the interaction terms between year dummies and the implant class dummy. We use theclassification system used in Europe during our sample period and define class A61 (“Medical or Veterinary Science, Hygiene”) asmedical device patents. We use a less demanding textual algorithm than we use for US patents—that is, searching only forkeywords of ‘implant, graft, prosthesis, or prosthetic’ without combining that with the device name keywords—to identify implantpatents because our data for UK, Germany and France contain fewer textual variables. Similar to our baseline analysis, the cutoffthreshold for defining an implant class is chosen so that the treated implant subclasses contain roughly the top tenth percentile ofthe distribution of the fraction of implant patents.
In the second two columns of Table A7, we replicate the above analysis for patent grant delays (from
the application date to the grant date) at the USPTO. We use the patents underlying our baseline sample and
define implant subclasses as those with a fraction of implant patents above the 80-percent threshold, as we
do in the baseline analysis. The regressions control for year and patent subclass fixed effects. The results
also do not show any differential increase in grant delays for implant subclasses relative to non-implant
subclasses. These results on FDA approval time and patent grant delays help mitigate the concern that our
main results in the paper are driven by heavier regulatory burdens for implant technologies.
C.7. Heterogeneous effects
Panel A of Table A8 estimates our baseline regression across five groups of patentees. For each assignee
in our sample, we construct a patent portfolio equal to the number of medical device patents between 1985
and 1995. Because of the skewness in the distribution of patent portfolios, we allocate patentees into three
groups: ‘small patentees’ (assignees with one to four total patents) cover 50.5% of the patents; ‘medium
patentees’ (assignees with five to 40 total patents) cover 24.2% of the patents; and ‘large patentees’ (as-
signees with more than 40 patents) cover the remaining 25.2% of the patents. In addition, we further exam-
ine the effect on patenting by the largest assignees, creating two additional groups: the ‘Top 16 assignees’
group covers roughly 10% of the patents, and ‘Top six assignees’ group covers roughly 5% of the patents.
12
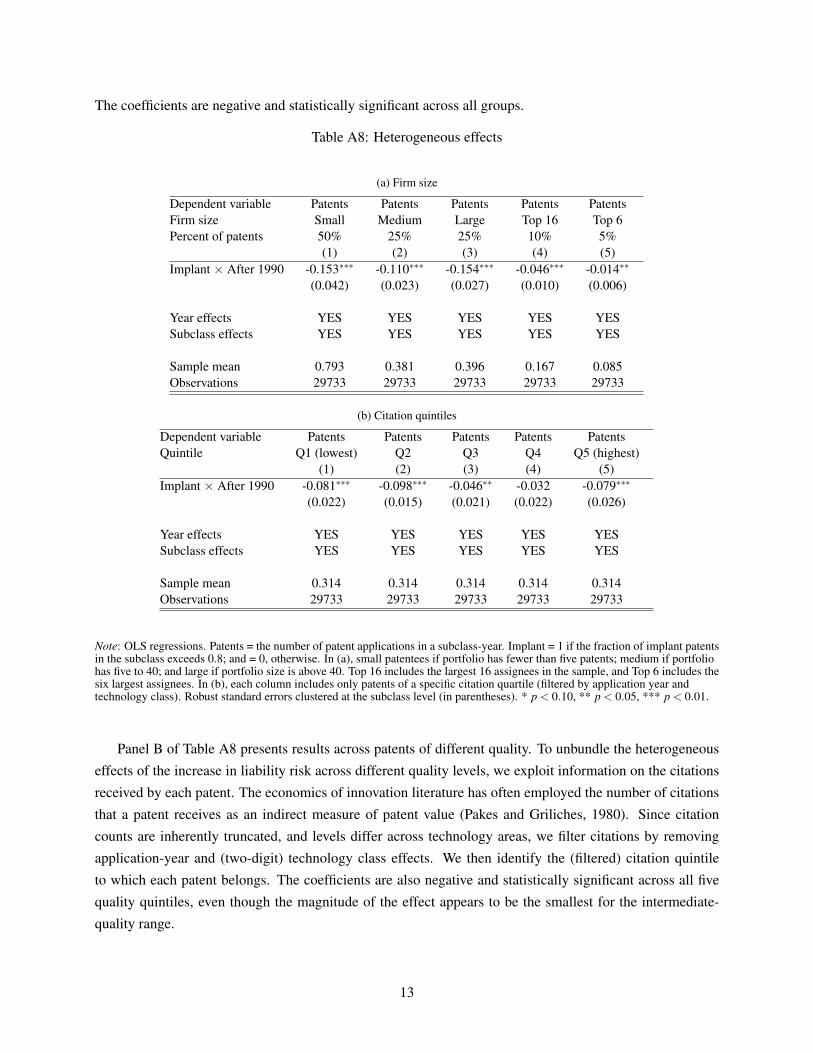
The coefficients are negative and statistically significant across all groups.
Table A8: Heterogeneous effects
(a) Firm size
Dependent variable Patents Patents Patents Patents PatentsFirm size Small Medium Large Top 16 Top 6Percent of patents 50% 25% 25% 10% 5%
(1) (2) (3) (4) (5)Implant × After 1990 -0.153∗∗∗ -0.110∗∗∗ -0.154∗∗∗ -0.046∗∗∗ -0.014∗∗
(0.042) (0.023) (0.027) (0.010) (0.006)
Year effects YES YES YES YES YESSubclass effects YES YES YES YES YES
Sample mean 0.793 0.381 0.396 0.167 0.085Observations 29733 29733 29733 29733 29733
(b) Citation quintiles
Dependent variable Patents Patents Patents Patents PatentsQuintile Q1 (lowest) Q2 Q3 Q4 Q5 (highest)
(1) (2) (3) (4) (5)Implant × After 1990 -0.081∗∗∗ -0.098∗∗∗ -0.046∗∗ -0.032 -0.079∗∗∗
(0.022) (0.015) (0.021) (0.022) (0.026)
Year effects YES YES YES YES YESSubclass effects YES YES YES YES YES
Sample mean 0.314 0.314 0.314 0.314 0.314Observations 29733 29733 29733 29733 29733
Note: OLS regressions. Patents = the number of patent applications in a subclass-year. Implant = 1 if the fraction of implant patentsin the subclass exceeds 0.8; and = 0, otherwise. In (a), small patentees if portfolio has fewer than five patents; medium if portfoliohas five to 40; and large if portfolio size is above 40. Top 16 includes the largest 16 assignees in the sample, and Top 6 includes thesix largest assignees. In (b), each column includes only patents of a specific citation quartile (filtered by application year andtechnology class). Robust standard errors clustered at the subclass level (in parentheses). * p < 0.10, ** p < 0.05, *** p < 0.01.
Panel B of Table A8 presents results across patents of different quality. To unbundle the heterogeneous
effects of the increase in liability risk across different quality levels, we exploit information on the citations
received by each patent. The economics of innovation literature has often employed the number of citations
that a patent receives as an indirect measure of patent value (Pakes and Griliches, 1980). Since citation
counts are inherently truncated, and levels differ across technology areas, we filter citations by removing
application-year and (two-digit) technology class effects. We then identify the (filtered) citation quintile
to which each patent belongs. The coefficients are also negative and statistically significant across all five
quality quintiles, even though the magnitude of the effect appears to be the smallest for the intermediate-
quality range.
13
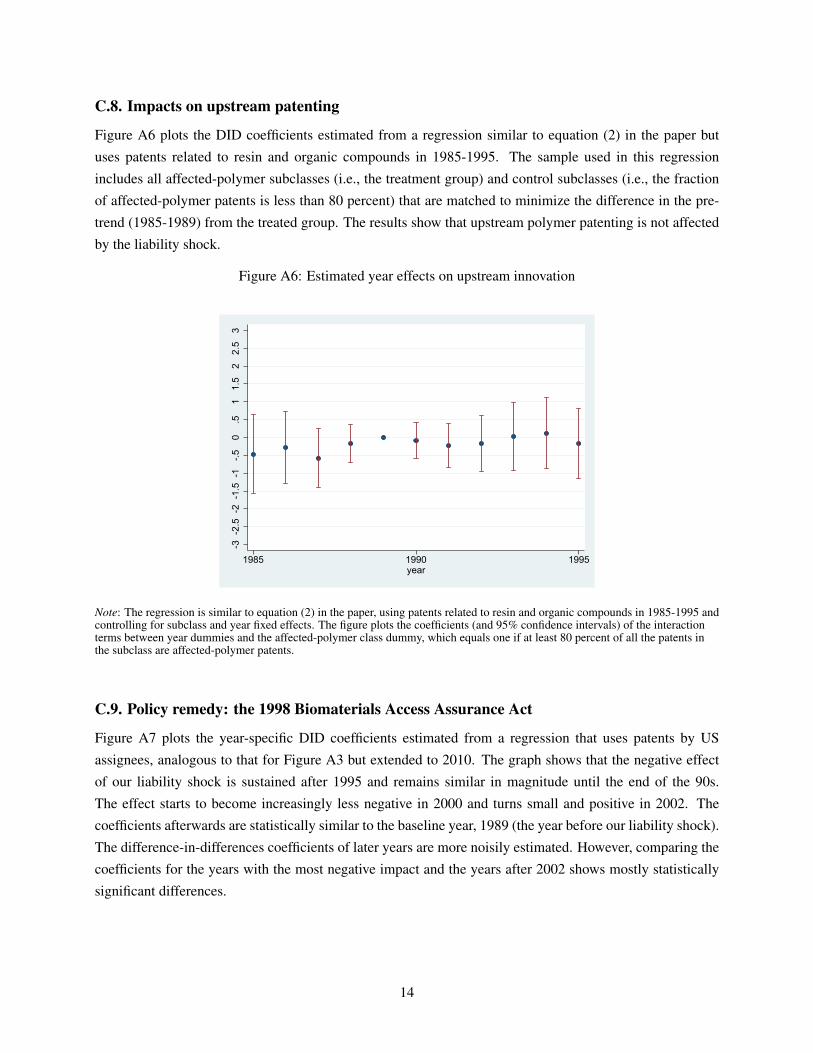
C.8. Impacts on upstream patenting
Figure A6 plots the DID coefficients estimated from a regression similar to equation (2) in the paper but
uses patents related to resin and organic compounds in 1985-1995. The sample used in this regression
includes all affected-polymer subclasses (i.e., the treatment group) and control subclasses (i.e., the fraction
of affected-polymer patents is less than 80 percent) that are matched to minimize the difference in the pre-
trend (1985-1989) from the treated group. The results show that upstream polymer patenting is not affected
by the liability shock.
Figure A6: Estimated year effects on upstream innovation
-3-2
.5-2
-1.5
-1-.5
0.5
11.
52
2.5
3
1985 1990 1995year
Note: The regression is similar to equation (2) in the paper, using patents related to resin and organic compounds in 1985-1995 andcontrolling for subclass and year fixed effects. The figure plots the coefficients (and 95% confidence intervals) of the interactionterms between year dummies and the affected-polymer class dummy, which equals one if at least 80 percent of all the patents inthe subclass are affected-polymer patents.
C.9. Policy remedy: the 1998 Biomaterials Access Assurance Act
Figure A7 plots the year-specific DID coefficients estimated from a regression that uses patents by US
assignees, analogous to that for Figure A3 but extended to 2010. The graph shows that the negative effect
of our liability shock is sustained after 1995 and remains similar in magnitude until the end of the 90s.
The effect starts to become increasingly less negative in 2000 and turns small and positive in 2002. The
coefficients afterwards are statistically similar to the baseline year, 1989 (the year before our liability shock).
The difference-in-differences coefficients of later years are more noisily estimated. However, comparing the
coefficients for the years with the most negative impact and the years after 2002 shows mostly statistically
significant differences.
14
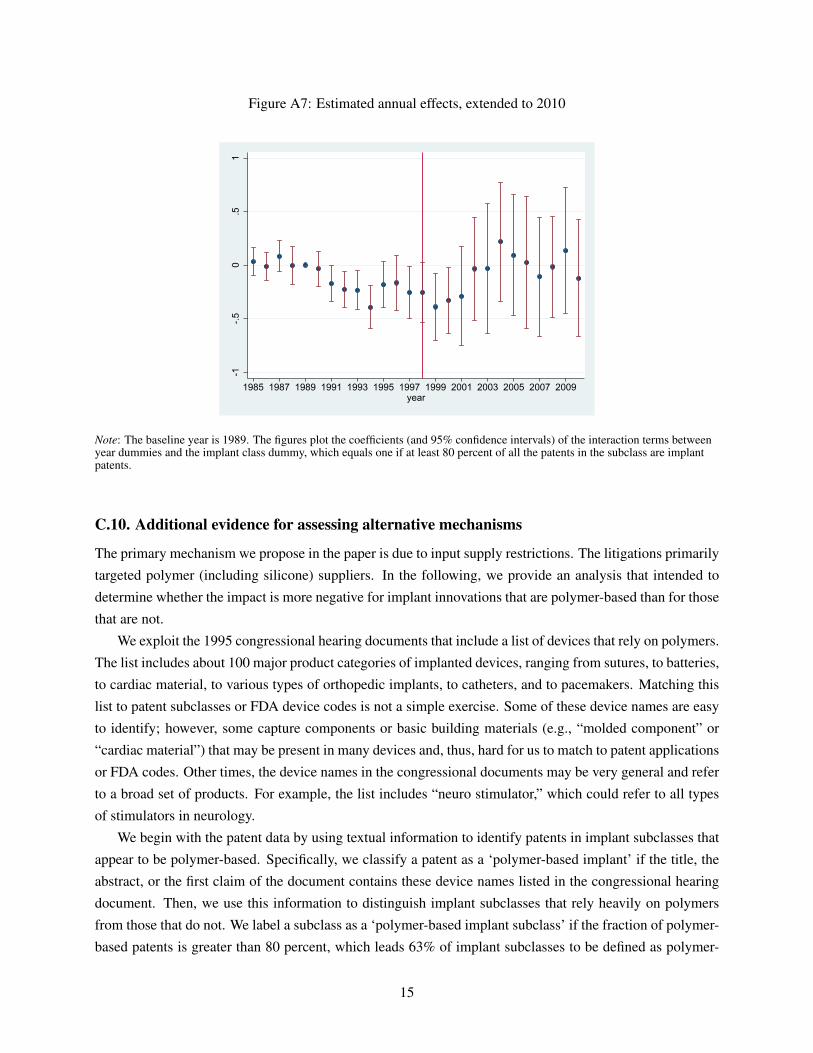
Figure A7: Estimated annual effects, extended to 2010
-1-.5
0.5
1
1985 1987 1989 1991 1993 1995 1997 1999 2001 2003 2005 2007 2009year
Note: The baseline year is 1989. The figures plot the coefficients (and 95% confidence intervals) of the interaction terms betweenyear dummies and the implant class dummy, which equals one if at least 80 percent of all the patents in the subclass are implantpatents.
C.10. Additional evidence for assessing alternative mechanisms
The primary mechanism we propose in the paper is due to input supply restrictions. The litigations primarily
targeted polymer (including silicone) suppliers. In the following, we provide an analysis that intended to
determine whether the impact is more negative for implant innovations that are polymer-based than for those
that are not.
We exploit the 1995 congressional hearing documents that include a list of devices that rely on polymers.
The list includes about 100 major product categories of implanted devices, ranging from sutures, to batteries,
to cardiac material, to various types of orthopedic implants, to catheters, and to pacemakers. Matching this
list to patent subclasses or FDA device codes is not a simple exercise. Some of these device names are easy
to identify; however, some capture components or basic building materials (e.g., “molded component” or
“cardiac material”) that may be present in many devices and, thus, hard for us to match to patent applications
or FDA codes. Other times, the device names in the congressional documents may be very general and refer
to a broad set of products. For example, the list includes “neuro stimulator,” which could refer to all types
of stimulators in neurology.
We begin with the patent data by using textual information to identify patents in implant subclasses that
appear to be polymer-based. Specifically, we classify a patent as a ‘polymer-based implant’ if the title, the
abstract, or the first claim of the document contains these device names listed in the congressional hearing
document. Then, we use this information to distinguish implant subclasses that rely heavily on polymers
from those that do not. We label a subclass as a ‘polymer-based implant subclass’ if the fraction of polymer-
based patents is greater than 80 percent, which leads 63% of implant subclasses to be defined as polymer-
15
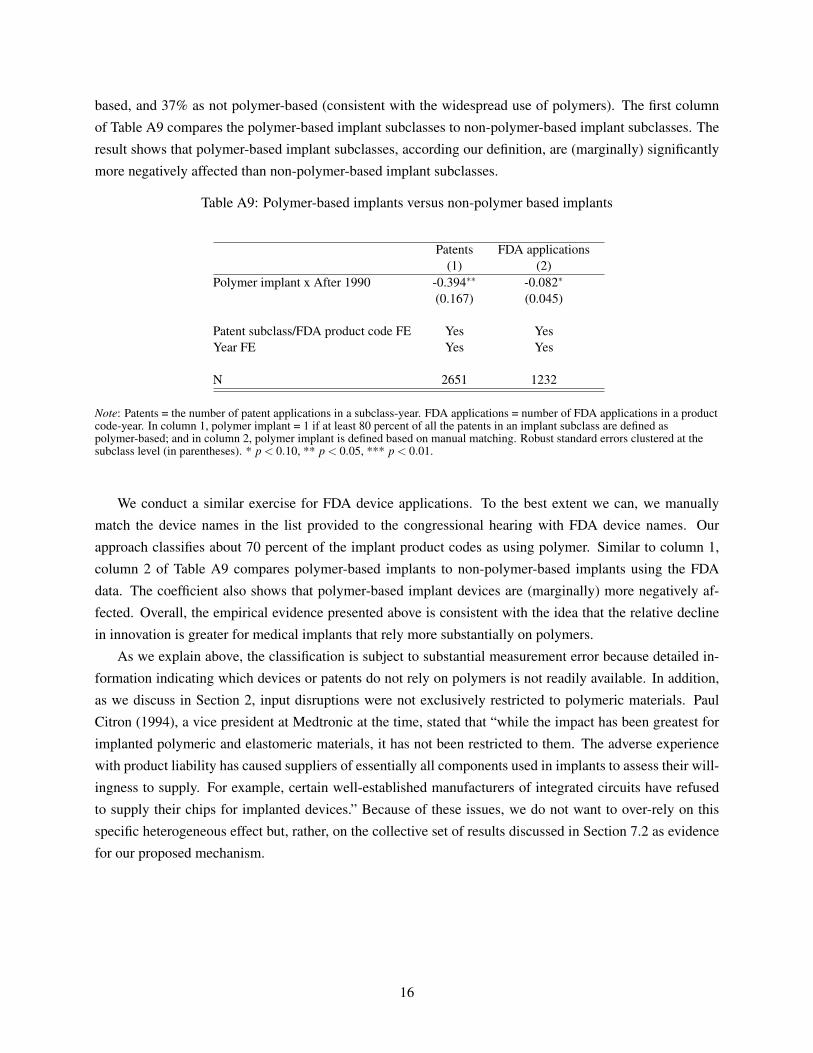
based, and 37% as not polymer-based (consistent with the widespread use of polymers). The first column
of Table A9 compares the polymer-based implant subclasses to non-polymer-based implant subclasses. The
result shows that polymer-based implant subclasses, according our definition, are (marginally) significantly
more negatively affected than non-polymer-based implant subclasses.
Table A9: Polymer-based implants versus non-polymer based implants
Patents FDA applications(1) (2)
Polymer implant x After 1990 -0.394∗∗ -0.082∗
(0.167) (0.045)
Patent subclass/FDA product code FE Yes YesYear FE Yes Yes
N 2651 1232
Note: Patents = the number of patent applications in a subclass-year. FDA applications = number of FDA applications in a productcode-year. In column 1, polymer implant = 1 if at least 80 percent of all the patents in an implant subclass are defined aspolymer-based; and in column 2, polymer implant is defined based on manual matching. Robust standard errors clustered at thesubclass level (in parentheses). * p < 0.10, ** p < 0.05, *** p < 0.01.
We conduct a similar exercise for FDA device applications. To the best extent we can, we manually
match the device names in the list provided to the congressional hearing with FDA device names. Our
approach classifies about 70 percent of the implant product codes as using polymer. Similar to column 1,
column 2 of Table A9 compares polymer-based implants to non-polymer-based implants using the FDA
data. The coefficient also shows that polymer-based implant devices are (marginally) more negatively af-
fected. Overall, the empirical evidence presented above is consistent with the idea that the relative decline
in innovation is greater for medical implants that rely more substantially on polymers.
As we explain above, the classification is subject to substantial measurement error because detailed in-
formation indicating which devices or patents do not rely on polymers is not readily available. In addition,
as we discuss in Section 2, input disruptions were not exclusively restricted to polymeric materials. Paul
Citron (1994), a vice president at Medtronic at the time, stated that “while the impact has been greatest for
implanted polymeric and elastomeric materials, it has not been restricted to them. The adverse experience
with product liability has caused suppliers of essentially all components used in implants to assess their will-
ingness to supply. For example, certain well-established manufacturers of integrated circuits have refused
to supply their chips for implanted devices.” Because of these issues, we do not want to over-rely on this
specific heterogeneous effect but, rather, on the collective set of results discussed in Section 7.2 as evidence
for our proposed mechanism.
16