when teachers choose pension plans: the florida...
TRANSCRIPT

When Teachers Choose Pension Plans: The Florida Story
Matthew M. Chingos
Brown Center on Education Policy
Brookings Institution
Martin R. West
Harvard Graduate School of Education
February 2013
1
Contents
Foreword and Summary…………………………………...………………………
Acknowledgments………………………………………………………………..
1. Introduction and Overview……………………………..………………………
2. Pension Reform in Florida………………………………..…………………….
2.1 Creating the DC Option……………………………………………………………..
2.2 Plan Comparison…………………………………………………………………….
3. Data…………………………………………………………………..…………
4. Teacher Pension Plan Choices……………………………………..…………...
4.1 What Share of New Teachers Chose the DC Plan?........................................
4.2 Which New Teachers Chose the DC Plan?.....................................................
4.3 Did DC Choosers Leave Florida Public Schools Sooner?..............................
5. Discussion………………………………………………………………………..
Tables…..…………………………………………………………………………...
Endnotes……………………………………………………………………………
2
7
8
12
13
15
22
23
23
24
27
29
32
39
2
When Teachers Choose Pension Plans: The Florida Story
Foreword and Summary
By Chester E. Finn, Jr. and Amber M. Winkler
Recent headlines show how the arcane issue of teacher pensions has turned into an emotional
battleground:
“Don’t demonize teachers because of pension system’s faults”
October 21, 2012, LA Times
“Schools brace for teacher retirements after pension reform”
January 27, 2013, Canton Repository
“Pension reform could hit oldest retired teachers the hardest”
February 3, 2013, Chicago Tribune
“Cuomo Pension Plan Sparks Fight With New York Unions”
March 14, 2012, Huffington Post1
Why such fervor? Such anguish? In an era of budgetary belt tightening, and in the wake of the
2008 market crash, state and local policymakers are finally awakening to the impact of teacher-
pension costs on their bottom lines. Recent reports demonstrate that such pension programs
across the United States are burdened by almost $390 billion in unfunded liabilities. Yet most
states and municipalities have been taking the road of least resistance, tinkering around the edges
rather than tackling systemic (but painful) pension reform.2
Many have suggested that one solution to the pension crisis is to offer teachers the option of a
401(k)-style plan (also known as a “defined contribution” or DC plan) in lieu of a traditional
pension (known as “defined benefit” or DB plans). We see much merit in that approach, but we
also wondered whether this alternative would appeal to teachers. Would certain types of
teachers—new, veteran, more educated, etc.—naturally gravitate to one type of retirement plan
or the other? Might it be the case that more (or less) effective teachers or teachers in harder-to-
staff subjects would prefer DC plans due to their portability or other advantages (real or
perceived)? If so, this would suggest that offering alternatives to traditional DB pensions could
3
be a useful tool for improving teacher quality and/or supply. If the opposite is true, this could
raise concerns about moving away from traditional DB systems.
To investigate these possibilities, we turned to Professor Martin West of the Harvard Graduate
School of Education, who is also an executive editor of Education Next and deputy director of
Harvard’s Program on Education Policy and Governance (PEPG). West tapped his colleague
Matthew Chingos, now a fellow at the Brookings Institution’s Brown Center on Education
Policy. This dynamic duo advised us that Florida was uniquely positioned to address our
questions, it being one of just two states that allow teachers to choose between DB and DC plans,
and the only place, at least for now, that can link information about teachers’ pension-plan
decisions with administrative data on those same teachers and their students (including value-
added achievement data).
With help from PEPG’s excellent Florida contacts, Marty and Matt obtained the relevant datasets
and set out to answer the following questions:
How many of Florida’s new teachers chose the DC plan (between 2003–2009)?
Are there differences in which teachers choose defined-contribution versus defined-
benefit plans in terms of experience, degree, demographics, subject area, etc.?
Is there a relationship between teacher effectiveness and choice of pension plans? Do
more (or less) effective teachers tend to favor one version over the other?
What’s the relationship between plan choice and teacher retention? Do DC choosers tend
to exit the classroom faster?
The analysis yielded four key findings.
First, a nontrivial fraction—a quarter to a third of new Florida teachers—opted for the DC
plan despite the fact that the DB plan was the default. (Whether they'd have gone to work in
Florida schools without that pension option is unknowable.) Advocates for traditional pensions
like to report that public employees are “strongly opposed” to switching to DC plans.3 Perhaps
that’s true for some parts of the public sector, or some parts of the nation—but, as these data
4
clearly indicate, not all. Teachers need pension options that honor their varied preferences. As
with clothing and automobiles, one size of retirement plan cannot fit all.
Second, teachers with more career options—notably individuals with advanced degrees or
math and science specialties—are more apt to favor the DC plan. This stands to reason,
considering that such people typically have more non-teaching employment opportunities.
They're probably more mobile geographically, too. This implies that a state (or district) with a
DC option may fare better in recruiting such teachers—both the better-educated kind and those
who specialize in hard-to-staff subjects. (Today, however, thirty-seven states and the District of
Columbia offer teachers only defined-benefit pension plans.) It’s also possible—though here
we’re really speculating—that math and science teachers may have more confidence in their
analytic skills and abilities to manage a DC investment account.
Charter school teachers also tend to favor the DC option. They may feel as if teaching is not a
long-term career for them (at least not in Florida) or may anticipate teaching in another Florida
charter school—most of which do not participate in the Florida Retirement System.4 On the other
hand, minority teachers (both black and Hispanic) tend to favor DB plans. (Analysts cite
evidence that black teachers tend to be more risk averse than white.)5
Third, the analysts found only a weak relationship between teachers’ value added (to
student achievement) and their choice of pension plans, with teachers in the bottom 25
percent slightly less likely to choose the DC option. And they found no difference in the
relationship between teacher effectiveness and attrition for the DB and DC groups. According to
West and Chingos, this implies that 1) offering a DC option is unlikely to produce major changes
in classroom effectiveness and/or 2) states might offer teachers less costly retirement benefits
without fear of undermining teacher quality. All of this leads to the question: Should states and
districts give their new teachers a choice between more pay now in the form of salary or more
pay later in the form of retirement benefits? (We recognize that pension costs borne by the state
or district will rise if many new teachers choose more pay now.)
Fourth, many short-timers are using the DC option to leave with something rather than
nothing (a smart choice!); others are leaving empty-handed. The study finds large differences
in attrition between DB and DC choosers—with the latter considerably more apt to leave in the
5
first six years. (Our analysis cannot explain whether these teachers are more likely to leave
because they are in a DC plan or they chose the DC plan because they thought they might exit
the classroom.)
The analysis shows clearly that it’s simply irrational—in any “vesting” situation—for teachers
who expect to be short-timers to opt for DB pension plans. During the time of this study, Florida
teachers vested at six years, meaning that any rational person who expected to teach for less than
six years would choose the DC plan; to do otherwise was to leave money on the table.6 Of the
87.8 percent of teachers in 2002–03 who chose DB plans, however, 40 percent left the Florida
system prior to their sixth year of teaching—which means they’ll receive no pension benefits
whatsoever unless they return to the system at a later date.7 For DB teachers who left at five
years, this forfeiture amounts to roughly three-quarters of a year’s salary. That’s undeniably
good for the solvency of the pension fund but bad for the affected teachers.
On the other hand, the longer a teacher expects to remain in public school teaching, the greater
the likelihood that the traditional DB plan will yield a larger payoff. Using a 5 percent interest
rate and 3 percent discount rate, Messrs. West and Chingos estimate that the net present value of
a teacher’s guaranteed lifetime benefit after six years of service would exceed that of her DC
account.8
Given these alternate financial trajectories for new and seasoned teachers, it bears repeating that
states should offer teachers a choice of retirement plan. Even beyond that, however, they should
assist teachers in making good decisions. Florida appears to have tried to supply its new teachers
with relevant information—promotional materials for the DC plan, for instance, say it is
designed primarily “to serve shorter-service and mobile employees.” Yet Florida could do more.
One straightforward suggestion would be to eliminate the default option and force teachers to
make a choice when they enroll—which may give rise to better decision making.
This case study adds to the mounting pile of evidence showing that it’s not impossible to reform
teacher pensions. Florida joins a host of other prudent states such Indiana, Rhode Island, and
Virginia that are attempting to link the structures and contribution levels of their pension
programs to fiscal realities.

6
Yet few such reforms are as far-reaching as they should be. Florida’s most recent changes, such
as raising vesting from six to eight years and tweaking the cost-of-living adjustment, while
fiscally helpful, don’t begin to solve the underlying problem. That’s true almost everywhere.
Most states have taken the path of least resistance in reforming pensions. In its recent report on
teacher pension systems, The National Council on Teacher Quality concluded,9
By reducing cost of living increases, raising retirement eligibility age, increasing teacher
contributions and fiddling with benefit formulas, states are tinkering with systems at
teacher expense while avoiding reform that would actually put states, districts, teachers
and taxpayers on firmer ground. In some cases, these changes are necessary corrections
for past over-promising, but these small adjustments are no replacement for systemic
reform, and they have a real impact on teachers’ wallets.
“Systemic reform” is precisely what U.S. public-sector pensions need and what most states and
municipalities have been avoiding. Affording new teachers the opportunity to select their own
pension plan is only a beginning—and not necessarily a money saver. But it’s also a way to
tackle another of the nation’s painful public-policy challenges: attracting people into our
classrooms who will teach our children well in all the subjects those youngsters need to learn,
while shaping their own careers in ways that offer them the kinds of options that other
professionals enjoy in twenty-first-century America.
Acknowledgments
Generous support for this project came from the Laura and John Arnold Foundation and the
Joyce Foundation, as well as from our sister organization, the Thomas B. Fordham Foundation.
We also appreciatively acknowledge the continuing interest of the Searle Freedom Trust in
Fordham's ongoing efforts to identify workable ways to “stretch the school dollar.”
We also thank the individuals who made this research possible. First and foremost, we are
grateful to analysts Martin West, assistant professor of education at the Harvard Graduate School
of Education, and Matthew Chingos, fellow at the Brookings Institution’s Brown Center on
Education Policy. We are also appreciative of the administrative support provided by the
Program on Education Policy and Governance at Harvard University (PEPG) and their help in
7
obtaining data from the Florida Retirement System (FRS), as well as to the FRS and Florida
Department of Education for supplying the needed data. Thanks also to these individuals for
helpful comments on earlier drafts: Robert Costrell, Paul Peterson, Cory Koedel, Josh McGee,
Michael Podgursky, Daniel Goldhaber, and Cyrus Grout.
On the Fordham side, special thanks to Michael Petrilli, Fordham’s executive vice president,
who provided feedback on drafts. Daniela Fairchild kept our funders adequately informed of
progress, Matthew Richmond oversaw production, Michelle Gininger and Joe Portnoy managed
dissemination, and Pamela Tatz served as copy editor.
An extended version of the paper is available as a working paper at
http://www.hks.harvard.edu/pepg/research.htm.
8
1. Introduction and Overview
Although long ignored by education-policy analysts, the structure of teacher retirement benefits
has come under increasing scrutiny in recent years. The vast majority of teachers, like other state
and local public employees, are covered by traditional defined-benefit (DB) pension plans.10, 11
Now rare in the private sector of the United States economy, these plans provide a retired teacher
with a guaranteed lifetime benefit, the annual value of which is typically based on his number of
years of service and average salary during the final years of his career. A teacher is often
required to contribute from her salary to funds set aside to pay for this plan, but the size of her
benefit is not tied to the amount of any contributions.
Critics of existing teacher pension systems raise two broad sets of concerns. First, they note that
the time lag between when the government funds and pays out retirement benefits encourages
politicians to contribute too little to their pension systems, effectively borrowing from future
taxpayers to fund current spending on government services.12
The shortfalls facing state and
local pension systems covering teachers and other public workers due to persistent underfunding
are staggering. Novy-Marx and Rauh13
estimate that achieving full funding of promised pension
liabilities nationally over thirty years would require a tax increase of $1,385 per household each
year. A more likely outcome is substantial cuts to public services such as education.
Second, critics note that the reliance on traditional DB pension plans makes total teacher
compensation severely back-loaded, potentially hindering efforts to improve teacher quality.
Most of these plans have vesting periods of five or more years and are structured so that
employees do not amass substantial benefits until late in their careers—at which point benefits
increase rapidly. These features may make teaching less attractive to individuals who are
uncertain of whether they will remain in the profession long enough to benefit or would prefer to
receive a higher salary to support present consumption. Recent evidence confirms that DB
pension plans lead some veteran teachers to continue teaching solely for the sake of increasing
pension wealth, while encouraging others to retire prematurely so as not to sacrifice years of
benefit payments.14, 15
The back-loading of benefits also imposes heavy costs on career-switchers
and geographically mobile teachers, who typically stand to receive benefits worth far less than
the pension contributions made on their behalf.16
9
The most prominent alternative to a traditional DB pension plan is the defined contribution (DC)
model. Under DC plans, an employee builds up an individual retirement account through her or
her employer’s regular contributions throughout her career and exercises some control over how
the account is invested. Because the value of that account is tied directly to these contributions
(and the performance of investments), DC plans, by definition, cannot be underfunded. Rapid
vesting, portability, and the smooth accrual of benefits over time eliminate the problematic end-
of-career incentives created by existing DB plans and could make teaching more attractive to
young workers, possible career-switchers, or those likely to be geographically mobile. Finally,
because benefits take the form of a personal account that can be converted into a lifetime
annuity, the employee gains control over the timing and structure of her retirement benefit.
An important potential drawback of the DC model is that employees, rather than taxpayers, bear
the consequences if disappointing investment returns or poor withdrawal decisions yield
inadequate retirement savings.17
Unions representing teachers and other public employees have
vigorously opposed proposals to convert public pension plans to the DC model, largely on these
grounds. Proponents of DB pensions cite survey data suggesting that public employees strongly
prefer the DB model and contend that “when given the choice between a primary DB or DC
plan, public employees overwhelmingly choose the DB pension plan.”18
Yet there is reason to believe that many current and potential teachers could find well-designed
DC plans as or more attractive than traditional DB plans. As noted above, DB plans typically
provide minimal benefits to those who do not remain in the profession (and in the same state
retirement system) for many years. They may therefore be unappealing to a younger generation
of workers prone to exploring multiple career paths before settling on one. Other teachers may
simply prefer to exercise greater control over their retirement savings, either due to confidence in
their investment abilities or to doubts as to whether public pension funds will be able to deliver
on their promises. Consistent with this logic, a survey of Washington State teachers found that a
plurality of teachers would prefer to invest additional retirement savings in a DC plan rather than
in a DB plan.19
The extent to which preferences expressed on surveys correspond to the actual
behavior of teachers when given the option remains unclear.
10
In this paper, we examine teacher preferences as revealed by their decisions when empowered to
choose between alternative pension-plan structures. Since 2002, public school teachers (and most
other state and local employees) in Florida have been permitted to choose between a traditional
DB retirement plan and a new DC plan. During the time period of our study, school districts
were required to contribute 9 percent of the salary of teachers taking the DC option to personal
investment accounts in their names. Neither DB nor DC choosers were required to contribute
from their own salaries to the retirement system, meaning that teachers’ plan choice did not alter
their take-home pay. The benefits of teachers choosing the DC plan vested after just one year, as
compared with six under the DB plan.
We exploit this policy environment—and a unique database linking information from the state’s
Education Data Warehouse and retirement system—to address the following questions:
1. What share of new teachers in Florida public schools between 2003 and 2009 chose
the DC plan?
2. Are certain groups of teachers, defined in terms of demographic characteristics,
education level, and subject area, more likely to choose the DC plan?
3. Among math and reading teachers in grades 4–8 (for whom it is possible to generate
value-added performance measures) are DC choosers more or less effective in raising
student achievement?
4. Are DC choosers more likely to leave the Florida public schools early in their careers,
as should be the case if new teachers are making choices that maximize their pension
wealth?
The Florida policy provides a unique opportunity to study new teachers’ revealed preferences
over alternative pension-plan structures, yet it is not without limitations. Most importantly,
teachers who did not make an active decision within six months of their hire date were
automatically enrolled in the traditional DB plan. The choice of the default option has been
shown to have a dramatic effect on many aspects of individuals’ retirement behavior20
and
appears to be particularly consequential for the choice between DB and DC pension plans. Goda
11
and Manchester,21
for example, show that setting DC rather than DB as the default option for
employees at a large private firm increased DC participation rates by as much as 60 percentage
points. As a result, the share of Florida teachers choosing the DC plan likely understates what
would be observed had the default option been reversed.
Nonetheless, our data reveal considerable demand for DC plans among new teachers entering
Florida public schools between the 2003–04 and 2008–09 school years.22
Thirty percent of new
teachers during this period selected the DC option, with the share steadily rising prior to the
financial market turmoil in 2008. This pattern casts doubt on recent assertions that there is
negligible interest in DC plans among teachers and public-sector employees more generally.23
We also find that the extent of demand for the DC pension option varies across teacher groups.
The share of teachers choosing the DC plan is higher among teachers with master’s and doctoral
degrees, math and science teachers, and teachers in charter schools that participate in the Florida
retirement system. It is lower among special-education teachers, and it is especially low among
black and Hispanic teachers, who are roughly 13 percentage points less likely than white
teachers to choose the DC option. The markedly lower shares of minority teachers choosing the
DC option cannot be explained by differences in early-career attrition rates across racial groups,
but rather appears to reflect differences in preferences with respect to risk.
We find only a slight relationship between pension-plan choice and teacher value-added to
student achievement, with teachers in the bottom value-added quartile roughly 2 percentage
points less likely to select the DC option. The lack of a strong relationship between plan
preferences and classroom effectiveness may suggest that states could modify the structure of
their pension plans without reducing the caliber of new teachers attracted into the system.
Finally, we find that teachers selecting the DC option are 13 percentage points more likely to
leave employment in Florida public schools within six years of entering the system. This is
consistent with the fact that the DC plan, due to rapid vesting, should be more attractive to
teachers uncertain about whether they will remain in the system for an extended period of time
and suggests that some teachers are able to exploit the options available to them to maximize
12
their pension wealth. At the same time, we find that a considerable number of teachers selecting
the DB option leave before their benefits vest. Assuming they do not later return to the system,
they will receive no retirement benefit whatsoever.
The remainder of the paper is organized as follows: Section two provides an overview of teacher
pension policy nationally and in Florida and compares the plan options available to new Florida
teachers during our study period. Section three describes our data, while section four presents our
results concerning plan choice and the relationship between plan choice and attrition. We
conclude by discussing the implications of the Florida experience for ongoing debates over
teacher pension reform.
2. Pension Reform in Florida
The structure of retirement benefits in the private and public sectors of the U.S. economy has
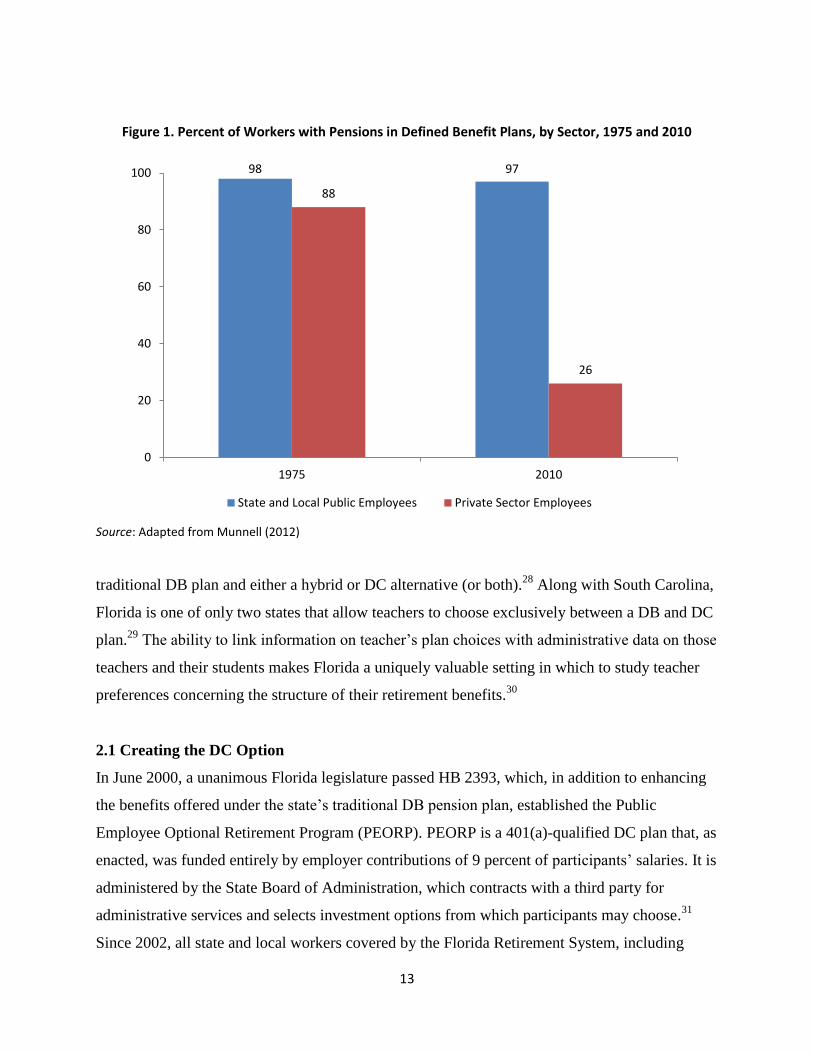
diverged sharply since the 1970s. Figure 1 shows that as of 1975, virtually all private, state, and
local public-sector workers with retirement benefits were covered by a DB plan. By 2010, DB
coverage rates for state and local government workers remained at 97 percent but had fallen to
26 percent in the private sector.24
Beshears et al.25
attribute the decline in DB pension coverage
in the private sector to multiple factors, including “increased regulatory costs for DB providers
following the passage of the Employee Retirement Income Security Act (ERISA) in 1974, the
legislated creation of an attractive (to employers) alternative to the DB pension through section
401(k) of the Internal Revenue Code in 1978, and workers’ interest in portable pension benefits
as the labor force has become more mobile.”
While the overwhelming majority of statewide retirement systems in which teachers participate
continue to use the traditional DB model, in recent years, a handful of states have created various
alternatives.26, 27
Alaska is the lone state to have a mandatory DC pension system for teachers,
having closed its DB plan to new public employees in 2006. Five states have adopted “hybrid
plans” for new teachers that supplement a less generous DB plan with a small personal savings
account. Another five states (including Florida) currently offer new teachers a choice between a
13
traditional DB plan and either a hybrid or DC alternative (or both).28
Along with South Carolina,
Florida is one of only two states that allow teachers to choose exclusively between a DB and DC
plan.29
The ability to link information on teacher’s plan choices with administrative data on those
teachers and their students makes Florida a uniquely valuable setting in which to study teacher
preferences concerning the structure of their retirement benefits.30
2.1 Creating the DC Option
In June 2000, a unanimous Florida legislature passed HB 2393, which, in addition to enhancing
the benefits offered under the state’s traditional DB pension plan, established the Public
Employee Optional Retirement Program (PEORP). PEORP is a 401(a)-qualified DC plan that, as
enacted, was funded entirely by employer contributions of 9 percent of participants’ salaries. It is
administered by the State Board of Administration, which contracts with a third party for
administrative services and selects investment options from which participants may choose.31
Since 2002, all state and local workers covered by the Florida Retirement System, including
Figure 1. Percent of Workers with Pensions in Defined Benefit Plans, by Sector, 1975 and 2010
Source: Adapted from Munnell (2012)
98 97
88
26
0
20
40
60
80
100
1975 2010
State and Local Public Employees Private Sector Employees
14
teachers and other school-district employees, have been permitted to choose between PEORP
and the traditional DB plan. Employees who neglect to make an active choice by the last
business day of the fifth month after their month of hire are then assigned to the DB plan.
Having made their initial plan choices (or defaulted into the DB plan), employees are permitted
to switch between plans once while still working in the Florida system. However, the pricing
scheme offered to potential switchers makes it relatively expensive to move from the DC plan to
the DB plan. DB choosers are eligible to receive the net present value of the future benefits they
have accumulated by that time under the DB plan as the starting balance for a DC investment
account. Conversely, employees who initially chose DC must use the funds in their DC
investment account and, if necessary, their own resources to “buy” into the DB plan; they are
then charged the Actuarial Accrued Liability (or total cost) of their accumulated FRS Pension
Plan benefit. As we show below, very few new teachers in Florida hired since 2002 have
exercised their right to switch plans, and virtually all who have done so have switched from the
DB to the DC plan.
The enactment of HB 2393 was facilitated by the strength of U.S. equity markets during the late-
1990s technology boom. Soaring stock prices led many public employees to believe that they
were missing out and would be better off with personal retirement accounts like those of their
private-sector peers. Moreover, the Florida Retirement System in 1999 enjoyed an actuarial
surplus of approximately $9.2B on $68.6B in liabilities. This surplus seemed to justify the law’s
enhancements of the traditional DB plan, which included shortening the vesting period from ten
to six years, expanding the classes of eligible employees, and temporarily reducing the required
employer contribution.32
Despite these enhancements, the statutorily defined employer-
contribution rates for DB plan participants remained below the 9 percent contribution used to
fund DC participants’ investment accounts through 2009.
The primary purpose of creating the DC option was therefore not to put the Florida Retirement
System on sounder financial footing but rather to help the state compete for employees who
would prefer alternative retirement plan options. The per-employee costs of the DB plan were
actually expected to rise to the extent that short-term employees took advantage of the DC
15
option, as their employers would no longer make contributions to the pension fund on their
behalf. Yet the educational materials the state provides to new hires emphasize that the DC plan
is “primarily designed to serve shorter-service and mobile employees” and remind them that “the
average employee works for the FRS for 5 to 10 years.”33
And a uniform employer-contribution-
rate structure ensures that all school districts and other local governments in Florida contribute
the same share of their total payrolls to the retirement system, regardless of their own employees’
choices.34
The actuarial surpluses the Florida Retirement System experienced in the 1990s proved fleeting.
In particular, the financial crisis of 2008 and the subsequent economic downturn led Florida, like
many other states, to modify its pension system in 2011 to reduce overall costs. The legislature
reduced contributions to DC investment accounts from 9 percent of salary to 6.3 percent, 3
percent of which now comes from mandatory employee contributions. It simultaneously
introduced a 3 percent employee contribution for DB plan participants, raised the vesting period
for its DB plan from six to eight years, extended the time period used to calculate final average
salaries from five to eight years, and eliminated the 3 percent annual cost-of-living adjustment
for DB plan benefits not yet accrued. These modifications to the DB plan, which were recently
upheld by the Florida Supreme Court, have placed the Florida Retirement System on sounder
financial footing but have done so primarily by reducing the generosity of benefits for new
employees. We ignore these recent changes when examining teachers’ pension-plan choices
during our analysis period, which ends with the 2008–09 school year.
2.2 Plan Comparison
Whether new teachers entering Florida public schools between 2002 and 2011 seeking to
maximize their retirement benefits should have chosen the DC or DB options depended on a
number of factors, including their age upon entry, expected teaching-career length, life
expectancy, expected investment return, valuation of future vs. current benefits, and their
uncertainty about many of these factors (as well as their attitudes toward that uncertainty).
Consequently, a precise calculation of pension benefits under the two plans for any given teacher
is impractical if not impossible.
16
Instead, we construct a simplified model of pension benefits under each plan for a “typical
teacher.” Our typical teacher begins teaching at age thirty-two and is therefore eligible for
normal retirement at age sixty-two.35
We choose age thirty-two as the starting age in part for
convenience (as Florida teachers vested in the DB plan become eligible for normal retirement at
age sixty-two or after thirty years of service), but it also corresponds roughly to the average age
of 32.6 among the new teachers in our data. We calculate this teacher’s pension wealth based on
the following factors: age upon leaving teaching in the Florida public schools (which we call
“age of separation”), the rate of return earned on investments in the DC plan, and the teacher’s
discount rate (a measure of how much they prefer a dollar today as compared to a dollar next
year).
We use the salary schedule for the 2009–10 school year from state’s largest school district, Dade
County Public Schools (Miami), although we obtain similar results if we use salaries averaged
across a large number of Florida districts from which we were able to obtain salary schedules.
We assume that the teacher is paid at the bachelor’s-degree rate in her first six years and at the
master’s degree rate thereafter. We also assume that the teacher completes at least one full year
of teaching, making her eligible to receive the contributions made on her behalf to the DC plan.
The rates of return we use are real rates that are on top of inflation (we also assume that the
salary schedule is indexed to inflation), so that all dollar values are in current terms.
Given uncertainty about the appropriate rate of return and discount rate, we perform this
simulation using multiple values for these parameters. We select 5 percent as a default rate of
return but also consider the implications of using 2 and 8 percent. The degree to which
individuals value deferred compensation, such as a retirement benefit, is determined by their
personal discount rate, which varies across individuals. The retirement-planning literature
typically recommends that future benefits be discounted at roughly 3 percent, yet behavioral
economists find that in practice, individuals often discount the future at substantially higher
rates.36
We therefore use discount rates of 3 and 7 percent.37

17
We repeat these calculations for both the DB and DC plans and then calculate the difference in
the total pension wealth that a teacher would have accumulated for each potential age of
separation. For the DC plan, we assume monthly contributions (one-twelfth of 9 percent of the
teacher’s annual salary) that begin accruing interest immediately. After the teacher leaves the
teaching profession, the contributions to the retirement account cease but interest continues to
accrue. For each possible age of separation, we calculate the value of the account at age sixty-
two. In other words, we assume that the teacher does not draw down the account until age sixty-
two, setting aside the fact that individuals can access the funds in their retirement account before
that time (although withdrawals prior to age 59.5 are ordinarily penalized).
Figure 2a. Net Present Value of DB and DC Retirement Benefits at Age 62, by career length and assumed interest rate on DC investment, discount rate = 0.03
$182,967
$291,546
$485,787
$707,904
$0
$100,000
$200,000
$300,000
$400,000
$500,000
$600,000
$700,000
$800,000
1 2 3 4 5 6 7 8 9 10 11 12 13 14 15 16 17 18 19 20 21 22 23 24 25 26 27 28 29 30
Pe
nsi
on
We
alth
(
ne
t p
rese
nt
valu
e a
t ag
e 6
2)
Years of Consecutive Service Prior to Separation (start age = 32)
DC account balance at age 62 (RR=0.02) DC account balance at age 62 (RR=0.05)
DC account balance at age 62 (RR=0.08) DB benefits stream starting at age 62
18
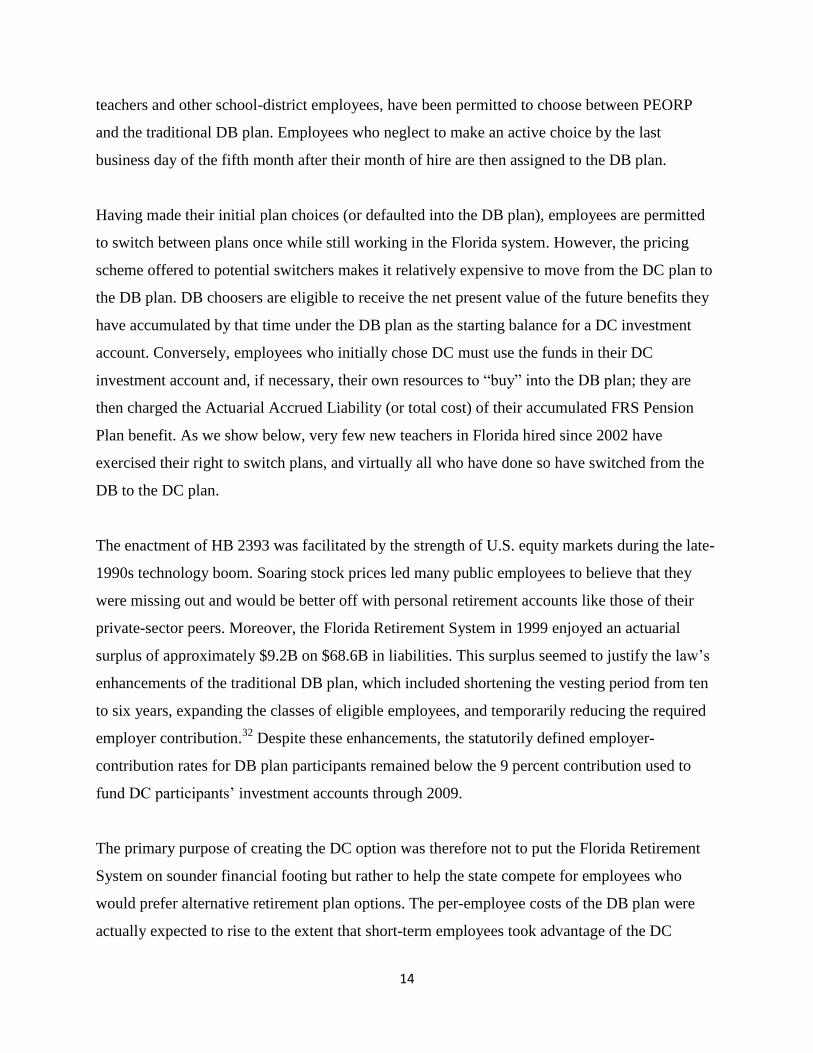
Figure 2b. Net Present Value of DB and DC Retirement Benefits at Age 62, by career length and assumed interest rate on DC investment, discount rate = 0.07
Note: RR = assumed rate of return on DC investments. Figures 2a and 2b show how the net present value of our typical teacher’s pension wealth (evaluated at age 62) grows under each plan with the length of time she works in the Florida public schools assuming discount rates of 3 and 7 percent, respectively. Depending on the discount rate, the NPV of the DB benefit for a teacher who teaches 30 years ranges from $454,604 to $707,904. The value of the DC benefit received by that same teacher hinges instead on the return received on her investments over the course of her career: It would be worth $485,787 assuming an 8 percent rate of return, as compared with less than $182,967 at 2 percent.
The DB plan provides no benefits if the teacher leaves before the end of her sixth year, so its
value is $0 for the first five years of service. Once the plan has vested after six years of teaching,
the annual benefit, paid beginning at age sixty-two until death (which we assume, based on
national mortality tables, occurs twenty-four years later), is equal to a percentage of the teacher’s
average salary over the last five years of her career.38
That percentage is equal to 1.6 times the
number of years they were employed in the Florida Retirement System. For example, a teacher
who taught for twenty years would receive an annual benefit of 20 x 1.6 = 32 percent of her final
$182,967
$291,546
$485,787
$454,604
$0
$100,000
$200,000
$300,000
$400,000
$500,000
$600,000
1 2 3 4 5 6 7 8 9 10 11 12 13 14 15 16 17 18 19 20 21 22 23 24 25 26 27 28 29 30
Pe
nsi
on
We
alth
(
ne
t p
rese
nt
valu
e a
t ag
e 6
2)
Years of Consecutive Service Prior to Separation (start age = 32)
DC account balance at age 62 (RR=0.02) DC account balance at age 62 (RR=0.05)
DC account balance at age 62 (RR=0.08) DB benefits stream starting at age 62
19
average salary. We calculate the net present value (NPV) of this stream of payments, which are
paid monthly, at age sixty-two. Because teachers during the period we study were promised a 3
percent annual cost-of-living adjustment to their benefits after retirement, we subtract 3 percent
from the discount rate used to calculate this NPV.39
Figures 2a and 2b (pages 17–18) present the NPV at age sixty-two of our typical teacher’s
pension wealth under each plan using discount rates of 3 and 7 percent, respectively. The choice
of discount rate alters the value of the stream of payments the teacher will receive under the DB
plan but does not influence the value of the DC benefit, which can be taken as a lump-sum
payment at that time. Depending on the discount rate, the NPV of the DB benefit for a teacher
who taught thirty years ranges from $454,604 to $707,904. The value of the DC benefit received
by that same teacher hinges instead on the return received on her investments over the course of
her career: It would be worth $485,787 assuming an 8 percent rate of return, as compared with
less than $200,000 at 2 percent.
Having made these calculations, it is straightforward to compare the NPV of benefits under both
the DB and DC plans for a given age of separation, rate of return, and discount rate. In making
these comparisons, we take the additional step of discounting the value of the benefits to age
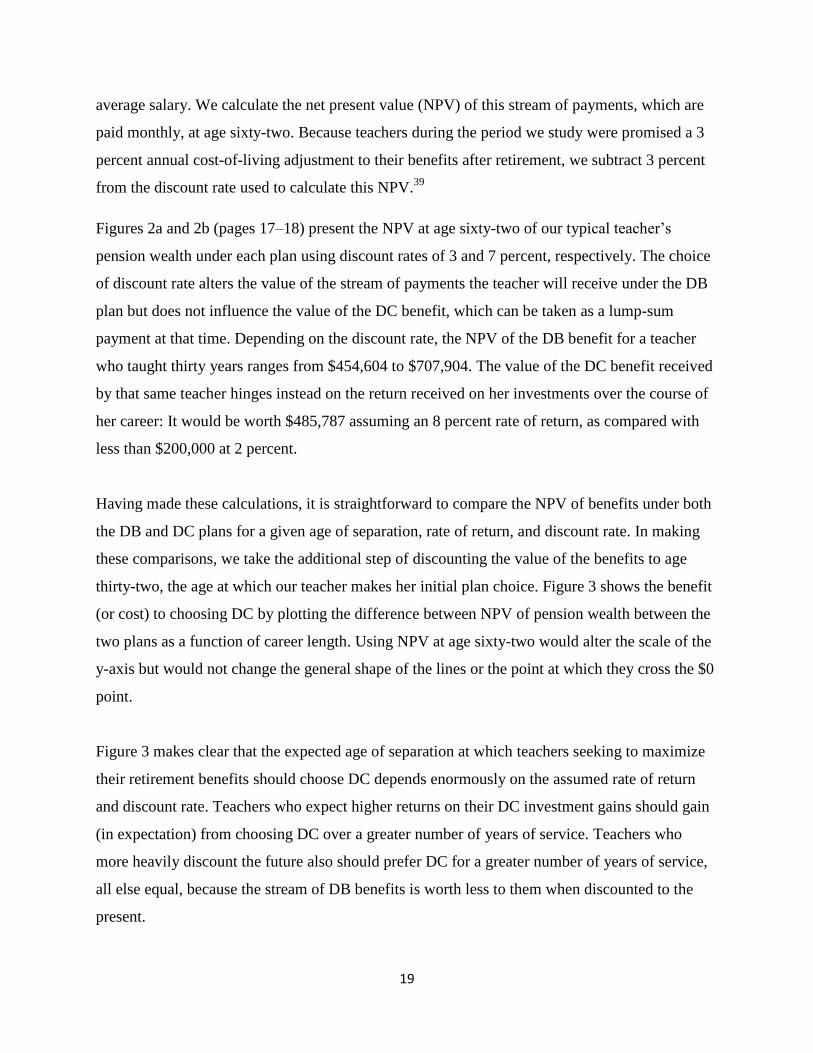
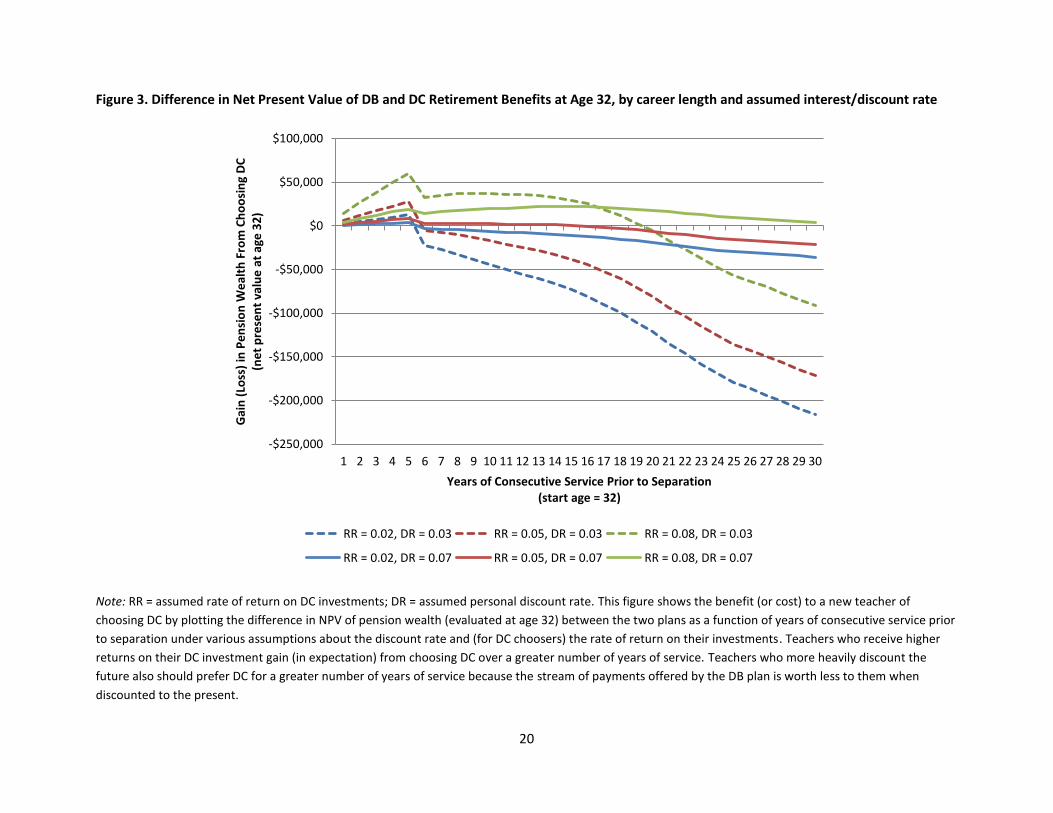
thirty-two, the age at which our teacher makes her initial plan choice. Figure 3 shows the benefit
(or cost) to choosing DC by plotting the difference between NPV of pension wealth between the
two plans as a function of career length. Using NPV at age sixty-two would alter the scale of the
y-axis but would not change the general shape of the lines or the point at which they cross the $0
point.
Figure 3 makes clear that the expected age of separation at which teachers seeking to maximize
their retirement benefits should choose DC depends enormously on the assumed rate of return
and discount rate. Teachers who expect higher returns on their DC investment gains should gain
(in expectation) from choosing DC over a greater number of years of service. Teachers who
more heavily discount the future also should prefer DC for a greater number of years of service,
all else equal, because the stream of DB benefits is worth less to them when discounted to the
present.
20
Figure 3. Difference in Net Present Value of DB and DC Retirement Benefits at Age 32, by career length and assumed interest/discount rate
Note: RR = assumed rate of return on DC investments; DR = assumed personal discount rate. This figure shows the benefit (or cost) to a new teacher of
choosing DC by plotting the difference in NPV of pension wealth (evaluated at age 32) between the two plans as a function of years of consecutive service prior
to separation under various assumptions about the discount rate and (for DC choosers) the rate of return on their investments. Teachers who receive higher
returns on their DC investment gain (in expectation) from choosing DC over a greater number of years of service. Teachers who more heavily discount the
future also should prefer DC for a greater number of years of service because the stream of payments offered by the DB plan is worth less to them when
discounted to the present.
-$250,000
-$200,000
-$150,000
-$100,000
-$50,000
$0
$50,000
$100,000
1 2 3 4 5 6 7 8 9 10 11 12 13 14 15 16 17 18 19 20 21 22 23 24 25 26 27 28 29 30
Gai
n (
Loss
) in
Pe
nsi
on
We
alth
Fro
m C
ho
osi
ng
DC
(n
et
pre
sen
t va
lue
at
age
32
)
Years of Consecutive Service Prior to Separation (start age = 32)
RR = 0.02, DR = 0.03 RR = 0.05, DR = 0.03 RR = 0.08, DR = 0.03
RR = 0.02, DR = 0.07 RR = 0.05, DR = 0.07 RR = 0.08, DR = 0.07
21
Although the exact expected age of separation at which a teacher should choose one type of plan
over the other depends on assumed rates that are uncertain, two key findings emerge from this
analysis. First, any teacher who expects to teach for less than six years should choose DC. To do
otherwise is to leave money on the table because the DB plan does not vest until after six years.
A teacher who remains in the profession for five years before separating receives nothing if they
chose the DB plan but would have amassed a portable retirement savings account with a net
present value of $27,784 had she chosen DC (assuming a 5 percent rate of return on DC
contributions and 3 percent discount rate). This difference amounts to roughly 72 percent of her
starting salary.
Second, the longer a teacher expects to spend in the classroom, the more likely she should be to
choose DB. Again using a 5 percent rate of return and 3 percent discount rate, any teacher
confident of vesting in the system should take the DB option, as the net present value of her
guaranteed lifetime benefit after just six years of service would exceed that of her DC account.
For teachers remaining in the profession for substantially longer periods of time, the financial
implications of their plan choices can be substantial. The pension wealth of a teacher remaining
in the system for the full thirty years before retiring at age sixty-two is $171,534 greater under
the DB than the DC plan. Using a higher discount rate of 7 percent delays the point at which the
DB plan dominates the DC plan until sixteen years; it also reduces the magnitude of the
differences in net present value between the two plans.
This points to a final, more general observation: the enormous sensitivity of the magnitude of the
difference in the NPV of pension wealth accumulated under the two plans when evaluated by
teachers at age thirty-two to the assumed discount rate. Regardless of the performance of the
teacher’s DC investment account (within the broad range we consider), the gap between the
value of benefits expected from the DB and DC plan is no larger than $35,684 for teachers with a
discount rate of 0.07 percent—as compared to $216,267 for teachers with a discount rate of 0.03
percent. Put differently, to the extent that potential teachers discount the future heavily, even
quite substantial differences in expected pension benefits may exert limited influence on their
early-career decisions.
22
3. Data
Our empirical analysis exploits two linked statewide administrative databases: the Education
Data Warehouse (EDW) maintained by the Florida Department of Education and plan-selection
records maintained by the Florida Retirement System (FRS). This linkage was accomplished by
a collaboration between the relevant agencies, who then provided us with anonymous data that
could be linked to a dataset we obtained from EDW using a random teacher identifier.
The EDW data extract we use in this paper contains a rich set of information on teachers and
their students and covers the 2000–01 through 2008–09 school years. We primarily make use of
the data on public school employees, which include an employment file identifying the jobs they
held in each year; demographic characteristics such as race/ethnicity, gender, and date of birth;
educational attainment; and teaching experience. We also make use of data identifying the
courses taught by each teacher and the students enrolled in them to identify the teacher’s subject
area. Finally, for the purpose of calculating teacher value-added to student achievement, we
make use of data on students’ test scores and demographic characteristics. The FRS data
indicate, for each public employee, the date they entered FRS, the date of each pension election,
and the plan they chose (most employees only make one election, but a handful later decide to
switch).
We limit our analysis to new teachers, who we define as follows: First, we separate teachers
from other public school employees using the job assignments in the employment file and
exclude teachers in charter schools not participating in FRS.40
We also drop the 3 percent of
teachers who could not be matched to the FRS data and an additional 12 percent who were
matched but do not have any pension elections listed in the FRS data.41
We then identify new
teachers as those working during the school year of their first pension-plan election with an FRS
entry date either during that same school year or the prior school year.42
Finally, we exclude
teachers identified as working in more than one district or working in both a charter school and a
traditional public school (in the same district) during the election year.
This procedure identifies a total of 91,899 new teachers across the 2002–03 to 2008–09 school
years. As discussed below, during most of the analysis, we exclude the 15,786 teachers who
23
made their initial election during the first school year that a choice was available (2002–03). For
our analysis of attrition from teaching in Florida public schools, we also exclude the 6,714
teachers in the final cohort (2008–09) because we cannot observe whether or not they remained
after their first year.
We construct a single value-added measure for each math and reading teacher who could be
linked to students in grades 4–8 that combines value-added estimates from all available years,
grades, tests, and subjects. During our analysis period, Florida administered both the Florida
Comprehensive Achievement Test and the Stanford Achievement Test in math and reading in
these grades. In a given year, a teacher in a self-contained elementary classroom could therefore
have up to four separate value-added estimates. Value-added estimates are available for 26
percent of the new teachers included in our analysis. The methods used to construct these value-
added estimates and average them across subjects, tests, and years are described in detail in a
previous publication.43
4. Teacher Pension Plan Choices
4.1 What Share of New Teachers Chose the DC Plan?
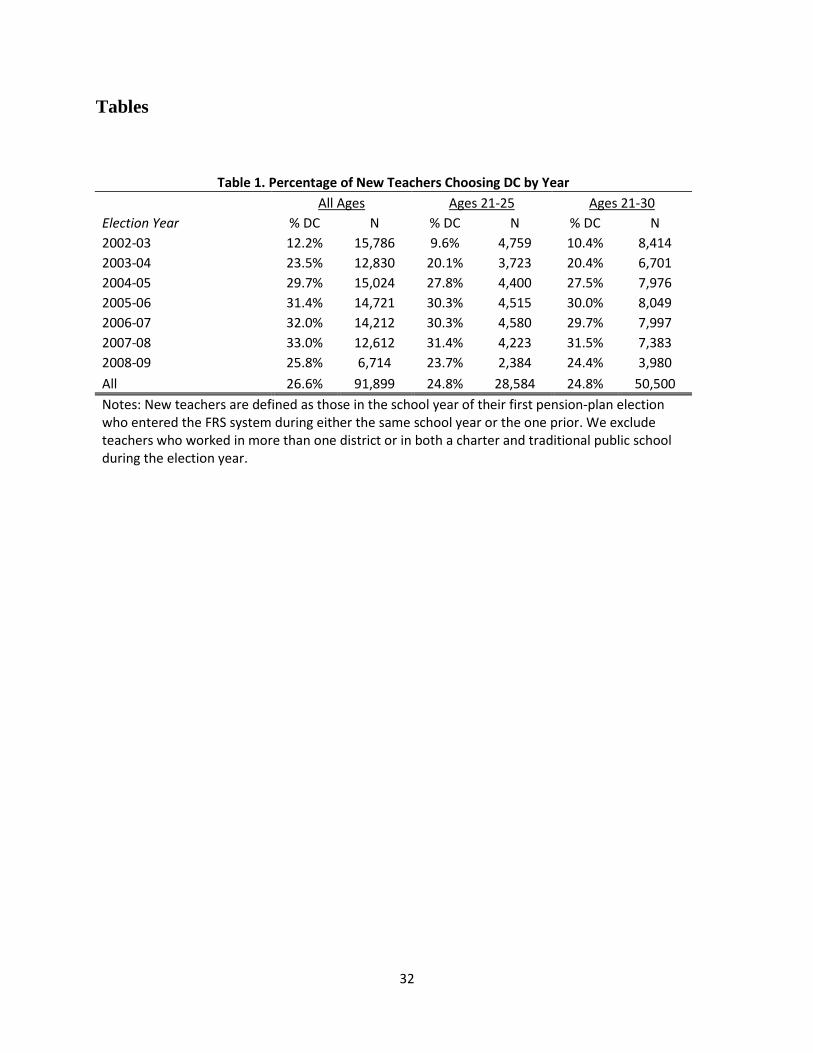
During all but the first year the DC plan was available, roughly one-quarter to one-third of new
teachers chose the DC option. Table 1 shows that the share of new teachers choosing DC was
quite small the first year the policy was in place (2002–03), possibly due to a lack of available
information as the plan was rolled out. It grew steadily over the following years, reaching nearly
one-third of new teachers in 2007–08, before declining modestly in 2008–09 (when teachers’
decisions were likely influenced by the collapse of the financial markets).
The average new teacher in our dataset is almost thirty-three years old (the median age is 28.4),
so many of the new teachers we study are not necessarily recent college graduates in their first
job. However, Table 1 confirms that younger new teachers, defined as either age twenty-one
through twenty-five or twenty-one through thirty, chose DC at rates similar to all of the new
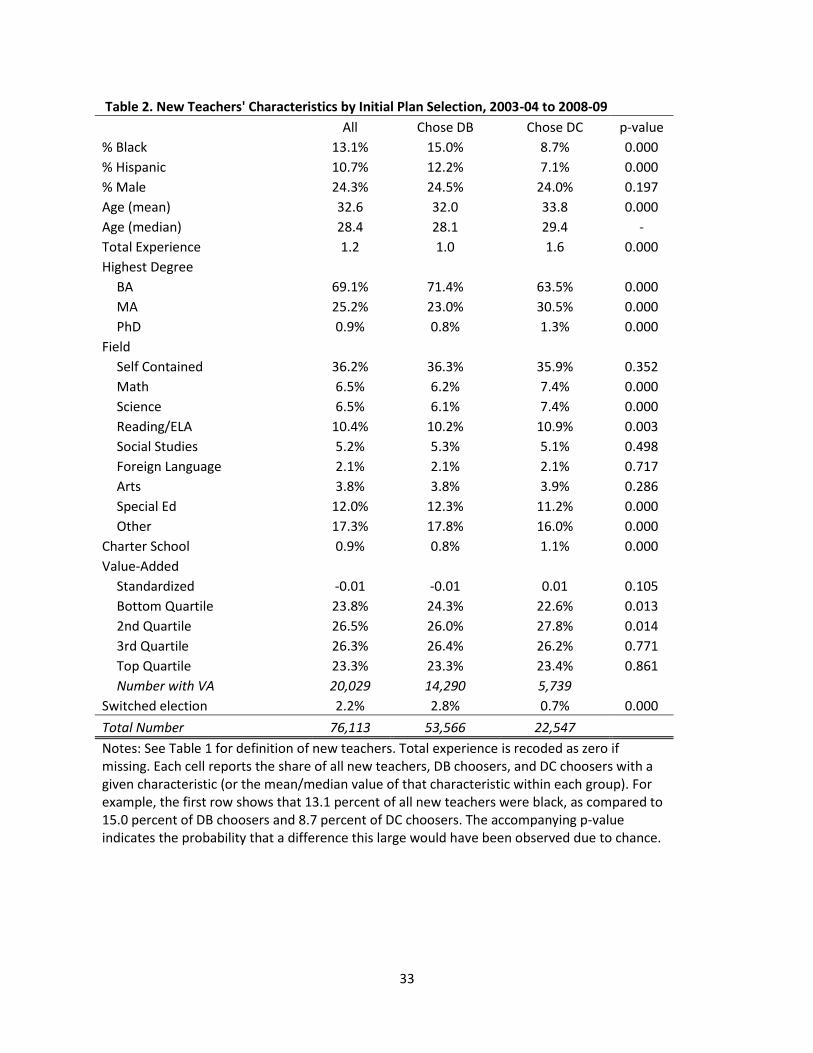
teachers in our data. The penultimate row of Table 2 shows that only a very small share of
teachers switch their initial plan election during the period that we observe them. Among
teachers who initially chose DB, 2.8 percent later switch, as compared to 0.7 percent of teachers
24
who first chose DC. The fact that more teachers switch from DB to DC than the reverse is likely
a reflection of the imbalanced pricing scheme discussed above.
The overall share of new teachers selecting the DC plan after the first year was 29.6 percent. We
regard the share of teachers choosing DC as quite large given that the DB plan was the default.
As noted previously, the choice of the default option has been shown to have a dramatic effect on
the plan choice of private-sector workers. It is therefore likely that the DB choosers in our data
consist of a mix of teachers who have clear preferences for the traditional plan and others who
were ambivalent and swayed by the default. Although we do not have information on the share
of Florida teachers making active plan choices, Olleman and Boivie (Table 4, Appendix A)44
report that fewer than half of all new employees in the Florida Retirement System in fiscal year
2011 made an active plan choice and that a majority of those doing so chose the DC plan.
Because the share of teachers choosing a DC over a DB plan is likely to be sensitive to which (if
either) plan is designated as the default, we focus our interpretation primarily on differences in
the observed demand for the DC option among teacher groups defined by demographic
characteristics, education levels, subject area, and (for a subset of teachers) value-added to
student achievement. In the remainder of our analysis, we exclude data from the first year of DC
availability because that year is an outlier in terms of the share of teachers choosing DC, likely
because the option was so new.
4.2 Which New Teachers Chose the DC Plan?
We use three approaches to examine the relationship between teacher characteristics and
pension-plan choice. First, we compare the average characteristics of teachers who chose DB to
their colleagues who chose DC in Table 2. Second, we report the percentage of teachers in
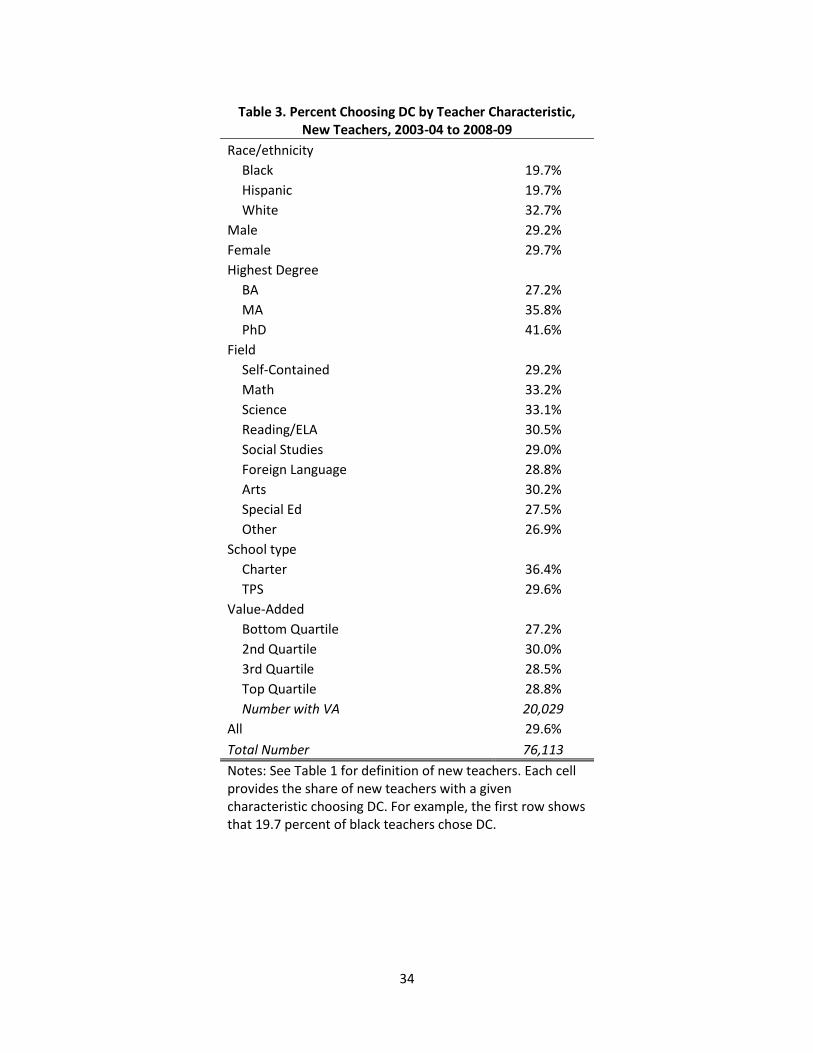
various subgroups (defined by the same characteristics) who chose DC in Table 3. Finally, we
run regressions that model DC plan choice as a function of these characteristics and report the
results in Table 4.
The results in Table 2 and 3 represent two different ways of thinking about the same relationship.
For example, these results indicate that black and Hispanic teachers are much less likely to

25
choose DC than are white teachers. In Table 2, this is shown by the fact that DB teachers are 15
percent black and 12 percent Hispanic, whereas DC teachers are 9 percent black and 7 percent
Hispanic. In Table 3, the relationship is even more apparent, with 20 percent of black and
Hispanic teachers choosing DC as compared to 33 percent of white teachers.
A number of other patterns are evident in Tables 2 and 3. Math and science teachers are more
likely to choose DC than are other teachers, suggesting stronger demand for DC options among
teachers in these hard-to-staff subjects. Thirty-three percent of math and science teachers chose
DC, as compared to 29-31 percent of teachers in self-contained classrooms, reading/ELA,
foreign language, and the arts. This pattern could be driven by the fact that teachers with strong
math and science skills tend to have better employment options outside of education and may
therefore have greater uncertainty about the length of their teaching careers. Special-education
teachers, another hard-to-staff position but one which draws on skills that are more sector-
specific, are somewhat less likely to select DC (28 percent).
New teachers with a master’s degree (in any field) are considerably more likely to choose DC
than those with a bachelor’s, by a margin of 36 to 27 percent. The 1 percent of new teachers with
doctoral degrees are even more likely to choose DC, with 42 percent doing so. This, again, could
reflect that new teachers with these credentials have more employment opportunities and are less
certain that they will remain in the classroom long enough for their DB benefits to vest.
Charter school teachers (in charter schools participating in FRS) are substantially more likely to
select DC, with 36 percent selecting that option, compared to 30 percent in traditional public
schools. This may reflect an expectation among charter school teachers that they are less likely to
stay in the public school system than other teachers. Or these teachers may select DC if they
expect to teach in another Florida charter school, many of which do not participate in FRS.
For the 26 percent of teachers for whom we can construct value-added measures (i.e., self-
contained, reading, and math teachers in grades 4–8), there is little overall relationship between
estimated value-added to student achievement and DC plan choice. However, there is suggestive
evidence that teachers in the bottom quartile of effectiveness are somewhat less likely to select
26
DC, with 27 percent of the least effective teachers choosing DC compared to 29–30 percent of
teachers in the top three quartiles.
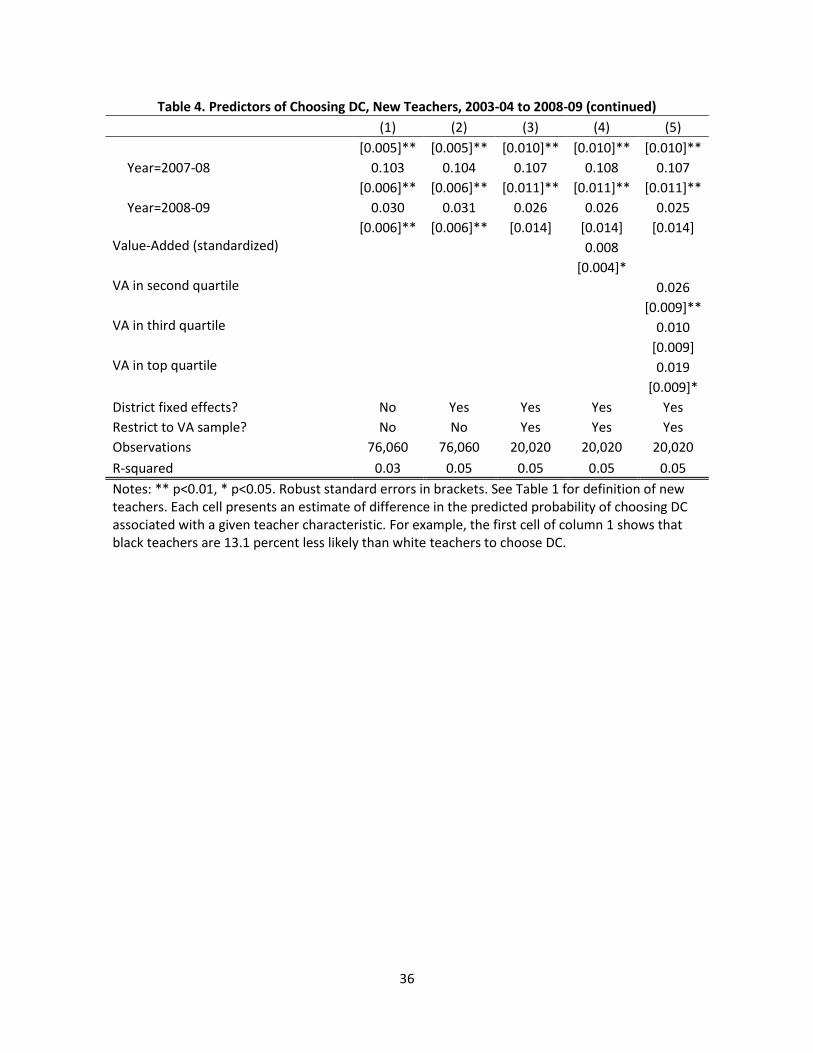
The patterns in Tables 2 and 3 are confirmed by the regression analyses reported in Table 4,
which indicate the relationship between teacher characteristics and plan choice, holding the other
characteristics constant. Each of the models presented also includes indicators for the plan-
election year in order to control for any trends in plan choice that are correlated with trends in the
characteristics of new teachers.45
Column 1 of Table 4 shows that, all else equal, black and
Hispanic teachers are 13 percentage points less likely to choose DC than comparable white
teachers. Teachers with master’s degrees are 8 percentage points more likely to choose DC than
those with bachelor’s degrees. The results for charter schools and by subject area are also
consistent with the patterns in the raw data, and the coefficients on the year dummies indicate
that the increase in demand for DC through 2007–08 was not driven by changes in teacher
characteristics (nor was the drop in demand in 2008–09). Column 2 of Table 4 adds district fixed
effects to account for the possible influence of local labor market conditions on plan choice, a
change to the specification that has little impact on the results.
These results confirm that the rate at which new Florida teachers choose the DC plan varies
systematically with their characteristics, with minority teachers in particular being less likely to
do so. This pattern could in theory stem from differences in the length of time teachers expected
to be employed in state retirement system, as the DC plan should be particularly attractive to
teachers who expect to leave the system before their DB plans vest. Although we lack data on
teachers’ expectations about their career length, we do observe whether they remained employed
by the Florida public schools during our study period. In a supplemental analysis, we therefore
replicated the models in column 2 while controlling for the number of years they remained
employed over the period we observe them. The addition of this variable did not change any of
model’s coefficients by a statistically significant amount, including those indicating large
differences in pension-plan choice across racial and ethnic groups. We interpret this as
suggestive evidence that differences in DC election rates are not driven by differences in
expected career length but instead reflect underlying differences in preferences about pension-
plan structures.46
27
We conduct a parallel analysis of the subsample of teachers for whom we can construct value-
added measures in column 3 of Table 4. These results show that the patterns evident in columns
1 and 2 are similar for the value-added subsample, although of course the estimates are less
precise due to the sharply reduced sample size. Columns 4 and 5 include measures of value-
added in the model and confirm that there is not a strong relationship between teacher
effectiveness and plan choice. Column 4, however, does indicate that a one standard deviation
increase in teacher value-added is associated with an increase of roughly 1 percentage point in
the probability of choosing the DC plan. The results in Column 5 show that this relationship is
driven primarily by teachers with value-added measures in the bottom quartile being 1–3
percentage points less likely to choose DC plans than teachers in any other quartile.
4.3 Did DC Choosers Leave Florida Public Schools Sooner?
Our comparison of expected pension wealth under Florida’s DB and DC pension plans showed
that which plan a new teacher should choose depends on a number of factors, many of which are
uncertain. However, two facts are clear: 1) The longer a teacher expects to remain in the Florida
public schools, the greater the likelihood that DB will yield a larger payoff than DC, and 2) any
teacher who expects to teach less than six years should definitely choose DC. A new teacher is
unlikely to know with certainty how long she will remain in the state’s public school system, so
we may not expect to find a stark contrast between plan choice and retention. But if teachers are
making rational decisions based on the information available to them upon making their initial
selection, we should find some relationship.
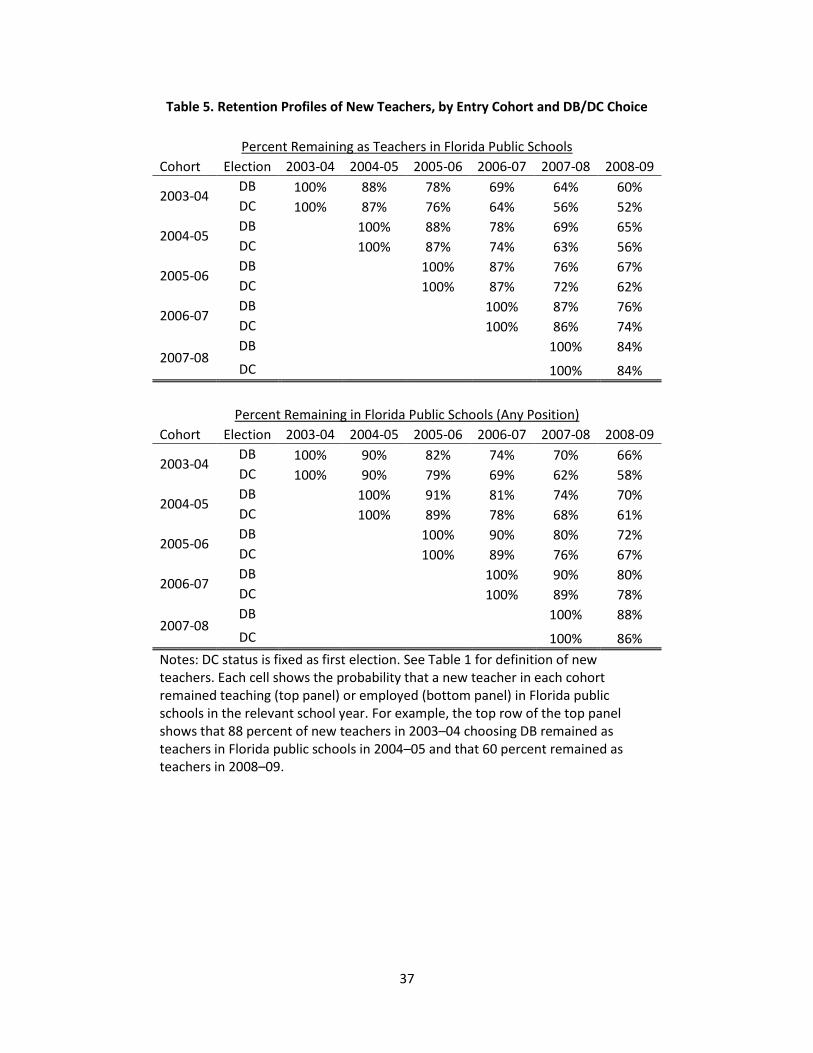
We address this issue by examining the attrition patterns of new teachers by plan choice. The top
panel of Table 5 reports the share of teachers remaining as teachers in the Florida public schools
by plan choice and entry cohort (excluding the last cohort because it is only observed in its first
year). For each cohort, we observe differences in attrition that begin in the second year and grow
over time, with DB teachers more likely to remain as teachers than DC teachers (as we would
expect). For example, in the first cohort we examine, DB teachers were 1 percentage point more
likely to remain as teachers in the second year, a difference that grew steadily to 8 percentage
points in the sixth year. Put differently, teachers choosing the DC plan in this cohort were almost
20 percent more likely than DB teachers to leave teaching before their sixth year. The bottom
28
panel of Table 5 repeats this analysis using the percent of teachers remaining as employees of the
Florida public schools in any position, since a teacher does not have to remain in the classroom
to continue to participate in FRS. We find the same pattern of results as we did in the analysis
that looked at teacher positions only.
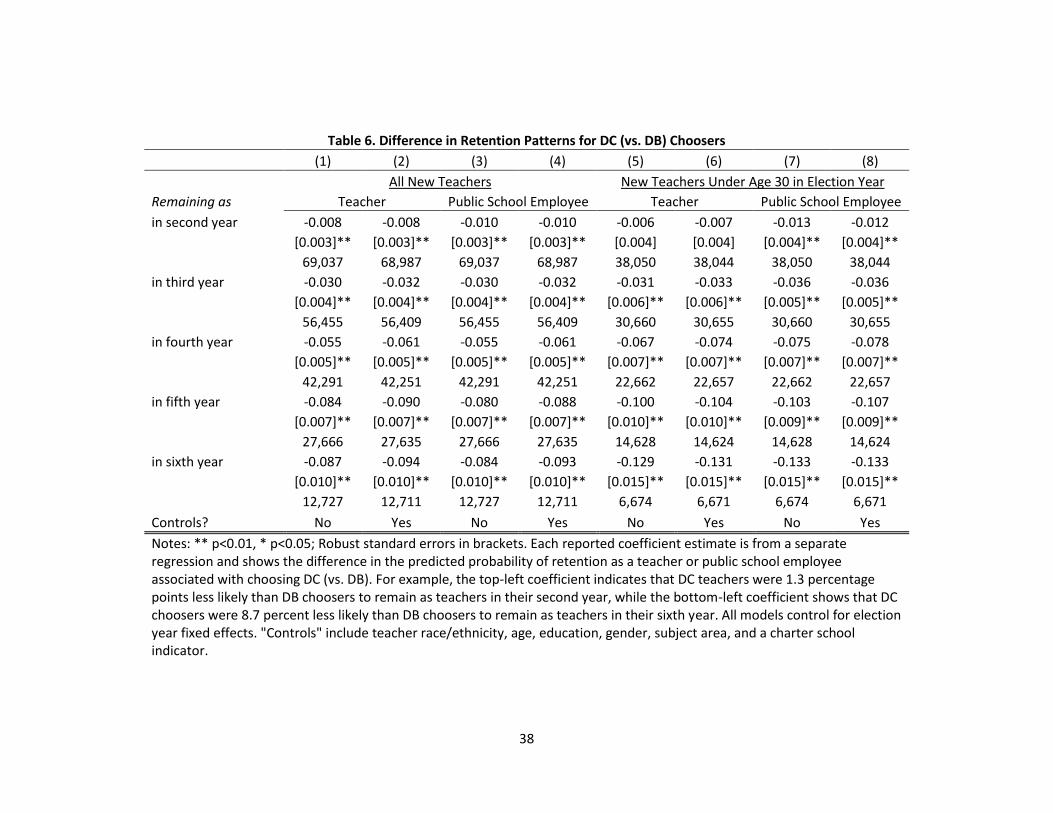
We formalize our attrition analysis using linear probability models and data pooled across all
cohorts (note that the sample size for each year declines as a result of fewer cohorts being
included).47
The results, reported in Table 6, show the same pattern as the raw data: Teachers
who chose DC are less likely to remain as teachers, with a difference that grows from 1
percentage point in the second year to 9 percentage points in the sixth year. These results are
robust to controlling for teacher characteristics and are similar to results that include non-
teaching positions in the public schools.
Columns 5–8 of Table 6 replicate the attrition regressions for teachers who were less than thirty
years old during the election year. The pattern of results is broadly similar to the results for all
teachers, but the magnitudes of the difference in attrition rates between DC and DB teachers are
consistently larger. For example, in their sixth year, DC teachers are 13 percentage points less
likely to remain in the classroom (or in the public schools in any capacity) than DB teachers.
This may indicate that there are more young new teachers who are confident that they will only
teach for a short period of time and are able to select their pension plan accordingly.
On the whole, these results suggest that some new teachers in Florida are making choices that
maximize their total compensation. At the same time, a substantial share of teachers choosing
DB nonetheless leave Florida public schools before their benefits vest, potentially leaving
substantial money on the table. The 40 percent of DB teachers in the 2002–03 cohort of new
teachers who left Florida public schools prior to their sixth year will receive no pension benefit
whatsoever unless they return to the system later in their careers. For teachers who chose the DB
plan yet left Florida public schools after five years (immediately before vesting), this amounts to
giving up nearly three-quarters of a year’s salary that would be invested in a personal retirement
account had they taken the DC option.
29
5. Discussion
Over the past four years, forty states have taken steps to address funding shortfalls in the
traditional DB pension systems in which their teachers participate.48, 49
Among other changes,
twenty-two states reduced or eliminated cost-of-living adjustments for benefit payments, twenty-
five raised their retirement age, twenty-seven increased the amounts teachers are required to
contribute to the pension fund from their salaries, and fully forty raised employer contribution
rates. While these changes have improved funding levels, they highlight the extent to which
existing pension commitments are placing downward pressure on the compensation packages
offered to new teachers and that they have done nothing to address the lack of flexibility and
portability typical of existing DB pension plans.
Our evidence from Florida casts doubt on the common assertion that virtually all teachers would
oppose more fundamental changes to the structure of their retirement benefits. We find that there
is considerable demand for a DC pension plan offered as an alternative to a traditional DB
pension plan, with as many as three in ten new teachers taking advantage of this option. This is
the case despite the fact that the DB plan remains the default for teachers not making an active
choice and that the DC plan, funded during our analysis period by a 9 percent employer
contribution, does not appear to be overly generous. Our calculations indicate that under most
plausible assumptions concerning the rate of return on DC investments, Florida’s traditional DB
plan would have provided greater pension wealth to virtually any teacher remaining long enough
for her benefits to vest. While we can only speculate as to how many teachers would have chosen
a more generous DC plan, it is important to emphasize that comparisons of preferences over DB
and DC systems need to take into account their relative cost.
Is offering a DC pension plan a promising strategy to recruit and retain more effective teachers?
Our data do not allow us to address this issue definitively. We find little relationship between
teachers’ value-added to student achievement and their plan choice, perhaps suggesting that
classroom effectiveness is unrelated to pension preferences. Although we cannot rule out the
possibility that the DB plan’s vesting requirement reduces early-career attrition, the differences
in retention rates we document between teachers in the DB and DC plans are likely due to

30
selection, as we would expect teachers who are less certain about whether they will remain in the
system long enough for their DB benefits to vest to choose the DC plan.50
On one hand, these patterns suggest that offering teachers a DC option is unlikely to yield major
changes in classroom effectiveness. On the other, they may imply that states could offer teachers
less costly retirement benefits without fear of undermining teacher quality—and perhaps use the
savings to increase starting salaries in an attempt to improve it. Indeed, the most relevant policy
question may not be whether teacher pension plans should have a DB or a DC structure but
rather how much of teachers’ total compensation should be deferred. Exploiting a situation in
which Illinois teachers were allowed to purchase pension-benefit enhancements at a fraction of
their actuarial value, Fitzpatrick51
provides compelling evidence that many teachers would prefer
that far less of their compensation be deferred. In other words, many current and potential
teachers would likely welcome compensation packages with less generous retirement benefits
and higher salaries.
State policymakers currently face the question of whether to continue to offer DB plans, perhaps
redesigned so as to mitigate the funding, portability, and incentive problems plaguing many
existing plans, or to enact more fundamental reforms such as a shift to the DC model. The
broader DB versus DC debate is beyond the scope of this paper, but our analysis does raise the
question of whether it is desirable to offer employees a choice between DB and DC plans.
Providing this choice could increase teacher satisfaction (for a given level of total compensation)
by allowing them to pick the option they prefer. At the same time, if teachers tend to pick the
option that maximizes their pension wealth, then these choices will increase the pension costs
borne by the state—and for many teachers, may represent an inefficient allocation between
current and deferred compensation.
Our paper cannot offer comprehensive guidance on this complicated set of policy issues. But the
data from Florida make clear that teachers are not a monolithic group in terms of their
preferences for different types of pension plans and strongly suggest that the rigidities of
traditional DB plans are unsuitable for many public employees. Policymakers concerned about
the quality of the teaching workforce will need to enact reforms to their pension systems that

31
take into account the widely varying characteristics and preferences of the individuals entering
this noble profession.
32
Tables
Table 1. Percentage of New Teachers Choosing DC by Year
All Ages Ages 21-25 Ages 21-30
Election Year % DC N % DC N % DC N
2002-03 12.2% 15,786 9.6% 4,759 10.4% 8,414
2003-04 23.5% 12,830 20.1% 3,723 20.4% 6,701
2004-05 29.7% 15,024 27.8% 4,400 27.5% 7,976
2005-06 31.4% 14,721 30.3% 4,515 30.0% 8,049
2006-07 32.0% 14,212 30.3% 4,580 29.7% 7,997
2007-08 33.0% 12,612 31.4% 4,223 31.5% 7,383
2008-09 25.8% 6,714 23.7% 2,384 24.4% 3,980
All 26.6% 91,899 24.8% 28,584 24.8% 50,500
Notes: New teachers are defined as those in the school year of their first pension-plan election who entered the FRS system during either the same school year or the one prior. We exclude teachers who worked in more than one district or in both a charter and traditional public school during the election year.
33
Table 2. New Teachers' Characteristics by Initial Plan Selection, 2003-04 to 2008-09
All Chose DB Chose DC p-value
% Black 13.1% 15.0% 8.7% 0.000
% Hispanic 10.7% 12.2% 7.1% 0.000
% Male 24.3% 24.5% 24.0% 0.197
Age (mean) 32.6 32.0 33.8 0.000
Age (median) 28.4 28.1 29.4 -
Total Experience 1.2 1.0 1.6 0.000
Highest Degree BA 69.1% 71.4% 63.5% 0.000
MA 25.2% 23.0% 30.5% 0.000
PhD 0.9% 0.8% 1.3% 0.000
Field Self Contained 36.2% 36.3% 35.9% 0.352
Math 6.5% 6.2% 7.4% 0.000
Science 6.5% 6.1% 7.4% 0.000
Reading/ELA 10.4% 10.2% 10.9% 0.003
Social Studies 5.2% 5.3% 5.1% 0.498
Foreign Language 2.1% 2.1% 2.1% 0.717
Arts 3.8% 3.8% 3.9% 0.286
Special Ed 12.0% 12.3% 11.2% 0.000
Other 17.3% 17.8% 16.0% 0.000
Charter School 0.9% 0.8% 1.1% 0.000
Value-Added Standardized -0.01 -0.01 0.01 0.105
Bottom Quartile 23.8% 24.3% 22.6% 0.013
2nd Quartile 26.5% 26.0% 27.8% 0.014
3rd Quartile 26.3% 26.4% 26.2% 0.771
Top Quartile 23.3% 23.3% 23.4% 0.861
Number with VA 20,029 14,290 5,739 Switched election 2.2% 2.8% 0.7% 0.000
Total Number 76,113 53,566 22,547
Notes: See Table 1 for definition of new teachers. Total experience is recoded as zero if missing. Each cell reports the share of all new teachers, DB choosers, and DC choosers with a given characteristic (or the mean/median value of that characteristic within each group). For example, the first row shows that 13.1 percent of all new teachers were black, as compared to 15.0 percent of DB choosers and 8.7 percent of DC choosers. The accompanying p-value indicates the probability that a difference this large would have been observed due to chance.
34
Table 3. Percent Choosing DC by Teacher Characteristic, New Teachers, 2003-04 to 2008-09
Race/ethnicity Black 19.7%
Hispanic 19.7%
White 32.7%
Male 29.2%
Female 29.7%
Highest Degree BA 27.2%
MA 35.8%
PhD 41.6%
Field Self-Contained 29.2%
Math 33.2%
Science 33.1%
Reading/ELA 30.5%
Social Studies 29.0%
Foreign Language 28.8%
Arts 30.2%
Special Ed 27.5%
Other 26.9%
School type Charter 36.4%
TPS 29.6%
Value-Added Bottom Quartile 27.2%
2nd Quartile 30.0%
3rd Quartile 28.5%
Top Quartile 28.8%
Number with VA 20,029
All 29.6%
Total Number 76,113
Notes: See Table 1 for definition of new teachers. Each cell provides the share of new teachers with a given characteristic choosing DC. For example, the first row shows that 19.7 percent of black teachers chose DC.

35
Table 4. Predictors of Choosing DC, New Teachers, 2003-04 to 2008-09
(1) (2) (3) (4) (5)
Race/ethnicity (vs. white) Black -0.131 -0.121 -0.115 -0.116 -0.115
[0.004]** [0.005]** [0.009]** [0.009]** [0.009]**
Hispanic -0.132 -0.112 -0.103 -0.103 -0.103
[0.005]** [0.006]** [0.011]** [0.011]** [0.011]**
Other race or msising -0.002 0.004 0.045 0.044 0.044
[0.013] [0.013] [0.026] [0.026] [0.026]
Male -0.015 -0.014 -0.010 -0.009 -0.009
[0.004]** [0.004]** [0.008] [0.008] [0.008]
Age 0.003 0.003 0.003 0.003 0.003
[0.000]** [0.000]** [0.000]** [0.000]** [0.000]**
Highest degree (vs. BA) MA degree 0.078 0.076 0.064 0.064 0.064
[0.004]** [0.004]** [0.007]** [0.007]** [0.007]**
Doctoral degree 0.108 0.106 0.109 0.109 0.110
[0.019]** [0.018]** [0.041]** [0.040]** [0.040]**
Subject area (vs. self-contained) Math 0.044 0.040 0.028 0.027 0.028
[0.007]** [0.007]** [0.011]* [0.011]* [0.011]*
Science 0.044 0.041 -0.038 -0.037 -0.037
[0.007]** [0.007]** [0.031] [0.031] [0.031]
Reading/ELA 0.012 0.009 0.008 0.008 0.008
[0.006]* [0.006] [0.010] [0.010] [0.010]
Social Studies -0.000 -0.006 -0.027 -0.027 -0.028
[0.008] [0.008] [0.030] [0.030] [0.030]
Foreign Language 0.021 0.018 -0.035 -0.035 -0.036
[0.012] [0.012] [0.051] [0.051] [0.051]
Arts 0.009 0.009 -0.117 -0.116 -0.115
[0.009] [0.009] [0.063] [0.063] [0.063]
Special Education -0.028 -0.026 -0.050 -0.048 -0.049
[0.005]** [0.005]** [0.010]** [0.010]** [0.010]**
Other subject -0.008 -0.003 -0.002 -0.002 -0.002
[0.005] [0.005] [0.012] [0.012] [0.012]
Charter school 0.054 0.069 0.076 0.077 0.077
[0.018]** [0.019]** [0.044] [0.044] [0.044]
Election year (vs. 2003-04) Year=2004-05 0.063 0.062 0.057 0.057 0.057
[0.005]** [0.005]** [0.009]** [0.009]** [0.009]**
Year=2005-06 0.083 0.083 0.072 0.072 0.072
[0.005]** [0.005]** [0.010]** [0.010]** [0.010]**
Year=2006-07 0.092 0.091 0.083 0.083 0.082
36
Table 4. Predictors of Choosing DC, New Teachers, 2003-04 to 2008-09 (continued)
(1) (2) (3) (4) (5)
[0.005]** [0.005]** [0.010]** [0.010]** [0.010]**
Year=2007-08 0.103 0.104 0.107 0.108 0.107
[0.006]** [0.006]** [0.011]** [0.011]** [0.011]**
Year=2008-09 0.030 0.031 0.026 0.026 0.025
[0.006]** [0.006]** [0.014] [0.014] [0.014]
Value-Added (standardized)
0.008
[0.004]*
VA in second quartile
0.026
[0.009]**
VA in third quartile
0.010
[0.009]
VA in top quartile
0.019
[0.009]*
District fixed effects? No Yes Yes Yes Yes
Restrict to VA sample? No No Yes Yes Yes
Observations 76,060 76,060 20,020 20,020 20,020
R-squared 0.03 0.05 0.05 0.05 0.05
Notes: ** p<0.01, * p<0.05. Robust standard errors in brackets. See Table 1 for definition of new teachers. Each cell presents an estimate of difference in the predicted probability of choosing DC associated with a given teacher characteristic. For example, the first cell of column 1 shows that black teachers are 13.1 percent less likely than white teachers to choose DC.
37
Table 5. Retention Profiles of New Teachers, by Entry Cohort and DB/DC Choice
Percent Remaining as Teachers in Florida Public Schools
Cohort Election 2003-04 2004-05 2005-06 2006-07 2007-08 2008-09
2003-04 DB 100% 88% 78% 69% 64% 60%
DC 100% 87% 76% 64% 56% 52%
2004-05 DB
100% 88% 78% 69% 65%
DC
100% 87% 74% 63% 56%
2005-06 DB
100% 87% 76% 67%
DC
100% 87% 72% 62%
2006-07 DB
100% 87% 76%
DC
100% 86% 74%
2007-08 DB
100% 84%
DC 100% 84%
Percent Remaining in Florida Public Schools (Any Position)
Cohort Election 2003-04 2004-05 2005-06 2006-07 2007-08 2008-09
2003-04 DB 100% 90% 82% 74% 70% 66%
DC 100% 90% 79% 69% 62% 58%
2004-05 DB
100% 91% 81% 74% 70%
DC
100% 89% 78% 68% 61%
2005-06 DB
100% 90% 80% 72%
DC
100% 89% 76% 67%
2006-07 DB
100% 90% 80%
DC
100% 89% 78%
2007-08 DB
100% 88%
DC 100% 86%
Notes: DC status is fixed as first election. See Table 1 for definition of new teachers. Each cell shows the probability that a new teacher in each cohort remained teaching (top panel) or employed (bottom panel) in Florida public schools in the relevant school year. For example, the top row of the top panel shows that 88 percent of new teachers in 2003–04 choosing DB remained as teachers in Florida public schools in 2004–05 and that 60 percent remained as teachers in 2008–09.
38
Table 6. Difference in Retention Patterns for DC (vs. DB) Choosers
(1) (2) (3) (4) (5) (6) (7) (8)
All New Teachers New Teachers Under Age 30 in Election Year
Remaining as Teacher Public School Employee Teacher Public School Employee
in second year -0.008 -0.008 -0.010 -0.010 -0.006 -0.007 -0.013 -0.012
[0.003]** [0.003]** [0.003]** [0.003]** [0.004] [0.004] [0.004]** [0.004]**
69,037 68,987 69,037 68,987 38,050 38,044 38,050 38,044
in third year -0.030 -0.032 -0.030 -0.032 -0.031 -0.033 -0.036 -0.036
[0.004]** [0.004]** [0.004]** [0.004]** [0.006]** [0.006]** [0.005]** [0.005]**
56,455 56,409 56,455 56,409 30,660 30,655 30,660 30,655
in fourth year -0.055 -0.061 -0.055 -0.061 -0.067 -0.074 -0.075 -0.078
[0.005]** [0.005]** [0.005]** [0.005]** [0.007]** [0.007]** [0.007]** [0.007]**
42,291 42,251 42,291 42,251 22,662 22,657 22,662 22,657
in fifth year -0.084 -0.090 -0.080 -0.088 -0.100 -0.104 -0.103 -0.107
[0.007]** [0.007]** [0.007]** [0.007]** [0.010]** [0.010]** [0.009]** [0.009]**
27,666 27,635 27,666 27,635 14,628 14,624 14,628 14,624
in sixth year -0.087 -0.094 -0.084 -0.093 -0.129 -0.131 -0.133 -0.133
[0.010]** [0.010]** [0.010]** [0.010]** [0.015]** [0.015]** [0.015]** [0.015]**
12,727 12,711 12,727 12,711 6,674 6,671 6,674 6,671
Controls? No Yes No Yes No Yes No Yes
Notes: ** p<0.01, * p<0.05; Robust standard errors in brackets. Each reported coefficient estimate is from a separate regression and shows the difference in the predicted probability of retention as a teacher or public school employee associated with choosing DC (vs. DB). For example, the top-left coefficient indicates that DC teachers were 1.3 percentage points less likely than DB choosers to remain as teachers in their second year, while the bottom-left coefficient shows that DC choosers were 8.7 percent less likely than DB choosers to remain as teachers in their sixth year. All models control for election year fixed effects. "Controls" include teacher race/ethnicity, age, education, gender, subject area, and a charter school indicator.
39
Endnotes
1 Steve Lopez, “Don’t demonize teachers because of pension system’s faults,” Los Angeles Times,
October 21, 2012, http://articles.latimes.com/2012/oct/21/local/la-me-1021-lopez-publicenemy-
20121021; Matthew Rink, “Schools brace for teacher retirements after pension reform,” Canton
Repository, January 27, 2013, http://www.cantonrep.com/news/x1922398609/Schools-brace-for-teacher-
retirements-after-pension-reform; Ray Long, “Pension reform could hit oldest retired teachers the
hardest,” Chicago Tribune, February 3, 2013, http://articles.chicagotribune.com/2013-02-03/news/ct-met-
teacher-pensions-20130203-204_1_pension-reform-pension-systems-state-pension-costs; and Dave
Jamieson, “Cuomo Pension Plan Sparks Fight With New York Unions,” Huffington Post, March 14,
2012, http://www.huffingtonpost.com/2012/03/14/cuomo-pension-plan-new-york-
unions_n_1345939.html.
2 Kathryn M. Doherty, Sandi Jacobs, and Trisha M. Madden, “No One Benefits: How teacher pension
systems are failing BOTH teachers and taxpayers” (Washington, D.C.: National Council on Teacher
Quality, 2012). Twenty-two states have simply changed their cost-of-living rules to be less generous.
3 Mark Olleman and Ilana Boivie, “Decisions, Decisions: Retirement Plan Choice for Public Employees
and Employers” (Washington, D.C.: National Institute for Retirement Security, 2011): p. 1.
4 Amanda Olberg and Michael J. Podgursky, “Charting a New Course to Retirement: How Charter
Schools Handle Teacher Pensions” (Washington, D.C.: Thomas B. Fordham Institute, 2011).
5 James Farrell, “Demographics of Risky Investing,” Research in Business and Economics Journal,
Special Edition (Florida Economic Symposium, 2011).
6 In 2011, the Florida legislature raised the vesting period for its DB plan from six to eight years, among
other changes.
7 On the other hand, 12.2 percent chose DC plans and 48 percent of this group had left by their sixth year.
8 Net present value is a calculation of the value today of a payment or stream of payments (like a pension)
that will be received in the future, taking into account inflation and potential investment returns.
9 Doherty, Jacobs, and Madden, “No One Benefits: How teacher pension systems are failing BOTH
teachers and taxpayers,” p. ii.
10
Janet Hansen, “An Introduction to Teacher Retirement benefits,” Education Finance and Policy 5, no. 4
(2010).
11
Alicia Munnell, State and Local Pensions: What Now? (Washington, D.C.: Brookings Institution Press,
2012).
12
Frederick M. Hess and Juliet Squire, “‘But the Pension Fund was just Sitting There…’: The Politics of
Teacher Retirement Plans,” Education Finance and Policy 5, no. 4 (2010).
40
13
Robert Novy-Marx and Joshua D. Rauh, “The Revenue Demands of Public Employee Pension
Promises,” NBER Working Paper No. 18489 (Cambridge, MA: National Bureau of Economic Research,
2012).
14
Robert M. Costrell and Michael Podgursky, “Peaks, Cliffs, and Valleys: The peculiar incentives in
teacher retirement systems and the consequences for school staffing,” Education Finance and Policy 4,
no. 2 (2009).
15
Robert M. Costrell and Josh McGee, “Teacher Pension Systems, Retirement Behavior, and the
Potential for Reform in Arkansas,” Education Finance and Policy 4, no. 2 (2010).
16
Robert M. Costrell, Robert M. and Michael Podgursky, “Distribution of Benefits in Teacher Retirement
Systems and Their Implications for Mobility,” Education Finance and Policy 5, no. 4 (2010).
17
Indeed, the fact that employees rather than taxpayers bear the risk of inadequate funding is arguably the
only fundamental difference between DC and DB plans, as existing DB plans could, in principle, be
modified to provide equivalent portability and a smooth accrual of pension wealth over time.
18
Mark Olleman and Ilana Boivie, “Decisions, Decisions: Retirement Plan Choice for Public Employees
and Employers” (Washington, D.C.: National Institute for Retirement Security, 2011): p. 1.
19
Michael DeArmond and Dan Goldhaber, “Scrambling the Nest Egg: How well do teachers understand
their pensions, and what do they think about alternative pension structures?” Education Finance and
Policy 5, no. 4 (2010).
20
John Beshears et al., "The Importance of Default Options for Retirement Savings Outcomes: Evidence
from the U.S.," in Lessons from Pension Reform in the Americas, eds. Stephen J. Kay and Tapen Sinha
(Oxford: Oxford University Press, 2008).
21
Gopi Shah Goda and Colleen Flaherty Manchester, “Incorporating Employee Heterogeneity into
Default Rates for Retirement Plan Selection, ” NBER Working Paper 16099 (Cambridge, MA: National
Bureau of Economic Research, 2010).
22
As discussed below, considerably fewer teachers selected the DC option when it was available in the
2002–03 school year, perhaps because information on the plan was not yet widely available.
23
Olleman and Boivie, “Decisions, Decisions: Retirement Plan Choice for Public Employees and
Employers.” In Table A4, Olleman and Boivie report slightly lower DC election rates for all new hires in
covered by the Florida Retirement System than those we observe for new teachers in the same years.
Their data, which extend through fiscal year 2011, indicate that the DC election rate for all new hires
peaked at 26 percent in fiscal year 2008, fell to 23 percent in each of the following two years, and
recovered to 25 percent in 2011. In other words, their data suggest that demand for DC plans may be
higher among teachers than among other state and local employees but do not indicate that the financial
crisis of 2008 had enduring effects on the plan preferences of new Florida employees.
24
Munnell, State and Local Pensions: What Now?
25
John Beshears et al., “Behavioral Economics Perspectives on Public Sector Pension Plans,” NBER
Working Paper 16728 (Cambridge, MA: National Bureau of Economic Research, 2011).
41
26
Ronald Snell, “State Cash Balance, Defined Contribution, and Hybrid Retirement Plans” (Denver, CO:
National Conference of State Legislatures, 2012).
27
Karen M. Doherty, Sandi Jacobs, and Trisha M. Madden, “No One Benefits: How teacher pension
systems are failing BOTH teachers and taxpayers” (Washington, D.C.: National Council on Teacher
Quality, 2012).
28
A sixth, Louisiana, will soon allow teachers to choose a “cash-balance plan,” under which they have
personal retirement accounts that accrue steadily and are guaranteed a minimum rate of return. Kansas
replaced its DB plan with a mandatory cash-balance plan in 2012.
29
Robert Costrell and Michael Podgursky, “Golden Peaks and Perilous Cliffs: Rethinking Ohio’s Teacher
Pension System” (Washington, D.C.: Thomas B. Fordham Institute, 2007) and Olleman and Boivie,
“Decisions, Decisions: Retirement Plan Choice for Public Employees and Employers.” In Table A11,
Olleman and Boivie report that the share of new South Carolina teachers choosing the DC option
fluctuated from 2004 and 2011 between 11 and 14 percent, perhaps reflecting the fact that teachers have
only a thirty-day election window before being defaulted into the DB system. Ohio allows teachers to
choose between DB, DC, and hybrid systems but under conditions that make the alternatives to the DB
system far less attractive. For example, DC teachers are ineligible for retirement health-care subsidies,
and the DB component of the hybrid system does not include a cost-of-living adjustment. Predictably,
participation rates in Ohio’s alternative plans have been very low.
30
Dan Goldhaber et al., “Teacher Pension Choice: Surveying the Landscape in Washington State, CEDR
Working Paper 2012-8 (Seattle, WA: University of Washington Bothell, 2012). Uses data from
Washington State to study teacher choices between a DB and a hybrid DB/DC plan in 1996–97 and
2008–10, finding that most teachers selected or were defaulted into the hybrid plan. Teachers in the
former period received a financial incentive for transferring to the hybrid plan, while for the latter cohort
the hybrid plan was the default option. In both cohorts, they find that hybrid choosers were slightly (0.02-
0.03 standard deviations) more effective in terms of value-added to student achievement than DB
choosers. This pattern differs somewhat from the findings with respect to value-added we report below,
perhaps due to structural differences between the Washington and Florida program (e.g., the fact that
Washington offered teachers a hybrid rather than a pure DC option or the fact that the hybrid plan was
incentivized or the default). However, their results are consistent with ours in suggesting that teachers’
pension plan preferences are at most weakly related to value-added.
31
The administrative costs triggered by PEORP were funded by a 0.1 percent assessment on gross
compensation paid by each FRS employer.
32
Cory Koedel, Shawn Ni, and Michael Podgursky, “Who Benefits from Pension Enhancements?,”
Department of Economics Working Paper 12-07 (University of Missouri–Columbia, 2012). While the
creation of the DC option was unique to Florida, Koedel, Ni, and Podgursky show that many other states
also made their defined-benefit pension plans more generous during this time period.
33
Florida Retirement System, “FRS Retirement Options for New Employees: Your money, your choice.”
Tallahassee, FL: State of Florida (2010).
34
This structure requires employers to contribute a percentage of their total payroll for each class of
employee that is based on the “blended” rates of plan choice for that class of employees statewide.

42
35
We ignore early retirement options allowing teachers to begin receiving payments immediately upon
separation throughout, as taking advantage of these options requires accepting a sizable reduction in
pension wealth.
36
Shane Frederick, George Loewenstein, and Ted O’Donohugh, “Time Discounting and Time Preference:
A Critical Review,” Journal of Economic Literature 40, no. 2 (2002).
37
DeArmond and Goldhaber, “Scrambling the Nest Egg: How well do teachers understand their pensions,
and what do they think about alternative pension structures?” In a survey designed to gauge the implicit
discount rates of Washington State teachers, DeArmond and Goldhaber find that 37 percent have discount
rates of 0.08 or higher, while just 31 percent had discount rates of 0.04 or lower.
38
We use a fixed age of death rather than annual survival probabilities for computational and expositional
simplicity; this causes the simulation to overstate our teacher’s DB pension wealth (evaluated at age
sixty-two) by roughly 1 percent.
39
Net present value is a calculation of the value today of a payment or stream of payments (like a
pension) that will be received in the future, taking into account inflation and potential investment returns.
40
Amanda Olberg and Michael J. Podgursky, “Charting a New Course to Retirement: How Charter
Schools Handle Teacher Pensions” (Washington, D.C.: Thomas B. Fordham Institute, 2011). Specifically,
we drop teachers that ever taught in a charter school that does not participate in FRS. We identify charter
schools using data from the National Center for Education Statistics Common Core of Data. We identify
charter schools participating in FRS using the underlying data from Olberg and Podgursky, which was
provided to us by the authors. We exclude both charters identified as not participating in FRS and those
for which data on FRS participation are not available.
41
We also drop the handful (0.06 percent) of teachers who are new by our definition but chose a Hybrid
DB/DC plan, which was available only to experienced teachers.
42
School years are defined as running from July 1 of a given year to June 30 of the following year. This
procedure requires us to drop a small number of teachers for whom election date is missing in the FRS
data.
43
Matthew M. Chingos and Martin R. West, “Do More Effective Teachers Earn More Outside of the
Classroom?,” Education Finance and Policy 7, no. 1 (2012).
44 Olleman and Boivie, “Decisions, Decisions: Retirement Plan Choice for Public Employees and
Employers,” Table A4.
45
The results in Table 4 are based on variants of the following linear probability model: , where is a dummy variable indicating that teacher chose the DC plan;
is a vector of teacher characteristics including race/ethnicity, age, education, gender, and subject area; is
a dummy variable identifying teachers in charter schools; and represent fixed effects for school
district and election year (i.e., cohort), respectively; and is a zero-mean error term. District fixed effects
are excluded in column 1. In columns 4 and 5, is expanded to include either a continuous measure of
value-added or a vector of dummy variables for value-added quartile.
46
James Farrell, “Demographics of Risky Investing,” Research in Business and Economics Journal,
Special Edition (Florida Economic Symposium, 2011). Interestingly, Farrell (2011) shows that black (but
43
not Hispanic) teachers who do participate in the Florida DC plan also choose more conservative
investment portfolios than do white teachers.
47
Specifically, we estimate variants of the following model: , where is a dummy variable measuring whether teacher was teaching (columns 1-2 and 5-6) or employed
(columns 3-4 and 7-8) in a Florida public school years after entering the system. is a dummy
variable indicating that the teacher chose the DC plan; is a vector of controls for teacher characteristics
including race/ethnicity, age, education, gender, subject area; represents election year (i.e., cohort) fixed
effects; and is a zero-mean error term. The specifications in columns 1, 3, 5, and 7 exclude the controls
for teacher characteristics and the charter school indicator. The parameter provides an estimate of the
predicted difference in the probability of retention as a teacher or public school employee in year between teachers that first choose DC and DB. 48
Ronald Snell, “State Pension Reform, 2009-2011” (Denver, CO: National Conference of State
Legislatures, 2012).
49
Doherty, Jacobs, and Madden, “No One Benefits: How teacher pension systems are failing BOTH
teachers and taxpayers”
50
In additional analyses (not reported), we found no evidence that the difference in retention rates
between teachers in the two plans was larger for ineffective teachers, as would be the case if ineffective
teachers in the DB plan who would otherwise have exited prior to their sixth year did not do so in order to
allow their benefits to vest.
51
Maria Fitzpatrick, “How Much do Public School Teachers Value their Pension Benefits?,” Manuscript
(Cornell University, 2011).