when trade falls— effects of covid-19 and outlook
TRANSCRIPT

When Trade Falls— Effects of COVID-19 and Outlook

ABOUT IFCIFC—a member of the World Bank Group—is the largest global development institution focused on the private sector in emerging markets. We work in more than 100 countries, using our capital, expertise, and influence to create markets and opportunities in developing countries. In fiscal year 2020, we invested $22 billion in private companies and financial institutions in developing countries, leveraging the power of the private sector to end extreme poverty and boost shared prosperity. For more information, visit www.ifc.org.
WRITTEN BYThis note was authored by Ibrahim Nana, IFC Consultant and African Research Fellow, and Susan K. Starnes, IFC Lead Global Trade and Commodity Finance Strategist.
ACKNOWLEDGEMENTSThe authors would like to thank the following colleagues for valuable input: Hyung Ahn, Jeffrey Anderson, Zeynep Attar, Murat Ayik, Matthew Benjamin, Zeynep Ersel, Issa Faye, Karla Soledad Lopez Flores, Dan Goldblum, Yasser Mohamed Tawfik Hassan, Jacqueline Irving, Benie Landry Kouakou, Thomas Kerr, Alok Kumar, Inho Lee, Fide Maksut, Ahmed Hanaa Eldin Mohamed, Sephooko Motelle, Lien Nguyen, Aleksey Nikiforovich, Arun Prakash, Henry Pulizzi, Thomas Rehermann, Irina Sarchenko, Makiko Toyoda, Daniel Wanjira, Florian Wicht, Robert Wright
DISCLAIMERThe findings, interpretations, views and conclusions expressed herein are those of the author and do not necessarily reflect the views of the Executive Directors of IFC or of the World Bank or the governments they represent. While IFC believes that the information provided is accurate, the information is provided on a strictly “as-is” basis, without assurance or representation of any kind. IFC may not require all or any of the described practices in its own investments, and in its sole discretion may not agree to finance or assist companies or projects that adhere to those practices. Any such practices or proposed practices would be evaluated by IFC on a case-by-case basis with due regard for the particular circumstances of the project.
RIGHTS AND PERMISSIONS© International Finance Corporation 2020. All rights reserved. The material in this work is copyrighted. Copying and/or transmitting portions or all of this work without permission may be a violation of applicable law.
1W
hen Trade Falls: Effects of C
OV
ID-19 and O
utlook
When Trade Falls— Effects of COVID-19 and Outlook
“…The [lockdown] has resulted in simultaneous supply
and demand shocks which affected almost all the
sectors. SMEs are also facing challenges ranging from
liquidity crisis to supply chain disruption, resource and
inventory breakdown, and a sudden drop in demand.
On the export side, the major export destinations …
are [holding and cancelling orders]. Though it has been
only [a very short time], the pandemic has had large
scale impact. The situation is evolving rapidly.”
—A representative IFC client bank, reflecting similar input across countries and clients

2
When Trade Falls: Eff
ects of CO
VID
-19 and Outlook
The COVID-19 pandemic represents an unprecedented challenge to the global economy.
Trade, integral to growth and economic development, is under pressure as a result of the
pandemic. While trade is a channel through which economic crises can spread, it is also
an essential component of growth, survival, and post-crisis recovery. As most countries
take measures to protect their citizens from the virus, economies are suffering from
resulting drops in production and consumption. This is further exacerbated as each
country’s slowdown also contributes to the drop in trade, which in turn amplifies the
economic challenge with cross-border demand and supply shocks. The economic pain
from the virus could be especially severe in some emerging market and developing
economies (EMDEs), because many of them were already facing limitations and
obstacles prior to the pandemic. These preexisting limitations reduce the capacity these
countries have to address the pandemic’s effects, putting their resilience at risk.
This briefing note, the first in a series of notes on trade and COVID, compiles trade-
related findings from over 70 “Daily News Summaries” prepared internally for IFC, as well
as data sources from March 24, 2020 to August 1, 2020.i The note provides an overview of
this year’s multi-body trade forecasts and the extent to which those forecasts were
realized as reported across various publications. It also highlights trends leading up to
the pandemic and provides examples of how the pandemic is affecting trade in a few
select cases. Finally, it offers a preliminary outlook on the future of trade, incorporating
certain paradigm shifts that have been expedited by unique facets of the current crisis.
In April the World Trade Organization forecast a 12.9 percent drop in world merchandise
trade in 2020, much of that decrease due to the COVID crisis and national responses to
it. The WTO has recently revised its forecast to a 9.2 percent decline this year, which is
still severe compared to previous years. And downside risks remain, especially if there is a
resurgence in COVID cases, as many nations have begun to experience in recent months.
The note’s authors have updated data in the note as new information has emerged. It is
significant to note that despite continuing fluctuations in trade and economic data, our
analysis and conclusions have remained relatively constant: global trade is at risk, yet it is
also an important component of both basic economic function and crisis recovery.
i Much of the initial focus and data in this paper are on the early months of the COVID crisis and its immediate impact on global trade and economic growth. Yet as the course of the virus has proceeded since then, lockdowns and suppression of economic activity have continued, both through voluntary withdrawal from commerce on the part of consumers and businesses, as well as mandated government measures.

3W
hen Trade Falls: Effects of C
OV
ID-19 and O
utlook
Key Takeaways
● The COVID-19 pandemic has put significant downward pressure on trade, which was
already facing new challenges prior to the pandemic. The measures that countries have
taken to protect their citizens from the pandemic have disrupted supply chains and
generated both demand and supply shocks.
● In line with early predictions, global trade fell dramatically in the first months of the
pandemic, with declines that exceeded those observed during the 2008-2009 global
financial crisis. Global trade dropped by 6 percent in 1Q20 Year on Year (“YOY”), followed
by a steeper drop of 21 percent YOY in 2Q20. The volume of trade also fell by 3 percent in
1Q20 compared to 4Q19 and continued its decrease in 2Q20, falling by 14 percent.
● Developing countries have not been spared from reduced trade volumes despite the
delayed increase in the number of COVID cases and the low death toll for some EMDEs.
● In the short term, trade is likely to continue to fall. The course of the economic
recovery is dependent on the evolution of the disease and the proximity and mass
rollout of a vaccine or cure. However, the depth of the fall in trade is also dependent on
the availability of trade finance; studies show that a shortage of available trade finance
was a significant driver of the drop in trade in 2008-2009.
● As the world emerges from the crisis over the medium term, trade can help expedite
economic recovery for many countries. In addition, global inventory management
strategies may change and innovations in trade digitalization will continue, each
offering potential for trade growth. Finally, trade corridors may shift post-pandemic,
offering opportunities for high-potential countries to take on greater leadership roles
in regional trade networks.
● In emerging markets and developing economies, as the pandemic resolves, trade
ecosystem changes offer new opportunities for growth through trade. However,
the realization of such opportunities presents challenges that require a large set of
stakeholders—both within these countries and from more advanced markets—to
engage.

4
When Trade Falls: Eff
ects of CO
VID
-19 and Outlook
Forecasts have predicted a severe trade contraction in 2020
As COVID-19 spread across the world, several institutions issued forecasts of a likely trade contraction in 2020. The severity of these forecasts is the result of both the trade landscape immediately prior to the pandemic and the economic effects of the pandemic.
World trade was already under stress and showing signs of contraction in 2019, prior to the pandemic.
Unlike “The Great Trade Collapse” of 2008-2009, the world entered 2020 with preexisting trade stress. Global merchandise trade stalled in 2019, due primarily to persistent trade tensions among several major global trade contributors, increased tariffs, and decreases in prices of several commodities. Merchandise trade volume had already fallen slightly since 2018, slowing economic growth, which is historically highly reliant on trade growth. The dollar value of world merchandise exports in 2019 fell by 3 percent to $19 trillion, with pressure across most regions, as shown in Table 1 below.1 The dollar value of world merchandise exports was down in all four quarters in 2019 compared with the previous year, with the strongest declines recorded in regions that export natural resources (lower oil and commodity prices reduced the overall value of exports).
Table 1: 2019 Merchandise Trade Volume by Region (annual percentage change)
REGIONS EXPORTS IMPORTS
North America 1% -0.4%
South and Central America -2% -2%
Europe 0.1% 1%
Asia 1% -1%
Other Regionsii -3% 2%
Source: Data from WTO secretariat.
ii Other Regions: Combined Africa, Middle East and Commonwealth of Independent States (CIS) including associate and former member states.
iii WTO, IMF, PIIE, OECD, World Bank and UNCTAD: While WTO, UNCTAD and PIIE only focused on goods trade, The IMF, the World Bank and the OECD released forecasts on goods and services.
iv The World Bank, WTO, IMF and OECD.
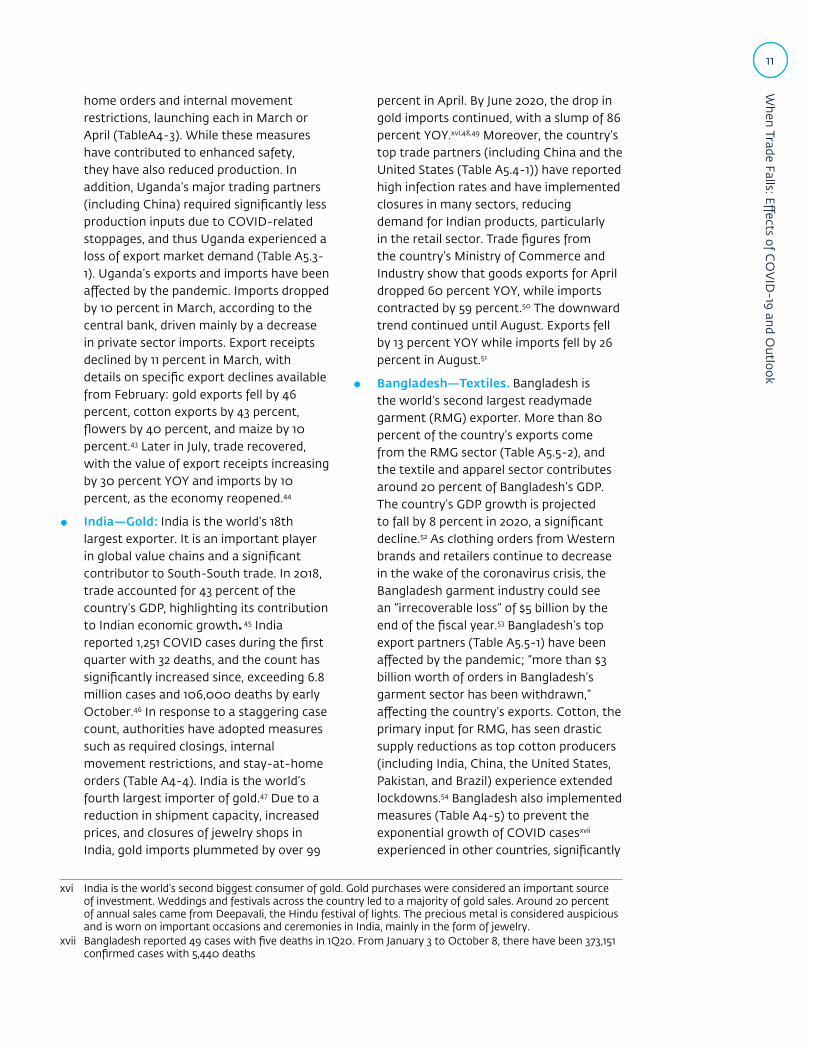
In 2019, the world’s top ten exporting countries and nine of the top ten importing countries reported negative growth rates for exports and imports, as shown in Annex 2. Thus trade, already weakening, has come under further pressure due to COVID-19, and has been forecasted to decline further.
Several Institutions have forecasted negative growth for trade
Trade is expected to fall in 2020 in all regions because of the pandemic. By April 2020, at least six institutionsiii forecasted a reduction in trade flows arising from COVID pressure on economic activities. The World Trade Organization (WTO) recently predicted a drop in global merchandise trade volume by 9 percent in 2020, less than the 13 percent drop foreseen in the optimistic scenario from the April trade forecast but still severe.2,3 This was followed by the release of forecasts from The Peterson Institute for International Economics (PIIE), the International Monetary Fund (IMF), The World Bank, the Organisation for Economic Co-operation and Development (OECD), and the United Nations Conference on Trade and Development (UNCTAD), all of which predicted significant slowdowns in global trade that are similar to the WTO view, as shown in Table 2: World Trade Volume Projections2. Estimates from UNCTAD have predicted a 27 percent drop in trade during the second quarter of 2020 alone. Beyond 2020, several organizations provided forecasts for 2021, predicting a limited recovery.iv

5W
hen Trade Falls: Effects of C
OV
ID-19 and O
utlook
Table 2: World Trade Volume Projections
v Other Regions: Combined Africa, Middle East and Commonwealth of Independent States (CIS) including associate and former member States.
vi These figures are true for the Sub-Saharan Africa region.
SOURCE DATE GOODS (G) / SERVICES (S) 2020 2021
WTO October g -9% 7%
World Bank June g + s -13% 5%
IMF June g + s -12% 8%
OECD June g + s -9% to -11% 6% to 2%
UNCTAD* June g -20%
PIIE 17-Apr g -24.0%
Source: WTO Secretariat, International Monetary Fund, World Bank, Organisation for Economic Co-operation and Development, Federal Reserve Bank of Philadelphia, European Central Bank, The Peterson Institute for International Economics (PIIE).
*UNCTAD projections concerns trade value
Note: Cells with two values correspond to optimistic and pessimistic forecast.
Across all regions, both merchandise imports and exports are expected to fall in 2020, as shown in the range of merchandise exports and imports contractions forecasted below:
● North America: Exports could fall by 15 percent and imports by 9 percent.
● South and Central America: Exports could fall by 8 percent and imports by 14 percent.
● Europe: Exports could fall by 12 percent and imports by 10 percent.
● Asia: Exports could fall drop by 5 percent and imports by 4 percent.
● Other Regionsv: Exports could fall by 10 percent and imports by 16 percent.
The last group (Other Regions) includes Sub-Saharan African countries for which agriculture is a key component of exports, accounting for around 23 percent of GDP and more than 60 of jobs, on average.vi Agricultural exports from the continent are worth between $35 billion and $40 billion annually. Estimates are that the pandemic could cost African nations as much as $5 billion in lost agricultural exports and affect the livelihoods of ten million farmers.4
It is important to note that countries that see greater reductions in exports than imports are at greater risk of facing further GDP reductions, foreign exchange (FX) availability, and debt service pressure. Greater reductions in imports may result in challenges with the availability of growth-supporting and life-sustaining goods. Exports for “Other Regions” (Africa, the Middle East, and the Commonwealth of Independent States) are forecasted to fall by 10 percent despite the delay in COVID contagion.
-20
-15
-10
-5
0Other regionsAsiaEurope
South andCentral America
NorthAmerica
-15%
-9%-8%
-14%-12%
-10%
-5%-4%
-10%
-16%Exports Imports
Figure 1: Merchandise Trade Volume is Predicted to Slump in 2020
Source: Data from WTO secretariat (October 8, 2020)
Note: Other regions comprise Africa, Middle East and Commonwealth of Independent States (CIS) including associate and former member States.

6
When Trade Falls: Eff
ects of CO
VID
-19 and Outlook
This predicted contraction in global trade can in part be explained by a more connected world which, more often than not, supports growth, as discussed below.
Trade connects countries, driving growth but expediting contagion
Before assessing the spread of COVID’s economic effects through trade, it is important to keep in mind the benefits of trade over time. Even with the projected deceleration in 2020, countries that trade more have typically grown faster and had greater opportunities to advance their individual development trajectories.5,6,7,8,9,10,11,12,13,14 Yet, while the trade-growth connection brings a net benefit, it also allows for economic contagion.
The COVID pandemic has affected global trade through both supply and demand shocks, which in turn travel to countries that are connected to each other in many ways, one of which is trade. COVID has affected trade’s ability to supply goods in several ways. On the supply side, the pandemic has pushed authorities to adopt restrictive measures ranging from “internal movement restrictions” to “international border closures” through “required closing (or work from
vii Crude oil price represents the average price of Brent, Dubai, and WTI prices.
home)” (Annex 4). While international border closures have reduced air freight capacity, internal movement restrictions and closures have affected businesses, halted industrial production, and limited port activities. As a result, many countries find both their capacity to produce goods and to export them curtailed; this reduces the movement of products across borders. Production limitations are exacerbated by the inability to source necessary production inputs from abroad.
In addition, the reduction in aggregate demand among the world’s largest importing countries has reduced the ability of many countries to successfully export the goods they do manage to produce. This is driven in large part by COVID-related business closings across multiple industries, which in turn negatively affect consumer demand, which was already falling due to social distancing and lock-down measures. This phenomenon is demonstrated quantitatively by the steep decline of many commodity prices. For example, the average price of crude oilvii has registered YOY negative growth from February to July (Annex 3), with the largest decrease in April (69 percent). Figure 2 depicts the iterative effects of the COVID crisis on supply and demand through magnified supply chains disruptions.
Figure 2: The Economic Effects of the Pandemic Spread Through Trade
Source: International Trade Center. Adapted from the World Development Report 2020.

7W
hen Trade Falls: Effects of C
OV
ID-19 and O
utlook
The effects of COVID-19 are particularly pervasive, in part due to the emergence of the “large-hub-and-smaller-spoke” systems that have emerged with the rise of global value chains (GVCs). Over two-thirds of world trade occurs through GVCs,15 in which production crosses at least one border before final assembly. The COVID pandemic hit the three largest GVC hubs early, creating an unprecedented combination of supply and demand shocks.
According to the most recent data, the economic effects of the pandemic, depicted in Figure 2, have become a reality, as predicted. Different trade related indicators are reported with different lags, and thus multiple data are tracked to obtain timely information. As presented below, all indicators suggest that negative forecasts for trade were at the very least directionally correct.
Expectations are becoming reality: as expected, severe trade stress is evident in falling trade indicators
To date in 2020, the combined set of available trade data shows that trade is falling, driven in large part by COVID-related effects. Several trade indicators collected from daily news and different data sources have turned red, confirming global forecasts issued at the early stages of the pandemic. The 2020 trade deceleration was already reaching the worst of 2008-09 only a few months into the current crisis.16 Data from different sources illuminates the current decline in trade. From freight and port indicators to international trade data
viii The RWI / ISL (Institute of Shipping Economics and Logistics and Rheinisch-Westfälisches Institut für Wirtschaftsforschung) Container Throughput Index is an indicator of world trade and global economic activity formed by first estimating missing monthly data and then adding the actual and estimated container throughputs. The series are seasonally adjusted and converted into an index in which the year 2015 serves as the basis and therefore assumes the value 100. Calculations since 2007 show that the container handling index is very closely correlated with the data on world trade published by the International Monetary Fund. The index provided reliable data, particularly during the 2008-09 financial and economic crisis.
ix IATA: The International Air Transport Association.
via purchasing managers’ indexes (PMI) and new export orders, the message is the same; international trade volumes are decreasing. The indicators highlighting this decrease include:
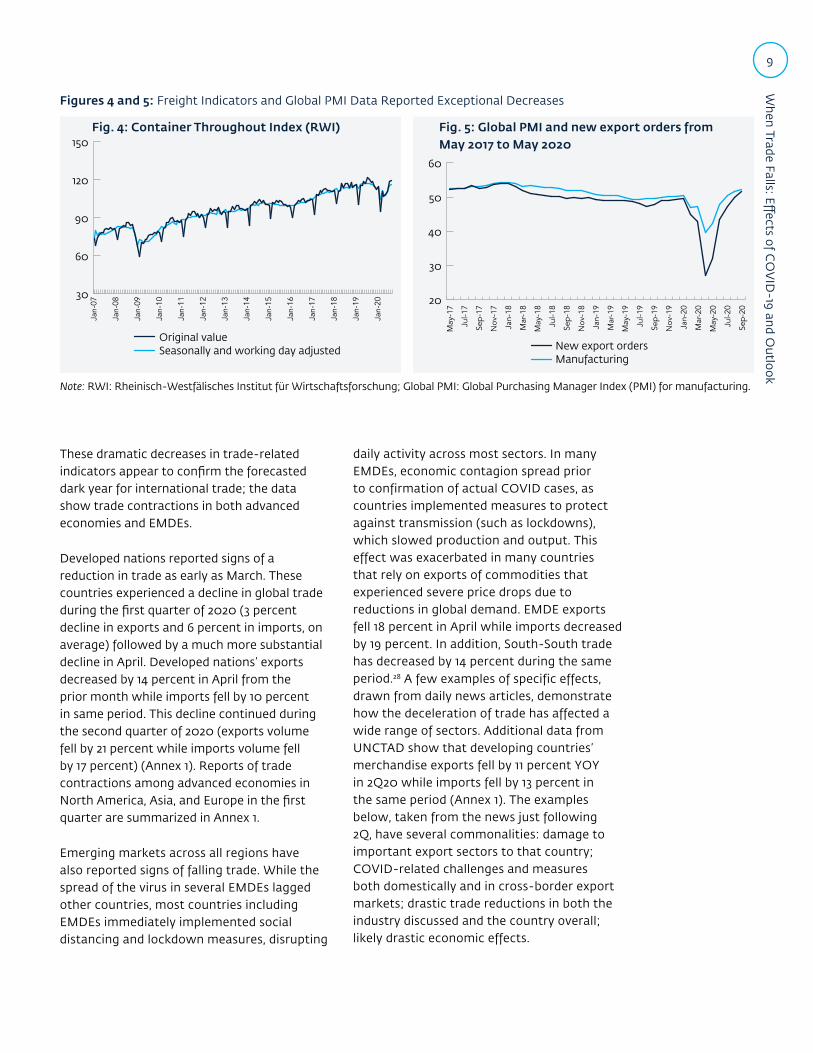
● RWI and ISL container data: The Container Throughput Index of the RWI and ISLviii (covers container throughput for over 90 international ports and about 60 percent of global container throughput), recorded its biggest ever drop of 11 points, to 102, in February. It continued to fall in April-May, decreasing by 6 to 7 percent YOY in each period. The index rose slightly by 4 percent in June and continued to rise until August (by 1 percent) (Figure 4).17
● IATAix air freight data: Air cargo capacity measured by industry-wide “cargo tonne-kilometres” (CTKs) contracted by 28 percent YOY in April, the sharpest decline in the history since 1990 and worse than declines observed during the Global Financial Crisis (e.g., -24 percent in January 2009). The downward pressure continued in May (-20 percent YOY), June (-18 percent YOY) and July (-14 percent YOY) with slow improvements. Air cargo continued to slowly improve in August, with CTKs down 13 percent YOY, compared to previous months.18,19,20,21
● Purchasing Managers’ Index (PMI): New export orders measured by PMI decreased between January and February (down 9 percent) and have continued to contract through April (down 37 percent). Later in May, export orders rebounded (increased by 19 percent) and have continued increasing until September (up 4 percent) (Figure 5).22
● WTO Goods Trade Barometer: The current decrease in trade was also reflected in the 20 May “WTO Goods Trade

8
When Trade Falls: Eff
ects of CO
VID
-19 and Outlook
Barometer,” x an index that measures actual performance vs. recent trends.23 The index settled at 88 in March and 85 in June, far below the baseline value of 100 and the lowest since 2011, suggesting that a sharp contraction in world trade extended into the second quarter, beyond expectations.
● World Trade Monitor: Additional data show that global trade volume fell in March by 4 percent YOY, the largest drop since 2009 (which was six months after the 2008-09 crisis launch point.)24
● WTO: According to the most recent data released on September 23, world merchandise trade volumes declined by 14 percent in 2Q20. This contraction is higher than the 10 percent drop recorded during the global financial crisis between 3Q08 and 1Q09. The nominal dollar value of merchandise trade also collapsed in 2Q20, falling by 21 percent YOY. This decline in merchandise trade values is lower than the 33 percent drop reported in 2Q09 (Figure 3).25
x The WTO’s Goods Trade Barometer provides real-time information on the trajectory of world trade relative to recent trends. It combines a variety of trade-related component indices into a single composite index that highlights turning points in world merchandise trade and provides an indication of its likely trajectory in the near future. The barometer index shows how the latest data compare with short-run trends in goods trade. Amplitudes and means of the deviation series are standardized by dividing each series by its mean absolute deviation since January 2007, multiplying by a common scaling factor and adding 100. A reading of 100 indicates trade expansion in line with recent trends. Readings greater than 100 suggest above-trend growth while readings below 100 indicate below-trend growth.
xi E.g., earlier in May workers at Latin America’s biggest port were starting to fall ill: https://www.bloomberg.com/news/articles/2020-05-12/workers-at-latin-america-s-biggest-port-are-starting-to-fall-ill.
The data below illustrates what is happening “on the ground” with trade logistics, as well as the broader economic challenges countries face. For example, some retailers and manufacturers have been unable to pick up cargo and containers because their warehouses are already full or closed, putting perishable products at risk. Estimates suggest that the situation could cost Africa as much as $5 billion in lost agricultural exports that currently sit in docks.26 In some cases, ports remained open during lockdowns but had reduced workforce to prevent the spread of COVID among port workers,xi exacerbating cargo congestion.27 Reduction of port activities has affected the shipment of goods around the world, generating unusual shipping routes and making product shipments more difficult, more expensive, and more time consuming (for example, trucks now travel more than 6,000-miles from Beijing to Berlin to fill Germany’s supply gap as air freight fell drastically).
Figure 3: World Merchandise Trade Trends (from 1Q08 to 2Q20)
Source: The World Trade Organization data portal.
-40%
-35%
-30%
-25%
-20%
-15%
-10%
-5%
0%
5%Manufactures
Fuels andMining
products Agricultural
productsTotal
Merchandise
-6%
-21%
-3%
0%
-5%
1%
-6%
-38%
-8% -6%
19%
-1%
4Q19 1Q20 2Q20
-30%
-40%
-20%
-10%
0%
10%
20%
30%
Merchandise trade value (YOY % change)Merchandise trade volume (Quarterly % change)
1Q08
3Q08
1Q09
3Q09
1Q10
3Q10
1Q11
3Q11
1Q12
3Q12
1Q13
3Q13
1Q14
3Q14
1Q15
3Q15
1Q16
3Q16
1Q17
3Q17
1Q18
3Q18
1Q19
1Q20
3Q19
-14%, 2Q
-21%, 2Q
Trade Trends by Commodities
9W
hen Trade Falls: Effects of C
OV
ID-19 and O
utlook
These dramatic decreases in trade-related indicators appear to confirm the forecasted dark year for international trade; the data show trade contractions in both advanced economies and EMDEs.
Developed nations reported signs of a reduction in trade as early as March. These countries experienced a decline in global trade during the first quarter of 2020 (3 percent decline in exports and 6 percent in imports, on average) followed by a much more substantial decline in April. Developed nations’ exports decreased by 14 percent in April from the prior month while imports fell by 10 percent in same period. This decline continued during the second quarter of 2020 (exports volume fell by 21 percent while imports volume fell by 17 percent) (Annex 1). Reports of trade contractions among advanced economies in North America, Asia, and Europe in the first quarter are summarized in Annex 1.
Emerging markets across all regions have also reported signs of falling trade. While the spread of the virus in several EMDEs lagged other countries, most countries including EMDEs immediately implemented social distancing and lockdown measures, disrupting
daily activity across most sectors. In many EMDEs, economic contagion spread prior to confirmation of actual COVID cases, as countries implemented measures to protect against transmission (such as lockdowns), which slowed production and output. This effect was exacerbated in many countries that rely on exports of commodities that experienced severe price drops due to reductions in global demand. EMDE exports fell 18 percent in April while imports decreased by 19 percent. In addition, South-South trade has decreased by 14 percent during the same period.28 A few examples of specific effects, drawn from daily news articles, demonstrate how the deceleration of trade has affected a wide range of sectors. Additional data from UNCTAD show that developing countries’ merchandise exports fell by 11 percent YOY in 2Q20 while imports fell by 13 percent in the same period (Annex 1). The examples below, taken from the news just following 2Q, have several commonalities: damage to important export sectors to that country; COVID-related challenges and measures both domestically and in cross-border export markets; drastic trade reductions in both the industry discussed and the country overall; likely drastic economic effects.
Figures 4 and 5: Freight Indicators and Global PMI Data Reported Exceptional Decreases
Note: RWI: Rheinisch-Westfälisches Institut für Wirtschaftsforschung; Global PMI: Global Purchasing Manager Index (PMI) for manufacturing.
30
60
90
120
150
Original valueSeasonally and working day adjusted
Jan-
07
Jan-
08
Jan-
09
Jan-
10
Jan-
11
Jan-
12
Jan-
13
Jan-
14
Jan-
15
Jan-
16
Jan-
17
Jan-
18
Jan-
19
Jan-
20 20
30
40
50
60
New export ordersManufacturing
May
-17
Sep-
17
Nov
-17
Jul-1
7
Jan-
18
May
-18
Jul-1
8
Mar
-18
Sep-
18
Jan-
19
Mar
-19
Nov
-18
May
-19
Sep-
19
Nov
-19
Jan-
20
Mar
-20
May
-20
Jul-2
0
Jul-1
9
Sep-
20
Fig. 4: Container Throughout Index (RWI) Fig. 5: Global PMI and new export orders from May 2017 to May 2020

10
When Trade Falls: Eff
ects of CO
VID
-19 and Outlook
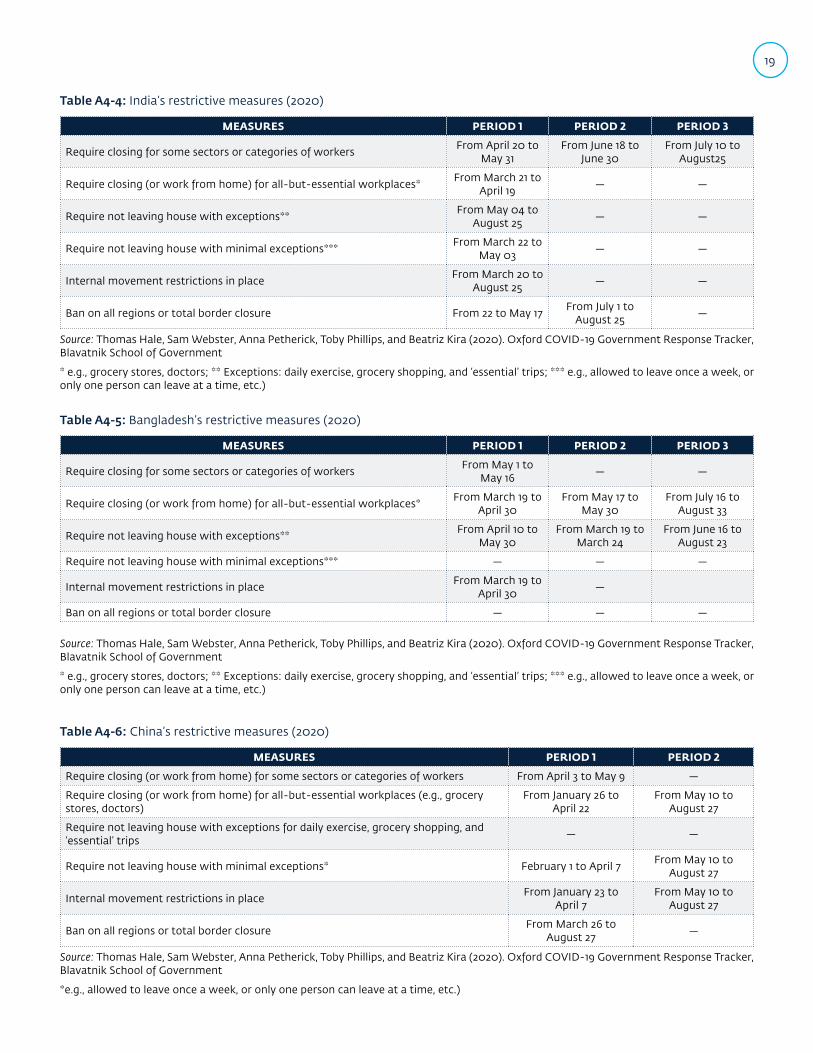
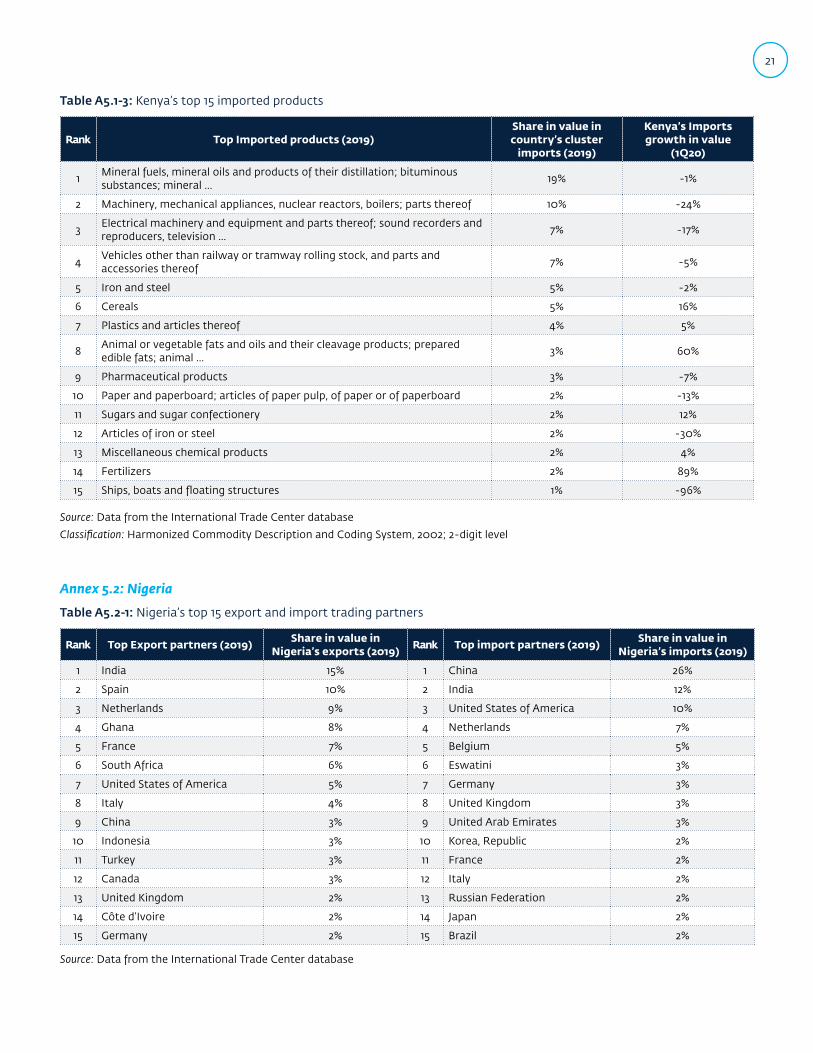
● Kenya—Flowers: In 2018, trade accounted for 36 percent of Kenya’s GDP, with agricultural products making up its top five exports (Table A5.1-2). Kenya is the largest supplier of flowers to Europe.29 With a low number of COVID casesxii during the first quarter,30 Kenya adopted “required closings” through August (Table A4-1) to prevent the virus’s spread. Thus, while Kenya’s production capacity fell, Europe and other significant export destinations adopted restrictive measures (e.g., “closures” and “internal movements restrictions”). This, along with other COVID-related effects (such as rising unemployment), reduced demand for Kenya’s exports, including flowers. In addition, COVID-related border closures, implemented in late March, have compressed air freight capacity from Kenya. Collectively, these measures reduced the country’s flower exports to the EU by 50 percent in March.31,32 This sudden and material decline in flower exports negatively affects the country’s economy, which relies on this industry for approximately $5 billion to $8 billion in foreign income, 150,000 year-round jobs, and an estimated two million jobs indirectly, in addition to seasonal jobs.33 Data show that Kenya’s exports fell 12 percent YOY in April, and increased by 2 percent in May before falling another 6 percent in June, while imports fell 20 percent YOY in April, 30 percent in May, and 19 percent in June.34 Exports recovered in August increasing by 9 percent, while imports continued falling, by 5 percent.35
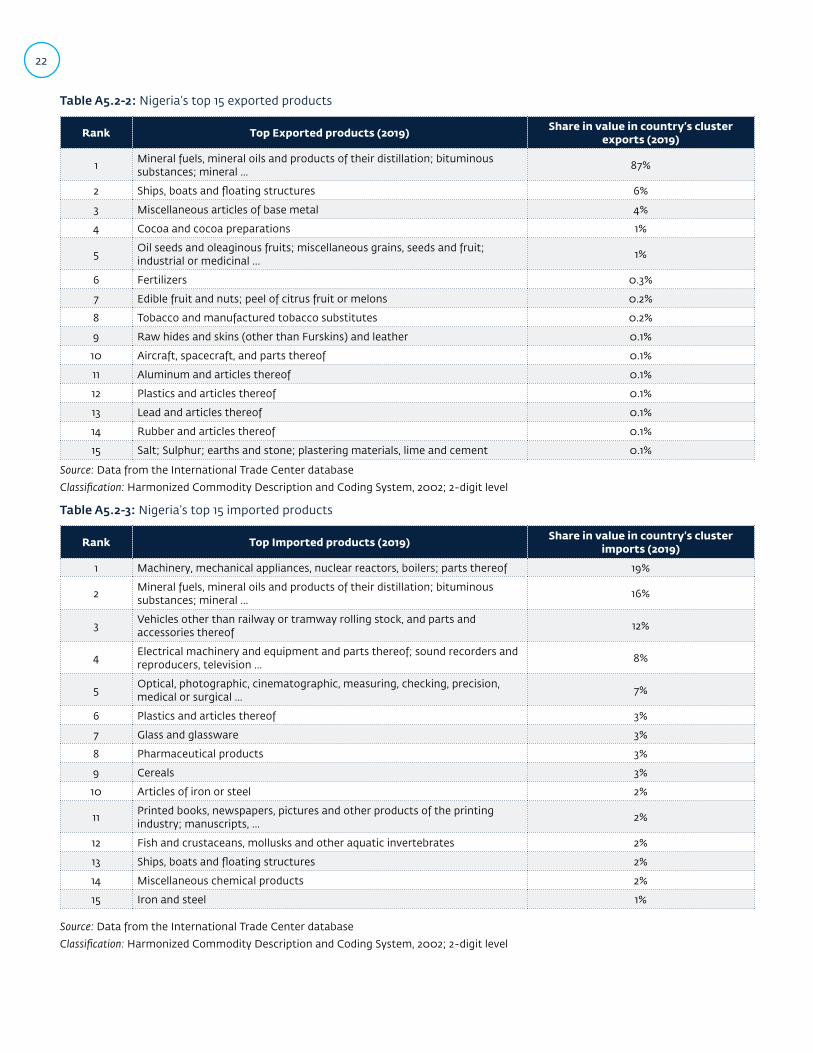
● Nigeria—Cocoa: In 2018, trade represented 33 percent of Nigeria’s GDP.36 Of that, cocoa registered among the five highest export products group (after
xii Kenya reported one death on 50 COVID cases in 1Q20. From January 3 to October 8, there have been 39,586 confirmed cases with 743 deaths.
xiii Nigeria reported two deaths on 131 COVID cases in 1Q20. From January 3 to October 8, there have been 59,583 confirmed cases with 1,113 deaths.
xiv According to MIT’s Observatory of Economic Complexity (OEC), Cocoa is among Nigeria’s top exports. Though it only represents 2 percent of the nation’s exports, the cocoa bean is the third largest export from Nigeria after crude petroleum and petroleum gas. Cocoa exports are a $740 million industry in Nigeria.
xv Uganda reported 33 COVID cases, with zero deaths. From January 3 to October 8, there have been 9,082 cases with 84 deaths.
various oil products) (Table A5.2-2). While COVID cases were still relatively lowxiii during the first quarter,37 Nigeria adopted measures to prevent the pandemic’s spread (Table A4-2). As a result, Nigerian cocoa exports stalled in the face of COVID safety protocols.xiv In addition to export destination lockdowns, reduced port activities delayed cocoa exports, leaving at least 30,000 tons stranded at the Lagos port and in warehouses.38 The cocoa industry faces additional stress in Nigeria as cocoa farmers have been unable to access pesticides due to COVID-related import and distribution challenges. This, in turn, reduces cocoa supplies, cocoa exports, and cocoa income even further than the port-related reductions.39 Nigeria’s cocoa challenges generate a potentially catastrophic national export income loss when partnered with the fall in crude oil prices (Nigeria’s top export) (Table A5.2-1 and Annex 3). At a national level and for aggregated trade figures, the Nigerian National Bureau of Statistics has reported a total trade decline of 18 percent in 1Q20 vs. 4Q19. Total export value decreased 14 percent in 1Q20 vs. 4Q19; import values decreased by 21 percent in 1Q20 vs. 4Q19.40 Trade continued its decrease during the second quarter, falling by 27 percent decrease compared to the first quarter.41
● Uganda—Several Exports fell. In 2018, trade accounted for 48 percent of Uganda’s GDP, which includes gold, oil, and several agricultural crops. While reported first quarter COVID cases were low,xv,42 the country focused on blocking the spread of the virus via required closings for some sectors and required stay-at-
11W
hen Trade Falls: Effects of C
OV
ID-19 and O
utlook
home orders and internal movement restrictions, launching each in March or April (TableA4-3). While these measures have contributed to enhanced safety, they have also reduced production. In addition, Uganda’s major trading partners (including China) required significantly less production inputs due to COVID-related stoppages, and thus Uganda experienced a loss of export market demand (Table A5.3-1). Uganda’s exports and imports have been affected by the pandemic. Imports dropped by 10 percent in March, according to the central bank, driven mainly by a decrease in private sector imports. Export receipts declined by 11 percent in March, with details on specific export declines available from February: gold exports fell by 46 percent, cotton exports by 43 percent, flowers by 40 percent, and maize by 10 percent.43 Later in July, trade recovered, with the value of export receipts increasing by 30 percent YOY and imports by 10 percent, as the economy reopened.44
● India—Gold: India is the world’s 18th largest exporter. It is an important player in global value chains and a significant contributor to South-South trade. In 2018, trade accounted for 43 percent of the country’s GDP, highlighting its contribution to Indian economic growth. 45 India reported 1,251 COVID cases during the first quarter with 32 deaths, and the count has significantly increased since, exceeding 6.8 million cases and 106,000 deaths by early October.46 In response to a staggering case count, authorities have adopted measures such as required closings, internal movement restrictions, and stay-at-home orders (Table A4-4). India is the world’s fourth largest importer of gold.47 Due to a reduction in shipment capacity, increased prices, and closures of jewelry shops in India, gold imports plummeted by over 99
xvi India is the world’s second biggest consumer of gold. Gold purchases were considered an important source of investment. Weddings and festivals across the country led to a majority of gold sales. Around 20 percent of annual sales came from Deepavali, the Hindu festival of lights. The precious metal is considered auspicious and is worn on important occasions and ceremonies in India, mainly in the form of jewelry.
xvii Bangladesh reported 49 cases with five deaths in 1Q20. From January 3 to October 8, there have been 373,151 confirmed cases with 5,440 deaths
percent in April. By June 2020, the drop in gold imports continued, with a slump of 86 percent YOY.xvi,48,49 Moreover, the country’s top trade partners (including China and the United States (Table A5.4-1)) have reported high infection rates and have implemented closures in many sectors, reducing demand for Indian products, particularly in the retail sector. Trade figures from the country’s Ministry of Commerce and Industry show that goods exports for April dropped 60 percent YOY, while imports contracted by 59 percent.50 The downward trend continued until August. Exports fell by 13 percent YOY while imports fell by 26 percent in August.51
● Bangladesh—Textiles. Bangladesh is the world’s second largest readymade garment (RMG) exporter. More than 80 percent of the country’s exports come from the RMG sector (Table A5.5-2), and the textile and apparel sector contributes around 20 percent of Bangladesh’s GDP. The country’s GDP growth is projected to fall by 8 percent in 2020, a significant decline.52 As clothing orders from Western brands and retailers continue to decrease in the wake of the coronavirus crisis, the Bangladesh garment industry could see an “irrecoverable loss” of $5 billion by the end of the fiscal year.53 Bangladesh’s top export partners (Table A5.5-1) have been affected by the pandemic; “more than $3 billion worth of orders in Bangladesh’s garment sector has been withdrawn,” affecting the country’s exports. Cotton, the primary input for RMG, has seen drastic supply reductions as top cotton producers (including India, China, the United States, Pakistan, and Brazil) experience extended lockdowns.54 Bangladesh also implemented measures (Table A4-5) to prevent the exponential growth of COVID casesxvii experienced in other countries, significantly

12
When Trade Falls: Eff
ects of CO
VID
-19 and Outlook
reducing production.55 The weakened textile industry, which constitutes a significant share of Bangladesh’s exports (Table A5.5-2), precipitated the country’s exports contraction. In May 2020, exports were 64 percent lower than national targets for the month. And month-on-month comparisons for May exports show a decrease of 62 percent between 2019 and 2020. 56 Exports continued to decrease until June (3 percent YOY) with a slight recovery in July (0.6 percent YOY increase) that continued in August (4 percent YOY increase) and September (4 percent YOY increase).57
The global pandemic has decelerated trade drastically. Both the drivers of this slowdown and responses to the challenges at hand suggest changes that will endure through this crisis’s ultimate recovery and additional challenges beyond the pandemic. The outlook for trade and what will follow the impacts described above requires an understanding of both short- and long-term components of trade fluctuations, as well as an eye toward potential paradigm shifts that were, albeit gradually, already underway prior to the COVID crisis.
Outlook: The Future of Trade
Trade remains essential to the global economy. It has been fundamental to growth, development, and (in most scenarios) stability for both developed and EMDE countries for some time. Today the world is more connected than ever; unwinding the interconnectedness of nations and economies is infeasible and would have severe consequences. Trade will be a critical component of economic recovery as it both leads and lags growth. However, the future of trade is highly likely to change going forward, given the experiences of the current pandemic. We expect that trade will evolve in several ways, both in the short term and the medium-to-long term, as noted below:
● In the short term, trade will continue to fall. Trade is directly tied to aggregate demand, production, and trade finance availability—all of which are either drastically stalled or are under significant downward pressure. Unless demand bounces back immediately, accompanied by systemically significant trade finance increases, the contraction in trade will continue. However, the global financial sector has some agency over the depth of the fall in trade. Several econometric studies, some cited here, provided proof that the trade collapse of 2008-09 was materially and independently affected by shortages in trade finance, with some publications indicating that up to 20 percent of the reduction could be related to trade finance,58,59,60 as discussed in this note’s companion, “COVID-19: Why Trade Finance Matters, Especially Now.” Thus, it remains in the best interests of both economies and financial sectors over the long term to support the maintenance of trade finance and working capital. The extent to which financial sector engagement is sustained will impact the “bottom” of trade, as well as the speed to which it (and the economies that depend on it) recover.
● Trade will help expedite recovery for some countries. Steady-state economic recovery, brought about by a return of production, consumption, and trade, is unlikely until COVID-19 is contained. Economists continue to debate the shape of the future recovery (V-shaped, U-shaped,61 or W-shaped)62 and some predictions have suggested the recovery could begin by 2021, while others remain wary of predicting a short-term recovery. While beyond the scope of this paper, the speed of the “bounce,” which can be expedited with trade, remains to be seen and depends on the proximity of vaccine development and distribution, as well as the potential for additional infection waves. However, we expect that those countries that proactively pull forward

13W
hen Trade Falls: Effects of C
OV
ID-19 and O
utlook
bilateral and global connections through trade will experience faster recoveries, along with their trade counterparties. The extent to which trade tensions are amplified post-crisis will play a significant role as well.
● China’s economic recovery, now in preliminary stages, will provide both a test case and impetus toward a global trade recovery. The world’s largest manufacturing economy and the leader of emerging market participation in global value chains, China was also the first country to face exponential growth of COVID cases and deaths.xviii As such, it was the first to implement lockdowns (including restricted internal movements in late January) (Table A4-6) and sustain a severe fall in exports (22 percent in January). However, a fragile recovery began to unexpectedly emerge. While economists had forecasted that Chinese exports would decline by 14 percent YOY (imports by 10 percent) in March, exports declined only 7 percent (imports 1 percent).63 Then, exports experienced a 3 percent increase in April, suggesting early but fragile recovery64 as exporters worked to overcome first quarter shortfalls.65 This trend continued until July with exports increasing by 7 percent YOY (while imports fell by 1 percent).66 This increase suggests significant potential for recovery, though other economic data, such as still-meager retail sales growth, suggests that challenges remain.67 Despite China’s April trade rebound, because its key trading partners have fallen into recession, this nascent recovery is likely to remain under pressure.68 The capacity of China to contribute to a global recovery depends on its ability to contain the virus and protect production. As it is among the first economies to attempt a production restart, China’s experience going forward will inform the rest of the world as to both opportunities and risks of
xviii China reported 82,241 COVID cases and 3,309 deaths in 1Q20
specific choices. And given the increased interconnectedness of the world, China cannot reboot global trade by itself. This factor is most likely to increase in significance as more countries are able to contain the spread of the virus and move toward economic recovery.
● Increasing inventory across supply chains may support temporary trade growth, post recovery. In recent decades, much of corporate operational strategy has focused on cutting costs and increasing efficiencies.69 This, along with other factors, has led to a reduction of both input and output inventory in companies across most countries.70,71 The short supply of inputs reduced the sales cycle cushion and, thus, crisis response times, exacerbating the financial damage of COVID-19. As such, it is likely that, as companies across the world assess risk points, operational risk management strategies may shift in order to add time to respond to exogenous factors. Some companies may choose to add an extra layer of inventory, temporarily increasing the demand for related goods, relative to pre-COVID levels.
● As the world recovers, the global structure of trade corridors may change. The rise of global value chains over the past decade has supported trade growth and, through trade, economic growth, particularly in emerging markets.72 However, given the acute shocks from the COVID crisis, with contagion accelerated by a reliance on a concentrated hub-and-spoke global trade network, a larger number of smaller hubs may emerge, increasing each country’s trade counterparty diversification. Some countries will seek to diversify their supply chain memberships.73 This offers a unique opportunity for high-potential countries to increase their leadership roles in smaller trade hubs by taking early steps to strengthen connections with

14
When Trade Falls: Eff
ects of CO
VID
-19 and Outlook
their neighbors, and by accelerating their emergence from the crisis via stronger trade and trade finance infrastructure. This could permanently alter the map of global trade.
● For Africa, intra-African trade can potentially contribute to recovery. Trade in Africa was, relative to other regions and across multiple metrics, the lowest by far. Prior to the pandemic, African countries were making efforts to boost intra-regional trade, one of many factors that could support economic growth. The African Continental Free Trade Area (AfCFTA)74 could advance pan-African trade hubs in an era when several countries seek to diversify their supply chains. The extent to which this effort can be advanced depends on several factors, including each country’s pandemic-related damage, intervention options, and recovery strategies.xix
● Innovative changes may be challenging for developing countries, requiring the participation of all stakeholders. The trade digital landscape offers great promise, but is quite complex, as there is a wide range of providers operating within different geographies and places on the tech value chain, with a broad mix of products, client focus, and underlying technologies.75 As with developed economies, there is significant potential for innovation in EMDE trade and trade finance. The extent to which this potential is realized in EMDEs depends on the extent to which multiple partners are willing to invest funds and time to upskill, outfit, coordinate, and further develop EMDE financial institutions, regulatory systems, and customers. While the set of
xix The strategy would include measures such as policies that can help prevent “exporting firms” and Small and Medium Enterprises (SMEs) from bankruptcy and closure; cutting trade barriers and structural and long-term measures that require additional investments.
stakeholders involved is wide-ranging, such partners would include, among others, private sector financial institutions, other cross-border investors, international institutions and advisory groups, individual governments, donors, global private sector players, and public participants such as regulatory agencies.
Conclusion
This is the first in a series of briefing notes that examine the COVID crisis from a trade and trade finance perspective. In order to convey the extent of the pandemic’s impact on trade across the globe, the note drew from 70 Daily News Summaries on COVID and trade, collecting published economic and trade news from multiple sources as well as data made available between March 24, 2020 and August 1, 2020, much of which has been updated with the most recently available figures.
Trade has been a significant victim of the pandemic. Yet, trade will also be critical to global and national economic recoveries, and trade networks can play a significant role in mitigating the impact of necessary COVID containment efforts, while expediting a return to economic growth. Successive notes of the “Trade and COVID-19 Trilogy” will expand the discussion on both trade finance and the consequences of trade contraction, respectively.
For questions or comments, please contact authors Ibrahim Nana, IFC Consultant and African Research Fellow ([email protected]) or Susan K. Starnes, Lead Global Trade and Commodity Finance Strategist ([email protected])

15
Annexes
Annex 1: Trade trends
Annex 1.2: Advanced Economies Face Significant Reductions in Trade
● The United States: U.S. trade plummeted in March. Exports dropped from the prior month by a record 10 percent to $188 billion, while imports fell 6 percent to $232 billion. U.S. merchandise trade fell to the lowest in almost three years in March. Goods exports fell nearly 7 percent from the prior month while imports fell by 2 percent, primarily on automobiles and consumer goods. This contraction continued in April, with merchandise export value and import value shrinking 29 percent and 21 percent, respectively. Later in August, exports decreased by 18 percent YOY and imports decreased by 13 percent during the same period. 76
● Canada: Canada, closely linked to countries with significant infection rates, experienced trade stress as well, as the country’s trade partners have been severely affected. Canada’s top five import partners import around 85 percent of Canada’s merchandise and are all deeply affected by the pandemic. Canada’s exports plunged 5 percent in March on falling oil and auto exports. Despite the monthly increase in merchandise trade in June (17 percent for exports and 22 percent for imports), exports were 20 percent lower compared to the year before and imports were 15
percent down.77 According to Statistics Canada, total imports and exports fell both by 1 percent in August.78
● Europe: Like most countries, Europe implemented lockdowns, social distancing, and travel bans, due to the spread of the virus, which created the most drastic fall in economic activity since World War II. A key driver of the European export decline has been car sales, which virtually halted in April. In addition, the European Union restricted exports of medical gear (in medical equipment, the EU has a 26 percent share of world exports).79 The European Commission predicted declines in euro-area exports of 13 percent for the entire year. However, the EU experienced a decline in exports of 13 percent in March alone. During the first quarter of 2020, country-specific export reductions ranged from 4 percent to 8 percent, depending on domestic activity and goods makeup, while import decreases ranged from 2 percent to 7 percent.80 European merchandise exports decreased by 4 percent in 1Q20 and continued decreasing in 2Q20, falling by 22 percent.81
● Japan: Japanese exports fell about 22 percent in April, with vehicle shipments dropping by half.82 The decline of the au Jibun Bank Japan Purchasing Managers Index for manufacturing fell to 38 in May, the strongest contraction of activity in Japan’s factory sector since
-25%-20%-15%-10%-5%0%
05%10%15%
20%25%
Developed economiesDeveloping econimies
1Q08
3Q08
1Q09
3Q09
1Q10
3Q10
1Q11
3Q11
1Q12
3Q12
1Q13
3Q13
1Q14
3Q14
1Q15
3Q15
1Q16
3Q16
1Q17
3Q17
1Q18
3Q18
1Q19
1Q20
3Q19
-11%, 2Q
-21%, 2Q-20%
-15%
-10%
-5%
0%
05%
10%
15%
20%
25%
Developed economiesDeveloping econimies
1Q08
3Q08
1Q09
3Q09
1Q10
3Q10
1Q11
3Q11
1Q12
3Q12
1Q13
3Q13
1Q14
3Q14
1Q15
3Q15
1Q16
3Q16
1Q17
3Q17
1Q18
3Q18
1Q19
1Q20
3Q19
-13%, 2Q-17%, 2Q
Annex 1.1: Developed vs Developing economies’ trade trends (quarterly)
Source: UNCTAD data
ImportsExports

16
March 2009. Recent data released by UNCTAD show that Japan experienced negative merchandise exports and imports since January, with the highest slump reported in May (-26 percent and -21 percent, respectively). WTO data shows that YOY growth rates for both imports and exports were still negative in July (-18 percent and -21 percent respectively).83
● Republic of Korea: Korean exports fell 24 percent YOY in April, with the overall trade slump deepening in May, even as semiconductor sales rose and shipments to China dropped less than 2 percent.84,85
The value of Korean exports fell 24 percent YOY in May due to weak demand and production disruption, as well as falling oil prices and fewer official working days. Imports dropped 21 percent.86 The decrease continued until August (exports fell by 10 percent
while imports fell by 16 percent). In September the country’s exports increased by 8 percent, the first increase since the outbreak of COVID-19. Imports also increased by 1 percent.87,88
● Singapore: Unlike most Asian countries, Singapore’s exports increased YOY in March (non-oil domestic exports increased 18 percent, the highest since October 2017),89 despite projections that exports would fall by 12 percent. Compared with the previous month, exports rose a seasonally adjusted 13 percent in March, versus a median estimate for a 13 percent contraction. This increase was primarily boosted by surge in gold shipments, suggesting global concern of volatility ahead.90,91,92,93 Additional data show that the country’s merchandise trade increased by 0.5 percent in 1Q20 before falling by 15 percent in 2Q20.94
-30%
-20%
-10%
0%
10%
20%
2020M062020M052020M042020M032020M022020M01 2020M062020M052020M042020M032020M022020M01
WorldEMDEs Asia
AEsEMDEs Europe
EMDEsEMDEs Africa
-30%
-20%
-10%
0%
10%
20%
30%
Euro AreaKorea
CanadaSingapore
JapanUnited States
-35%
-25%
-15%
-5%0%5%
15%
25%
WorldEMDEs Asia
AEsEMDEs Europe
EMDEsEMDEs Africa
2020M062020M052020M042020M032020M022020M01
-40%
-20%
0%
20%
40%
KenyaBangladesh
NigeriaChina
UgandaIndia
2020M062020M052020M042020M032020M022020M01-0.5-0.4-0.3-0.2-0.10.00.10.20.30.4
KenyaBangladesh
NigeriaChina
UgandaIndia
2020M062020M052020M042020M032020M022020M01
-35%
-25%
-15%
-5%0%5%
15%
25%
Euro AreaKorea
CanadaSingapore
JapanUnited States
2020M062020M052020M042020M032020M022020M01
Annex 1.3: Monthly trade trends
Source: IMF Direction of Trade Statistics (DOTS)
Exports growth by development level
Exports growth for a sample of AEs
Exports growth for a sample of EMDEs
Imports growth by development level
Imports growth for a sample of AEs
Imports growth for a sample of EMDEs
17
Annex 2: Top ten exporters and importers (annual percentage change, 2019)
EXPORTS IMPORTS
Rank ExportersAnnual percentage
change 2019Rank Importers
Annual percentage change 2019
1 China 0% 1 United States of America -2%
2 United States of America -1% 2 China -3%
3 Germany -5% 3 Germany -4%
4 Netherlands -2% 4 Japan -4%
5 Japan -4% 5 United Kingdom 3%
6 France -2% 6 France -3%
7 Korea, Republic of -10% 7 Netherlands -1%
8 Hong Kong China -6% 8 Hong Kong China -8%
9 Italy -3% 9 Korea, Republic of -6%
10 United Kingdom -4% 10 India -6%
Source: Data from WTO secretariat
Annex 3: Monthly Commodity prices nominal US dollars from January 2000 to July 2020
Source: World Bank Commodity Price Data
Note: The average price represents the average of Crude oil Brent, Crude oil Dubai and Crude oil WTI prices
Energy Agriculture Precious Metals
0
30
60
90
120
150
Jan-
00
Jan-
01
Jan-
02
Jan-
03
Jan-
04
Jan-
05
Jan-
06
Jan-
07
Jan-
08
Jan-
09
Jan-
10
Jan-
11
Jan-
12
Jan-
13
Jan-
14
Jan-
15
Jan-
16
Jan-
18
Jan-
17
Jan-
19
Jan-
20Ju
l-20
0
50
100
150
200
Jan-
00
Jan-
01
Jan-
02
Jan-
03
Jan-
04
Jan-
05
Jan-
06
Jan-
07
Jan-
08
Jan-
09
Jan-
10
Jan-
11
Jan-
12
Jan-
13
Jan-
14
Jan-
15
Jan-
16
Jan-
18
Jan-
17
Jan-
19
Jan-
20Ju
l-20
(a) Commodity prices indices 2010=100 (b) Crude oil prices, average ($/bbl)

18
Annex 4: Restrictive measures and lockdown periods
Table A4-1: Kenya’s restrictive measures (2020)
MEASURES PERIOD 1 PERIOD 2
Require closing (or work from home) for some sectors or categories of workersFrom March 24 to
August 31—
Require closing (or work from home) for all-but-essential workplaces (e.g., grocery stores, doctors)
— —
Require not leaving house with exceptions for daily exercise, grocery shopping, and ‘essential’ trips
From March 27 to April 5
From June 23 to August 31
Require not leaving house with minimal exceptions* From April 6 to June 22 —
Internal movement restrictions in placeFrom March 27 to
July 6—
Ban on all regions or total border closureFrom March 17 to
July 31—
Source: Thomas Hale, Sam Webster, Anna Petherick, Toby Phillips, and Beatriz Kira (2020). Oxford COVID-19 Government Response Tracker, Blavatnik School of Government
*e.g., allowed to leave once a week, or only one person can leave at a time, etc.
Table A4-2: Nigeria’s restrictive measures (2020)
MEASURES PERIOD 1 PERIOD 2
Require closing (or work from home) for some sectors or categories of workersFrom May 04 to
August 13—
Require closing (or work from home) for all-but-essential workplaces (e.g., grocery stores, doctors)
From March 29 to May 03
—
Require not leaving house with exceptions for daily exercise, grocery shopping, and ‘essential’ trips
From March 29 to May 03
From June 23 to August 31
Require not leaving house with minimal exceptions* — —
Internal movement restrictions in placeFrom March 29 to
June 30From August 14 to
August 24
Ban on all regions or total border closureFrom March 23 to
August 13—
Source: Thomas Hale, Sam Webster, Anna Petherick, Toby Phillips, and Beatriz Kira (2020). Oxford COVID-19 Government Response Tracker, Blavatnik School of Government
*e.g., allowed to leave once a week, or only one person can leave at a time, etc.)
Table A4-3: Uganda’s restrictive measures (2020)
MEASURES PERIOD 1 PERIOD 2
Require closing (or work from home) for some sectors or categories of workersFrom April 23 to
August 31—
Require closing (or work from home) for all-but-essential workplaces (e.g., grocery stores, doctors)
From March 27 to April 22
—
Require not leaving house with exceptions for daily exercise, grocery shopping, and ‘essential’ trips
From March 27 to May 25
From July 09 to August 31
Require not leaving house with minimal exceptions* — —
Internal movement restrictions in placeFrom March 27 to
August 31-
Ban on all regions or total border closureFrom March 20 to
August 31—
Source: Thomas Hale, Sam Webster, Anna Petherick, Toby Phillips, and Beatriz Kira (2020). Oxford COVID-19 Government Response Tracker, Blavatnik School of Government
*e.g., allowed to leave once a week, or only one person can leave at a time, etc.)
19
Table A4-4: India’s restrictive measures (2020)
MEASURES PERIOD 1 PERIOD 2 PERIOD 3
Require closing for some sectors or categories of workersFrom April 20 to
May 31From June 18 to
June 30From July 10 to
August25
Require closing (or work from home) for all-but-essential workplaces*From March 21 to
April 19— —
Require not leaving house with exceptions** From May 04 to
August 25— —
Require not leaving house with minimal exceptions***From March 22 to
May 03— —
Internal movement restrictions in placeFrom March 20 to
August 25— —
Ban on all regions or total border closure From 22 to May 17From July 1 to
August 25—
Source: Thomas Hale, Sam Webster, Anna Petherick, Toby Phillips, and Beatriz Kira (2020). Oxford COVID-19 Government Response Tracker, Blavatnik School of Government
* e.g., grocery stores, doctors; ** Exceptions: daily exercise, grocery shopping, and ‘essential’ trips; *** e.g., allowed to leave once a week, or only one person can leave at a time, etc.)
Table A4-5: Bangladesh’s restrictive measures (2020)
MEASURES PERIOD 1 PERIOD 2 PERIOD 3
Require closing for some sectors or categories of workersFrom May 1 to
May 16— —
Require closing (or work from home) for all-but-essential workplaces*From March 19 to
April 30From May 17 to
May 30From July 16 to
August 33
Require not leaving house with exceptions** From April 10 to
May 30From March 19 to
March 24From June 16 to
August 23
Require not leaving house with minimal exceptions*** — — —
Internal movement restrictions in placeFrom March 19 to
April 30—
Ban on all regions or total border closure — — —
Source: Thomas Hale, Sam Webster, Anna Petherick, Toby Phillips, and Beatriz Kira (2020). Oxford COVID-19 Government Response Tracker, Blavatnik School of Government
* e.g., grocery stores, doctors; ** Exceptions: daily exercise, grocery shopping, and ‘essential’ trips; *** e.g., allowed to leave once a week, or only one person can leave at a time, etc.)
Table A4-6: China’s restrictive measures (2020)
MEASURES PERIOD 1 PERIOD 2
Require closing (or work from home) for some sectors or categories of workers From April 3 to May 9 —
Require closing (or work from home) for all-but-essential workplaces (e.g., grocery stores, doctors)
From January 26 to April 22
From May 10 to August 27
Require not leaving house with exceptions for daily exercise, grocery shopping, and ‘essential’ trips
— —
Require not leaving house with minimal exceptions* February 1 to April 7From May 10 to
August 27
Internal movement restrictions in placeFrom January 23 to
April 7From May 10 to
August 27
Ban on all regions or total border closureFrom March 26 to
August 27—
Source: Thomas Hale, Sam Webster, Anna Petherick, Toby Phillips, and Beatriz Kira (2020). Oxford COVID-19 Government Response Tracker, Blavatnik School of Government
*e.g., allowed to leave once a week, or only one person can leave at a time, etc.)

20
Annex 5: Countries’ top trade partners, trade share by country and products groupAnnex 5.1: Kenya
Table A5.1-1: Kenya’s top 15 export and import trading partners
Rank Top Export partners (2019)
Share in value in Kenya’s
exports (2019)
Kenya’s Exports growth in value
(1Q20) Rank Top import
partners (2019)
Share in value in Kenya’s
imports (2019)
Kenya’s Imports growth in value
(1Q20)
1 Uganda 11% 13% 1 China 21% -29%
2United States of America
9% 4% 2 India 10% 33%
3 Netherlands 8% 17% 3 United Arab Emirates 10% -38%
4 Pakistan 8% 7% 4 Saudi Arabia 7% -15%
5 United Kingdom 7% 31% 5 Japan 6% -19%
6 United Arab Emirates 7% 71% 6 South Africa 4% 5%
7 Tanzania 6% -12% 7United States of America
3% -3%
8 Rwanda 4% -2% 8 Indonesia 3% 71%
9 Egypt 3% 19% 9 Germany 3% -6%
10 China 3% -1% 10 Egypt 2% -6%
11Congo, Democratic Republic
2% -2% 11 Uganda 2% -30%
12 South Sudan 2% 156% 12 United Kingdom 2% -22%
13 Somalia 2% -10% 13 Russian Federation 2% -34%
14 Germany 2% 50% 14 Netherlands 2% 121%
15 Saudi Arabia 2% -21% 15 Tanzania 2% -3%
Source: Data from the International Trade Center database
Table A5.1-2: Kenya’s top 15 exported products
Rank Top Exported products (2019)Share in value in country’s cluster
exports (2019)
Kenya’s Exports growth in value
(1Q20)
1 Coffee, tea, maté and spices 23% 14%
2Live trees and other plants; bulbs, roots and the like; cut flowers and ornamental foliage
11% 41%
3Mineral fuels, mineral oils and products of their distillation; bituminous substances; mineral ...
8% 121%
4 Articles of apparel and clothing accessories, not knitted or crocheted 4% -14%
5 Edible vegetables and certain roots and tubers 4% 39%
6 Edible fruit and nuts; peel of citrus fruit or melons 4% 24%
7 Ores, slag and ash 3% 34%
8Animal or vegetable fats and oils and their cleavage products; prepared edible fats; animal ...
2% 16%
9 Iron and steel 2% 7%
10 Machinery, mechanical appliances, nuclear reactors, boilers; parts thereof 2% -15%
11 Tobacco and manufactured tobacco substitutes 2% 64%
12 Preparations of vegetables, fruit, nuts or other parts of plants 2% -3%
13 Pharmaceutical products 2% 3%
14 Plastics and articles thereof 2% 3%
15 Articles of apparel and clothing accessories, knitted or crocheted 2% 9%
Source: Data from the International Trade Center database
Classification: Harmonized Commodity Description and Coding System, 2002; 2-digit level
21
Table A5.1-3: Kenya’s top 15 imported products
Rank Top Imported products (2019)Share in value in country’s cluster
imports (2019)
Kenya’s Imports growth in value
(1Q20)
1Mineral fuels, mineral oils and products of their distillation; bituminous substances; mineral ...
19% -1%
2 Machinery, mechanical appliances, nuclear reactors, boilers; parts thereof 10% -24%
3Electrical machinery and equipment and parts thereof; sound recorders and reproducers, television ...
7% -17%
4Vehicles other than railway or tramway rolling stock, and parts and accessories thereof
7% -5%
5 Iron and steel 5% -2%
6 Cereals 5% 16%
7 Plastics and articles thereof 4% 5%
8Animal or vegetable fats and oils and their cleavage products; prepared edible fats; animal ...
3% 60%
9 Pharmaceutical products 3% -7%
10 Paper and paperboard; articles of paper pulp, of paper or of paperboard 2% -13%
11 Sugars and sugar confectionery 2% 12%
12 Articles of iron or steel 2% -30%
13 Miscellaneous chemical products 2% 4%
14 Fertilizers 2% 89%
15 Ships, boats and floating structures 1% -96%
Source: Data from the International Trade Center database
Classification: Harmonized Commodity Description and Coding System, 2002; 2-digit level
Annex 5.2: Nigeria
Table A5.2-1: Nigeria’s top 15 export and import trading partners
Rank Top Export partners (2019) Share in value in Nigeria’s exports (2019) Rank Top import partners (2019) Share in value in
Nigeria’s imports (2019)
1 India 15% 1 China 26%
2 Spain 10% 2 India 12%
3 Netherlands 9% 3 United States of America 10%
4 Ghana 8% 4 Netherlands 7%
5 France 7% 5 Belgium 5%
6 South Africa 6% 6 Eswatini 3%
7 United States of America 5% 7 Germany 3%
8 Italy 4% 8 United Kingdom 3%
9 China 3% 9 United Arab Emirates 3%
10 Indonesia 3% 10 Korea, Republic 2%
11 Turkey 3% 11 France 2%
12 Canada 3% 12 Italy 2%
13 United Kingdom 2% 13 Russian Federation 2%
14 Côte d’Ivoire 2% 14 Japan 2%
15 Germany 2% 15 Brazil 2%
Source: Data from the International Trade Center database
22
Table A5.2-2: Nigeria’s top 15 exported products
Rank Top Exported products (2019) Share in value in country’s cluster exports (2019)
1Mineral fuels, mineral oils and products of their distillation; bituminous substances; mineral ...
87%
2 Ships, boats and floating structures 6%
3 Miscellaneous articles of base metal 4%
4 Cocoa and cocoa preparations 1%
5Oil seeds and oleaginous fruits; miscellaneous grains, seeds and fruit; industrial or medicinal ...
1%
6 Fertilizers 0.3%
7 Edible fruit and nuts; peel of citrus fruit or melons 0.2%
8 Tobacco and manufactured tobacco substitutes 0.2%
9 Raw hides and skins (other than Furskins) and leather 0.1%
10 Aircraft, spacecraft, and parts thereof 0.1%
11 Aluminum and articles thereof 0.1%
12 Plastics and articles thereof 0.1%
13 Lead and articles thereof 0.1%
14 Rubber and articles thereof 0.1%
15 Salt; Sulphur; earths and stone; plastering materials, lime and cement 0.1%
Source: Data from the International Trade Center database
Classification: Harmonized Commodity Description and Coding System, 2002; 2-digit level
Table A5.2-3: Nigeria’s top 15 imported products
Rank Top Imported products (2019) Share in value in country’s cluster imports (2019)
1 Machinery, mechanical appliances, nuclear reactors, boilers; parts thereof 19%
2Mineral fuels, mineral oils and products of their distillation; bituminous substances; mineral ...
16%
3Vehicles other than railway or tramway rolling stock, and parts and accessories thereof
12%
4Electrical machinery and equipment and parts thereof; sound recorders and reproducers, television ...
8%
5Optical, photographic, cinematographic, measuring, checking, precision, medical or surgical ...
7%
6 Plastics and articles thereof 3%
7 Glass and glassware 3%
8 Pharmaceutical products 3%
9 Cereals 3%
10 Articles of iron or steel 2%
11Printed books, newspapers, pictures and other products of the printing industry; manuscripts, ...
2%
12 Fish and crustaceans, mollusks and other aquatic invertebrates 2%
13 Ships, boats and floating structures 2%
14 Miscellaneous chemical products 2%
15 Iron and steel 1%
Source: Data from the International Trade Center database
Classification: Harmonized Commodity Description and Coding System, 2002; 2-digit level

23
Annex 5.3: Uganda
Table A5.3-1: Uganda’s top 15 export and import trading partners
Rank Top Export partners (2018) Share in value in Uganda’s exports (2018) Rank Top Import partners (2018) Share in value in
Uganda’s imports (2018)
1 Kenya 19% 1 China 18%
2 United Arab Emirates 18% 2 India 12%
3 Sudan 13% 3 United Arab Emirates 12%
4 Rwanda 7% 4 Saudi Arabia 9%
5 Congo, Democratic Republic 7% 5 Kenya 8%
6 Italy 4% 6 Japan 5%
7 Netherlands 4% 7 South Africa 5%
8 Germany 3% 8 Tanzania, United Republic 4%
9 Belgium 2% 9 Indonesia 3%
10 Tanzania, United Republic 2% 10 Germany 2%
11 Hong Kong, China 2% 11 United States of America 2%
12 United States of America 1% 12 Russian Federation 2%
13 India 1% 13 Egypt 2%
14 Burundi 1% 14 United Kingdom 1%
15 Spain 1% 15 Netherlands 1%
Source: Data from the International Trade Center database
Table A5.3-2: Uganda’s top 15 exported products
Rank Top Exported products (2019) Share in value in country’s cluster exports (2019)
1 Coffee, tea and spices 34%
2 Fish and crustaceans, mollusks and other aquatic invertebrates 12%
3Dairy produce; birds’ eggs; natural honey; edible products of animal origin, not elsewhere ...
10%
4 Cocoa and cocoa preparations 5%
5Live trees and other plants; bulbs, roots and the like; cut flowers and ornamental foliage
5%
6 Tobacco and manufactured tobacco substitutes 4%
7Oil seeds and oleaginous fruits; miscellaneous grains, seeds and fruit; industrial or medicinal ...
3%
8 Wood and articles of wood; wood charcoal 3%
9 Sugars and sugar confectionery 3%
10 Cotton 3%
11 Edible vegetables and certain roots and tubers 2%
12 Pharmaceutical products 1%
13 Commodities not elsewhere specified 1%
14Animal or vegetable fats and oils and their cleavage products; prepared edible fats; animal ...
1%
15 Iron and steel 1%
Source: Data from the International Trade Center database
Classification: Harmonized Commodity Description and Coding System, 2002; 2-digit level

24
Table A5.3-3: Uganda’s top 15 imported products
Rank Top Imported products (2019) Share in value in country’s cluster imports (2019)
1 Machinery, mechanical appliances, nuclear reactors, boilers; parts thereof 12%
2 Pharmaceutical products 10%
3Vehicles other than railway or tramway rolling stock, and parts and accessories thereof
9%
4Electrical machinery and equipment and parts thereof; sound recorders and reproducers, television ...
9%
5 Iron and steel 4%
6 Aircraft, spacecraft, and parts thereof 4%
7 Plastics and articles thereof 4%
8 Cereals 3%
9 Miscellaneous chemical products 3%
10Optical, photographic, cinematographic, measuring, checking, precision, medical or surgical ...
3%
11 Articles of iron or steel 3%
12 Paper and paperboard; articles of paper pulp, of paper or of paperboard 2%
13Animal or vegetable fats and oils and their cleavage products; prepared edible fats; animal ...
2%
14 Essential oils and resinoids; perfumery, cosmetic or toilet preparations 2%
15Other made-up textile articles; sets; worn clothing and worn textile articles; rags
2%
Source: Data from the International Trade Center database
Classification: Harmonized Commodity Description and Coding System, 2002; 2-digit level
Annex 5.4: India
Table A5.4-1: India’s top 15 export and import trading partners
Rank Top Export partners (2019) Share in value in India’s exports (2019) Rank Top Import partners (2019) Share in value in India’s
imports (2019)
1 United States of America 17% 1 China 14%
2 United Arab Emirates 9% 2 United States of America 7%
3 China 5% 3 United Arab Emirates 6%
4 Hong Kong, China 4% 4 Saudi Arabia 6%
5 Singapore 3% 5 Iraq 5%
6 Netherlands 3% 6 Switzerland 4%
7 United Kingdom 3% 7 Hong Kong, China 4%
8 Germany 3% 8 Korea, Republic of 3%
9 Bangladesh 3% 9 Indonesia 3%
10 Nepal 2% 10 Singapore 3%
11 Malaysia 2% 11 Japan 3%
12 Belgium 2% 12 Germany 3%
13 Saudi Arabia 2% 13 Nigeria 2%
14 Viet Nam 2% 14 Australia 2%
15 France 2% 15 Malaysia 2%
Source: Data from the International Trade Center database

25
Table A5.4-2: India’s top 15 exported products
Rank Top Exported products (2019) Share in value in country’s cluster exports (2019)
1Mineral fuels, mineral oils and products of their distillation; bituminous substances; mineral ...
14%
2Natural or cultured pearls, precious or semi-precious stones, precious metals, metals clad ...
11%
3 Machinery, mechanical appliances, nuclear reactors, boilers; parts thereof 7%
4 Organic chemicals 6%
5Vehicles other than railway or tramway rolling stock, and parts and accessories thereof
5%
6 Pharmaceutical products 5%
7Electrical machinery and equipment and parts thereof; sound recorders and reproducers, television ...
5%
8 Iron and steel 3%
9 Articles of apparel and clothing accessories, not knitted or crocheted 3%
10 Articles of apparel and clothing accessories, knitted or crocheted 2%
11 Plastics and articles thereof 2%
12 Articles of iron or steel 2%
13 Cereals 2%
14 Fish and crustaceans, mollusks and other aquatic invertebrates 2%
15 Cotton 2%
Source: Data from the International Trade Center database
Classification: Harmonized Commodity Description and Coding System, 2002; 2-digit level
Table A5.4-3: India’s top 15 imported products
Rank Top Imported products (2019) Share in value in country’s cluster imports (2019)
1Mineral fuels, mineral oils and products of their distillation; bituminous substances; mineral ...
32%
2Natural or cultured pearls, precious or semi-precious stones, precious metals, metals clad ...
12%
3Electrical machinery and equipment and parts thereof; sound recorders and reproducers, television ...
11%
4 Machinery, mechanical appliances, nuclear reactors, boilers; parts thereof 9%
5 Organic chemicals 4%
6 Plastics and articles thereof 3%
7 Iron and steel 2%
8Animal or vegetable fats and oils and their cleavage products; prepared edible fats; animal ...
2%
9Optical, photographic, cinematographic, measuring, checking, precision, medical or surgical ...
2%
10 Fertilizers 2%
11Inorganic chemicals; organic or inorganic compounds of precious metals, of rare-earth metals, ...
1%
12 Miscellaneous chemical products 1%
13Vehicles other than railway or tramway rolling stock, and parts and accessories thereof
1%
14 Copper and articles thereof 1%
15 Articles of iron or steel 1%
Source: Data from the International Trade Center database
Classification: Harmonized Commodity Description and Coding System, 2002; 2-digit level

26
Annex 5.5: Bangladesh
Table A5.5-1: Bangladesh’s top 15 export and import trading partners
Rank Top Export partners (2015)Share in value in
Bangladesh’s exports (2015)
Rank Top Import partners (2015)Share in value in
Bangladesh’s imports (2015)
1 United States of America 19% 1 China 22%
2 Germany 15% 2 India 12%
3 United Kingdom 11% 3 Singapore 9%
4 Spain 6% 4 Hong Kong, China 6%
5 France 6% 5 Indonesia 5%
6 Italy 4% 6 Japan 4%
7 Canada 3% 7 Korea, Republic 3%
8 Japan 3% 8 Malaysia 3%
9 Belgium 3% 9 Brazil 3%
10 Netherlands 3% 10 Kuwait 3%
11 China 2% 11 Taipei, Chinese 2%
12 Australia 2% 12 United States of America 2%
13 Turkey 2% 13 United Arab Emirates 2%
14 Denmark 2% 14 Germany 2%
15 Poland 2% 15 Thailand 2%
Source: Data from the International Trade Center database
Table A5.5-2: Bangladesh’s top 15 exported products
Rank Top Exported products (2019) Share in value in country’s cluster exports (2019)
1 Articles of apparel and clothing accessories, knitted or crocheted 45%
2 Articles of apparel and clothing accessories, not knitted or crocheted 42%
3 Footwear, gaiters and the like; parts of such articles 2%
4Other made-up textile articles; sets; worn clothing and worn textile articles; rags
2%
5 Other vegetable textile fibers; paper yarn and woven fabrics of paper yarn 1%
6 Fish and crustaceans, mollusks and other aquatic invertebrates 1%
7Articles of leather; saddlery and harness; travel goods, handbags and similar containers; articles ...
1%
8 Headgear and parts thereof 1%
9 Raw hides and skins (other than Furskins) and leather 0%
10 Plastics and articles thereof 0%
11 Tobacco and manufactured tobacco substitutes 0%
12Optical, photographic, cinematographic, measuring, checking, precision, medical or surgical ...
0%
13Prepared feathers and down and articles made of feathers or of down; artificial flowers; articles ...
0%
14Animal or vegetable fats and oils and their cleavage products; prepared edible fats; animal ...
0%
15Vehicles other than railway or tramway rolling stock, and parts and accessories thereof
0%
Source: Data from the International Trade Center database
Classification: Harmonized Commodity Description and Coding System, 2002; 2-digit level

27
Table A5.5-3: Bangladesh’s top 15 imported products
Rank Top Imported products (2019) Share in value in country’s cluster imports (2019)
1 Cotton 11%
2 Machinery, mechanical appliances, nuclear reactors, boilers; parts thereof 11%
3Mineral fuels, mineral oils and products of their distillation; bituminous substances; mineral ...
9%
4Electrical machinery and equipment and parts thereof; sound recorders and reproducers, television ...
6%
5 Iron and steel 5%
6 Plastics and articles thereof 4%
7 Man-made staple fibers 3%
8Vehicles other than railway or tramway rolling stock, and parts and accessories thereof
3%
9 Man-made filaments; strip and the like of man-made textile materials 3%
10 Knitted or crocheted fabrics 3%
11Animal or vegetable fats and oils and their cleavage products; prepared edible fats; animal ...
2%
12 Cereals 2%
13 Articles of iron or steel 2%
14Oil seeds and oleaginous fruits; miscellaneous grains, seeds and fruit; industrial or medicinal ...
2%
15 Organic chemicals 2%
Source: Data from the International Trade Center database
Classification: Harmonized Commodity Description and Coding System, 2002; 2-digit level
Annex 5.6: China
Table A5.6-1: China’s top 15 export and import trading partners
Rank Top Export partners (2019)
Share in value in China’s
exports (2019)
China’s Exports growth in value
(1Q20)Rank Top Import
partners (2019)
Share in value in China’s
imports (2019)
China’s Imports growth in value
(1Q20)
1United States of America
17% -35% 1 Korea, Republic 8% -15%
2 Hong Kong, China 11% -35% 2 Taipei, Chinese 8% -9%
3 Japan 6% -19% 3 Japan 8% -8%
4 Korea, Republic 4% -20% 4 China 6% -15%
5 Viet Nam 4% -25% 5United States of America
6% -17%
6 Germany 3% -25% 6 Australia 6% -7%
7 India 3% -16% 7 Germany 5% -13%
8 Netherlands 3% -33% 8 Brazil 4% -1%
9 United Kingdom 3% -35% 9 Malaysia 4% -8%
10 Taipei, Chinese 2% -18% 10 Viet Nam 3% 0%
11 Singapore 2% -27% 11 Russian Federation 3% 11%
12 Malaysia 2% -26% 12 Saudi Arabia 3% 33%
13 Russian Federation 2% -33% 13 Thailand 2% -10%
14 Australia 2% -31% 14 Singapore 2% -5%
15 Mexico 2% -23% 15 Indonesia 2% -13%
Source: Data from the International Trade Center database

28
Table A5.6-2: China’s top 15 exported products
Rank Top Exported products (2019)Share in value in country’s cluster
exports (2019)
China’s Exports growth in value
(1Q20)
1 Electrical machinery and equipment and parts thereof; sound recorders and reproducers, television ... 27% -32%
2 Machinery, mechanical appliances, nuclear reactors, boilers; parts thereof 17% -26%
3 Furniture; bedding, mattresses, mattress supports, cushions and similar stuffed furnishings; ... 4% -38%
4 Plastics and articles thereof 3% -24%
5 Vehicles other than railway or tramway rolling stock, and parts and accessories thereof 3% -22%
6 Optical, photographic, cinematographic, measuring, checking, precision, medical or surgical ... 3% -22%
7 Articles of apparel and clothing accessories, knitted or crocheted 3% -39%
8 Articles of iron or steel 3% -29%
9 Articles of apparel and clothing accessories, not knitted or crocheted 3% -38%
10 Toys, games and sports requisites; parts and accessories thereof 3% -47%
11 Organic chemicals 2% 4%
12 Footwear, gaiters and the like; parts of such articles 2% -33%
13 Mineral fuels, mineral oils and products of their distillation; bituminous substances; mineral ... 2% -9%
14 Iron and steel 2% -2%
15 Articles of leather; saddlery and harness; travel goods, handbags and similar containers; articles ... 1% -41%
Source: Data from the International Trade Center database
Classification: Harmonized Commodity Description and Coding System, 2002; 2-digit level
Table A5.6-3: China’s top 15 imported products
Rank Top Imported products (2019)Share in value in country’s cluster
imports (2019)
China’s Imports growth in value
(1Q20)
1 Electrical machinery and equipment and parts thereof; sound recorders and reproducers, television ... 24% -19%
2 Mineral fuels, mineral oils and products of their distillation; bituminous substances; mineral ... 17% -5%
3 Machinery, mechanical appliances, nuclear reactors, boilers; parts thereof 9% -15%
4 Ores, slag and ash 8% -10%
5 Optical, photographic, cinematographic, measuring, checking, precision, medical or surgical ... 5% -21%
6 Vehicles other than railway or tramway rolling stock, and parts and accessories thereof 4% -19%
7 Plastics and articles thereof 3% -18%
8 Natural or cultured pearls, precious or semi-precious stones, precious metals, metals clad ... 3% -42%
9 Organic chemicals 3% -9%
10 Copper and articles thereof 2% -11%
11 Oil seeds and oleaginous fruits; miscellaneous grains, seeds and fruit; industrial or medicinal ... 2% -20%
12 Pharmaceutical products 2% -13%
13 Iron and steel 1% -5%
14 Wood and articles of wood; wood charcoal 1% -13%
15 Aircraft, spacecraft, and parts thereof 1% -65%
Source: Data from the International Trade Center database
Classification: Harmonized Commodity Description and Coding System, 2002; 2-digit level

29
Annex 6: Forecasts Released on April Shows that Merchandise Trade Volume Will Slump in 2020
Source: Data from WTO secretariat (April 2020).
Note: Opt. is the optimistic scenario; Pess. is the pessimistic scenario; Other regions comprise Africa, Middle East and Commonwealth of Independent States (CIS) including associate and former member States.
Opt. Exports Pess. Exports Opt. Imports Pess. Imports
-50%
-40%
-30%
-20%
-10%
0%
Other regionsAsiaEuropeSouth and
Central AmericaNorth America
References1 WTO (World Trade Organization). 2020. Trade set to plunge as COVID-19 pandemic upends global economy. GENEVA,
April 8. https://www.wto.org/english/news_e/pres20_e/pr855_e.htm
2 WTO (World Trade Organization). 2020. Trade set to plunge as COVID-19 pandemic upends global economy. GENEVA, April 8. https://www.wto.org/english/news_e/pres20_e/pr855_e.htm
3 WTO (World Trade Organization). 2020. Trade shows signs of rebound from COVID-19, recovery still uncertain. GENEVA, October 6. https://www.wto.org/english/news_e/pres20_e/pr862_e.htm
4 Antony Sguazzin. 2020. Coronavirus May Cost Africa $4.8 Billion in Crop Exports. Bloomberg, June 8. https://www.bloomberg.com/news/articles/2020-06-08/coronavirus-may-cost-africa-4-8-billion-in-agriculture-exports
5 WTO (World Trade Organization). 2017. Building Trade Capacity. GENEVA https://www.wto.org/english/tratop_e/de-vel_e/build_tr_capa_e.htm.
6 World Bank. 2020. World Development Report 2020: Trading for Development in the Age of Global Value Chains. Wash-ington, DC: World Bank. https://www.worldbank.org/en/publication/wdr2020
7 Kim, Dong-Hyeon, and Shu-Chin Lin. 2009. Trade and growth at different stages of economic development. Journal of Development Studies, 45(8), 1211-1224. https://www.tandfonline.com/doi/pdf/10.1080/00220380902862937?casa_to-ken=jvS3jHLKaB0AAAAA:VyI4U2hlqTHnkCbZIdbn3YtZY62PQd_3bGtkUZkRKocFRtUoJH9OMFv8KvNPwFCIPULlhyukVjuy-M3U

30
8 Herzer, Dierk. 2013. Cross-country heterogeneity and the trade-income relationship. World Development, 44, 194-211. https://www.econstor.eu/bitstream/10419/121027/1/N_026.pdf
9 Newfarmer, Richard, and Monika Sztajerowska. 2012. Trade and employment in a fast-changing world. Policy Prior-ities for International Trade and Jobs, 7-73. https://books.google.fr/books?hl=fr&lr=&id=m6XHBWxrZBIC&oi=fnd&p-g=PA7&ots=S6VcrCg2vd&sig=QOf2vju0qYw6oJfKUY_kBIg0vBQ&redir_esc=y#v=onepage&q&f=false
10 Musila, Jacob W., and Zelealem Yiheyis. 2015. The impact of trade openness on growth: The case of Kenya. Journal of Policy Modeling, 37(2), 342-354. https://www.sciencedirect.com/science/article/pii/S0161893815000137
11 Ulaşan, Bülent. 2015. Trade openness and economic growth: panel evidence. Applied Economics Letters, 22(2), 163-167. https://www.tandfonline.com/doi/pdf/10.1080/13504851.2014.931914?casa_token=E1aHHeR1MyEAAAAA:mfcrI-FZG1W7-LFl8AlQsQzjvguDkZZLXutvIbwX4pOzHP3yseRd-LIuvSLclIdHjlfZcBFfPezY7AqY
12 Chang, Roberto, Linda Kaltani, and Norman V. Loayza. 2009. Openness can be good for growth: The role of policy com-plementarities. Journal of development economics, 90(1), 33-49. https://www.nber.org/papers/w11787.pdf
13 Kim, Dong-Hyeon. 2011. Trade, growth and income. The Journal of International Trade & Economic Development, 20(5), 677-709. https://www.tandfonline.com/doi/pdf/10.1080/09638199.2011.538966?casa_token=LB6YJrAGfhkAAAAA:w9g-zHYyxeDHG_vHJ1MpItCji4NEGfNvuP6nQIazDeL_iFdMECfd8XYAli9uh-vfayxW4JvVQ0Dm71VY
14 Jouini, Jamel. 2015. Linkage between international trade and economic growth in GCC countries: Empirical evidence from PMG estimation approach. The journal of international trade & economic development, 24(3), 341-372. https://www.tandfonline.com/doi/pdf/10.1080/09638199.2014.904394?casa_token=XYAV173yEzwAAAAA:a3s0hw2tsS_qYtY-n2958Upl9JvKhNuO4qCmjuL9Dy4DIV_FAmfpseY-y7tAkTde4uEzzSQ-d-QNJ5x8
15 Olga Solleder, and Mauricio Torres Velasquez. 2020. The Great Shutdown: How COVID-19 disrupts supply chains. May 5. http://www.intracen.org/covid19/Blog/The-Great-Shutdown-How-COVID19-disrupts-supply-chains/
16 Fergal O’Brien. 2020. Global Trade Volumes Fall the Most in More Than a Decade. Bloomberg, May 25. https://www.bloomberg.com/news/articles/2020-05-25/global-trade-volumes-fall-the-most-in-more-than-a-decade
17 Sönke Maatsch and Dieter Stockmann. 2020. RWI/ISL container handling index: World trade is reviving on a wide range. https://www.isl.org/en/containerindex
18 IATA (International Air Transport Association). 2020. Air Cargo Market Analysis: Air cargo volumes fall further but load factors up sharply. April. https://www.iata.org/en/iata-repository/publications/economic-reports/Air-Freight-Monthly-Analysis-Apr-2020/
19 IATA (International Air Transport Association). 2020. Air Cargo Market Analysis: Air cargo traffic recovers slowly amid insufficient capacity. August. https://www.iata.org/en/iata-repository/publications/economic-reports/air-freight-monthly-analysis---august-2020/
20 IATA (International Air Transport Association). 2020. Air Cargo Market Analysis: Air cargo continued to recover in June, but at a slow pace. June. https://www.iata.org/en/iata-repository/publications/economic-reports/air-freight-monthly-analysis-june-202022/
21 IATA (International Air Transport Association). 2020. Air Cargo Market Analysis: Air cargo recovery continues amid improving economic activity. July. https://www.iata.org/en/iata-repository/publications/economic-reports/air-freight-monthly-analysis-july-2020/
22 Erin Duffin. 2020. Global Purchasing Manager Index (PMI) for manufacturing and new export orders from September 2017 to September 2020. Statistica, October 5. https://www.statista.com/statistics/1032013/global-purchasing-manag-er-index-manufacturing-new-export-orders/
23 WTO (World Trade Organization). 2020. WTO goods barometer flashes red as COVID-19 disrupts world trade. GENEVA, May 20. https://www.wto.org/english/news_e/news20_e/wtoi_19may20_e.htm
24 Fergal O’Brien. 2020. Global Trade Volumes Fall the Most in More Than a Decade. Bloomberg, May 25. https://www.bloomberg.com/news/articles/2020-05-25/global-trade-volumes-fall-the-most-in-more-than-a-decade
25 WTO (World Trade Organization). 2020. World merchandise trade fell 14% in volume, 21% in value in Q2 amid global lock-down. GENEVE, September 23. https://www.wto.org/english/news_e/news20_e/stat_23sep20_e.htm
26 Antony Sguazzin. 2020. Coronavirus May Cost Africa $4.8 Billion in Crop Exports. Bloomberg, June 8. https://www.bloomberg.com/news/articles/2020-06-08/coronavirus-may-cost-africa-4-8-billion-in-agriculture-exports

31
27 Philip TEOH. 2020. The Impact of the Covid-19 Pandemic on Shipping. The maritime executive, April 7. https://www.maritime-executive.com/editorials/the-impact-of-the-covid-19-pandemic-on-shipping
28 UNCTAD (United Nations Conference on Trade and Development). 2020. COVID-19 causes international trade to col-lapse. June. https://unctad.org/en/PublicationsLibrary/ditcmisc2020d2_en.pdf
29 World Bank. 2020. World Development Indicators (WDI). Washington, DC. https://databank.worldbank.org/source/world-development-indicators
30 Hannah Ritchie, Esteban Ortiz-Ospina, Diana Beltekian, Edouard Mathieu, Joe Hasell, Bobbie Macdonald, Charlie Giatti-no, and Max Roser. 2020. Coronavirus (COVID-19) Cases. October 9. https://ourworldindata.org/covid-cases
31 Huaxia. 2020. Kenya’s flower export to EU slumps amid COVID-19 outbreak. XINHUANET, March, 18. http://www.xin-huanet.com/english/2020-03/18/c_138888750.htm
32 Zeke Faux, David Herbling, and Ruben Munsterman. 2020. The Crash of the $8.5 Billion Global Flower Trade. Bloomberg, April 17. https://www.bloomberg.com/features/2020-flower-industry-crash/
33 Andrew Wasike. 2020. Kenya’s flower industry dying due to COVID-19. March 27. https://www.aa.com.tr/en/africa/ken-ya-s-flower-industry-dying-due-to-covid-19/1782378
34 CEIC.2020. https://www.ceicdata.com/en/country/kenya
35 CEIC.2020. https://www.ceicdata.com/en/indicator/kenya/total-imports-growth
36 World Bank. 2020. World Development Indicators (WDI). Washington, DC. https://databank.worldbank.org/source/world-development-indicators
37 Hannah Ritchie, Esteban Ortiz-Ospina, Diana Beltekian, Edouard Mathieu, Joe Hasell, Bobbie Macdonald, Charlie Giatti-no, and Max Roser. 2020. Coronavirus (COVID-19) Cases. October 9. https://ourworldindata.org/covid-cases
38 Tolani Awere. 2020. Nigeria Cocoa Exports Stalled Over Covid-19 Safety Protocols. Bloomberg, May 5. https://www.bloomberg.com/news/articles/2020-05-05/nigeria-cocoa-exports-stalled-over-covid-19-safety-protocols
39 Anthony Myers.2020. Nigerian cocoa faces serious economic crisis due to coronavirus outbreak. Confectionery News, June 29. https://www.confectionerynews.com/Article/2020/06/29/Nigerian-cocoa-faces-serious-economic-cri-sis-due-to-coronavirus-outbreak
40 NBS (National Bureau of Statistics).2020. https://www.nigerianstat.gov.ng/
41 NBS (National Bureau of Statistics).2020. https://www.nigerianstat.gov.ng/ and https://www.premiumtimesng.com/business/business-news/412096-nigerias-foreign-trade-slumps-in-q2-2020.html
42 Hannah Ritchie, Esteban Ortiz-Ospina, Diana Beltekian, Edouard Mathieu, Joe Hasell, Bobbie Macdonald, Charlie Giatti-no, and Max Roser. 2020. Coronavirus (COVID-19) Cases. October 9. https://ourworldindata.org/covid-cases
43 Daily Monitor. 2020. Exports, imports fall – BoU. June 1. https://www.monitor.co.ug/Business/Finance/Exports--imports-fall---BoU/688608-5568690-v7i9k6/index.html
44 https://furtherafrica.com/2020/09/28/ugandas-trade-deficit-and-exports-in-2020/
45 World Bank. 2020. World Development Indicators (WDI). Washington, DC. https://databank.worldbank.org/source/world-development-indicators
46 Hannah Ritchie, Esteban Ortiz-Ospina, Diana Beltekian, Edouard Mathieu, Joe Hasell, Bobbie Macdonald, Charlie Giatti-no, and Max Roser. 2020. Coronavirus (COVID-19) Cases. October 9. https://ourworldindata.org/covid-cases
47 Daniel Workman. 2020. Gold Imports by Country. World’s Top Exports, July 2. http://www.worldstopexports.com/inter-national-markets-for-imported-gold-by-country/
48 Reuters. 2020. India’s June gold imports plunge 86% due to record high prices. July 2. https://www.deccanchronicle.com/business/in-other-news/020720/indias-june-gold-imports-plunge-86-due-to-record-high-prices.html
49 Vaibhav Asher. 2020. Annual demand volume of gold across India from 2010 to 2019. Statistica, July 3. https://www-statista-com.ezproxy.uca.fr/statistics/896708/india-gold-demand-volume-annual/
50 Felix Thompson. 2020. Reserve Bank of India moves to help the country’s struggling exporters and importers. GTR, May 27. https://www.gtreview.com/news/asia/reserve-bank-of-india-moves-to-help-the-countrys-struggling-exporters-and-importers/

32
51 Pib Delhi.2020. India’s Foreign Trade. Ministry of Commerce & Industry, September 15. https://pib.gov.in/PressReleaseP-age.aspx?PRID=1654586
52 Stitchdiary.2020. What Makes Bangladesh — A Hub Of Garment Manufacturing?. July 18. https://medium.com/@stitchdi-ary/what-makes-bangladesh-a-hub-of-garment-manufacturing-ce83aa37edfc
53 Bangladesh Garment Manufacturers and Exporters Association. 2020. https://www.bgmea.com.bd/
54 Momotaj Begum, Shaikh Farid, Swarup Barua and Mohammad Jahangir Alam. 2020. COVID-19 and Bangladesh: So-cio-Economic Analysis Towards the Future Correspondence. https://www.preprints.org/manuscript/202004.0458/v1
55 Hannah Ritchie, Esteban Ortiz-Ospina, Diana Beltekian, Edouard Mathieu, Joe Hasell, Bobbie Macdonald, Charlie Giatti-no, and Max Roser. 2020. Coronavirus (COVID-19) Cases. October 9. https://ourworldindata.org/covid-cases
56 Bangladesh, Export promotion bureau. 2020. http://epb.gov.bd/site/view/epb_export_data/-
57 Ibid
58 Chauffour, Jean-Pierre and Farole, Thomas. 2009. Trade Finance in Crisis Market Adjustment or Market Failure? Policy Research Working Paper 5003, Washington, DC: World Bank. http://econ.tu.ac.th/archan/rangsun/ec%20460/ec%20460%20readings/global%20issues/Global%20Financial%20Crisis%202007-2009/Academic%20Works%20By%20Institu-ion/IBRD/Trade%20Finance%20in%20Crisis.pdf
59 CGFS (Committee on the Global Financial System). 2014. Trade finance: developments and issues. CGFS Papers No 50 January 2014. https://www.bis.org/publ/cgfs50.pdf
60 Susan Starnes, Michael Kurdyla, Arun Prakash, Ariane Volk and Shengnan Wang .2017. De-Risking and Other Chal-lenges in the Emerging Market Financial Sector. Washington, DC: IFC. http://documents.worldbank.org/curated/en/895821510730571841/De-risking-and-other-challenges-in-the-emerging-market-financial-sector-findings-from-IFC-s-survey-on-correspondent-banking
61 JPMorgan. 2020. What Will the Recovery Look Like From the COVID-19 Recession? April 10. https://www.jpmorgan.com/global/research/2020-covid19-recession-recovery
62 Forbes.2020. Covid-19-coronavirus-recession-shape. https://www.forbes.com/advisor/investing/covid-19-coronavi-rus-recession-shape/
63 Bloomberg.2020. China’s Trade Fell Less Than Expected But More Pain Lies Ahead. April 14. https://www.bloomberg.com/news/articles/2019-11-08/china-s-october-imports-exports-both-fall-less-than-expected
64 UNCTAD (United Nations Conference on Trade and Development). 2020. COVID-19 causes international trade to col-lapse. June. https://unctad.org/en/PublicationsLibrary/ditcmisc2020d2_en.pdf
65 The Economic Times. 2020. China exports see surprise 3.5% jump in April, imports fall. May 7. https://economictimes.indiatimes.com/news/international/business/china-exports-see-surprise-3-5-jump-in-april-imports-fall/article-show/75593686.cms?from=mdr
66 WTO (World Trade Organization). 2020. Monthly Trade Trends: June 2020 - July 2020. GENEVA, September 23. https://www.wto.org/english/res_e/statis_e/daily_update_e/month_latest.pdf
67 Adam Slater. 2020. Coronavirus is crushing world trade. Oxford Economics, April 28.
68 The Economic Times. 2020. China exports see surprise 3.5% jump in April, imports fall. May 7. https://economictimes.indiatimes.com/news/international/business/china-exports-see-surprise-3-5-jump-in-april-imports-fall/article-show/75593686.cms?from=mdr
69 Andreia Agostinho Dias and Diana Neves de Carvalho. 2020. Strategic cost-cutting and improvements in the innovation-corporate agenda. Exago. https://www.exago.com/wp-content/uploads/2017/10/Strategic-cost-cutting-and-improve-ments-in-the-innovation-corporate-agenda.pdf
70 Ewan Duncan and Ron Ritter. 2014. Next frontiers for lean. Mckinsey, February 1. https://www.mckinsey.com/busi-ness-functions/operations/our-insights/next-frontiers-for-lean
71 Robert H. Hayes and Gary P. Pisano.1994. Beyond World-Class: The New Manufacturing Strategy. Harvard Business Re-view. https://hbr.org/1994/01/beyond-world-class-the-new-manufacturing-strategy
72 World Bank. 2020. World Development Report 2020: Trading for Development in the Age of Global Value Chains. Wash-ington, DC: World Bank. https://www.worldbank.org/en/publication/wdr2020

33
73 Joe Mayes.2020. U.K. Seeks to Diversify Supply Chains as ‘Future Shock’ Defense. Bloomberg, May 22. https://www.bloomberg.com/news/articles/2020-05-22/u-k-seeks-to-diversify-supply-chains-as-future-shock-defense
74 Prinesha Naidoo. 2020. Free Trade to Help Africa Rebuild After Virus, Even If Delayed. Bloomberg, May 6. https://www.bloomberg.com/news/articles/2020-05-07/free-trade-to-help-africa-rebuild-after-virus-even-if-delayed
75 Joon Kim.2019. Addressing the Trade Finance Gap, International Banker. June 10. https://internationalbanker.com/fi-nance/addressing-the-trade-finance-gap/
76 BEA (The U.S. Bureau of Economic Analysis).2020. U.S. International Trade in Goods and Services, August 2020. https://www.bea.gov/news/2020/us-international-trade-goods-and-services-august-2020
77 Global Affairs Canada. 2020. Monthly Trade Report. https://www.international.gc.ca/economist-economiste/assets/pdfs/performance/MTR-RAPPORT_MENSUEL_SUR_LE_COMMERCE-ENG.pdf
78 Statistics Canada.2020. Canadian international merchandise trade. August. https://www150.statcan.gc.ca/n1/daily-quo-tidien/201006/dq201006a-eng.htm
79 Chad P. Bown. 2020. EU limits on medical gear exports put poor countries and Europeans at risk. PIIE, March 19. https://www.piie.com/blogs/trade-and-investment-policy-watch/eu-limits-medical-gear-exports-put-poor-countries-and
80 John Basquill. 2020. G20 trade volumes suffered steep Q1 decline, new figures show. GTR, May 28. https://www.gtreview.com/news/global/90213/
81 WTO (World Trade Organization). 2020. Second Quarter 2020 Merchandise Trade. GENEVA, September 23. https://www.wto.org/english/res_e/statis_e/daily_update_e/merch_latest.pdf
82 Jiyeun Lee, Yuko Takeo, and Yoshiaki Nohara. 2020. No Clear Sign That Worst Is Over for Global Trade, Asian Data Shows. Bloomberg, May 21. https://www.bloomberg.com/news/articles/2020-05-21/global-trade-still-not-clearly-past-the-worst-asian-data-shows?srnd=economics-vp
83 WTO (World Trade Organization). 2020. Monthly Trade Trends: June 2020 - July 2020. https://www.wto.org/english/res_e/statis_e/daily_update_e/month_latest.pdf
84 The Korean Ministry of Trade, Industry and Energy. 2020. Economic Bulletin, September 2020. September 25. https://english.moef.go.kr/pu/selectTbPublicDtl.do?boardCd=P0002&seq=
85 Jiyeun Lee, Yuko Takeo, and Yoshiaki Nohara. 2020. No Clear Sign That Worst Is Over for Global Trade, Asian Data Shows. Bloomberg, May 21. https://www.bloomberg.com/news/articles/2020-05-21/global-trade-still-not-clearly-past-the-worst-asian-data-shows?srnd=economics-vp
86 The Korean Ministry of Trade, Industry and Energy. 2020. Korea’s May exports fall 23.7% to $34.9 billion. June 1. https://en-glish.motie.go.kr/en/pc/pressreleases/bbs/bbsView.do?bbs_cd_n=2&bbs_seq_n=783
87 The Korean Ministry of Trade, Industry and Energy. 2020. Korea’s exports in August fall 9.9 percent to $39.7 billion. September 1. https://english.motie.go.kr/en/tp/tradeinvestrment/bbs/bbsView.do?bbs_seq_n=798&bbs_cd_n=2&view_type_v=TOPIC&¤tPage=1&search_key_n=&search_val_v=&cate_n=2
88 The Korean Ministry of Trade, Industry and Energy. 2020. Korea’s September exports post growth for first time since COVID-19, up 7.7% to $48.1 billion. October 7. https://english.motie.go.kr/en/tp/tradeinvestrment/bbs/bbsView.do?bbs_seq_n=803&bbs_cd_n=2&view_type_v=TOPIC&¤tPage=1&search_key_n=&search_val_v=&cate_n=2
89 Abhishek Vishnoi. 2020. Singapore Exports Show Surprising Rise From Last Year’s Base. Bloomberg, April 16. https://www.bloomberg.com/news/articles/2020-04-17/singapore-exports-show-surprise-rise-from-low-statistical-base
90 Ibid
91 Channel News Asia.2020. Singapore’s exports rise 17.6% in March, boosted by surge in gold shipments. April 17. https://www.channelnewsasia.com/news/business/exports-nodx-march-singapore-12650918
92 World Gold Council. https://www.gold.org/about-gold/gold-demand
93 Archit Gupta. 2020. How gold fares as investment in economic crisis? Financial Express, May 6. https://www.financialex-press.com/money/how-gold-fares-as-investment-in-economic-crisis/1950016/
94 MTI (Ministry of Trade and Industry). 2020. Narrows 2020 GDP Growth Forecast to “-7.0 to -5.0 Per Cent”. https://www.singstat.gov.sg/-/media/files/news/gdp2q2020.pdf

34
OCTOBER 2020