when ux (guy) meets operations
TRANSCRIPT

When UX (guy) Meets Operations
Tim Sheiner Velocity Conference 27 May 2015

When UX guy meets DevOps
2

?
When UX guy meets DevOps
2
DevOps
, he has a lot to learn

He uses a time-tested design process1. Personas
2. Mental Model
3. Analogy
4. Prototype
3
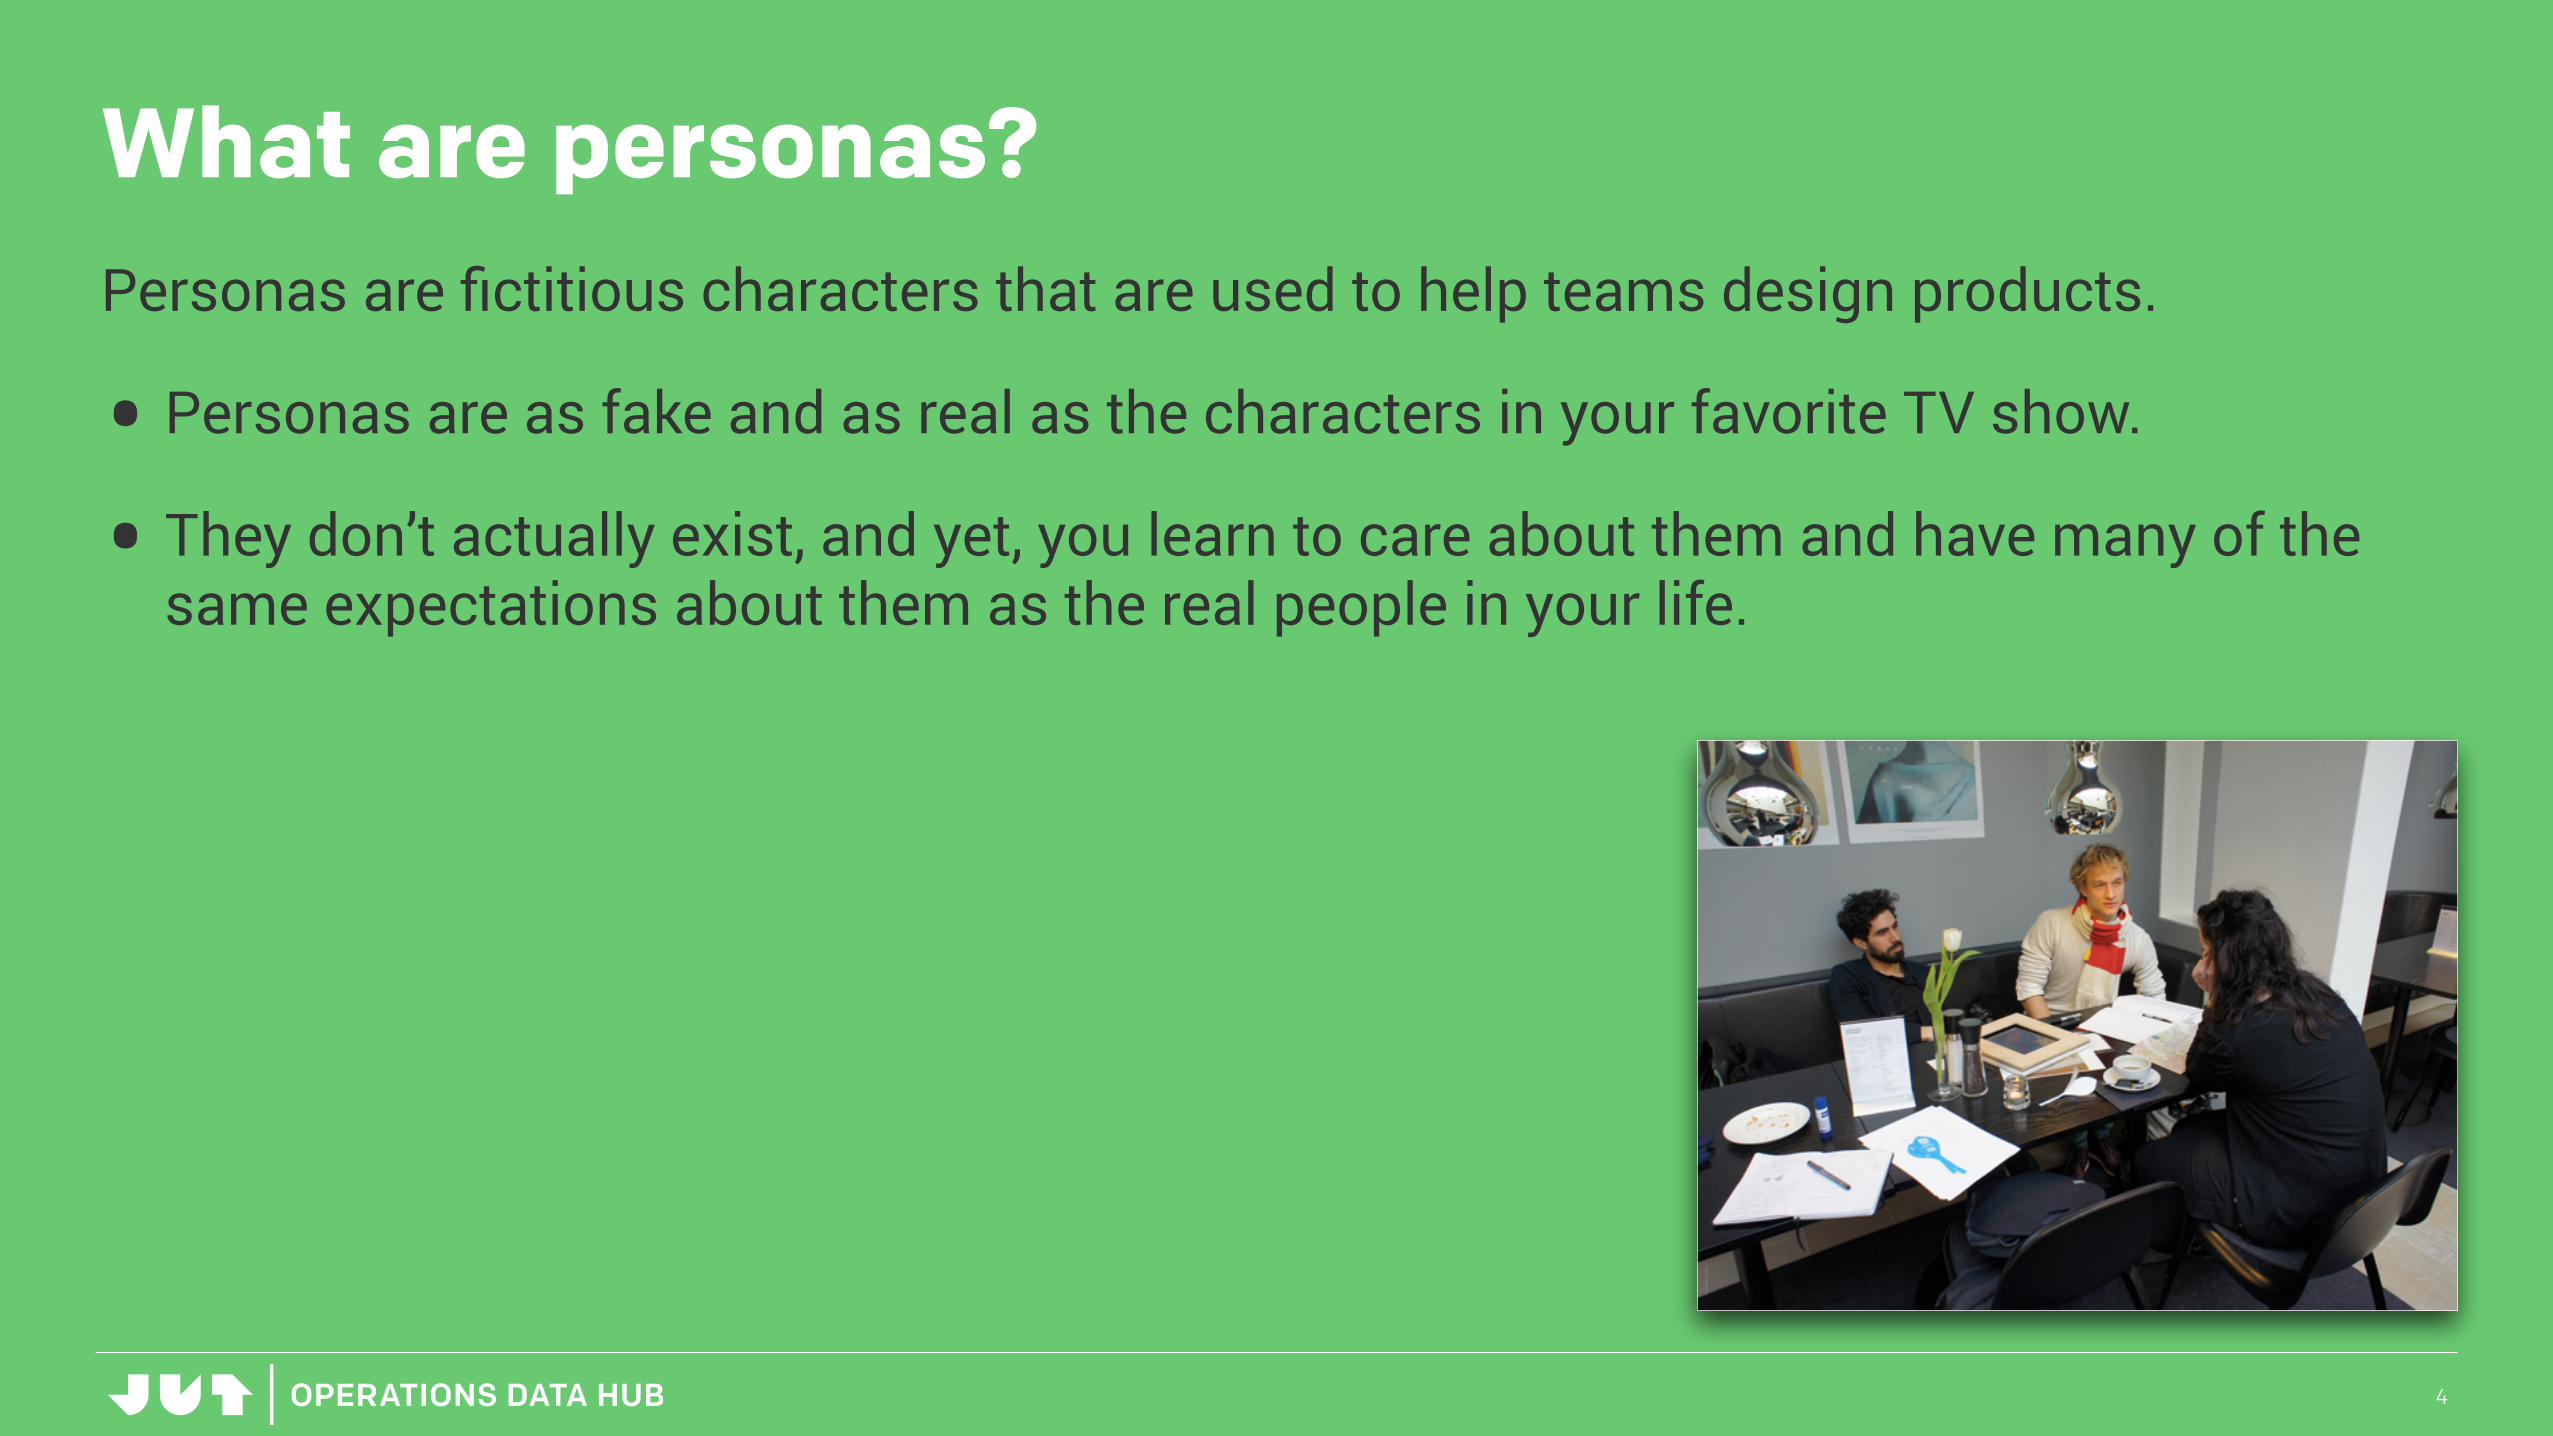
What are personas?Personas are fictitious characters that are used to help teams design products.
• Personas are as fake and as real as the characters in your favorite TV show.
• They don’t actually exist, and yet, you learn to care about them and have many of the same expectations about them as the real people in your life.
4

Why personas?Personas were created to address a too common product design communication problem.
5
Users want feature x.
Nope.

Why personas?The human instinct for empathy means we know how to share ideas about the behavior of people we know in common.
6
Kyle wants feature x.
Yup.

We use personas to tell product storiesTo help us create an accountable connection between the needs we gather during research and the agile stories we implement.
7
Mental Modelvalidate
iterate
Features
Prototypesvalidate
iterate

DevOps Persona
8
Customers
System
Increase capacity and resilience of the System
Protect the System Use the System to deliver features to customers
Future System
Thomas - The Architect
Kyle - The Ops Guy Jenny - The Dev Gal
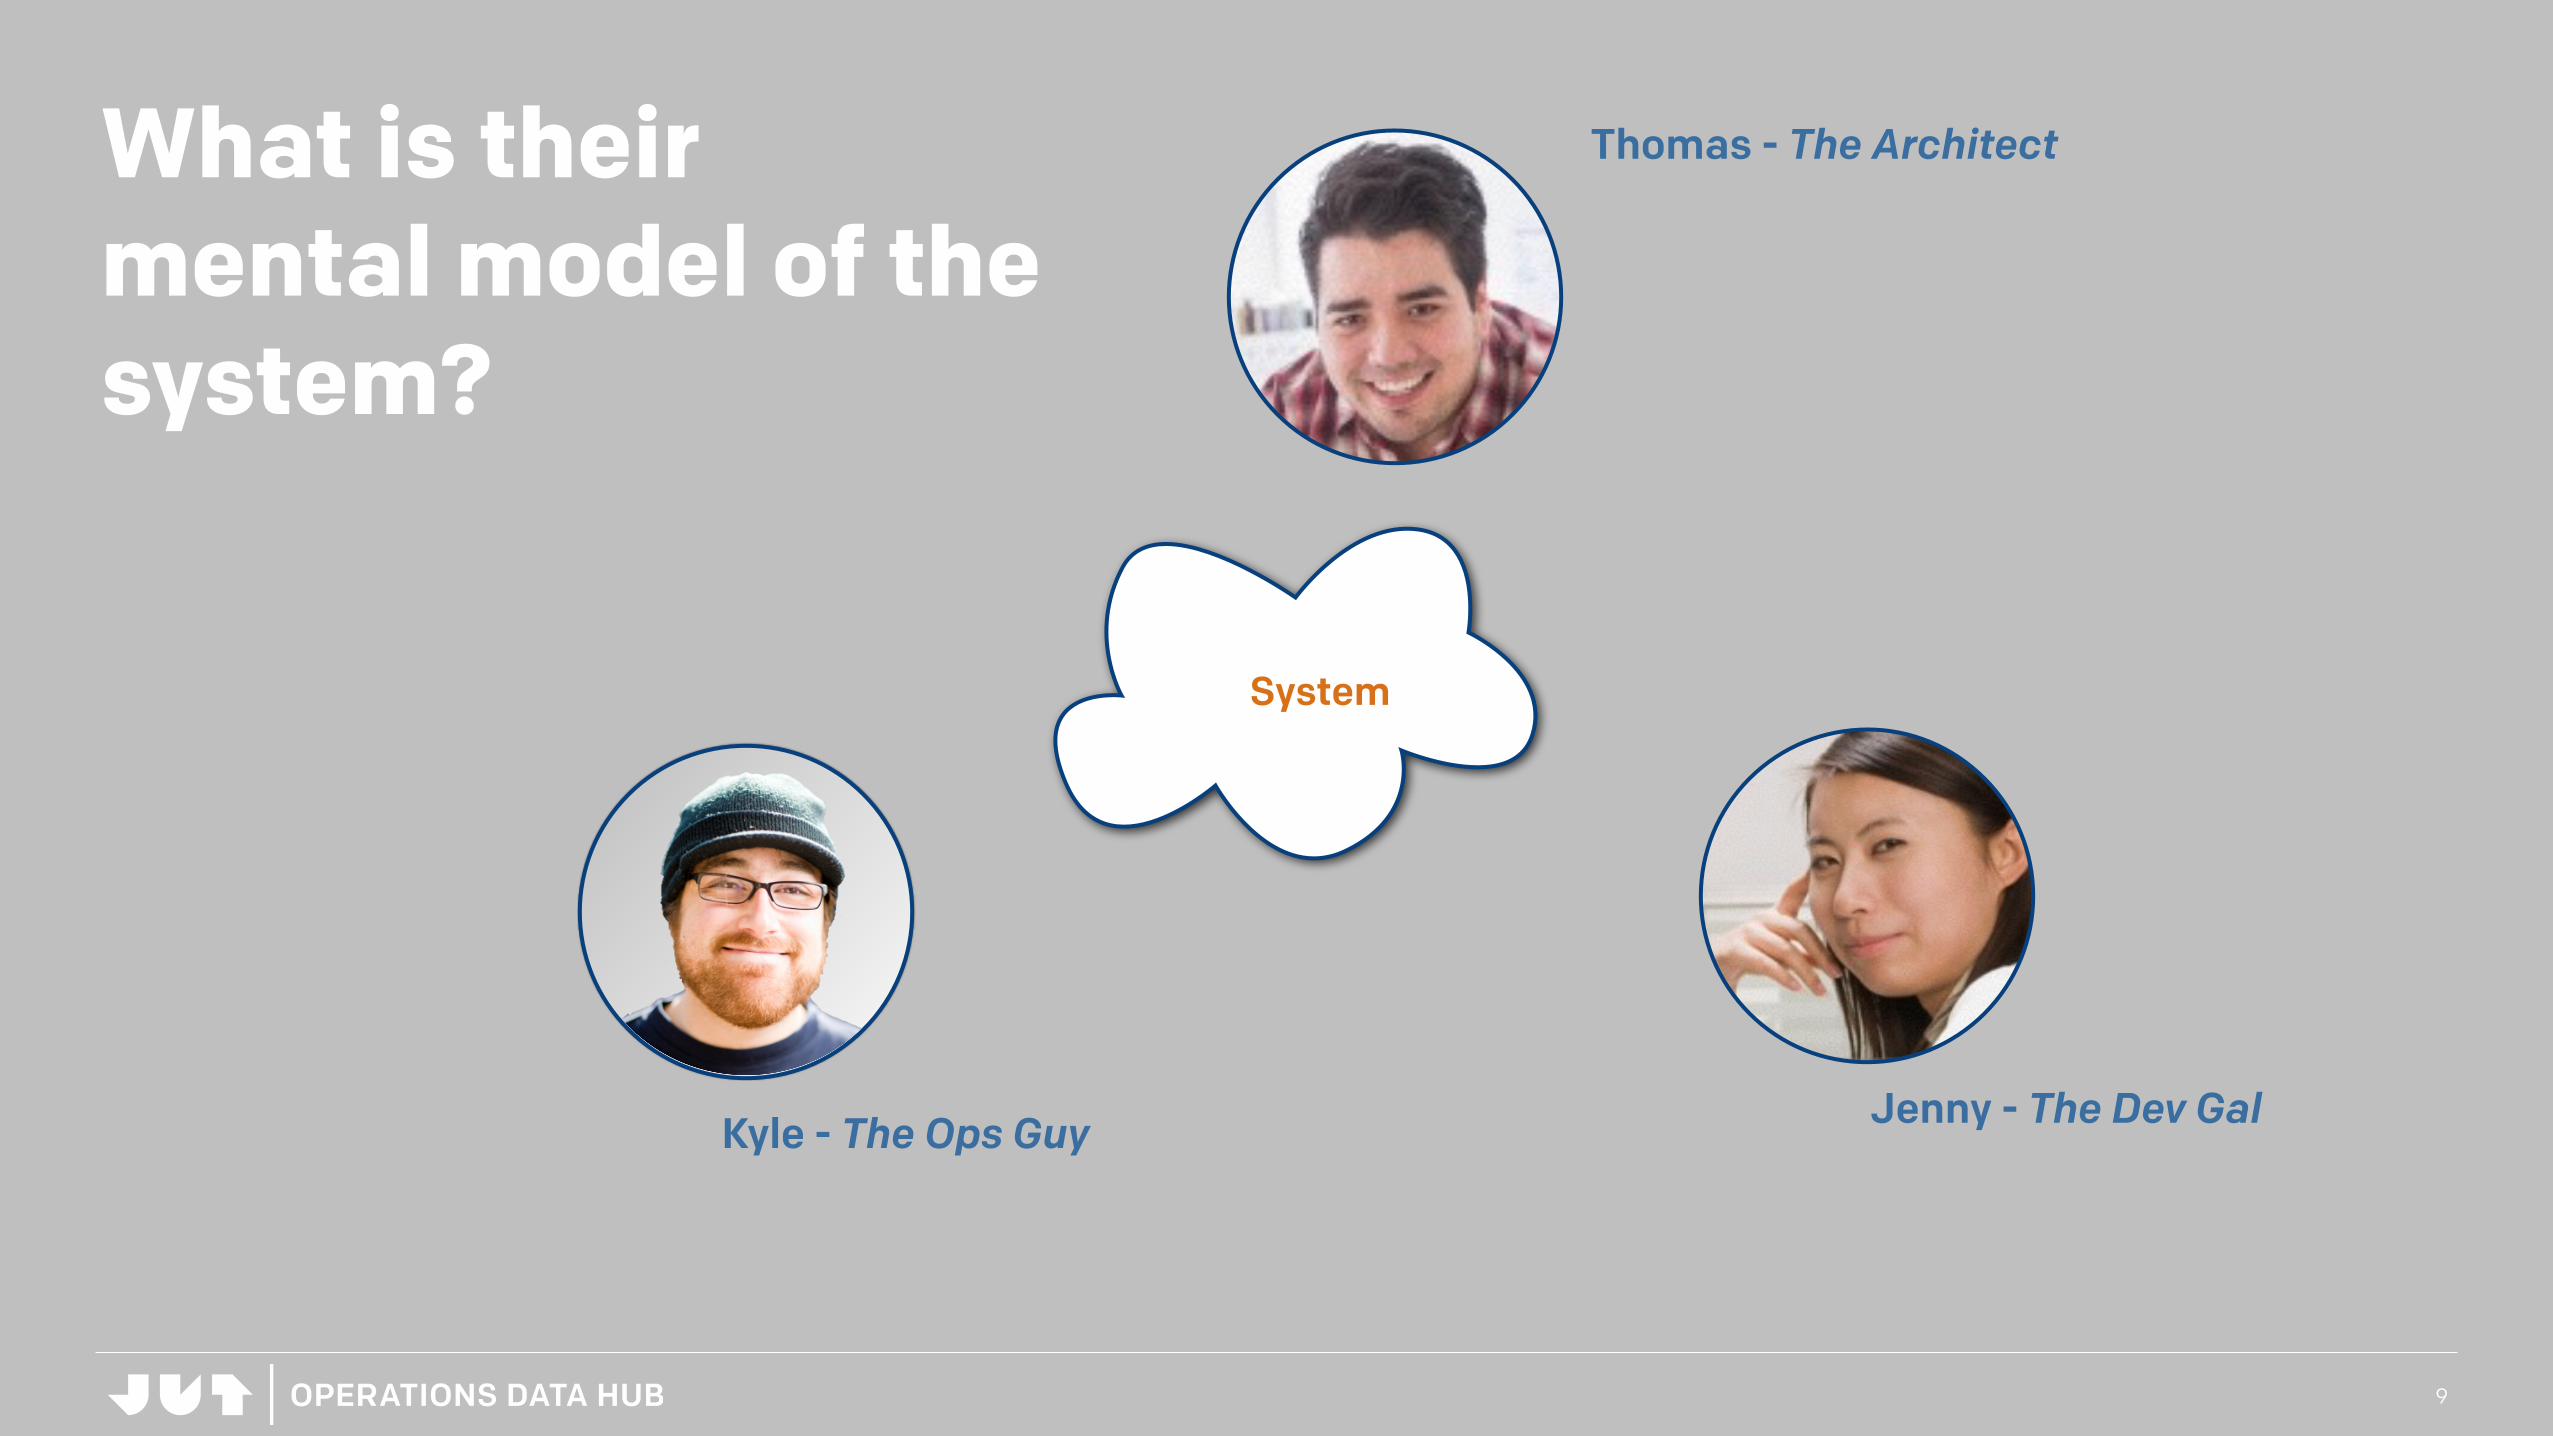
What is their mental model of the system?
9
System
Thomas - The Architect
Kyle - The Ops Guy Jenny - The Dev Gal

Mental models help us understand the world.
10
Illustration and argument from Hugh Dubberly, Models of Models, 2009

Mental models help us make sense of things.
11
Illustration and argument from Hugh Dubberly, Models of Models, 2009

We use mental models to make decisions.
12
Illustration and argument from Hugh Dubberly, Models of Models, 2009

Mental models are the basis for learning.
13
Illustration and argument from Hugh Dubberly, Models of Models, 2009

Mental models are the basis for learning.
13
Illustration and argument from Hugh Dubberly, Models of Models, 2009
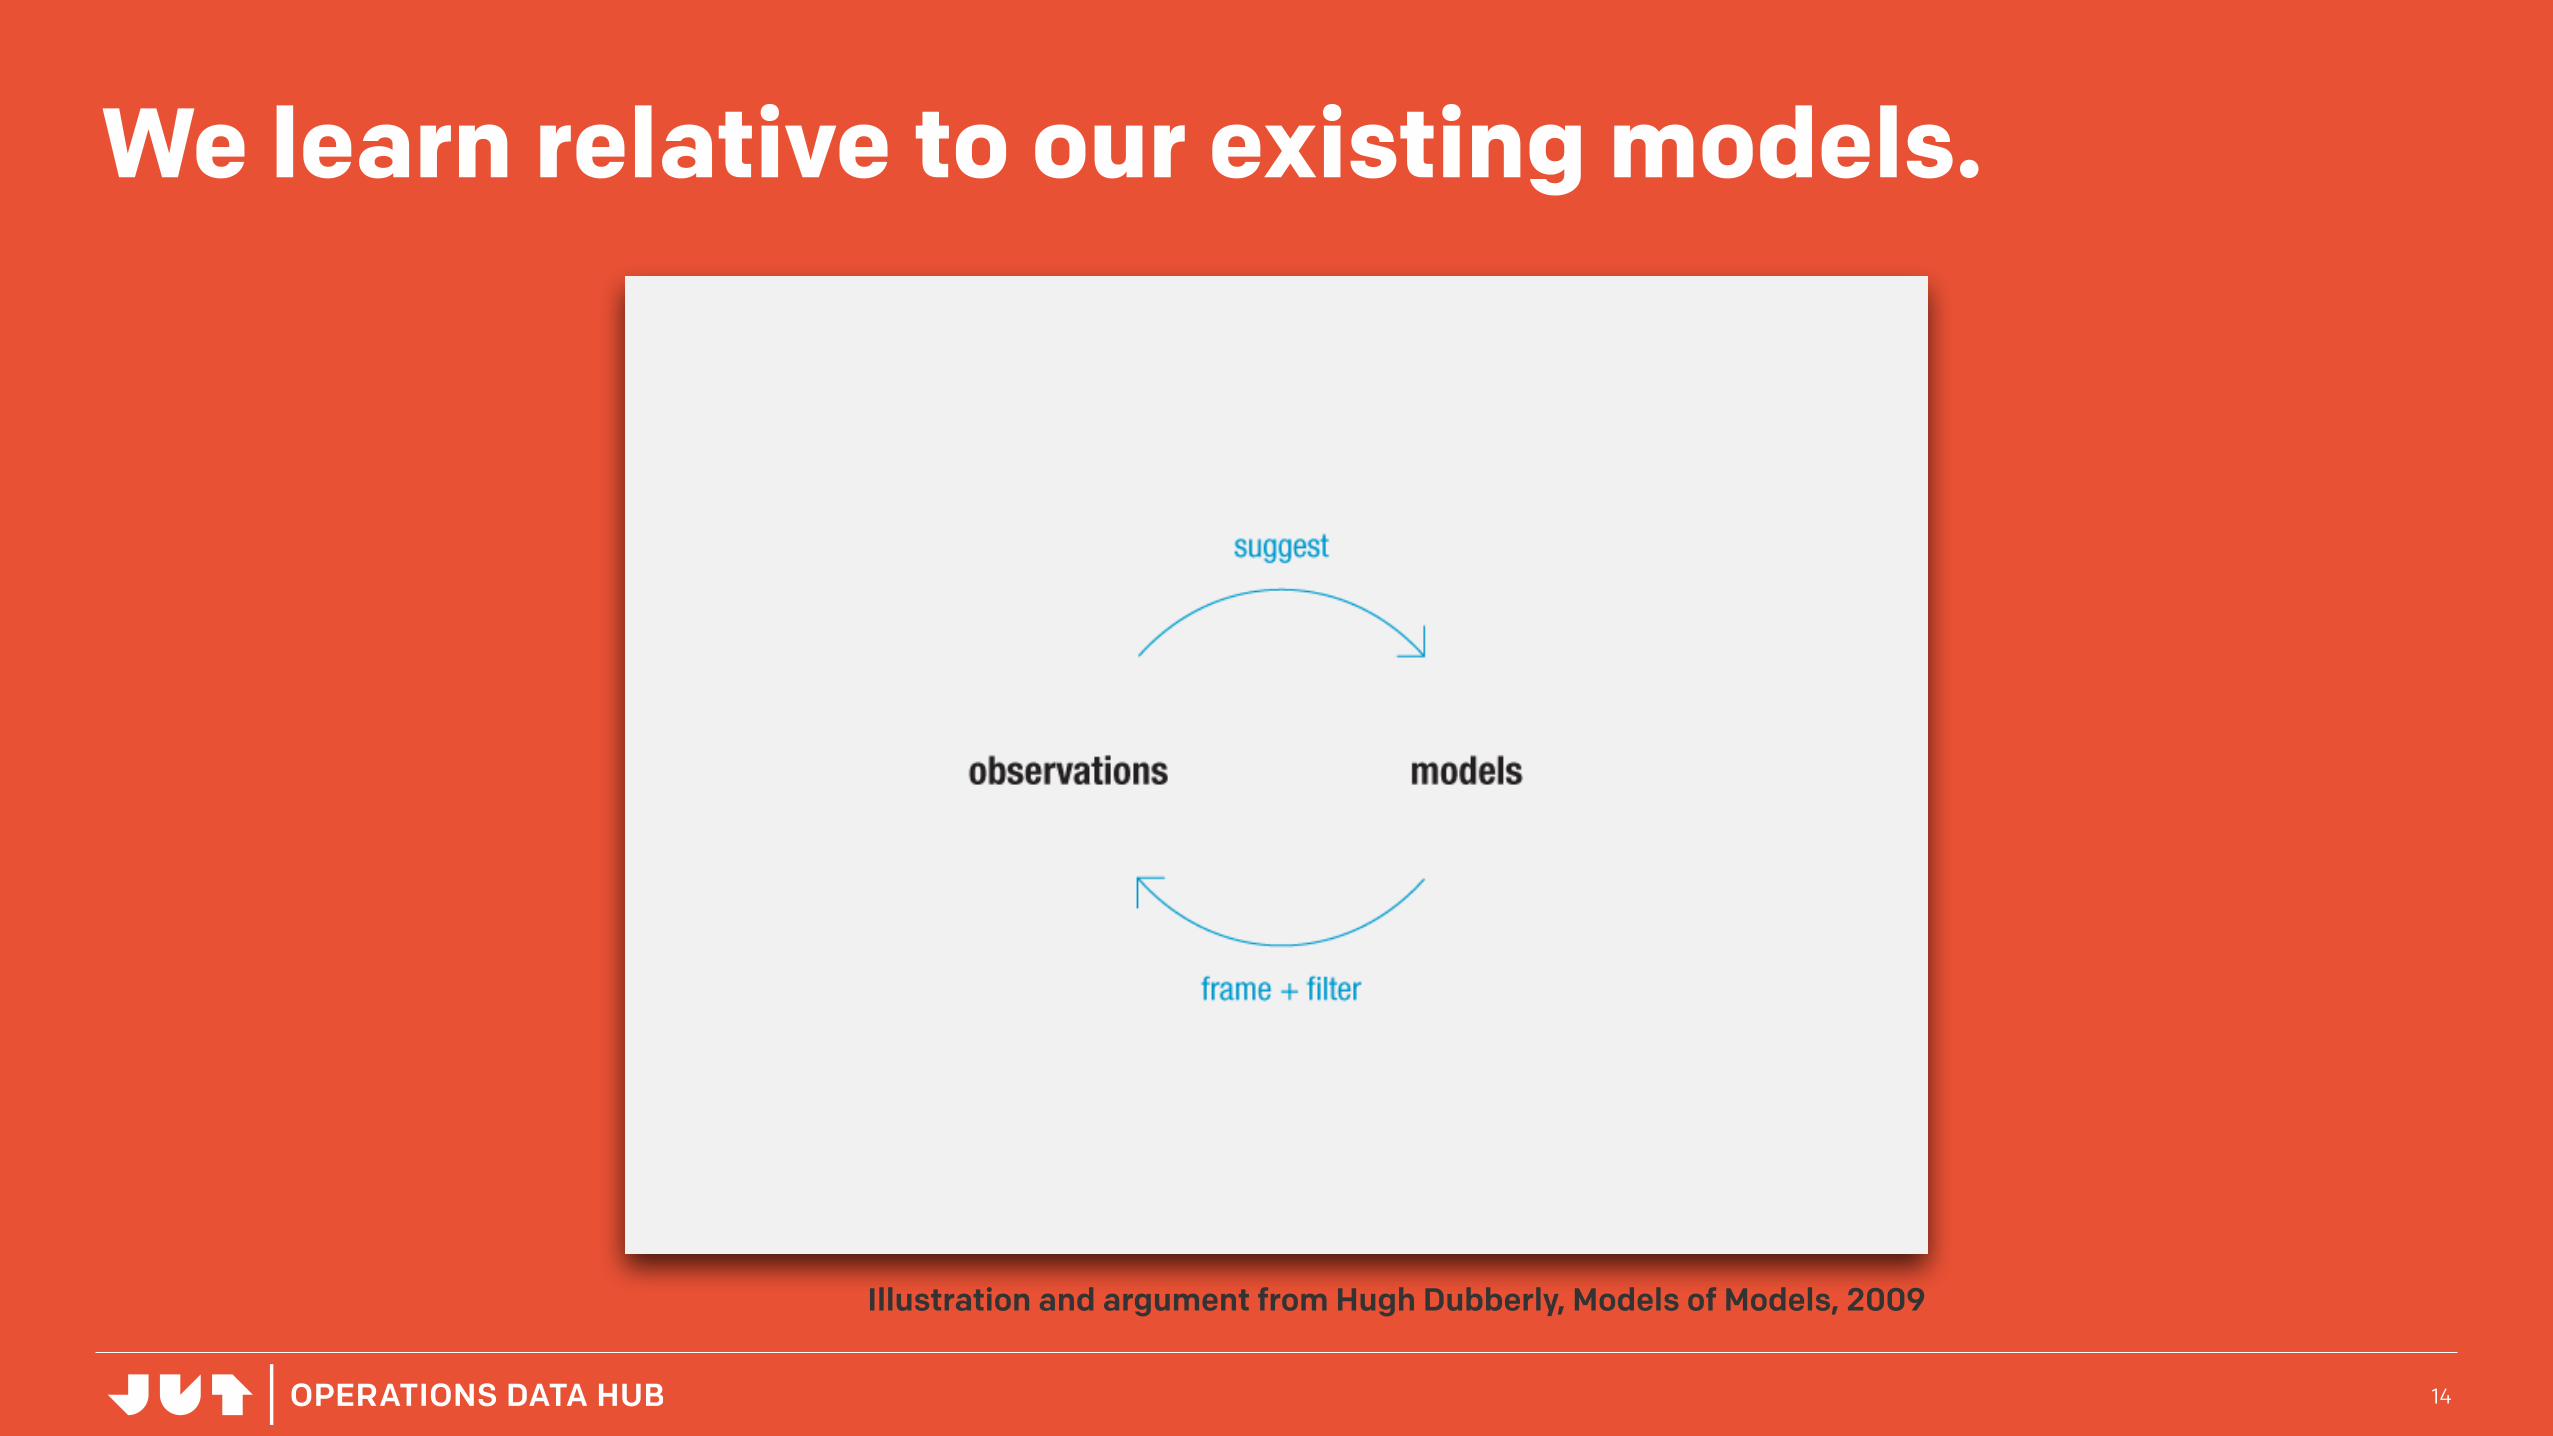
We learn relative to our existing models.
14
Illustration and argument from Hugh Dubberly, Models of Models, 2009
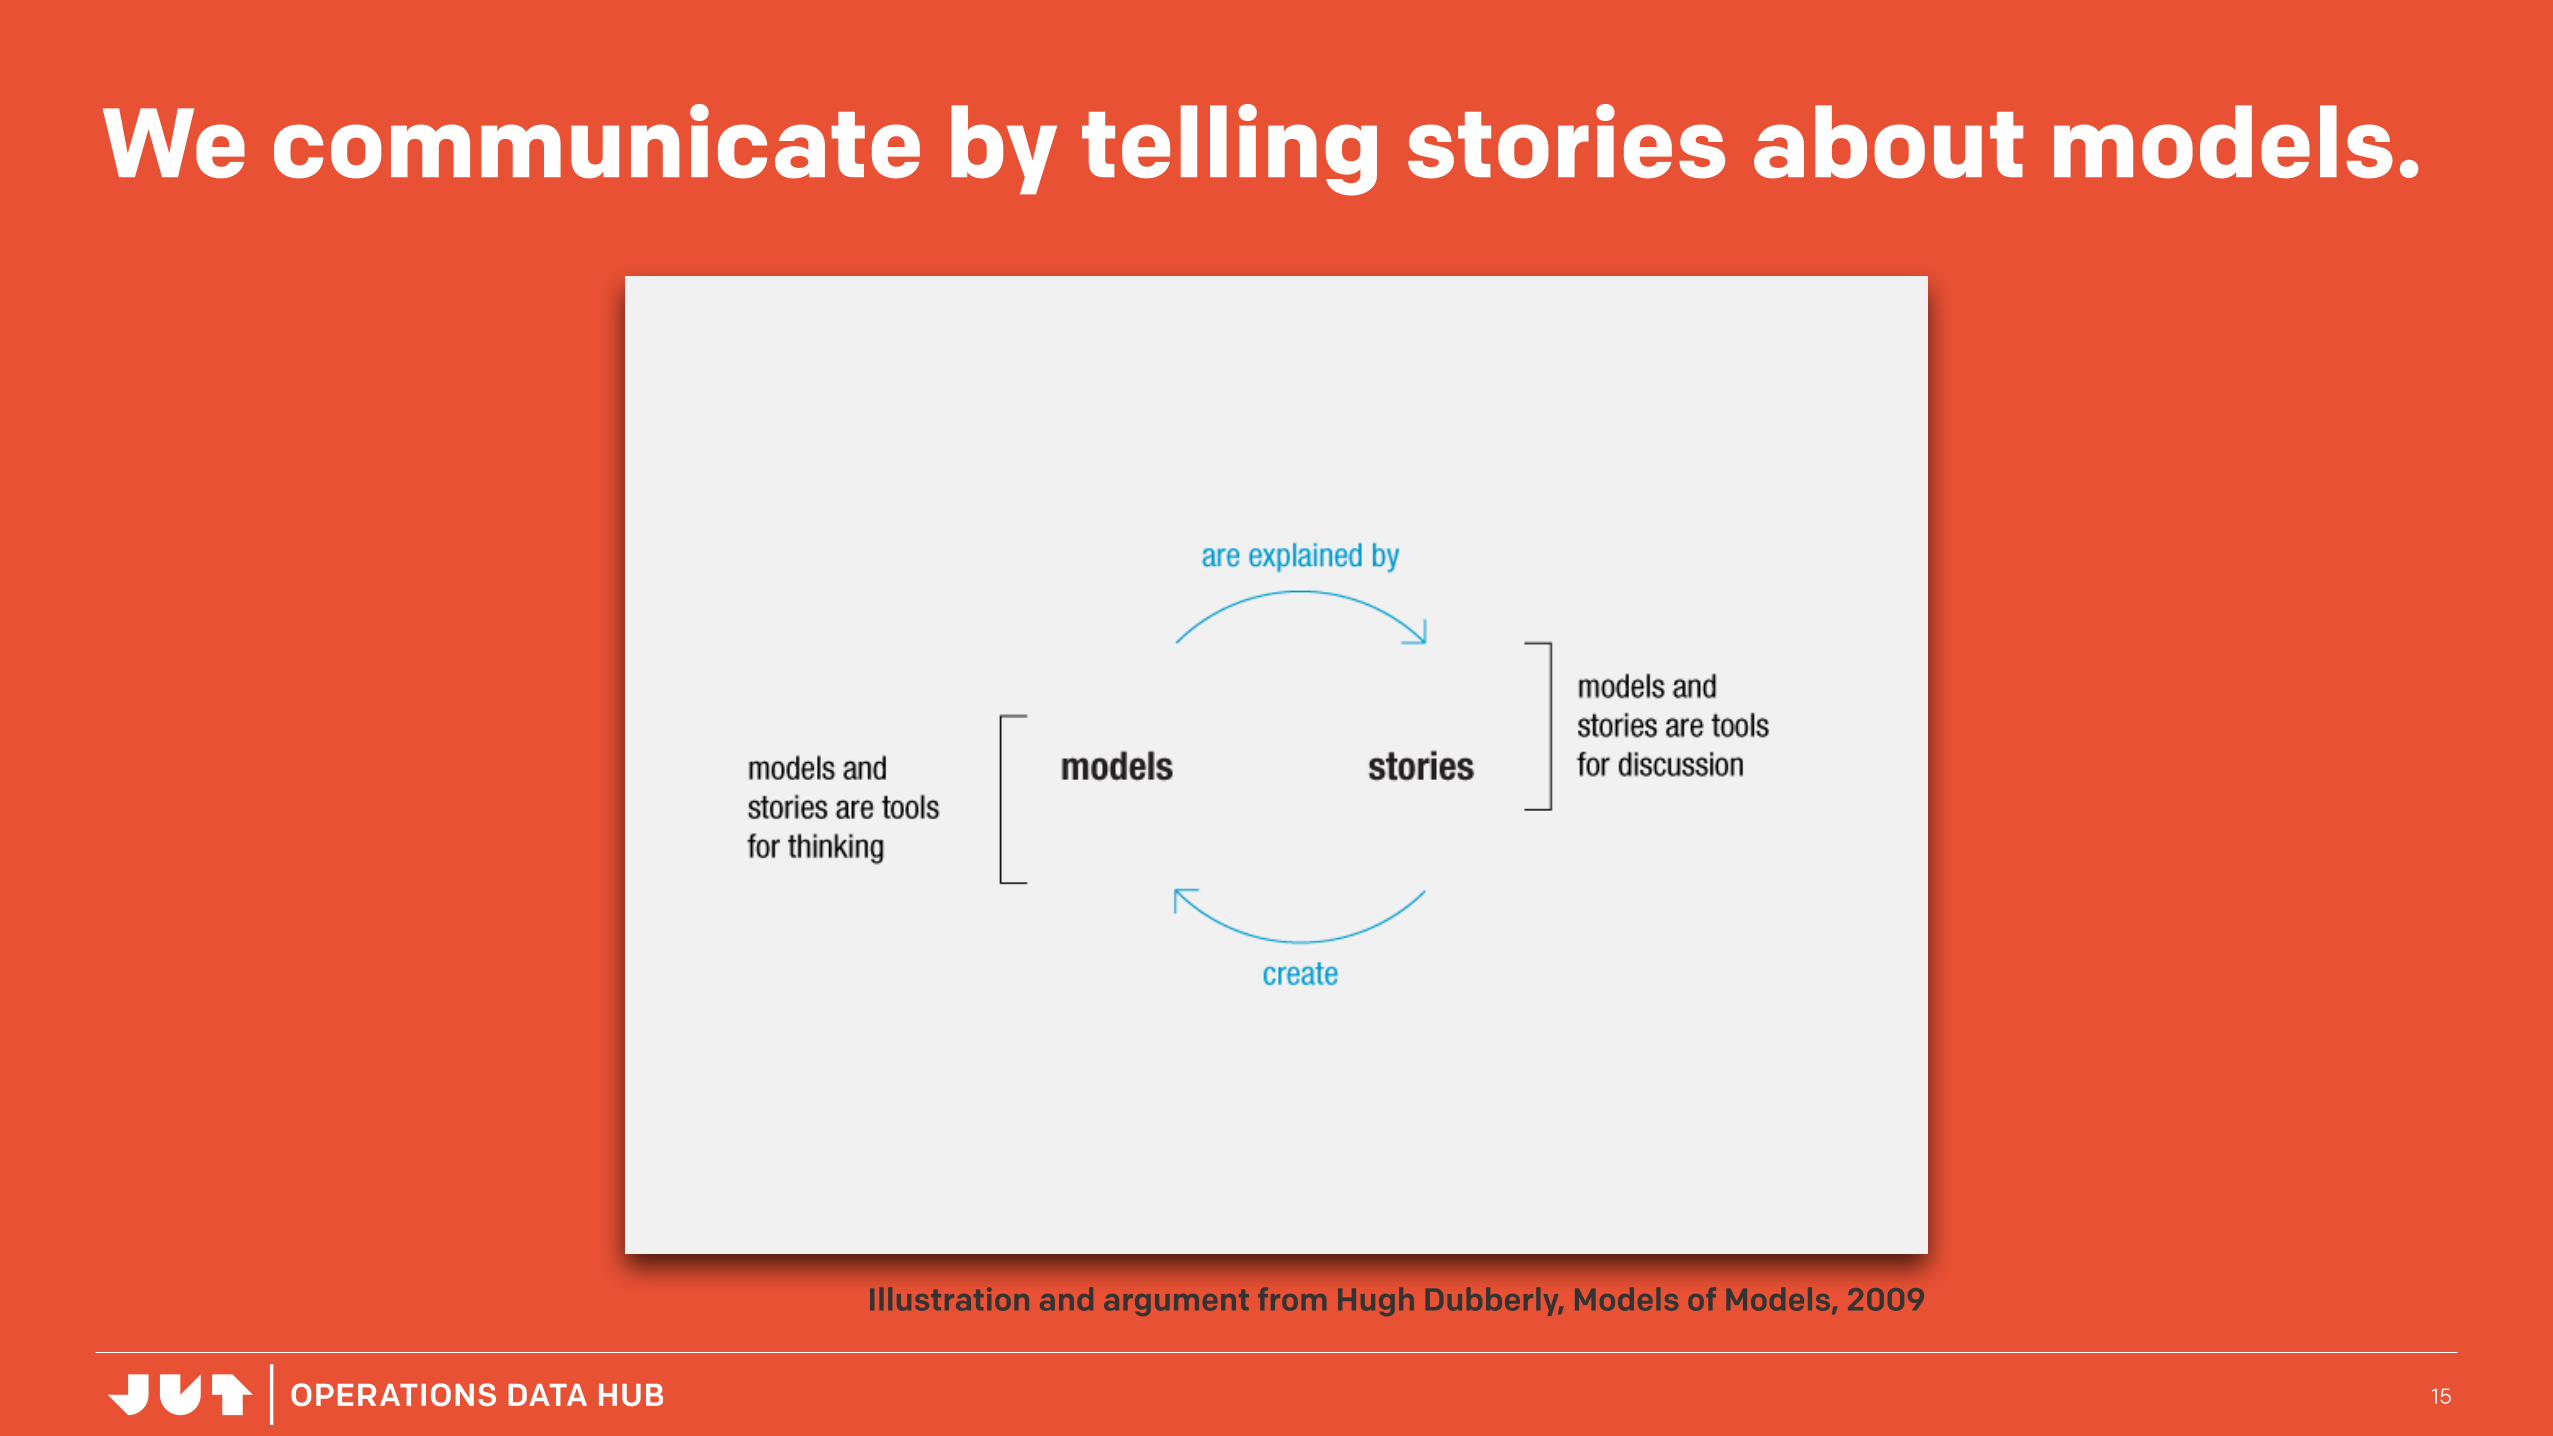
We communicate by telling stories about models.
15
Illustration and argument from Hugh Dubberly, Models of Models, 2009

Before I understand the jargon, descriptions don’t help much.
16
Kyle, tell me about the system.
System

Before I understand the jargon, descriptions don’t help much.
16
Blah blah data center blah blahmicroservices blah blah high
availability blah blah ipsec mesh
blah blah horizontal duplication
blah blah…
System

Stories about challenges are the thing.
17
Kyle, tell me a story about what happens when you get an alert?
System

In Kyle’s model the ops space has 3 dimensions!
18
1. Who is being affected?
2. How are they being affected?
3. How long have they been affected?
Services - Logical
Hardware - Physical
Time
Customers

In Kyle’s model the ops space has 3 dimensions!
18
1. Who is being affected?
2. How are they being affected?
3. How long have they been affected?
Services - Logical
Hardware - Physical
Time
Customers
Keep going, what happens next?

Stories in this space are about nested operation sequences.
19
Log In Stream MediaMedia Query1. Applications

Stories in this space are about nested operation sequences.
19
Log In Stream MediaMedia Query
Parse Optimize Build Execution Plan Run Plan
Syntax Check Semantic Check
Shared Pool Check
SC 1 SC 2 SC 3
Services - Logical
Hardware - Physical
1. Applications
2. Nested Services &sub-services
3. Steps aretransactions
4. Logical to Physical
Return Results

To me, the model is sensible but novel.
20
Hmm.
Services, steps, transactions…

I find a familiar model by analogy.
21
Oh!
I see. Like Fedex!
Sure.

I need to validate that I understand the model.
22
Illustration and argument from Hugh Dubberly, Models of Models, 2009
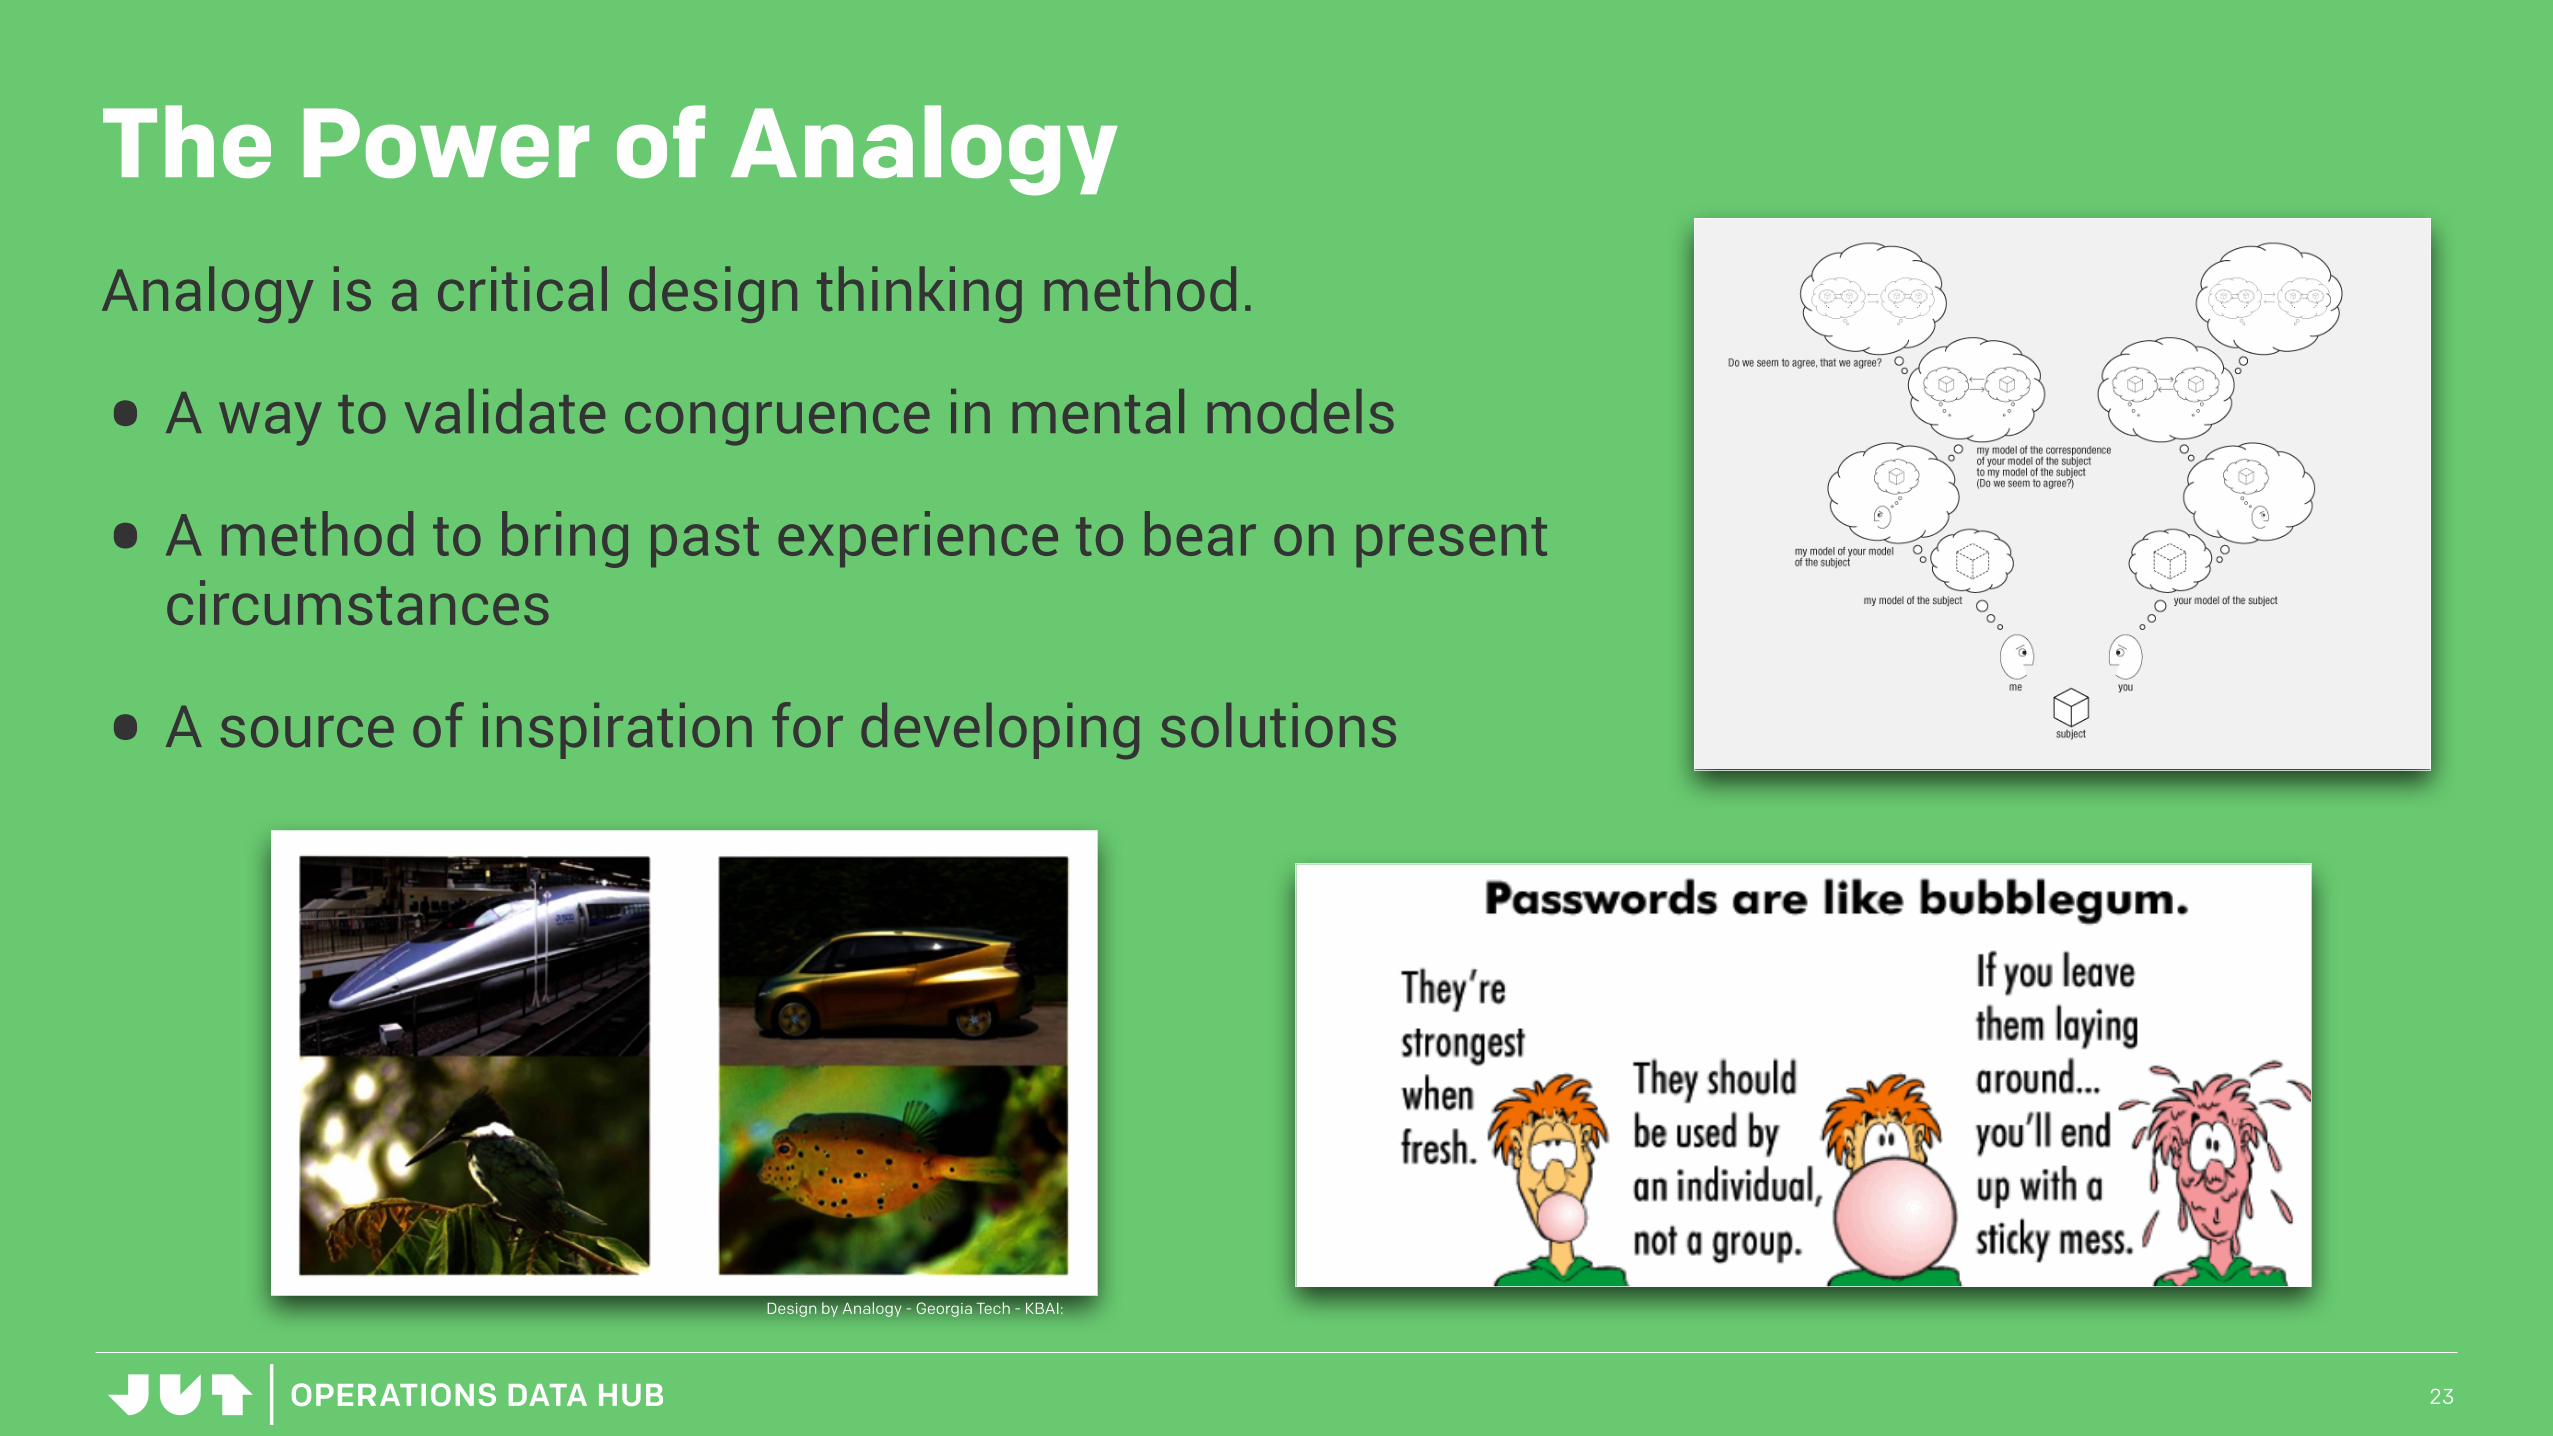
The Power of AnalogyAnalogy is a critical design thinking method.
• A way to validate congruence in mental models
• A method to bring past experience to bear on present circumstances
• A source of inspiration for developing solutions
23
Design by Analogy - Georgia Tech - KBAI:

This is inspiration for a prototype.
24
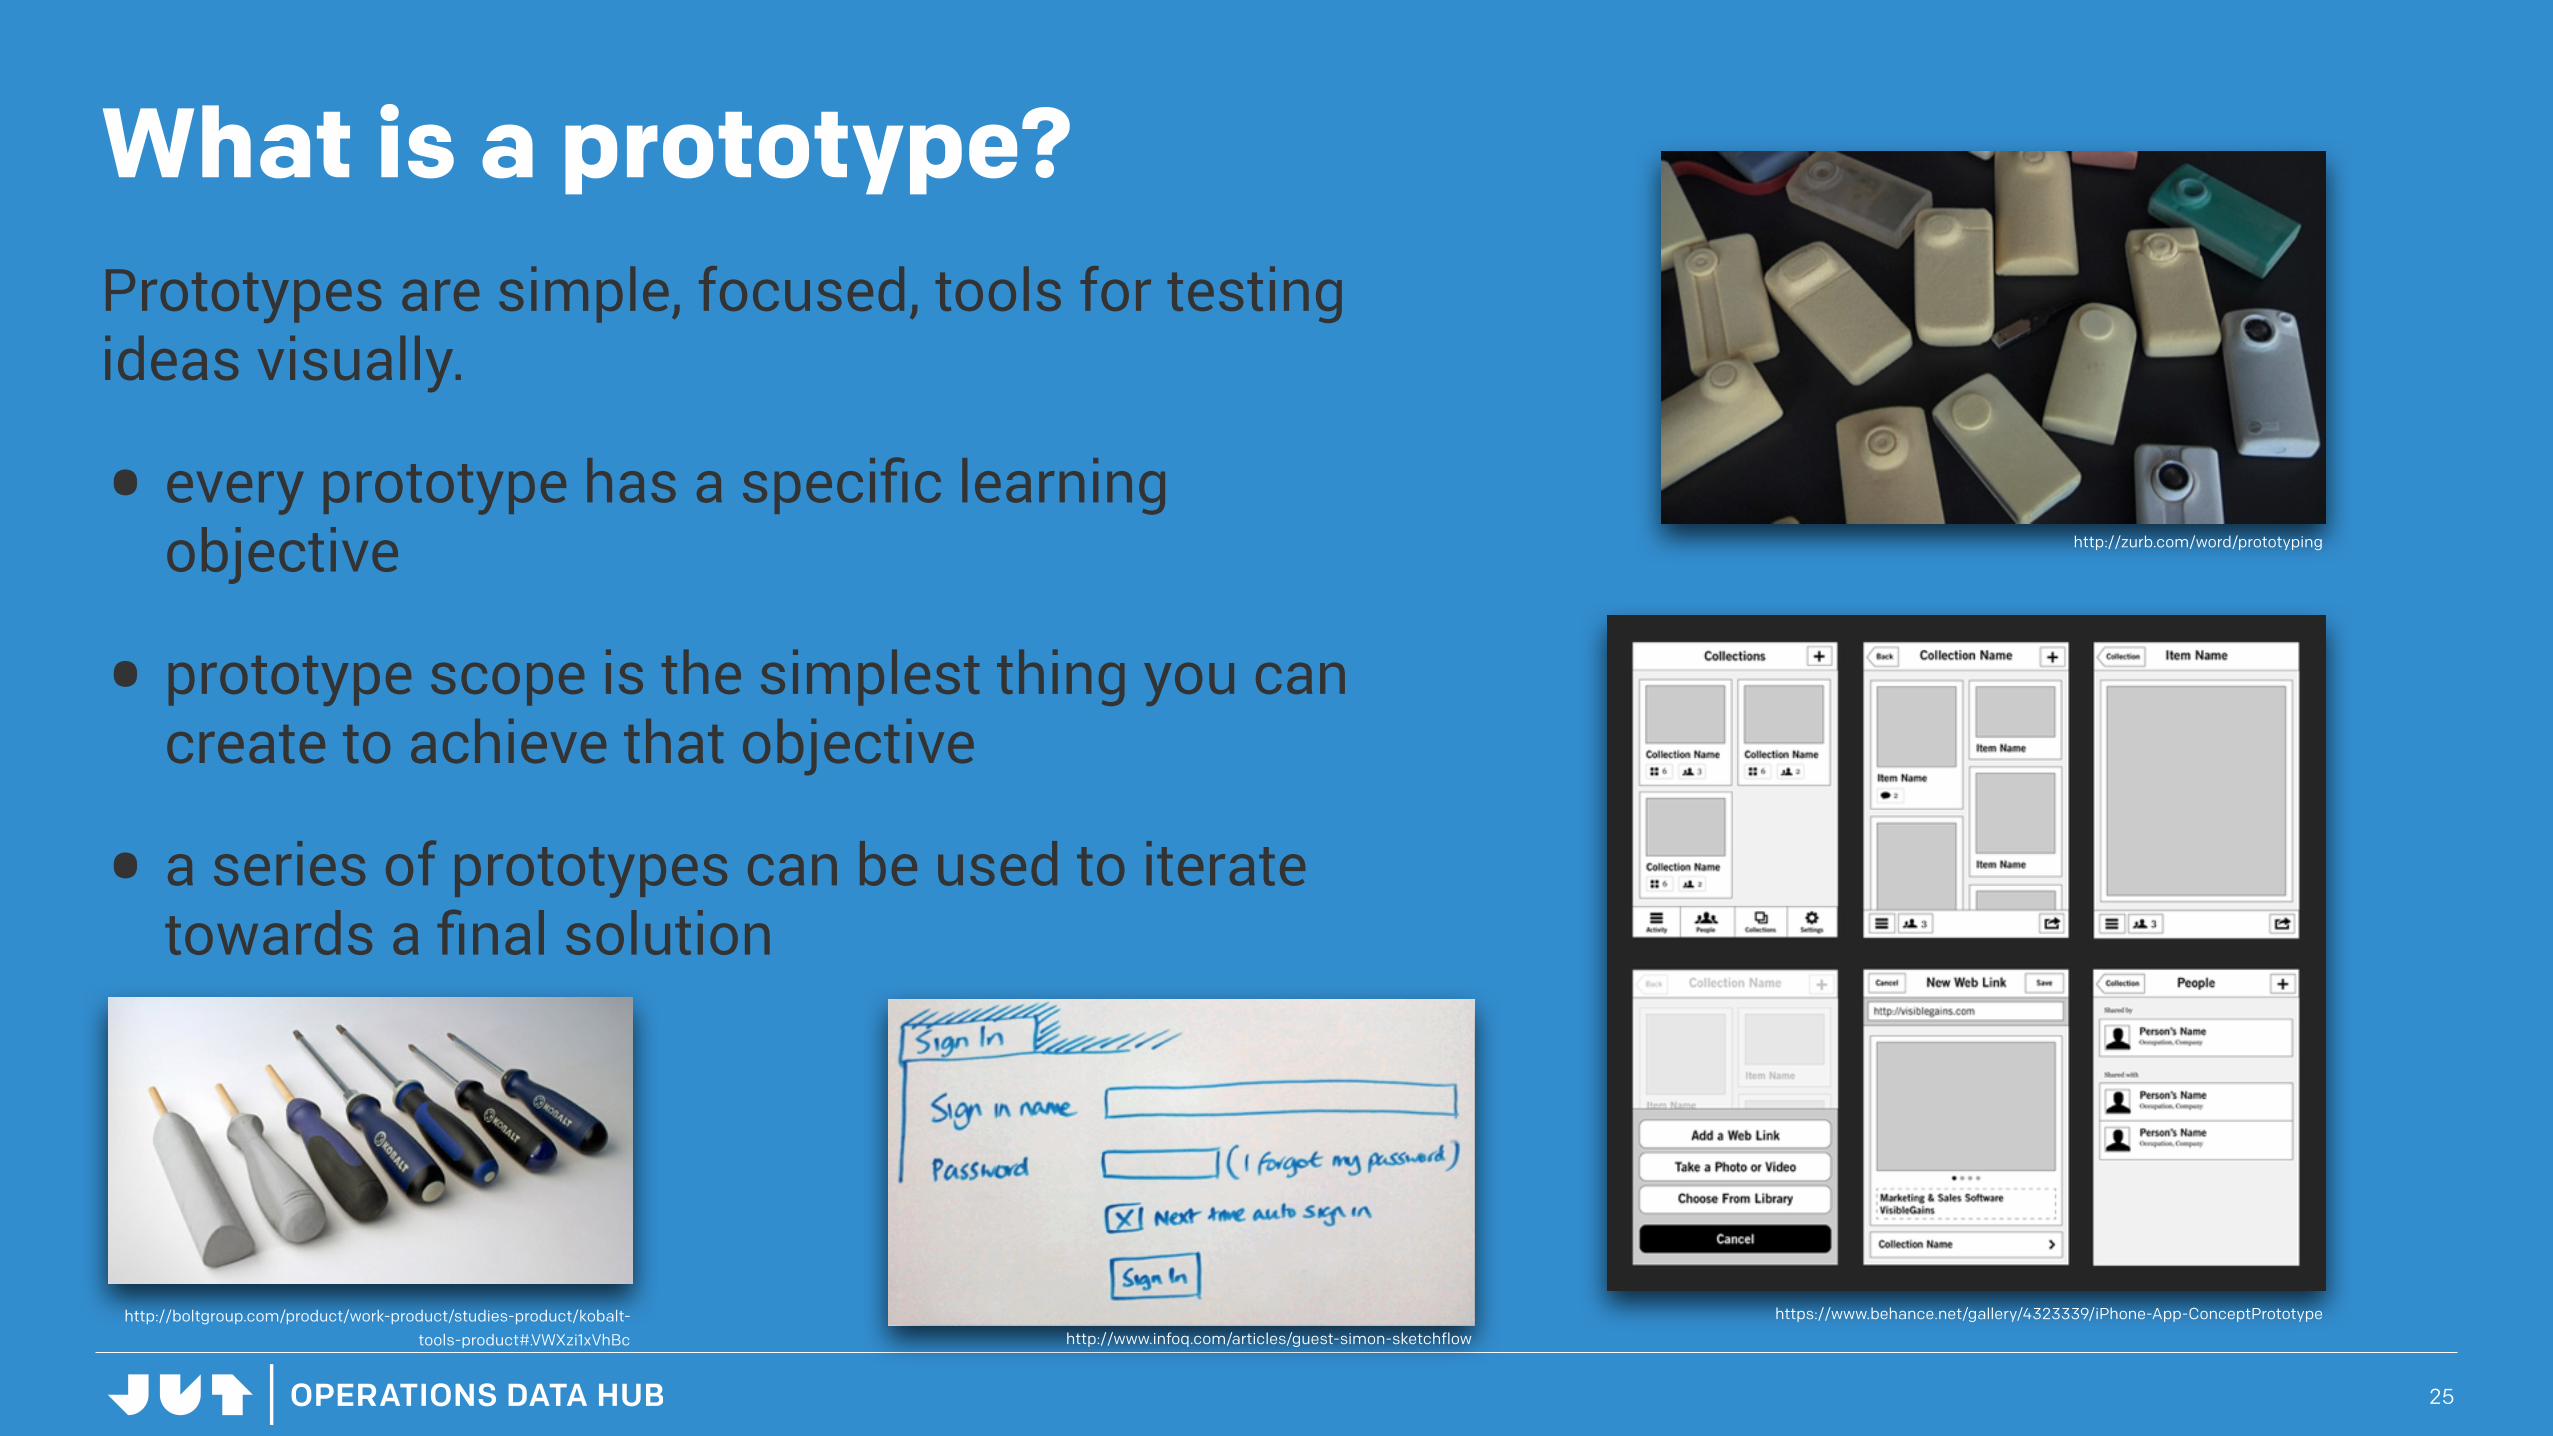
What is a prototype?Prototypes are simple, focused, tools for testing ideas visually.
• every prototype has a specific learning objective
• prototype scope is the simplest thing you can create to achieve that objective
• a series of prototypes can be used to iterate towards a final solution
25
http://zurb.com/word/prototyping
http://boltgroup.com/product/work-product/studies-product/kobalt-tools-product#.VWXzi1xVhBc
https://www.behance.net/gallery/4323339/iPhone-App-ConceptPrototypehttp://www.infoq.com/articles/guest-simon-sketchflow

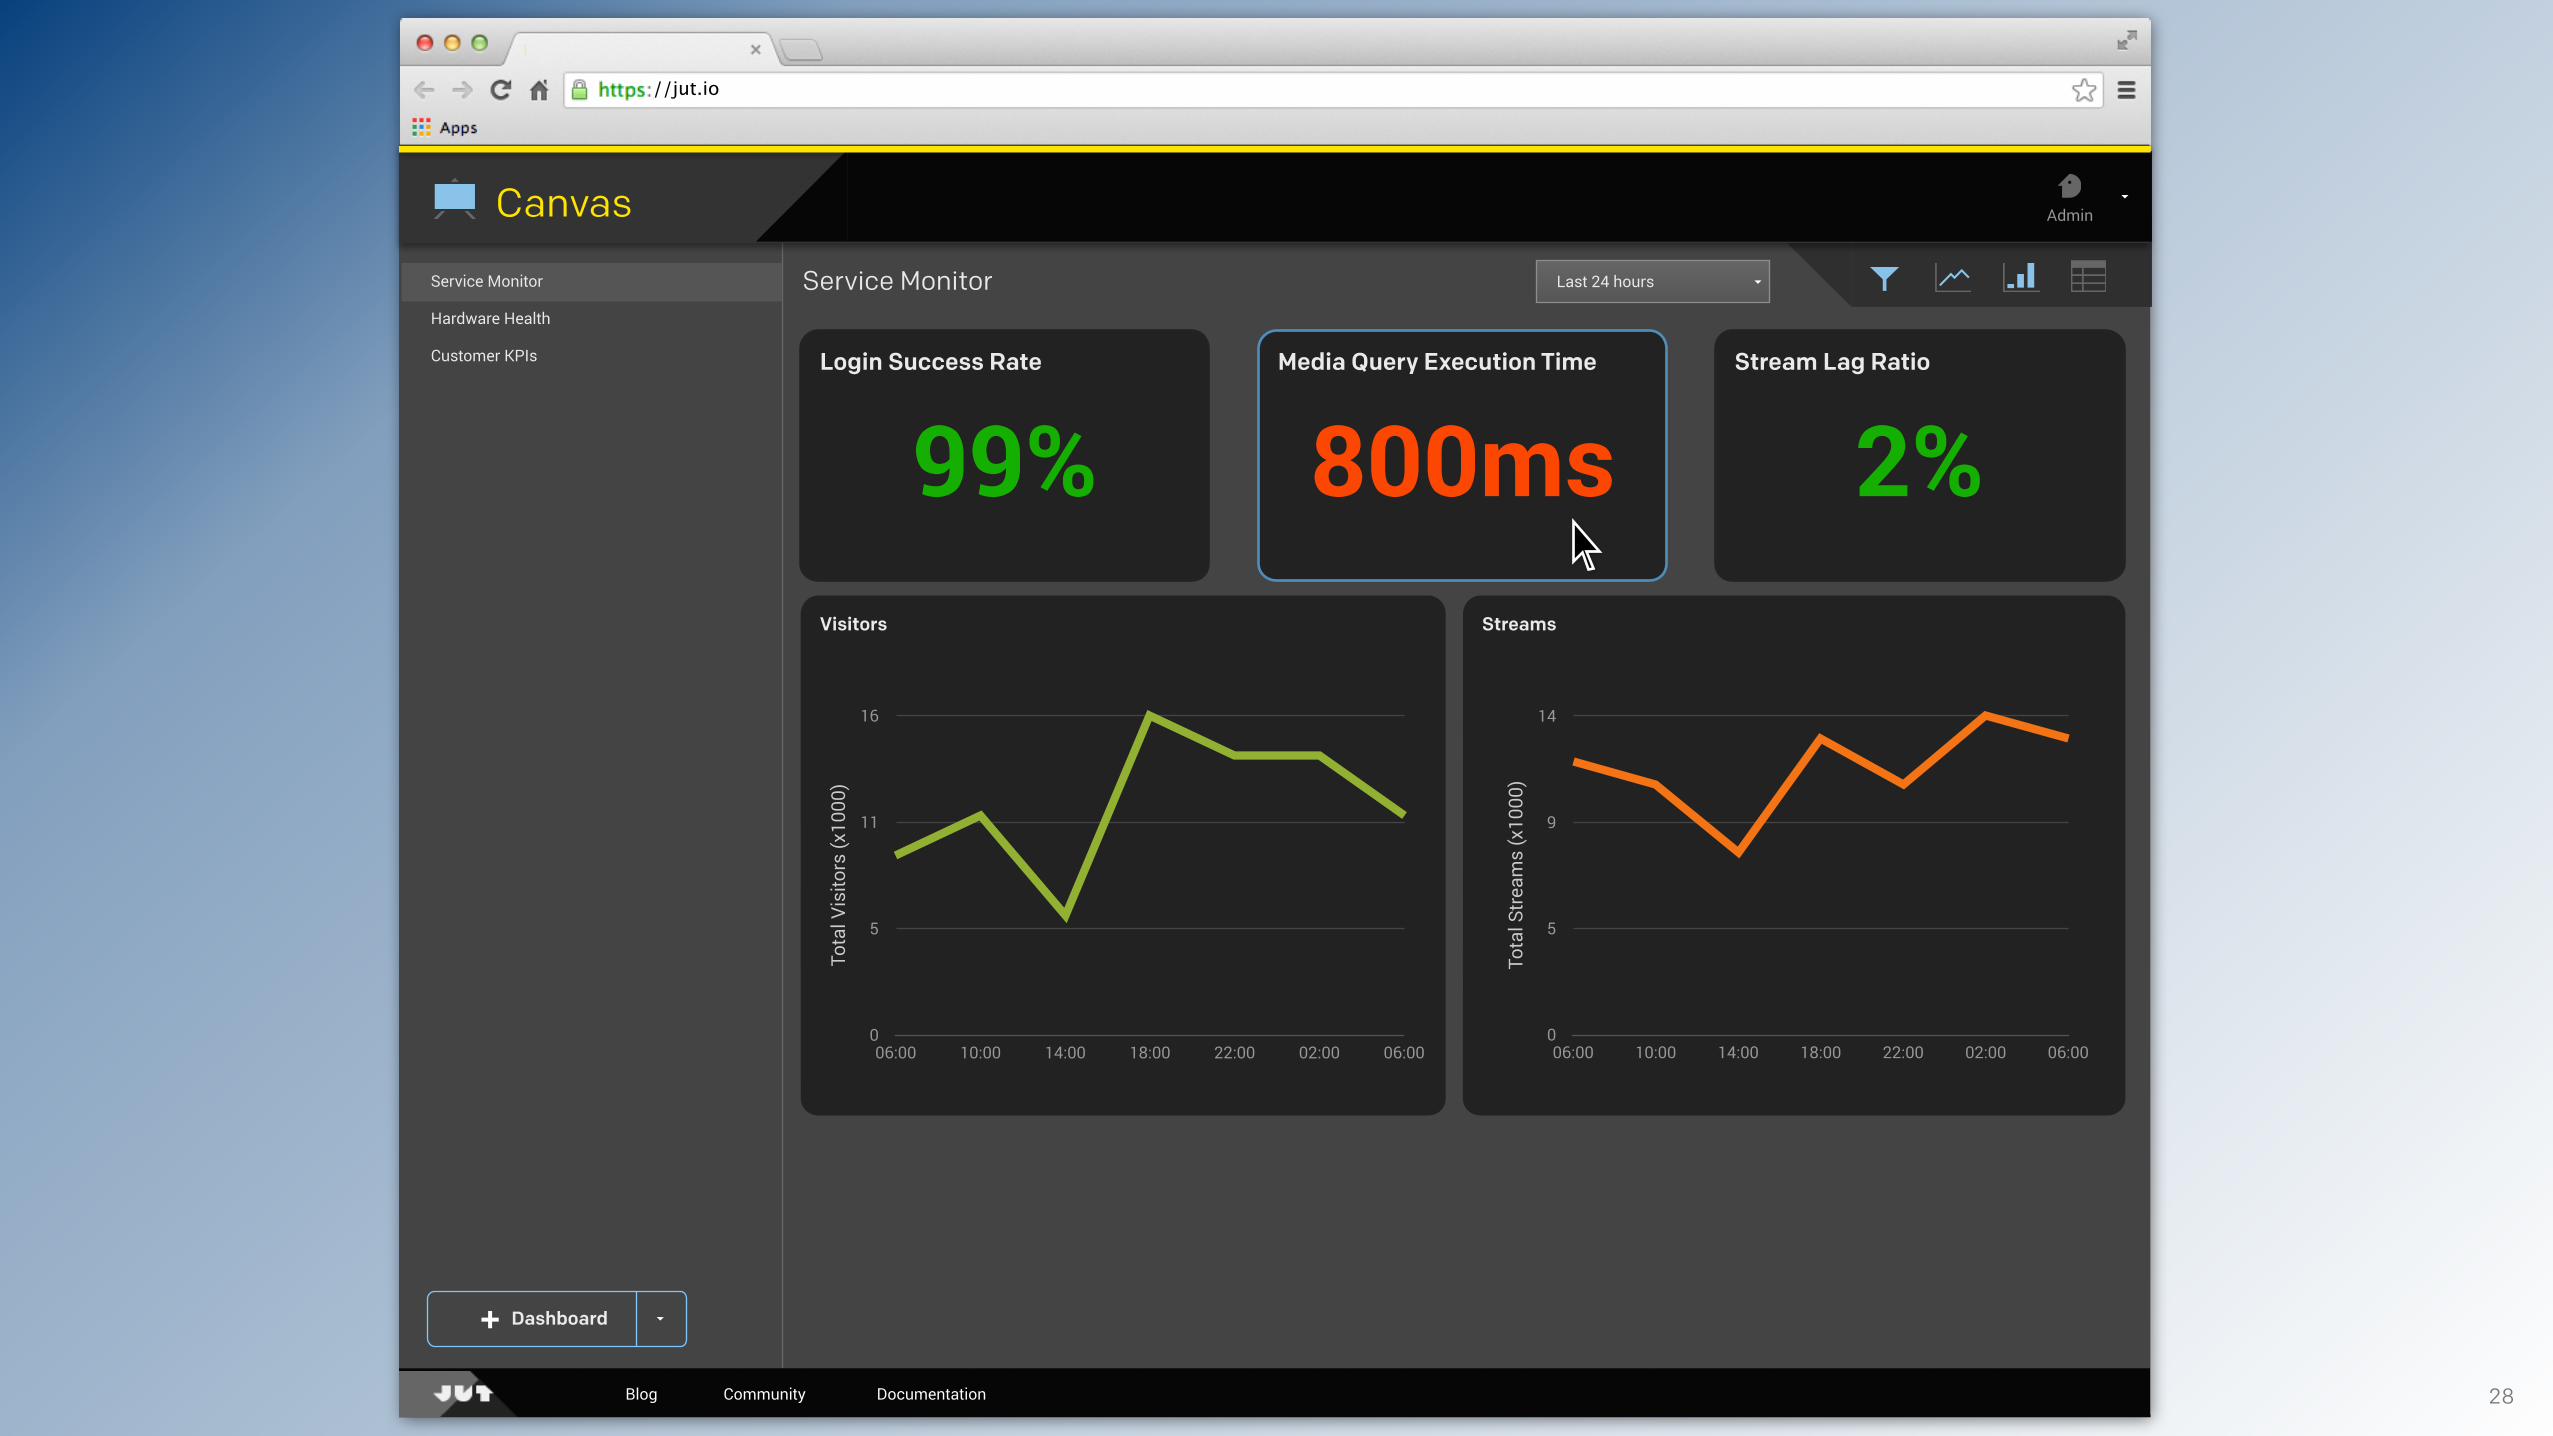
I want to test an experience based on this model
26

//jut.io
Dashboard
Last 24 hours
Canvas Admin
Blog Community Documentation 27
Service Monitor
Hardware Health
Customer KPIs
Service Monitor
Visitors
Tota
l Vis
itors
(x10
00)
0
5
11
16
06:00 10:00 14:00 18:00 22:00 02:00 06:00
Streams
Tota
l Stre
ams
(x10
00)
0
5
9
14
06:00 10:00 14:00 18:00 22:00 02:00 06:00
Login Success Rate
99%
Media Query Execution Time
800ms
Stream Lag Ratio
2%
//jut.io
Dashboard
Last 24 hours
Canvas Admin
Blog Community Documentation 28
Service Monitor
Visitors
Tota
l Vis
itors
(x10
00)
0
5
11
16
06:00 10:00 14:00 18:00 22:00 02:00 06:00
Streams
Tota
l Stre
ams
(x10
00)
0
5
9
14
06:00 10:00 14:00 18:00 22:00 02:00 06:00
Login Success Rate
99%
Media Query Execution Time
800ms
Stream Lag Ratio
2%
Service Monitor
Hardware Health
Customer KPIs

//jut.io
Canvas Admin
Last 24 hours
Dashboard
Blog Community Documentation 29
Service Monitor > Query ServiceService Monitor
Login Service
Query Service
Streaming Service
Hardware Health
Customer KPIs
Query Steps/Time (ms) by Region
Step Americas EU APAC
Parse 120 1200 130
Optimize 120 120 100
Build Plan 100 100 100
Run Plan 90 90 90
Return Results 60 60 80
Query Steps = average for last month
Optimize Run Plan Return ResultsBuild Execution PlanParse

//jut.io
Canvas Admin
Last 24 hours
Dashboard
Blog Community Documentation 30
Service Monitor > Query ServiceService Monitor
Login Service
Query Service
Streaming Service
Hardware Health
Customer KPIs
Query Steps/Time (ms) by Region
Step Americas EU APAC
Parse 120 1200 130
Optimize 120 120 100
Build Plan 100 100 100
Run Plan 90 90 90
Return Results 60 60 80
Query Steps = average for last month
Optimize Run Plan Return ResultsBuild Execution PlanParse
//jut.io
Canvas Admin
Last 24 hours
Dashboard
Blog Community Documentation 31
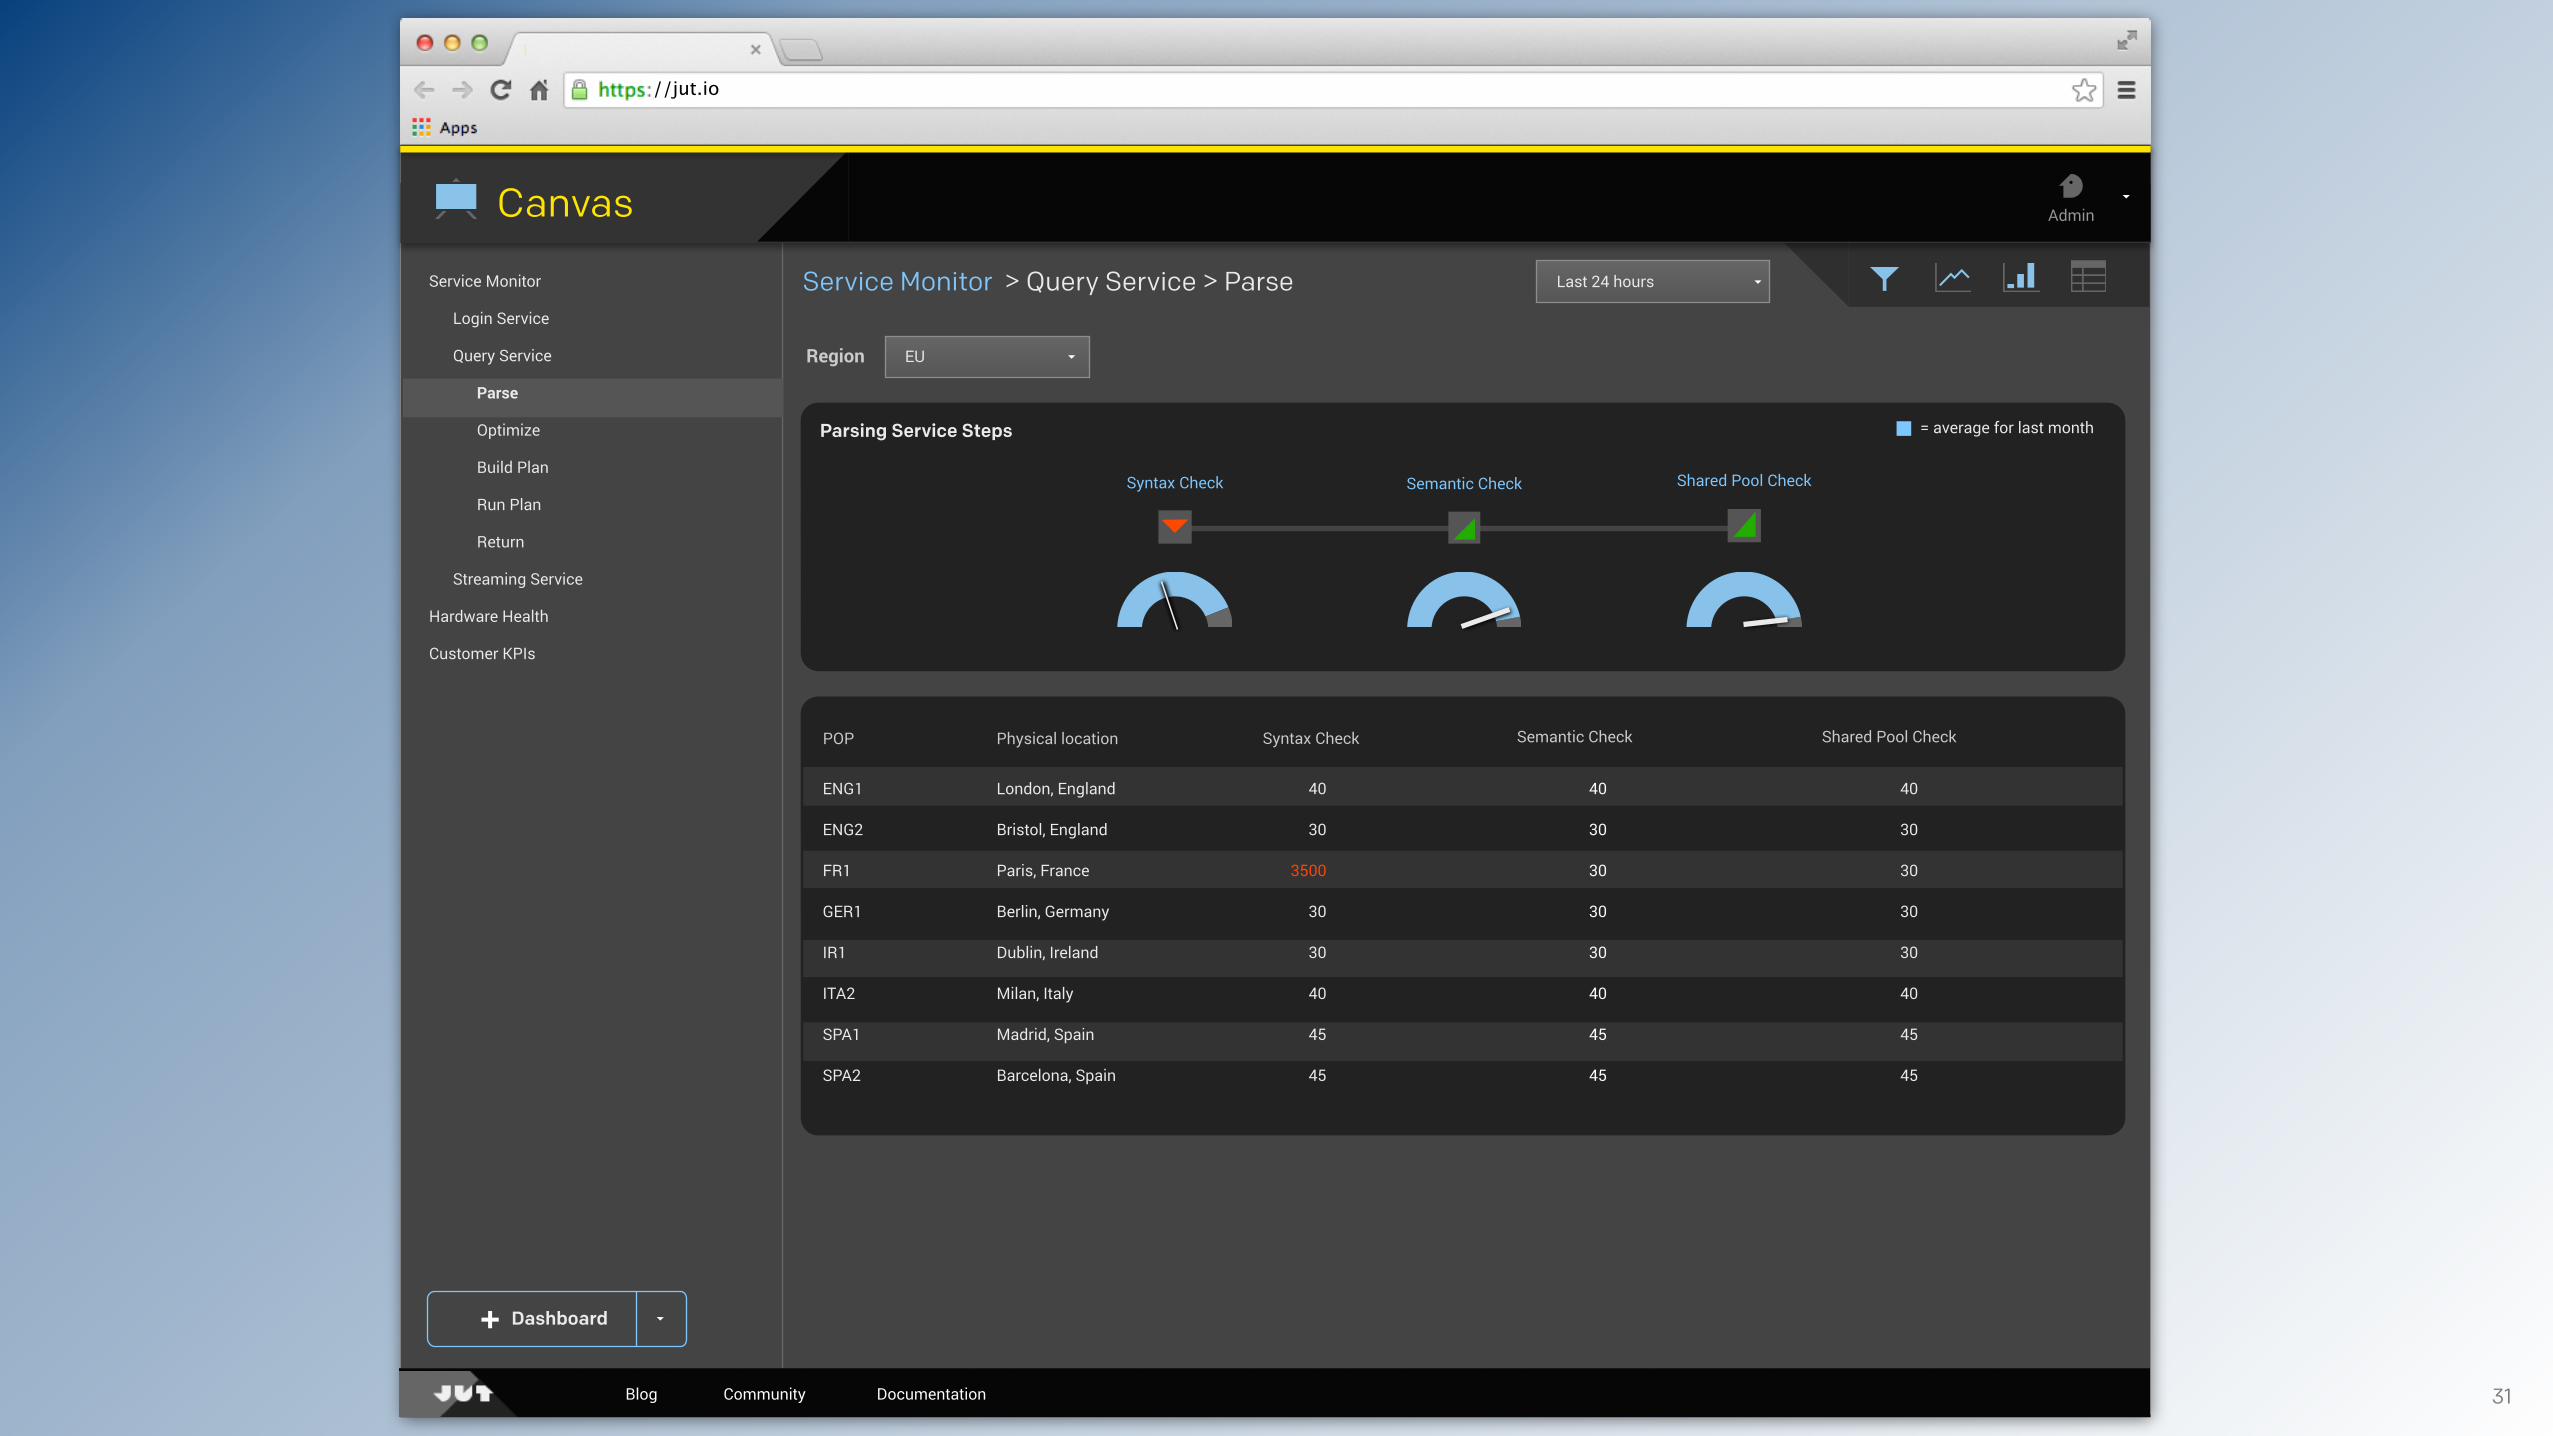
Service Monitor > Query Service > ParseService Monitor
Login Service
Query Service
Parse
Optimize
Build Plan
Run Plan
Return
Streaming Service
Hardware Health
Customer KPIs
Parsing Service Steps = average for last month
Syntax Check Semantic Check Shared Pool Check
Syntax Check Shared Pool CheckPOP Semantic Check
ENG1
ENG2
FR1
GER1
IR1
ITA2
SPA1
SPA2
40
30
3500
30
30
40
45
45
Physical location
London, England
Bristol, England
Paris, France
Berlin, Germany
Dublin, Ireland
Milan, Italy
Madrid, Spain
Barcelona, Spain
40
30
30
30
30
40
45
45
40
30
30
30
30
40
45
45
EURegion

//jut.io
Canvas Admin
Last 24 hours
Dashboard
Blog Community Documentation 31
Service Monitor > Query Service > ParseService Monitor
Login Service
Query Service
Parse
Optimize
Build Plan
Run Plan
Return
Streaming Service
Hardware Health
Customer KPIs
Parsing Service Steps = average for last month
Syntax Check Semantic Check Shared Pool Check
Syntax Check Shared Pool CheckPOP Semantic Check
ENG1
ENG2
FR1
GER1
IR1
ITA2
SPA1
SPA2
40
30
3500
30
30
40
45
45
Physical location
London, England
Bristol, England
Paris, France
Berlin, Germany
Dublin, Ireland
Milan, Italy
Madrid, Spain
Barcelona, Spain
40
30
30
30
30
40
45
45
40
30
30
30
30
40
45
45
EURegion

//jut.io
Canvas Admin
Last 24 hours
Dashboard
Blog Community Documentation 32
Service Monitor > Query Service > ParseService Monitor
Login Service
Query Service
Parse
Optimize
Build Plan
Run Plan
Return
Streaming Service
Hardware Health
Customer KPIs
Parsing Service Steps = average for last month
Syntax Check Semantic Check Shared Pool Check
Syntax Check Shared Pool CheckPOP Semantic Check
ENG1
ENG2
FR1
GER1
IR1
ITA2
SPA1
SPA2
40
30
3500
30
30
40
45
45
Physical location
London, England
Bristol, England
Paris, France
Berlin, Germany
Dublin, Ireland
Milan, Italy
Madrid, Spain
Barcelona, Spain
40
30
30
30
30
40
45
45
40
30
30
30
30
40
45
45
EURegion
//jut.io
Dashboard
Last 24 hours
Canvas Admin
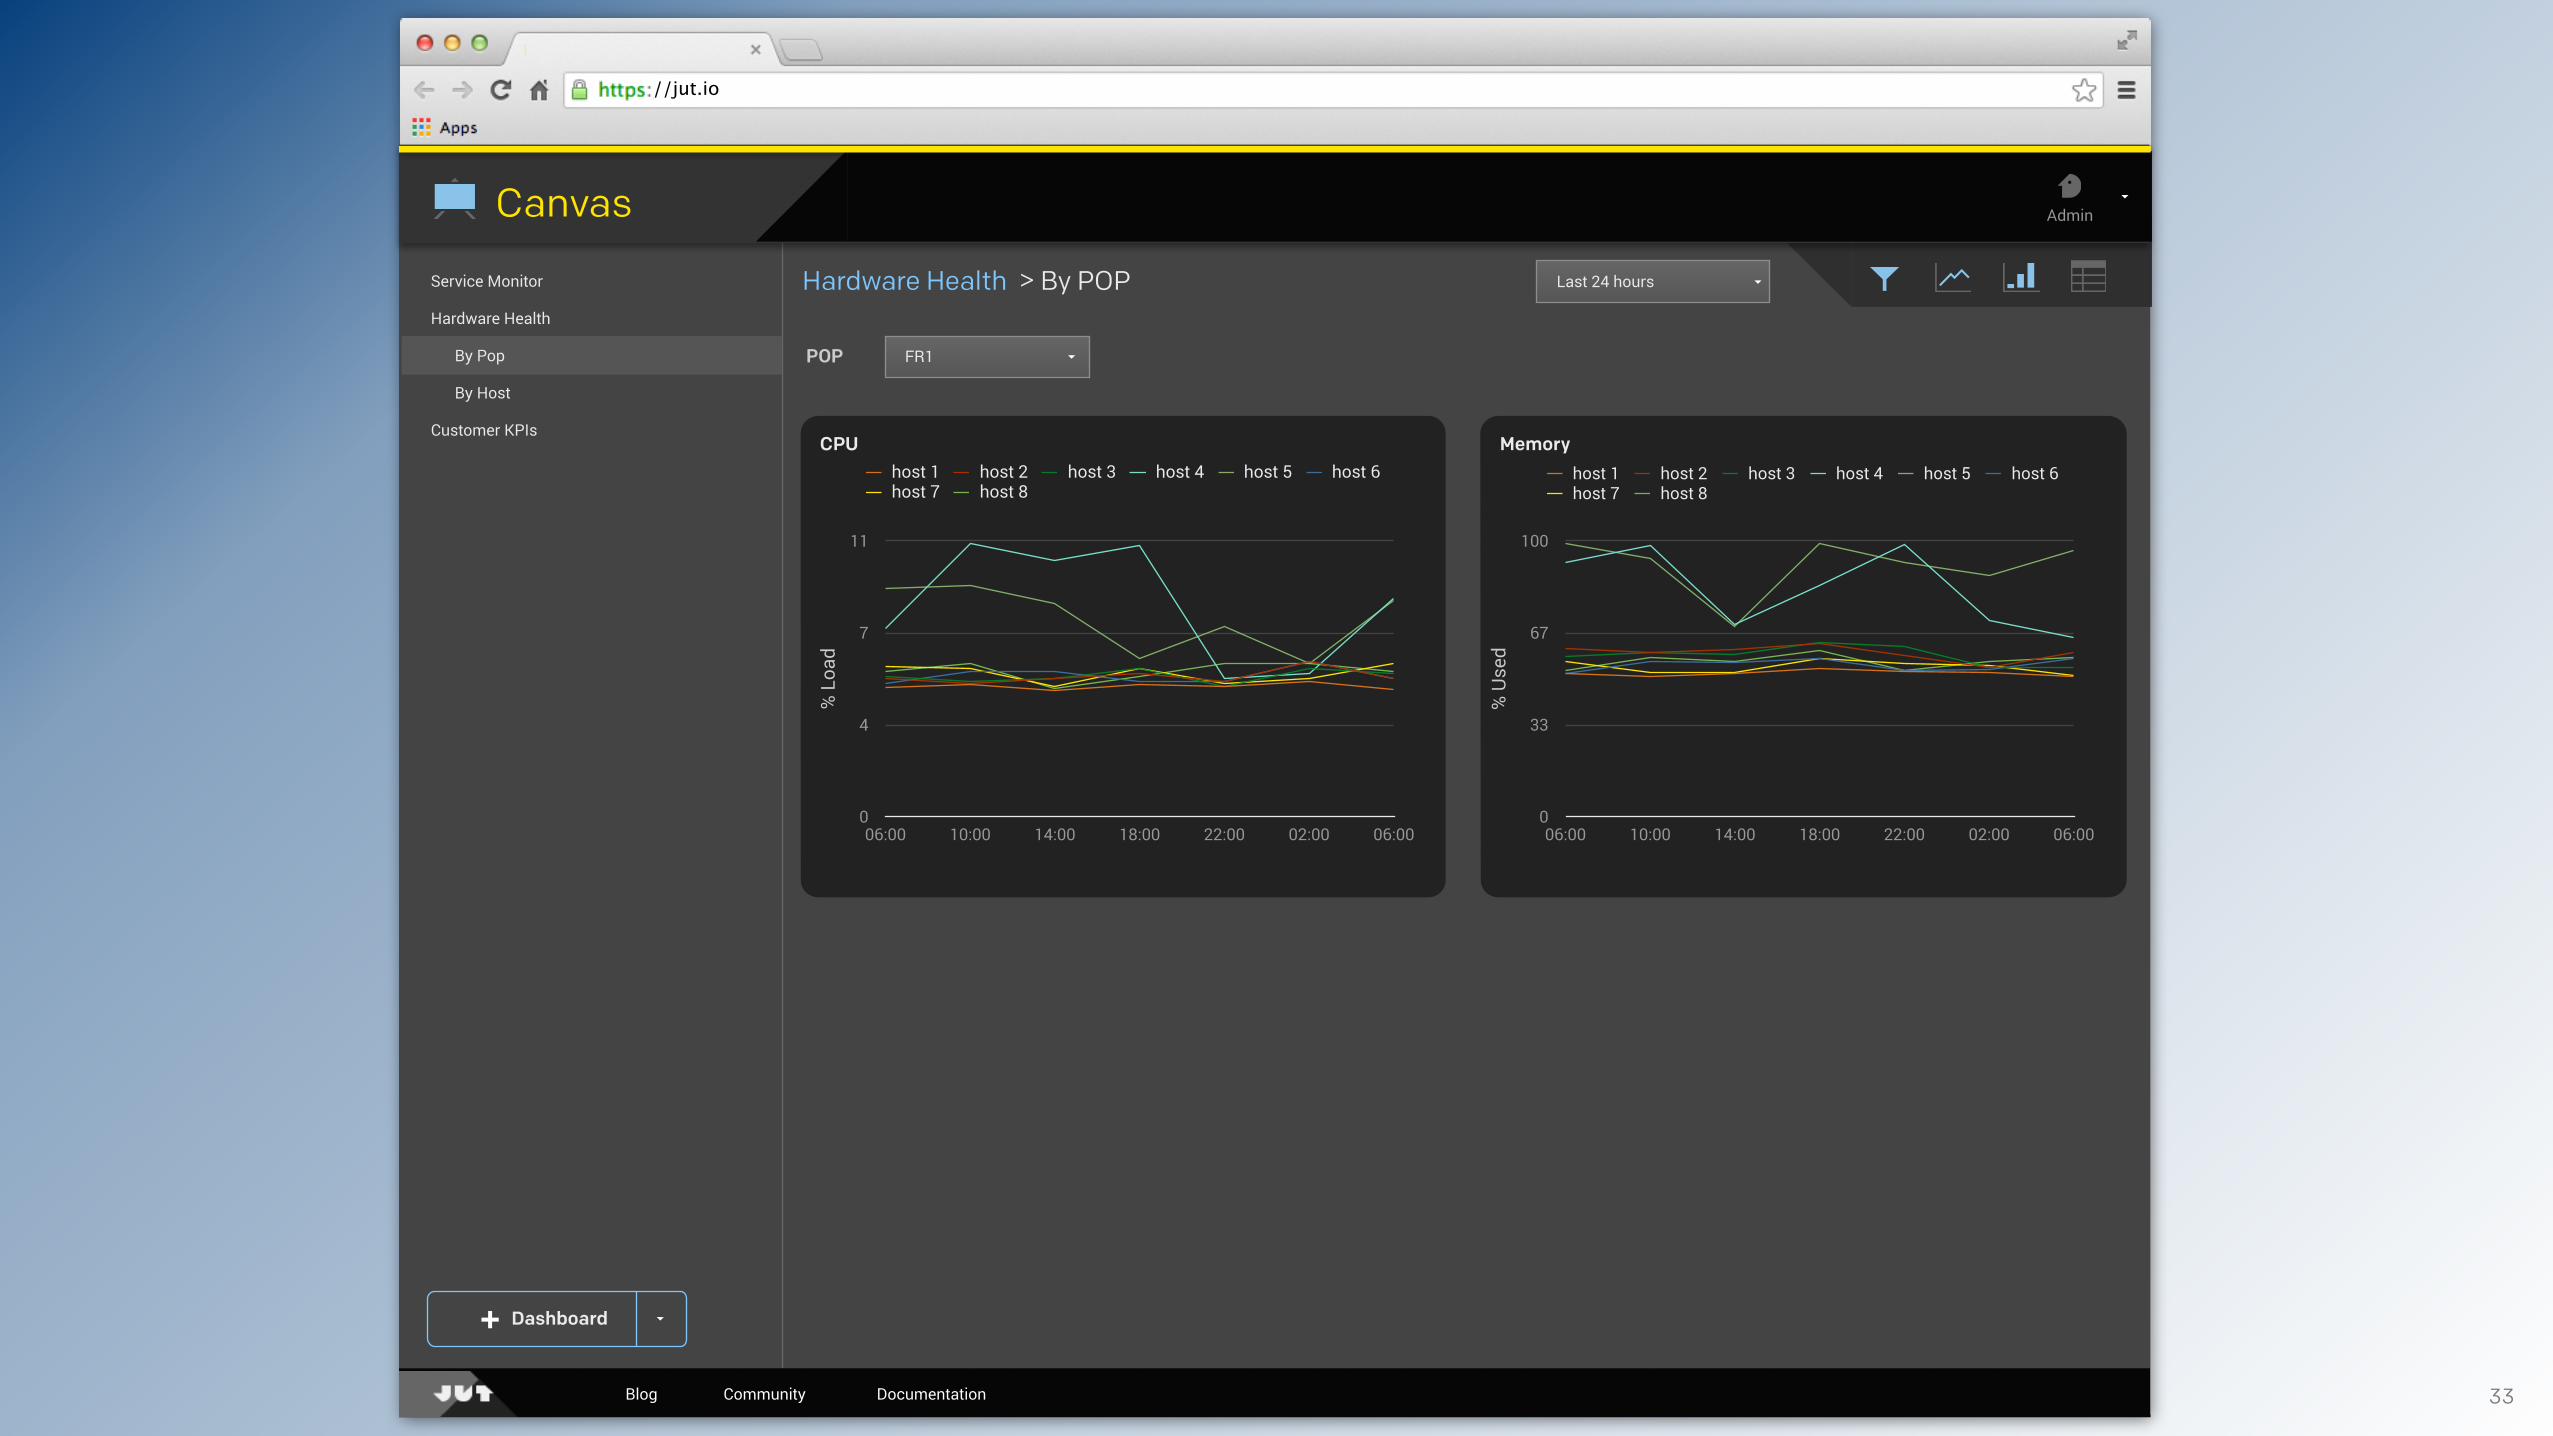
Blog Community Documentation 33
Hardware Health > By POP
CPU
% L
oad
0
4
7
11
06:00 10:00 14:00 18:00 22:00 02:00 06:00
host 1 host 2 host 3 host 4 host 5 host 6host 7 host 8
Memory
% U
sed
0
33
67
100
06:00 10:00 14:00 18:00 22:00 02:00 06:00
host 1 host 2 host 3 host 4 host 5 host 6host 7 host 8
FR1POP
Service Monitor
Hardware Health
By Pop
By Host
Customer KPIs

The prototype moves the conversation forward.
34
Hmmm. OK.Interesting.
Not entirely plausible.

Why prototype?Prototypes improve communication.
• They produce a shared reference for communication
• They encourage thinking in terms of stories
• They bring attention to interaction
35
Beginning Middle End

The design process creates a conversation around value.
By iterating models, the UX guy learns how to build tools for the Ops guy.
36
Featuresvalidate
iterate
validate
iterate
How can you use this process?1. Learn about your customers
2. Understand their perspectives
3. Find a shared understanding of the problem
4. Use a low risk, collaborative method to get to a solution
38

Learn about your customers1. Ask to interview them
1. Ask about their role
2. Ask about the background on their need
3. Ask them to describe success
2. Observe
1. Ask them to show you how they work
2. Pay attention to the difference between what they say and what they do
39
Understand their perspective1. Be humble
2. There are no dumb questions
3. Get them telling stories about their work, about challenges
4. Visualize your understanding
40

Find a shared understanding of the problem 1. Focus on understanding the problem first
2. Search for analogous problems
3. Use analogy to restate the problem
4. Validate that your customer agrees with the restatement
41

Use a low risk, collaborative method to get to a solution
1. Define learning objectives for each prototype or iteration
2. Use the lowest fidelity approach that captures the detail you need to understand
3. Tell stories with and about your prototype
4. Share your prototypes and encourage feedback
42

Be a modeler!Use models to communicate.
• Recognize models
• Build models
• Draw models
• Share models
• Talk about models
43

At Jut these we are using these design practices to build an operations data hub for unified analytics on logs, metrics and events.
Check it out at www.jut.io and let me know what you think.
Tim Sheiner
@tsheiner
44