where are my patients - geo-coding and spider analysis€¦ · analysis key steps • use dataprobe...
TRANSCRIPT

WHERE ARE MY PATIENTS?GEO CODING AND SPIDER ANALYSISGEO-CODING AND SPIDER ANALYSISSERUG, CHARLOTTE, NC
OKIM DUFOURSENIOR ANALYTIC CONSULTANTTHOMSON REUTERSAPRIL 27, 2010

AGENDA• INTRODUCTION
• ANALYSIS
• GEO-CODING OF ADDRESSES
• WHAT IS A SPIDER ANALYSIS?
• RESOURCES• RESOURCES
• Q AND A
Reu
ters
©20
10 T
hom
son
2

ANALYSISANALYSIS

ANALYSIS• Purpose:
– Identify where a physician’s patients are located
• Uses of Analysis: – Office expansion– Network analysis– Fraud detectionFraud detection
• Limitations:– Rural patients expected to travel further than urban or
Reu
ters
Rural patients expected to travel further than urban orsuburban
– Greater distances expected for some specialties
©20
10 T
hom
son
4
ANALYSIS KEY STEPS• Use DataProbe to calculate approximate distances
between providers and their patients using zip codes. Keep only those patients residing in the 95th
percentile for distances p
• Export provider and recipient files to MS Access for use as personal database
• Geo-code provider and patient addresses
• Generate spider diagrams
Reu
ters
Generate spider diagrams
NOTE: this demo uses de-identified data.
©20
10 T
hom
son
5
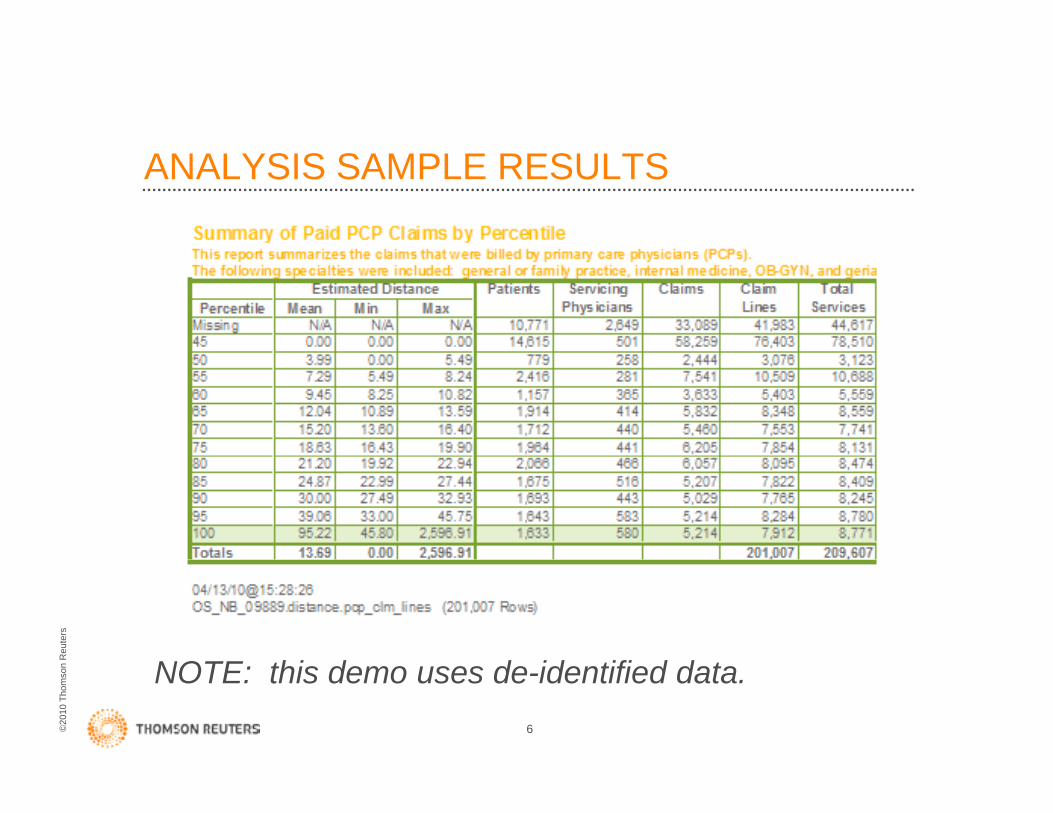
ANALYSIS SAMPLE RESULTS
Reu
ters
NOTE thi d d id tifi d d t
©20
10 T
hom
son
6
NOTE: this demo uses de-identified data.

GEO-CODING OF ADDRESSESGEO CODING OF ADDRESSES

GEO-CODING• Defined:
– GIS operation for converting street addresses into spatial data for display as a map feature• Source: A to Z GIS, Edited by Tasha Wade and Shelly
Sommer, ESRI Press
• ToolsA M– ArcMap
– ArcCatalog
Reu
ters
©20
10 T
hom
son
8
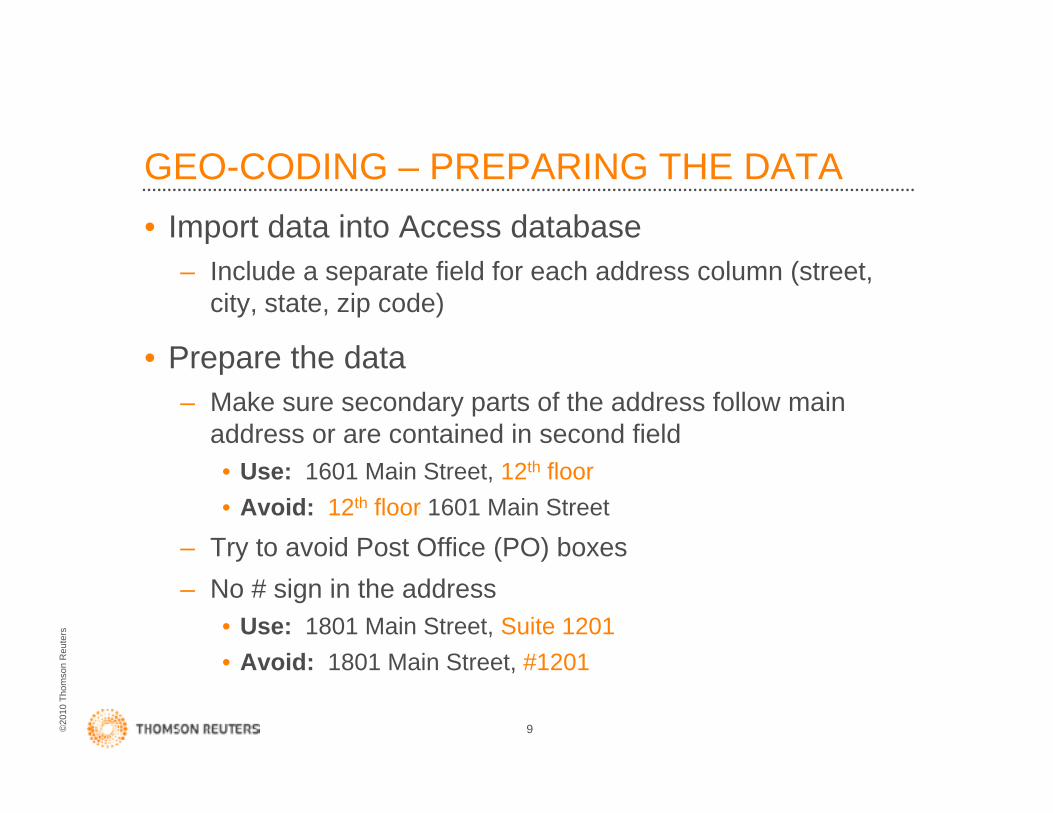
GEO-CODING – PREPARING THE DATA• Import data into Access database
– Include a separate field for each address column (street, city, state, zip code)
• Prepare the data• Prepare the data– Make sure secondary parts of the address follow main
address or are contained in second field• Use: 1601 Main Street, 12th floor• Avoid: 12th floor 1601 Main Street
– Try to avoid Post Office (PO) boxes
Reu
ters
y ( )– No # sign in the address
• Use: 1801 Main Street, Suite 1201• Avoid: 1801 Main Street #1201
©20
10 T
hom
son
9
• Avoid: 1801 Main Street, #1201

GEO-CODING – PREPARING THE DATA• Prepare the data, cont.
– Include directional prefixes• For example: 2000 N Main Street
– Avoid abbreviations in street namesAvoid abbreviations in street names• Use: James Cool Papa Bell• Avoid: James CP Bell
Use numeric format with street numbers– Use numeric format with street numbers• Use: 1 Central Street• Avoid: One Central Street
Reu
ters
• Refer to the references at the end of the presentation for additional tips
©20
10 T
hom
son
10

GEO-CODING• Steps
– Select geo-coding from menu
Reu
ters
©20
10 T
hom
son
11

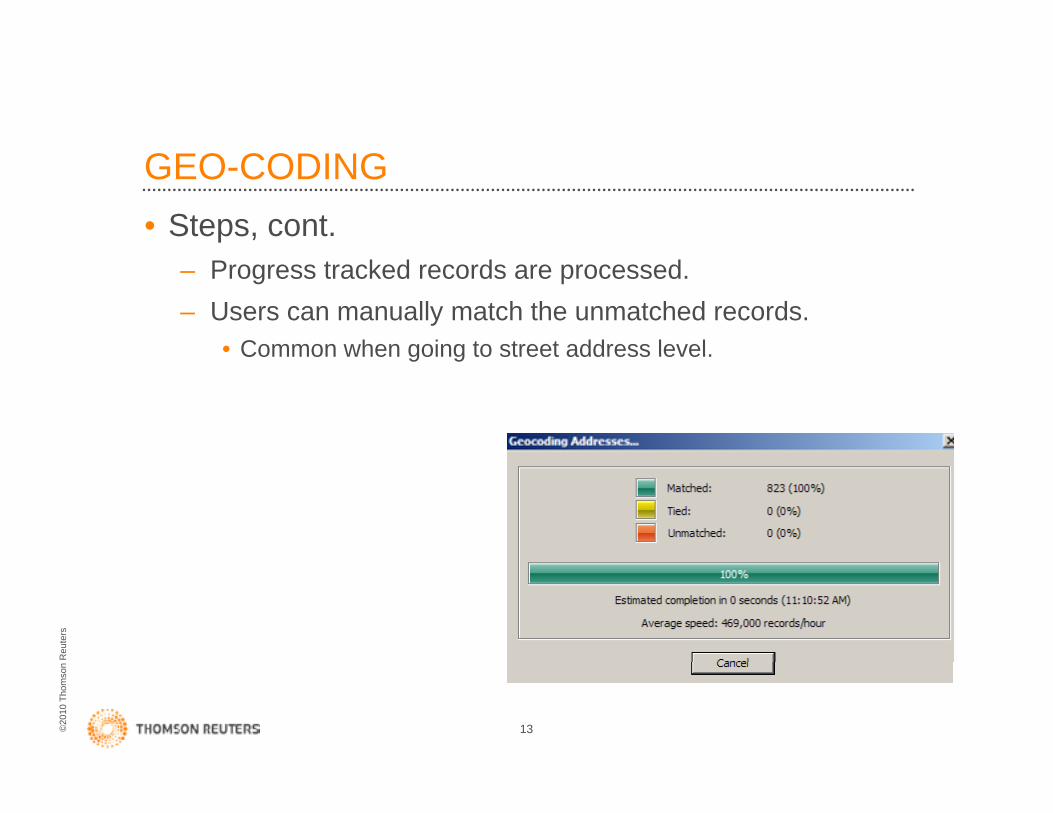
GEO-CODING• Steps, cont.
– Select composite map– Select field(s) for use with geo-coding
Select spatial reference– Select spatial reference
Reu
ters
©20
10 T
hom
son
12
GEO-CODING• Steps, cont.
– Progress tracked records are processed.– Users can manually match the unmatched records.
• Common when going to street address level.Common when going to street address level.
Reu
ters
©20
10 T
hom
son
13

GEO-CODING• Demonstration of the match to recipients.
Reu
ters
©20
10 T
hom
son
14
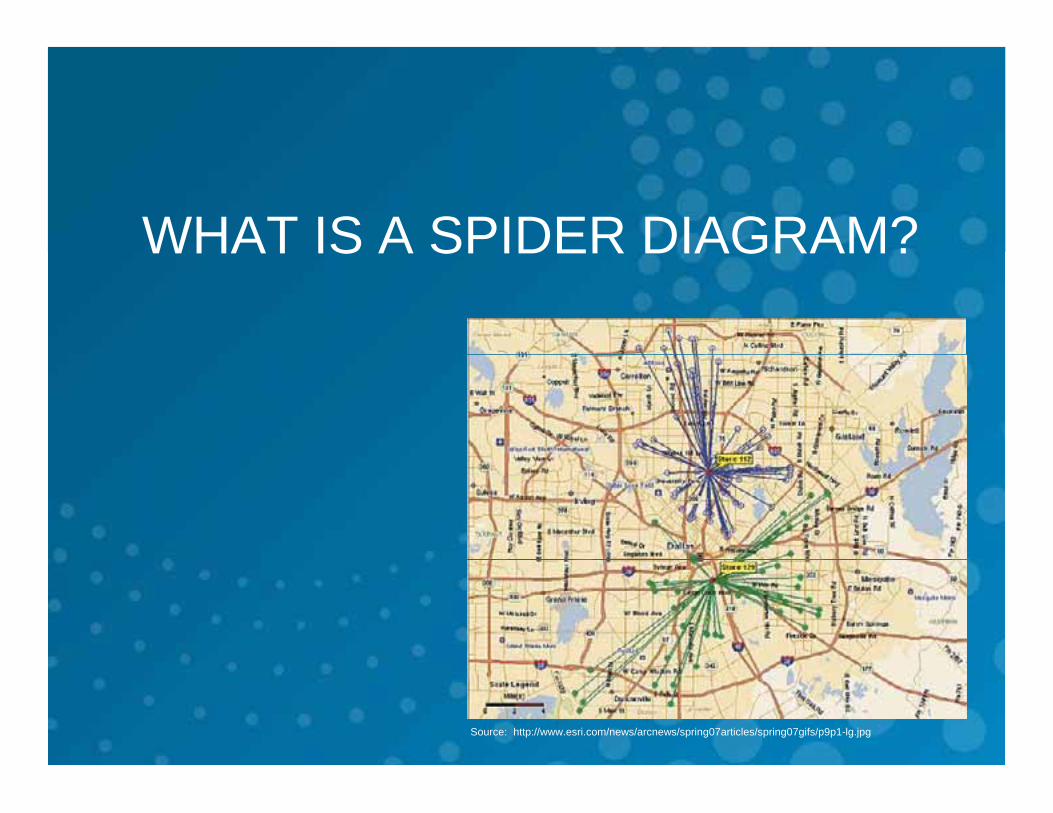
WHAT IS A SPIDER DIAGRAM?WHAT IS A SPIDER DIAGRAM?
Source: http://www.esri.com/news/arcnews/spring07articles/spring07gifs/p9p1-lg.jpg

WHAT IS A SPIDER DIAGRAM?• Defined:
– Line drawn between a location and its nearest source – For example: a physician practice location and the
residences of patients treated by physicianp y p y
• Benefits:– Easy to compare varying distancesy p y g– Very visual presentation of algorithm results
• Tips:
Reu
ters
– Limit the number of spider diagrams within a map for ease of use; for example, one provider per map
©20
10 T
hom
son
16

CREATING A SPIDER DIAGRAM• Steps:
– Identify individual provider to use for spider diagram and create layers with that provider’s address and patients
– Make sure spider analysis script installed in toolbox• Download from ESRI if necessaryy
– Generate Spider Diagram for individual provider
Reu
ters
©20
10 T
hom
son
17

CREATING A SPIDER DIAGRAM• Demonstration
Reu
ters
Click OK to execute spider script.
©20
10 T
hom
son
18

CREATING A SPIDER DIAGRAM• Demonstration
– Log will be generated with results
Reu
ters
©20
10 T
hom
son
19

CREATING A SPIDER DIAGRAM• Results:
– Dr. Douville had 121 patients who traveled 13.4 to 65.56 miles to see him. Of those, 117 traveled 47 miles or more. The map focuses
th h t l don those who traveled47 or more miles.
Reu
ters
©20
10 T
hom
son
20

RESOURCESRESOURCES
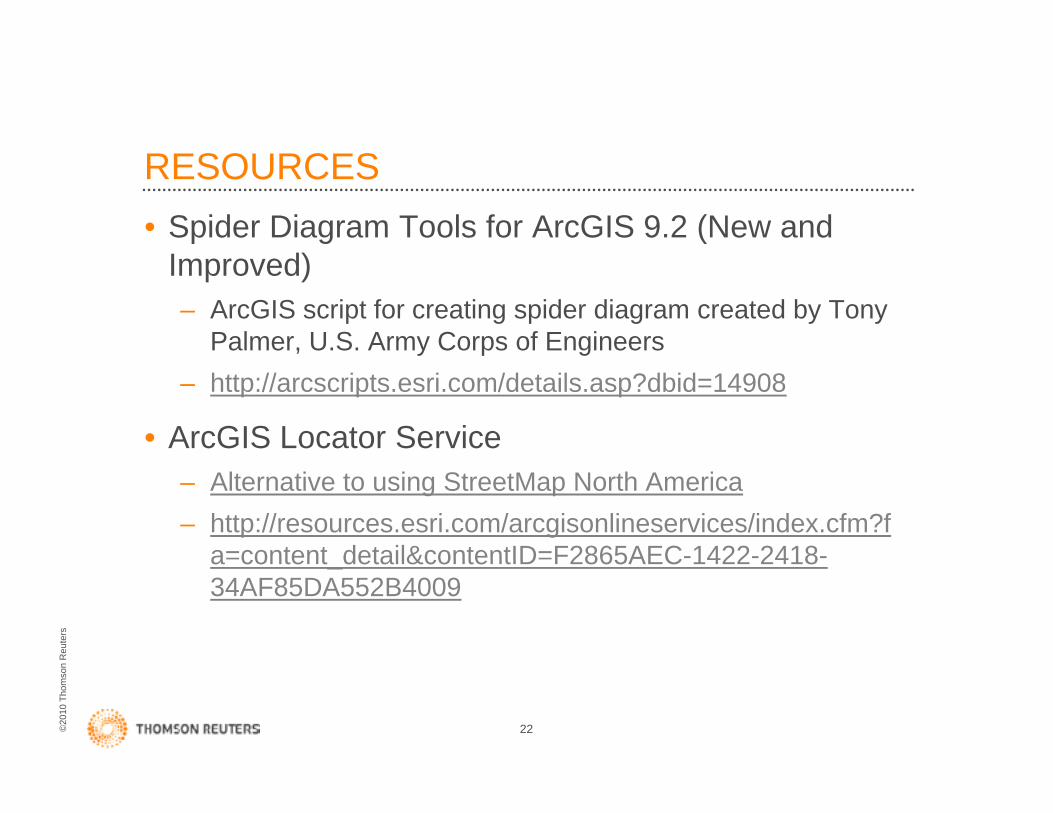
RESOURCES• Spider Diagram Tools for ArcGIS 9.2 (New and
Improved)– ArcGIS script for creating spider diagram created by Tony
Palmer, U.S. Army Corps of Engineersy p g– http://arcscripts.esri.com/details.asp?dbid=14908
• ArcGIS Locator Service– Alternative to using StreetMap North America– http://resources.esri.com/arcgisonlineservices/index.cfm?f
a=content detail&contentID=F2865AEC-1422-2418-
Reu
ters
a content_detail&contentID F2865AEC 1422 241834AF85DA552B4009
©20
10 T
hom
son
22

RESOURCES• Geocoding a table of addresses with StreetMap
North America data– http://webhelp.esri.com/arcgisdesktop/9.3/index.cfm?id=7
058&pid=7055&topicname=Geocoding_a_table_of_addrep p g_ _ _ _sses_with_StreetMap_North_America_data
• Personal Geodatabase 101– http://www.dhss.mo.gov/GIS/documents/PersonalGeodata
base101.pdf
• “The ESRI Guide to GIS Analysis: Volume 1
Reu
ters
• The ESRI Guide to GIS Analysis: Volume 1Geographic Patterns & Relationships” by Andy Mitchell, ESRI Press
©20
10 T
hom
son
23

RESOURCES• ArcGIS script for creating spider diagram created
by Tony Palmer, U.S. Army Corps of Engineers– http://www.dhss.mo.gov/GIS/documents/Geocode_Street
Map_HOWTO_Standard.pdfp_ _ p
• Best Practices – Preparation of Address Data for Geo-coding– http://www.dhss.mo.gov/GIS/documents/Geocode_Prepar
ingInputAddressData_BestPractices.pdf
“GIS for Health Organizations” by Laura Lang
Reu
ters
• “GIS for Health Organizations” by Laura Lang,ESRI Press
©20
10 T
hom
son
24

Q AND AQ AND A