where are the unbanked and underbanked in new york city? · 360,000 new york city households are...
TRANSCRIPT

Caroline Ratcliffe, Signe-Mary McKernan, Emma Kalish, and Steven Martin
September 2015
Nationwide, millions of Americans live on the economic margins. Nearly 10 million US
households (7.7 percent) are unbanked, meaning they do not have a checking or savings
account (FDIC 2014). Another 25 million (20.0 percent) are underbanked, meaning they
have checking or savings accounts but also use alternative financial services such as
check cashing or payday loans (FDIC 2014).
A bank account, which provides structure and a safe place to save money, may help people build
savings and assets (Barr and Blank 2009; Collins 2015; Rhine, Greene, and Toussaint-Comeau 2006).
On the other hand, the problem may be having sufficient income to save, not the bank account itself. For
example, over half of unbanked households (57.5 percent) cite not having enough money as a reason for
not having a bank account (FDIC 2014, 25).1 Minimum balance requirements, insufficient funds fees,
and overdraft fees can make bank accounts expensive and limit their value for low-income consumers;
and low fee, low balance bank accounts may not be profitable for banks. For some consumers, operating
outside the formal financial sector can be a better option.
Other consumers—the underbanked—straddle both the formal and informal sectors and get their
financial needs met by both traditional financial institutions and alternative financial service providers. Some
consumers turn to prepaid cards, which can be used to deposit money, pay bills, make purchases, and
withdraw cash at automated teller machines (ATM)—many of the functions bank accounts are used for.
There is a push to move beyond measuring unbanked and underbanked and focus on financial
health, which captures concepts including day-to-day financial management, resilience, and opportunity
(Gutman et al. 2015).2 The unbanked and underbanked have been shown to have lower financial health
(Gutman et al. 2015), so they can be considered a marker for financial health.
O P P O R T U N I T Y A N D O W N E R S H I P I N I T I A T I V E
Where Are the Unbanked and Underbanked in New York City?
360,000 New York City households are unbanked; another 780,000 are underbanked
This brief and an accompanying interactive map were commissioned by the New York City
Department of Consumer Affairs’ Office of Financial Empowerment. The brief provides information on
how many New Yorkers are unbanked and underbanked, recognizing their links to financial health. It
also illustrates New Yorkers’ use of prepaid cards. Prepaid cards provide much of the same functionality
as bank accounts, so they can be used as an alternative. We look at the city as a whole as well as
separately in the five boroughs and 55 neighborhoods. This local look provides new neighborhood
information to a field where national statistics dominate. Key findings include the following:
In total, 360,000 households in New York City are unbanked and 780,000 are underbanked.
The city’s shares of unbanked and underbanked are higher than the national average. In 2013,
11.7 percent of New Yorkers were unbanked and 25.1 percent were underbanked, compared
with 7.7 percent and 20.0 percent, respectively, of US households.
Between 2011 and 2013 the percent of New Yorkers who were unbanked went down while the
percent underbanked went up, but the total (or cumulative) percent unbanked and
underbanked was unchanged (37 percent).
The Bronx has the highest share of unbanked (21.8 percent) and underbanked (30.5 percent)
households. Staten Island has the lowest share of unbanked households (7.2 percent) and is on
par with Manhattan for the lowest share of underbanked households (18.8 percent).
Nearly 13 percent of households in New York City have used a prepaid card.
Our local-level estimates come from model-based predictions using data from the FDIC National
Survey of Unbanked and Underbanked Households and the American Community Survey.3 For more
details, see the data and methods box at the end of this brief.
To bring the statistics to life and capture the perspective and insights of New Yorkers’ experiences
with financial institutions and alternative financial services, this brief incorporates qualitative findings
from a companion RTI International study (2014) that interviewed 30 low-income New Yorkers. These
New Yorkers were selected because they live in neighborhoods with a high share of unbanked or
underbanked people.
The remainder of this brief details the unbanked, underbanked, and prepaid card-using populations
in New York City, its five boroughs, and its 55 neighborhoods. We focus on 2013—the most recent year
data are available—but also make comparisons to 2011.
2 W H E R E A R E T H E U N B A N K E D A N D U N D E R B A N K E D I N N E W Y O R K C I T Y ?
The Unbanked Population
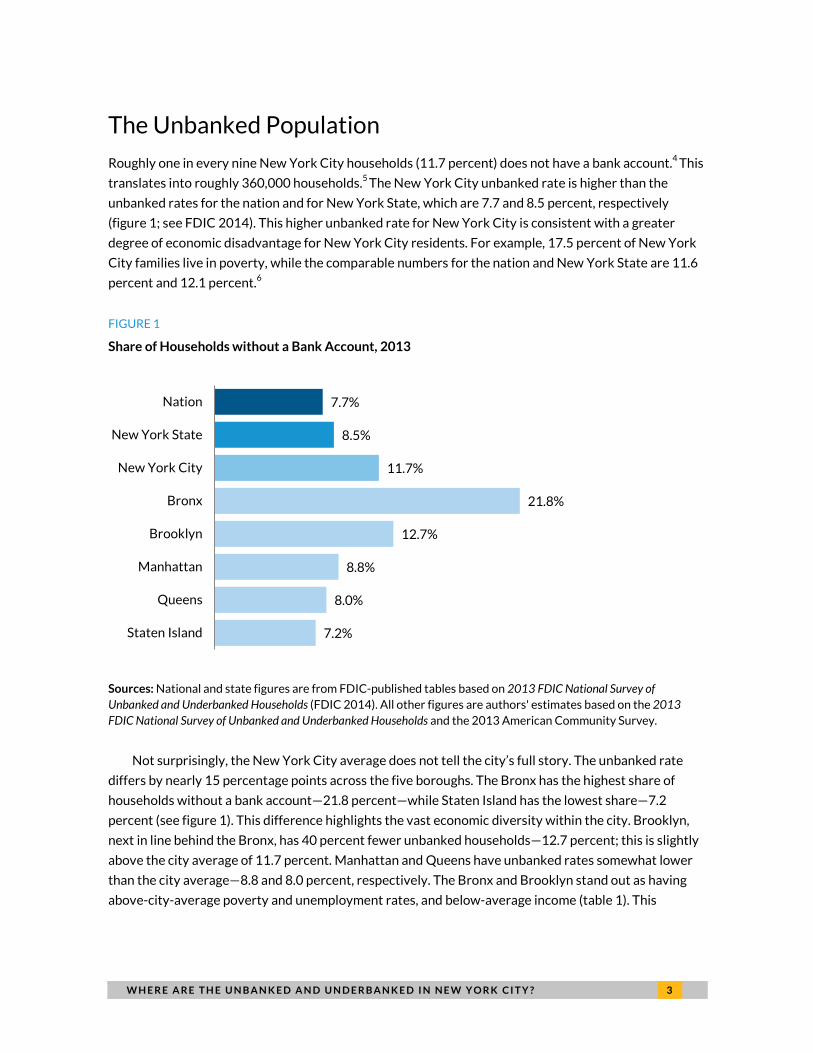
Roughly one in every nine New York City households (11.7 percent) does not have a bank account.4 This
translates into roughly 360,000 households.5 The New York City unbanked rate is higher than the
unbanked rates for the nation and for New York State, which are 7.7 and 8.5 percent, respectively
(figure 1; see FDIC 2014). This higher unbanked rate for New York City is consistent with a greater
degree of economic disadvantage for New York City residents. For example, 17.5 percent of New York
City families live in poverty, while the comparable numbers for the nation and New York State are 11.6
percent and 12.1 percent.6
FIGURE 1
Share of Households without a Bank Account, 2013
Sources: National and state figures are from FDIC-published tables based on 2013 FDIC National Survey of Unbanked and Underbanked Households (FDIC 2014). All other figures are authors' estimates based on the 2013 FDIC National Survey of Unbanked and Underbanked Households and the 2013 American Community Survey.
Not surprisingly, the New York City average does not tell the city’s full story. The unbanked rate
differs by nearly 15 percentage points across the five boroughs. The Bronx has the highest share of
households without a bank account—21.8 percent—while Staten Island has the lowest share—7.2
percent (see figure 1). This difference highlights the vast economic diversity within the city. Brooklyn,
next in line behind the Bronx, has 40 percent fewer unbanked households—12.7 percent; this is slightly
above the city average of 11.7 percent. Manhattan and Queens have unbanked rates somewhat lower
than the city average—8.8 and 8.0 percent, respectively. The Bronx and Brooklyn stand out as having
above-city-average poverty and unemployment rates, and below-average income (table 1). This
7.7%
8.5%
11.7%
21.8%
12.7%
8.8%
8.0%
7.2%
Nation
New York State
New York City
Bronx
Brooklyn
Manhattan
Queens
Staten Island
W H E R E A R E T H E U N B A N K E D A N D U N D E R B A N K E D I N N E W Y O R K C I T Y ? 3

suggests that there are multiple aspects to the disadvantage in these areas and multiple avenues for
addressing people’s needs.
TABLE 1
Characteristics of New York City and the Five Boroughs, 2013
Share of families living in poverty Median income
Share of population unemployed
Share of population foreign-born
New York City 17.5% $58,012 8.7% 37.0%
Brooklyn 19.5% $47,520 9.4% 37.2%
Bronx 27.6% $33,009 11.8% 33.7%
Manhattan 14.8% $72,190 7.2% 28.4%
Queens 12.3% $56,599 7.8% 48.1%
Staten Island 10.3% $69,633 7.8% 20.4%
Sources: Poverty share, median income, and foreign-born share from authors' calculations based on 2013 American Community Survey data. Unemployment data from Bureau of Labor Statistics Local Area Unemployment Statistics.
Two views on bank accounts:
• “I like having a bank account because it makes me feel professional.”
• “There's always a hidden fee; a surcharge or something.”
Bushwick, Brooklyn, and Washington Heights, Manhattan, residents (RTI International 2014)
Our analyses show that between 2011 and 2013, the unbanked rate fell in New York City, following
the national trend. Nationally, the unbanked rate fell from 8.2 percent in 2011 to 7.7 percent in 2013,7
while it fell in New York City from 14.3 percent to 11.7 percent (table 2). There were also declines in
four of the five boroughs: the Bronx, Brooklyn, Manhattan, and Queens. The borough with the lowest
unbanked rate in 2011—Staten Island—did not experience a declining rate over this period. Staten
Island is the only borough to experience upticks in the unemployment or poverty rates between 2011
and 2013 (appendix table A.2).8 The decline in New York City’s unbanked rate is consistent with
decreases in New York City’s unemployment and poverty rates. New York City’s unemployment rate
went from 9.1 percent in 2011 to 8.7 percent in 2013, and the poverty rate fell from 18.0 percent to
17.5 percent.
4 W H E R E A R E T H E U N B A N K E D A N D U N D E R B A N K E D I N N E W Y O R K C I T Y ?
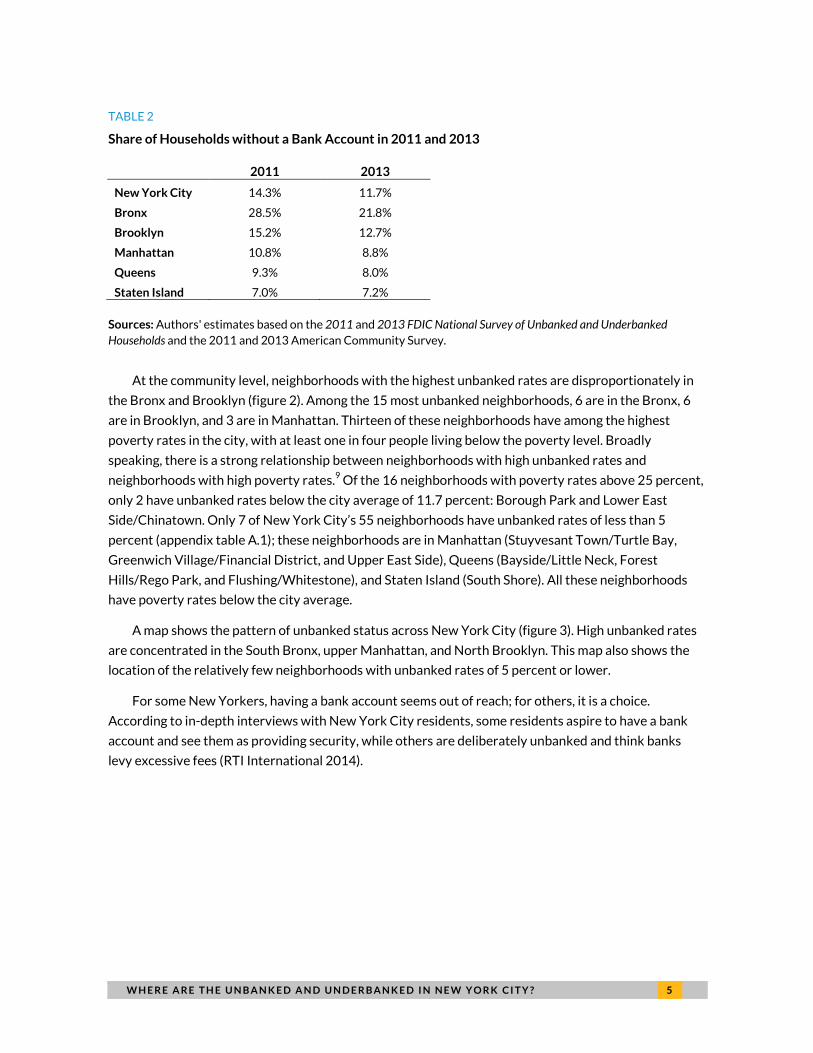
TABLE 2
Share of Households without a Bank Account in 2011 and 2013
2011 2013
New York City 14.3% 11.7%
Bronx 28.5% 21.8%
Brooklyn 15.2% 12.7%
Manhattan 10.8% 8.8%
Queens 9.3% 8.0%
Staten Island 7.0% 7.2%
Sources: Authors' estimates based on the 2011 and 2013 FDIC National Survey of Unbanked and Underbanked Households and the 2011 and 2013 American Community Survey.
At the community level, neighborhoods with the highest unbanked rates are disproportionately in
the Bronx and Brooklyn (figure 2). Among the 15 most unbanked neighborhoods, 6 are in the Bronx, 6
are in Brooklyn, and 3 are in Manhattan. Thirteen of these neighborhoods have among the highest
poverty rates in the city, with at least one in four people living below the poverty level. Broadly
speaking, there is a strong relationship between neighborhoods with high unbanked rates and
neighborhoods with high poverty rates.9 Of the 16 neighborhoods with poverty rates above 25 percent,
only 2 have unbanked rates below the city average of 11.7 percent: Borough Park and Lower East
Side/Chinatown. Only 7 of New York City’s 55 neighborhoods have unbanked rates of less than 5
percent (appendix table A.1); these neighborhoods are in Manhattan (Stuyvesant Town/Turtle Bay,
Greenwich Village/Financial District, and Upper East Side), Queens (Bayside/Little Neck, Forest
Hills/Rego Park, and Flushing/Whitestone), and Staten Island (South Shore). All these neighborhoods
have poverty rates below the city average.
A map shows the pattern of unbanked status across New York City (figure 3). High unbanked rates
are concentrated in the South Bronx, upper Manhattan, and North Brooklyn. This map also shows the
location of the relatively few neighborhoods with unbanked rates of 5 percent or lower.
For some New Yorkers, having a bank account seems out of reach; for others, it is a choice.
According to in-depth interviews with New York City residents, some residents aspire to have a bank
account and see them as providing security, while others are deliberately unbanked and think banks
levy excessive fees (RTI International 2014).
W H E R E A R E T H E U N B A N K E D A N D U N D E R B A N K E D I N N E W Y O R K C I T Y ? 5
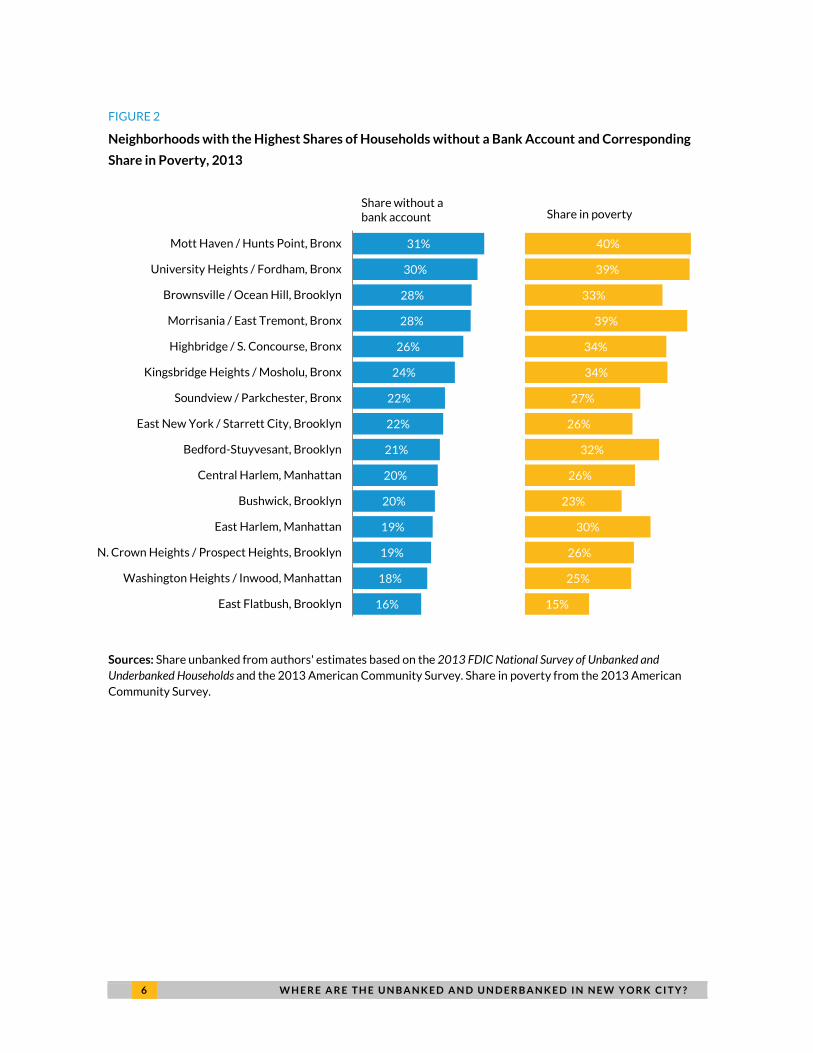
FIGURE 2
Neighborhoods with the Highest Shares of Households without a Bank Account and Corresponding
Share in Poverty, 2013
Sources: Share unbanked from authors' estimates based on the 2013 FDIC National Survey of Unbanked and Underbanked Households and the 2013 American Community Survey. Share in poverty from the 2013 American Community Survey.
31%
30%
28%
28%
26%
24%
22%
22%
21%
20%
20%
19%
19%
18%
16%
40%
39%
33%
39%
34%
34%
27%
26%
32%
26%
23%
30%
26%
25%
15%
Mott Haven / Hunts Point, Bronx
University Heights / Fordham, Bronx
Brownsville / Ocean Hill, Brooklyn
Morrisania / East Tremont, Bronx
Highbridge / S. Concourse, Bronx
Kingsbridge Heights / Mosholu, Bronx
Soundview / Parkchester, Bronx
East New York / Starrett City, Brooklyn
Bedford-Stuyvesant, Brooklyn
Central Harlem, Manhattan
Bushwick, Brooklyn
East Harlem, Manhattan
N. Crown Heights / Prospect Heights, Brooklyn
Washington Heights / Inwood, Manhattan
East Flatbush, Brooklyn
Share without a bank account Share in poverty
6 W H E R E A R E T H E U N B A N K E D A N D U N D E R B A N K E D I N N E W Y O R K C I T Y ?

FIGURE 3
Share of Households without a Bank Account, 2013
Sources: Authors’ estimates based on the 2013 FDIC National Survey of Unbanked and Underbanked Households and the 2013 American Community Survey. Note: Areas within the city limits that are shaded in gray include airports and parks over 0.75 square miles.
The Underbanked Population
More than one in four New York City households (25.1 percent) is underbanked; these New Yorkers
have a checking or savings account but still rely on someplace other than a bank to cash a check,
purchase a money order, transfer money internationally, take out a loan (e.g., tax refund loan or
pawnbroker loan), or use rent-to-own services. This translates into roughly 780,000 underbanked New
York City households.10 Similar to the unbanked rate, New York City’s underbanked rate is higher than
the national and state rates, which are 20.0 percent and 19.6 percent, respectively (figure 4; FDIC
2014). The higher underbanked rate reflects the relative economic disadvantage of New York City, as
described above. Some New Yorkers with bank accounts explained that they use check-cashing services
to transfer money or cash checks and pawnshops to gain extra income (RTI International 2014).
W H E R E A R E T H E U N B A N K E D A N D U N D E R B A N K E D I N N E W Y O R K C I T Y ? 7

Two views on check-cashing services:
• “They are very convenient and very professional.”
• “I don’t like check-cashing places, but unfortunately I have to deal with them.”
East Harlem, Manhattan, and Washington Heights, Manhattan, residents (RTI International 2014)
FIGURE 4
Share of Households with a Bank Account That Also Use Alternative Financial Services (AFS), 2013
Sources: National and state numbers are from FDIC-published tables based on the 2013 FDIC National Survey of Unbanked and Underbanked Households (FDIC 2014). All other numbers are authors' estimates based on the 2013 FDIC National Survey of Unbanked and Underbanked Households and the 2013 American Community Survey. Note: Alternative financial services (AFS) include check-cashing services, nonbank money orders or money transfers, payday loans, pawnshops, rent-to-own agreements, and refund anticipation loans.
Among the boroughs, the Bronx has the highest share of underbanked households (30.5 percent),
followed by Brooklyn (26.6 percent), Queens (25.1 percent), Manhattan (21.1 percent), and Staten
Island (18.8 percent) (figure 4). The Bronx has the highest poverty and unemployment rates to go along
with its high share of underbanked households, followed by Brooklyn (see table 1). Queens has a
relatively high underbanked rate as compared with Manhattan and Staten Island, given the relatively
similar poverty and unemployment rates of the three boroughs. The large share of immigrants in
Queens—highest among the five boroughs (table 1)—is a possible explanation. Immigrants are likely to
use nonbank money-transfer services to send money internationally. Both banked and unbanked
immigrants show a preference for nonbank remittance services (New York City Department of
Consumer Affairs 2013).
20.0%
19.6%
25.1%
30.5%
26.6%
21.1%
25.1%
18.8%
Nation
New York State
New York City
Bronx
Brooklyn
Manhattan
Queens
Staten Island
8 W H E R E A R E T H E U N B A N K E D A N D U N D E R B A N K E D I N N E W Y O R K C I T Y ?

Immigrants are likely to use alternative financial services to send money internationally.
Between 2011 and 2013 the share of underbanked households in New York City increased from
22.4 percent to 25.1 percent (table 3).11 This increase offsets the decline in the unbanked rate between
2011 and 2013 (from 14.3 percent to 11.7 percent), leaving the share of New Yorkers that are
unbanked or underbanked virtually unchanged over this period (36.8 percent). The underbanked rates
increased in four boroughs (the Bronx, Brooklyn, Manhattan, and Staten Island), with three of these
boroughs also experiencing decreases in the unbanked rates (the Bronx, Brooklyn, and Manhattan). In
Queens, the underbanked rate remained steady over time, while the unbanked rate fell.
TABLE 3
Share of Households with a Bank Account That Also Use AFS in 2011 and 2013
2011 2013
New York City 22.4% 25.1%
Bronx 26.8% 30.5%
Brooklyn 22.7% 26.6%
Manhattan 17.4% 21.1%
Queens 25.2% 25.1%
Staten Island 17.4% 18.8%
Sources: Authors' estimates based on the 2011 and 2013 FDIC National Survey of Unbanked and Underbanked Households and the 2011 and 2013 American Community Survey. Note: Alternative financial services (AFS) include check-cashing services, nonbank money orders or money transfers, payday loans, pawnshops, rent-to-own agreements, and refund anticipation loans.
At the neighborhood level, at least 25 percent of households are underbanked in 28 neighborhoods
(appendix table A.1). Among the 15 most underbanked neighborhoods, the shares range from 41.4
percent to 30.1 percent (figure 5). These neighborhoods are in the Bronx (6 neighborhoods), Brooklyn (5
neighborhoods), Queens (3 neighborhoods), and Manhattan (2 neighborhoods). Brooklyn’s East
Flatbush neighborhood has the highest share of underbanked households. Of New York City’s 55
neighborhoods, Staten Island’s South Shore has the lowest share at 16.0 percent. Generally,
underbanked neighborhoods are more likely to have a high unemployment rate but not necessarily a
high poverty rate.12 For example, two neighborhoods with underbanked rates of at least 30 percent
have poverty rates of less than 10 percent (well below the city average).
W H E R E A R E T H E U N B A N K E D A N D U N D E R B A N K E D I N N E W Y O R K C I T Y ? 9
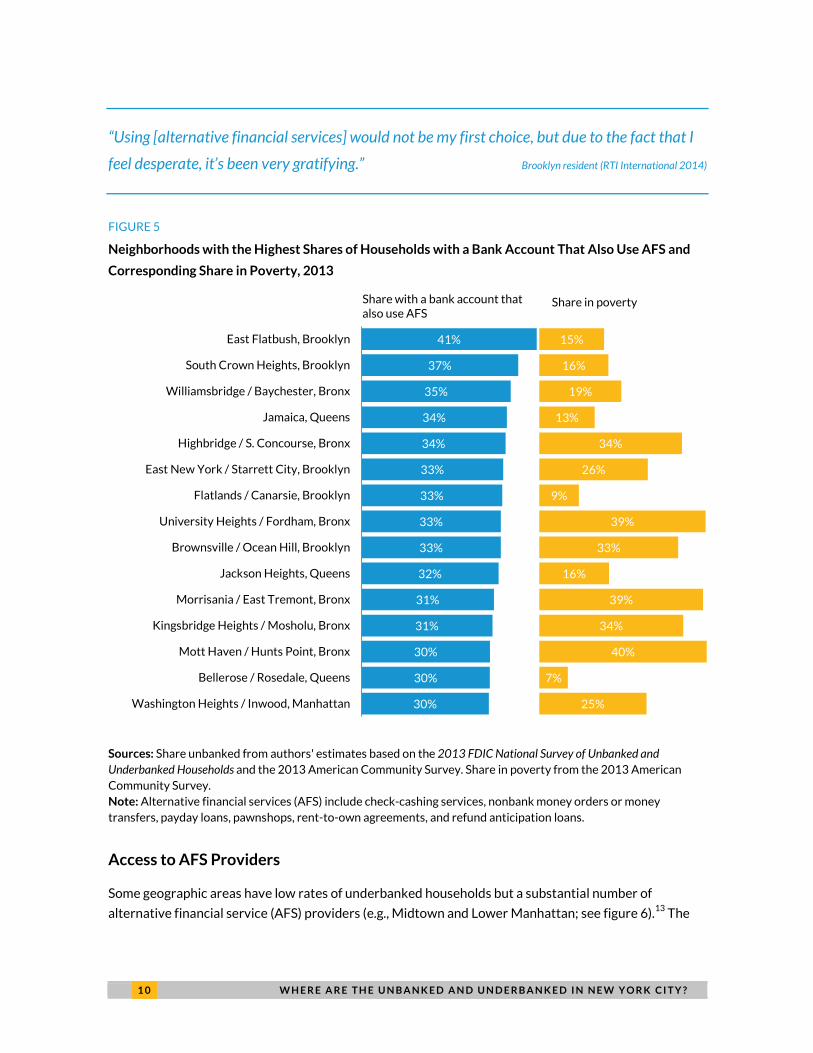
“Using [alternative financial services] would not be my first choice, but due to the fact that I
feel desperate, it’s been very gratifying.” Brooklyn resident (RTI International 2014)
FIGURE 5
Neighborhoods with the Highest Shares of Households with a Bank Account That Also Use AFS and
Corresponding Share in Poverty, 2013
Sources: Share unbanked from authors' estimates based on the 2013 FDIC National Survey of Unbanked and Underbanked Households and the 2013 American Community Survey. Share in poverty from the 2013 American Community Survey. Note: Alternative financial services (AFS) include check-cashing services, nonbank money orders or money transfers, payday loans, pawnshops, rent-to-own agreements, and refund anticipation loans.
Access to AFS Providers
Some geographic areas have low rates of underbanked households but a substantial number of
alternative financial service (AFS) providers (e.g., Midtown and Lower Manhattan; see figure 6).13 The
41%
37%
35%
34%
34%
33%
33%
33%
33%
32%
31%
31%
30%
30%
30%
15%
16%
19%
13%
34%
26%
9%
39%
33%
16%
39%
34%
40%
7%
25%
East Flatbush, Brooklyn
South Crown Heights, Brooklyn
Williamsbridge / Baychester, Bronx
Jamaica, Queens
Highbridge / S. Concourse, Bronx
East New York / Starrett City, Brooklyn
Flatlands / Canarsie, Brooklyn
University Heights / Fordham, Bronx
Brownsville / Ocean Hill, Brooklyn
Jackson Heights, Queens
Morrisania / East Tremont, Bronx
Kingsbridge Heights / Mosholu, Bronx
Mott Haven / Hunts Point, Bronx
Bellerose / Rosedale, Queens
Washington Heights / Inwood, Manhattan
Share with a bank account that also use AFS
Share in poverty
1 0 W H E R E A R E T H E U N B A N K E D A N D U N D E R B A N K E D I N N E W Y O R K C I T Y ?

most eastern part of Queens has a high underbanked rate but a modest number of AFS providers. New
Yorkers could be using AFS providers near work as well as near home or outside the city. Another
potential explanation is that some neighborhoods are so diverse that one part of the neighborhood uses
AFS and another part does not.14
FIGURE 6
Share of Households with a Bank Account That Also Use AFS and Location of AFS Providers
Sources: Authors’ estimates based on the 2013 FDIC National Survey of Unbanked and Underbanked Households and the 2013 American Community Survey. Alternative financial service location data from InfoUSA, December 2013. Notes: Areas within the city limits that are shaded in gray include airports and parks over 0.75 square miles. Alternative financial services (AFS) include check-cashing services, nonbank money orders or money transfers, payday loans, pawnshops, rent-to-own agreements, and refund anticipation loans.
Use of Prepaid Cards
Though prepaid cards are not new, they have evolved and become more prevalent over time (Federal
Reserve System 2014; Wilshusen et al. 2012). Nationally, 12.7 percent of households reported ever
W H E R E A R E T H E U N B A N K E D A N D U N D E R B A N K E D I N N E W Y O R K C I T Y ? 1 1

using a prepaid card in 2013, up from 10.1 percent in 2011 (FDIC 2014). When focusing on more recent
prepaid card use, the prevalence of use is lower. In 2013, 7.9 percent of households reported using a
prepaid card in the past 12 months (FDIC 2014).15
Predictably, prepaid card use is higher among unbanked and underbanked households than fully
banked households. Though 22.3 percent of unbanked households and 13.1 percent of underbanked
households used a prepaid card in the past 12 months, only 5.3 percent of fully banked households did
so (FDIC 2014). Use of prepaid cards by both unbanked and banked households suggests that prepaid
cards can substitute for and complement a bank account.
Our analyses suggest that 12.1 percent of New York City households have used a prepaid card—
slightly lower than the national average of 12.7 percent. We might expect greater use of prepaid cards
in New York City since the city has above-average unbanked and underbanked rates (compared with
the nation as a whole).
Prepaid card use is relatively similar across the five boroughs. This similarity differs from the wide
variation in boroughs’ unbanked and underbanked status. The Bronx, the borough with the highest
unbanked and underbanked rates, has the largest share of households that have used a prepaid card—
13.9 percent (figure 7).
FIGURE 7
Share of Households Ever Use Prepaid Cards, 2013
Sources: National and state numbers are from authors' calculations of FDIC-published tables based on 2013 FDIC National Survey of Unbanked and Underbanked Households (FDIC 2013). All other numbers are authors' estimates based on data from the 2013 FDIC National Survey of Unbanked and Underbanked Households and the 2013 American Community Survey.
12.7%
11.4%
12.1%
13.9%
12.6%
12.5%
10.3%
11.3%
Nation
New York State
New York City
Bronx
Brooklyn
Manhattan
Queens
Staten Island
1 2 W H E R E A R E T H E U N B A N K E D A N D U N D E R B A N K E D I N N E W Y O R K C I T Y ?

Brooklyn and Manhattan share the second spot with roughly 12.5 percent of households having
used a prepaid card. We might expect greater use of prepaid cards in Brooklyn (versus Manhattan), as
the share of unbanked and underbanked households is higher in Brooklyn. Queens—a borough with a
relatively low unbanked rate but an underbanked rate that matches the city average—has the lowest
share of households (10.3 percent) that have used a prepaid card.
Following the national trend, the share of households that used a prepaid card increased in New
York City and in each of the five boroughs between 2011 and 2013 (table 4). Across the city, 10.5
percent of households had used a prepaid card by 2011, while 12.1 percent had done so by 2013—an
increase of 1.6 percentage points. Increases in prepaid card use in the boroughs between 2011 and
2013 are in roughly the 1 to 2 percentage point range.
TABLE 4
Share of Households Ever Use Prepaid Cards, 2011 and 2013
2011 2013
New York City 10.5% 12.1%
Bronx 12.0% 13.9%
Brooklyn 10.9% 12.6%
Manhattan 10.2% 12.5%
Queens 9.5% 10.3%
Staten Island 9.6% 11.3%
Sources: Authors' estimates based on the 2011 and 2013 FDIC National Survey of Unbanked and Underbanked Households and the 2011 and 2013 American Community Survey.
Neighborhoods with the highest prepaid card use are in the Bronx and Brooklyn. Among the 15
neighborhoods with the highest share of households that have ever used a prepaid card, 13 are in the
Bronx or Brooklyn (figures 8 and 9). The other two neighborhoods are in Manhattan. Only three
neighborhoods—all located in Queens—have fewer than 9 percent of households that have ever used a
prepaid card (appendix table A.1). By and large, neighborhoods with high prepaid card usage rates are
neighborhoods with high unbanked rates. Use of prepaid cards also tends to be greater in poorer
neighborhoods but the link is not equally strong in all neighborhoods.16
W H E R E A R E T H E U N B A N K E D A N D U N D E R B A N K E D I N N E W Y O R K C I T Y ? 1 3

FIGURE 8
Neighborhoods with the Highest Shares of Households Ever Use Prepaid Cards and Corresponding
Share in Poverty, 2013
Sources: Share prepaid card use from authors' estimates based on the 2013 FDIC National Survey of Unbanked and Underbanked Households and the 2013 American Community Survey. Share in poverty from the 2013 American Community Survey.
“[Prepaid card providers] charge so much,” but “I can’t have a bank card right now, so that’s
the next best thing.” Morris Heights, Bronx, resident (RTI International 2014)
17%
16%
16%
16%
16%
15%
15%
15%
15%
14%
14%
14%
14%
13%
13%
33%
32%
40%
26%
39%
26%
26%
39%
30%
34%
16%
27%
14%
34%
21%
Brownsville / Ocean Hill, Brooklyn
Bedford-Stuyvesant, Brooklyn
Mott Haven / Hunts Point, Bronx
Central Harlem, Manhattan
Morrisania / East Tremont, Bronx
North Crown Heights / Prospect Heights, Brooklyn
East New York / Starrett City, Brooklyn
University Heights / Fordham, Bronx
East Harlem, Manhattan
Highbridge / S. Concourse, Bronx
South Crown Heights, Brooklyn
Soundview / Parkchester, Bronx
Brooklyn Heights / Fort Greene, Brooklyn
Kingsbridge Heights / Mosholu, Bronx
Williamsburg / Greenpoint, Brooklyn
Share in poverty Share ever use prepaid card
1 4 W H E R E A R E T H E U N B A N K E D A N D U N D E R B A N K E D I N N E W Y O R K C I T Y ?
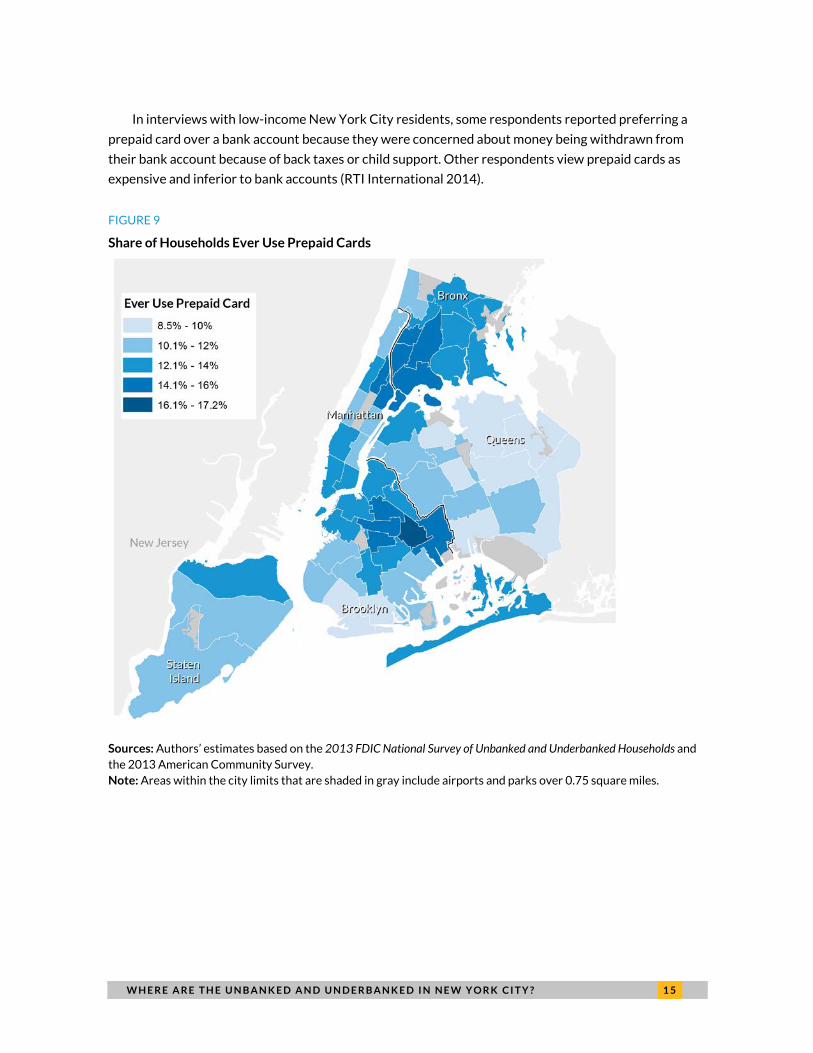
In interviews with low-income New York City residents, some respondents reported preferring a
prepaid card over a bank account because they were concerned about money being withdrawn from
their bank account because of back taxes or child support. Other respondents view prepaid cards as
expensive and inferior to bank accounts (RTI International 2014).
FIGURE 9
Share of Households Ever Use Prepaid Cards
Sources: Authors’ estimates based on the 2013 FDIC National Survey of Unbanked and Underbanked Households and the 2013 American Community Survey. Note: Areas within the city limits that are shaded in gray include airports and parks over 0.75 square miles.
W H E R E A R E T H E U N B A N K E D A N D U N D E R B A N K E D I N N E W Y O R K C I T Y ? 1 5

Summary
Roughly one in nine New York City households is unbanked, one in four is underbanked, and one in
three is either unbanked or underbanked. These findings suggest that the formal financial sector is not
fully meeting the needs of one in three New Yorkers. These unbanked and underbanked households are
more likely to turn to prepaid cards for their financial needs. In total, 13 percent of New Yorkers have
used a prepaid card.
Where do these unbanked, underbanked, and prepaid card using households live in New York City?
The highest shares are in the Bronx followed by Brooklyn, the boroughs with the highest poverty and
unemployment rates. Staten Island has the lowest share of households that are unbanked and
underbanked.
There is substantial variation across the neighborhoods within these boroughs. The brief and an
accompanying interactive map highlight neighborhoods that have the highest and lowest share of
unbanked and underbanked households and, together with the associated appendix table, provide more
granular data on where these households live.
A bank account can be a starting point to building wealth and economic security, but this analysis
shows that a quarter of New York City residents have a bank account and the mainstream financial
sector is not meeting the financial needs for many New Yorkers (i.e., they are using alternative financial
services). The end goal should be better financial services for all New Yorkers, whether through a bank
account or other products that serve their needs well.
1 6 W H E R E A R E T H E U N B A N K E D A N D U N D E R B A N K E D I N N E W Y O R K C I T Y ?
Data and Methods
This brief examines three outcomes:
• Unbanked: No member of the household has a checking or savings account.
• Underbanked: A household member has a bank account but someone in the household has used
one of the following alternative financial services in the past year: check-cashing service,
nonbank money order or money transfer, payday loan, pawnshop, rent-to-own agreement, or
refund anticipation loan.
• Prepaid card use: A household member has ever used a prepaid debit card.
Our estimates of these outcomes come from model-based predictions. We first use household-level
regression models to estimate the relationship between each outcome (banked status, underbanked
status, prepaid card use) and household characteristics (e.g., age, race/ethnicity, educational attainment,
income, etc.) using the FDIC National Survey of Unbanked and Underbanked Households. Next, we use
the regression model results and New York City data from the American Community Survey (ACS) to
predict each outcome (i.e., share unbanked, share underbanked, share use prepaid cards). We use the
2013 FDIC and ACS data for the 2013 local-level estimates and the 2011 FDIC and ACS data for the
2011 estimates. We generated model-based predictions because no single data source includes
information on the unbanked, underbanked, and prepaid card populations in specific enough geographic
information to produce local level results for New York City.
The outcomes are predicted for New York City, the five boroughs, and each Public Use Microdata
Area (PUMA) in the city. A PUMA is an area designated by the US Census Bureau that contains 100,000
or more people. Each PUMA corresponds closely to a New York City–defined community district,
except four PUMAs that represent two community districts each. These community districts, which we
refer to in the text as neighborhoods, are used for city planning and government purposes.
The unbanked and underbanked outcomes were estimated on a sample of New York City
households using a weighted multinomial logit regression model. This model controls for educational
attainment of the household head, whether the household is headed by a single mother, citizenship
status of the household head, race/ethnicity of the household head, household income, whether
household head is over age 65, household employment, and homeownership. The prepaid card outcome
was estimated using a weighted logit regression model on a sample of households living in US
metropolitan areas with populations over 500,000 people. This model controls for educational
attainment of the household head, whether the household is headed by a single mother, citizenship
status of the household head, race/ethnicity of the household head, household income, age of the
household head, and homeownership.
W H E R E A R E T H E U N B A N K E D A N D U N D E R B A N K E D I N N E W Y O R K C I T Y ? 1 7

APPENDIX TABLE A.1
Characteristics of New York City Boroughs and Neighborhoods
Share Unbanked Share Underbanked Share Use Prepaid
Card 2011 2013 2011 2013 2011 2013
New York City 14.3 11.7 22.4 25.1 10.5 12.1
Bronx 28.5 21.8 26.8 30.5 12.0 13.9 Highbridge / S. Concourse (CD 4) 36.8 26.3 26.7 34.0 12.2 14.2 Kingsbridge Heights / Mosholu (CD 7) 32.2 24.3 25.6 30.9 12.3 13.3 Morrisania / East Tremont (CD 3&6) 41.7 28.1 25.4 31.3 13.3 15.8 Mott Haven / Hunts Point (CD 1&2) 43.1 31.3 25.1 30.4 13.1 15.8 Pelham Parkway (CD 11) 20.7 15.3 24.2 28.1 11.3 12.5 Riverdale / Kingsbridge (CD 8) 13.6 11.1 22.3 26.1 10.4 11.6 Soundview / Parkchester (CD 9) 26.4 22.0 29.7 29.1 12.1 13.9 Throgs Neck / Co-op City (CD 10) 11.2 10.3 25.4 26.7 10.4 12.9 University Heights / Fordham (CD 5) 35.4 29.7 30.2 32.9 12.3 14.7 Williamsbridge / Baychester (CD 12) 20.0 15.7 32.2 35.3 12.5 13.0
Brooklyn 15.2 12.7 22.7 26.6 10.9 12.6 Bay Ridge (CD 10) 6.4 6.5 15.7 19.3 9.1 11.1 Bedford-Stuyvesant (CD 3) 26.1 20.8 28.3 28.9 13.6 15.9 Bensonhurst (CD11) 7.2 6.0 19.0 19.9 8.3 10.0 Borough Park (CD 12) 9.5 8.2 15.1 21.0 9.2 11.8 Brooklyn Heights/ Fort Greene (CD 2) 12.7 9.1 18.2 22.8 11.4 13.6 Brownsville / Ocean Hill (CD 16) 34.1 28.3 28.6 32.9 14.6 17.2 Bushwick (CD 4) 28.6 19.6 26.7 29.0 12.1 13.1 Coney Island (CD 13) 9.9 9.7 14.6 23.6 8.2 9.5 East Flatbush (CD 17) 16.5 16.3 35.7 41.4 11.4 12.6 East New York / Starrett City (CD 5) 27.5 21.5 27.1 33.5 12.9 14.9 Flatbush (CD 14) 12.8 12.4 23.6 28.2 10.4 12.1 Flatlands / Canarsie (CD 18) 9.6 8.9 30.2 33.3 10.8 11.4 North Crown Heights / Prospect Heights (CD 8) 21.9 18.7 26.3 29.1 12.6 15.0 Park Slope / Carroll Gardens (CD 6) 6.0 6.9 16.3 18.9 10.3 12.8 Sheepshead Bay / Gravesend (CD 15) 6.0 5.6 14.0 20.3 8.5 9.4 South Crown Heights (CD 9) 19.5 16.2 31.7 37.0 12.1 14.0 Sunset Park (CD 7) 17.1 12.2 24.5 23.0 10.1 11.4 Williamsburg / Greenpoint (CD 1) 12.1 9.9 15.1 21.5 11.0 13.3
Manhattan 10.8 8.8 17.4 21.1 10.2 12.5 Central Harlem (CD 10) 23.0 20.3 27.5 30.0 13.3 15.8 Chelsea / Clinton / Midtown (CD 4 & 5) 7.4 5.1 15.0 19.5 10.1 12.7 East Harlem (CD 11) 28.5 19.0 24.3 26.8 12.4 14.5 Greenwich Village / Financial District (CD 1&2) 2.0 3.3 12.3 17.2 9.5 12.5 Lower East Side / Chinatown (CD 3) 15.1 10.1 17.6 19.1 10.4 12.5 Morningside Heights / Hamilton Heights (CD 9) 18.7 15.3 24.8 26.2 11.5 12.9 Stuyvesant Town / Turtle Bay (CD 6) 3.8 3.1 13.0 16.2 9.5 11.5 Upper East Side (CD 8) 2.2 3.7 11.9 17.5 8.9 11.5 Upper West Side (CD 7) 6.2 5.2 14.2 18.7 9.3 11.6 Washington Heights / Inwood (CD 12) 21.6 17.8 26.2 30.1 10.3 11.7
Continued on next page
1 8 W H E R E A R E T H E U N B A N K E D A N D U N D E R B A N K E D I N N E W Y O R K C I T Y ?

APPENDIX TABLE A.1 (CONTINUED)
Share Unbanked Share Underbanked Share Use Prepaid
Card 2011 2013 2011 2013 2011 2013
Queens 9.3 8.0 25.2 25.1 9.5 10.3 Astoria (CD 1) 12.2 10.0 19.1 23.3 10.0 12.7 Bayside / Little Neck (CD 11) 2.1 2.6 19.2 16.5 8.1 8.5 Bellerose / Rosedale (CD 13) 4.8 6.2 32.6 30.3 9.9 9.9 Elmhurst / Corona (CD 4) 14.0 11.7 30.8 28.2 9.3 10.3 Flushing / Whitestone (CD 7) 5.5 4.9 21.8 19.2 8.1 9.0 Forest Hills / Rego Park (CD 6) 3.6 4.0 17.5 22.2 8.4 8.8 Hillcrest / Fresh Meadows (CD 8) 7.7 5.0 23.0 23.0 9.2 9.1 Howard Beach / S. Ozone Park (CD 10) 6.3 5.6 27.0 23.9 9.2 8.9 Jackson Heights (CD 3) 14.5 13.7 32.4 32.4 9.0 9.7 Jamaica (CD 12) 13.3 11.2 36.7 34.3 11.4 11.7 Kew Gardens / Woodhaven (CD 9) 11.0 6.9 27.3 24.9 10.0 10.0 Middle Village / Ridgewood (CD 5) 11.8 8.7 18.5 23.0 9.7 11.0 Sunnyside / Woodside (CD 2) 8.6 6.6 23.3 23.1 9.1 10.6 Rockaways (CD14) 15.8 14.3 23.5 26.5 10.9 12.7
Staten Island 7.0 7.2 17.4 18.8 9.6 11.3 Mid-Island (CD 2) 4.9 6.5 14.8 17.3 8.9 10.9 North Shore (CD 1) 13.3 11.1 23.6 22.6 10.8 12.5 South Shore (CD 3) 2.8 3.6 13.6 16.0 9.0 10.3
Sources: Unbanked, underbanked, and prepaid rates from authors' calculations based on 2011 and 2013 FDIC Survey of Unbanked and Underbanked Households and 2011 and 2013 American Community Survey data. Note: CD refers to community district numbers, which are in parentheses.
W H E R E A R E T H E U N B A N K E D A N D U N D E R B A N K E D I N N E W Y O R K C I T Y ? 1 9

APPENDIX TABLE A.2
Supplemental Characteristics of New York City Boroughs and Neighborhoods
Median Income Share of Population
Unemployed Share of Families in
Poverty Share of Population
Foreign Born 2011 2013 2011 2013 2011 2013 2011 2013
New York City 49,461 58,012 9.1 8.7 18.0 17.5 37.2 37.0
Bronx 32,058 33,009 12.4 11.8 28.1 27.6 33.8 33.7 Highbridge / S. Concourse 22,849 26,387 19.2 14.9 39.8 33.7 38.5 40.7 Kingsbridge Heights /Mosholu 30,646 29,069 16.7 17.8 32.8 34.0 40.1 42.6 Morrisania / East Tremont 22,370 24,259 21.0 17.8 40.7 38.6 31.3 32.3 Mott Haven / Hunts Point 21,146 23,083 20.0 12.3 38.8 39.5 27.7 26.5 Pelham Parkway 40,745 43,075 14.7 13.2 18.9 17.2 33.9 34.5 Riverdale / Kingsbridge 55,119 60,614 12.3 11.9 15.1 11.7 31.4 29.5 Soundview / Parkchester 35,833 32,363 11.5 17.0 24.8 27.5 35.0 28.8 Throgs Neck / Co-op City 53,436 56,059 12.2 8.9 10.2 7.9 18.5 21.9 University Heights / Fordham 25,951 24,261 20.2 15.7 37.1 39.2 42.0 44.0 Williamsbridge / Baychester 43,236 45,633 16.0 14.5 17.3 19.4 39.5 38.9
Brooklyn 42,752 47,520 9.8 9.4 20.4 19.5 37.4 37.2 Bay Ridge 56,541 58,621 9.8 9.5 11.6 13.2 37.4 39.4 Bedford-Stuyvesant 32,334 37,195 18.5 15.5 28.2 32.0 19.0 19.8 Bensonhurst 44,464 47,272 10.3 9.4 15.3 14.2 54.2 55.2 Borough Park 34,374 40,571 7.7 7.2 27.8 28.4 30.8 30.0 Brooklyn Heights/Fort Greene 62,045 76,040 11.8 9.0 13.5 13.9 19.6 19.3 Brownsville / Ocean Hill 25,766 27,933 18.8 15.7 37.0 32.7 28.0 31.3 Bushwick 34,142 43,354 14.7 15.2 29.6 23.0 35.1 37.5 Coney Island 28,106 30,850 12.8 12.7 18.3 18.9 55.5 54.1 East Flatbush 44,629 42,666 13.4 11.3 13.9 15.3 51.7 52.2 East New York / Starrett City 29,857 36,943 13.1 12.7 32.1 25.6 33.9 35.3 Flatbush 40,470 42,312 11.2 10.1 18.2 20.6 44.9 42.9 Flatlands / Canarsie 59,616 66,283 12.3 9.4 11.1 9.3 42.3 38.2 North Crown Heights /Prospect Heights 40,511 39,034 14.4 8.9 29.0 25.9 32.5 29.6 Park Slope / Carroll Gardens 87,293 101,789 8.5 4.7 7.7 8.8 18.5 17.0 Sheepshead Bay / Gravesend 47,610 51,064 9.0 8.3 12.0 12.1 46.0 46.1 South Crown Heights 37,446 46,294 17.4 14.2 18.0 16.3 45.4 43.0 Sunset Park 42,544 45,075 8.5 10.6 21.2 27.7 44.1 49.0 Williamsburg / Greenpoint 47,003 52,419 8.7 6.5 30.2 20.7 24.3 25.0
Manhattan 66,299 72,190 7.5 7.2 14.9 14.8 28.8 28.4 Central Harlem 35,350 36,917 15.4 10.7 23.4 26.2 24.6 23.1 Chelsea / Clinton / Midtown 83,030 100,635 8.2 6.4 7.0 7.5 25.9 26.4 East Harlem 30,900 26,941 13.5 13.4 23.1 29.9 27.2 23.8 Greenwich Village / Financial District 119,866 125,311 4.8 4.2 4.9 4.2 22.1 24.4 Lower East Side / Chinatown 39,162 40,133 6.7 10.8 26.7 29.4 37.5 33.7 Morningside Heights / Hamilton Heights 39,486 45,600 10.6 7.8 24.1 17.3 35.1 32.5 Stuyvesant Town / Turtle Bay 101,548 108,077 6.9 3.1 5.2 4.7* 21.1 20.4 Upper East Side 105,217 107,690 5.8 3.5 3.3 3.3 21.1 21.8 Upper West Side 92,160 99,273 6.4 6.6 7.7 6.2 21.7 24.9 Washington Heights / Inwood 37,581 37,462 16.1 13.6 24.2 25.3 47.5 47.3
Continued on next page
2 0 W H E R E A R E T H E U N B A N K E D A N D U N D E R B A N K E D I N N E W Y O R K C I T Y ?
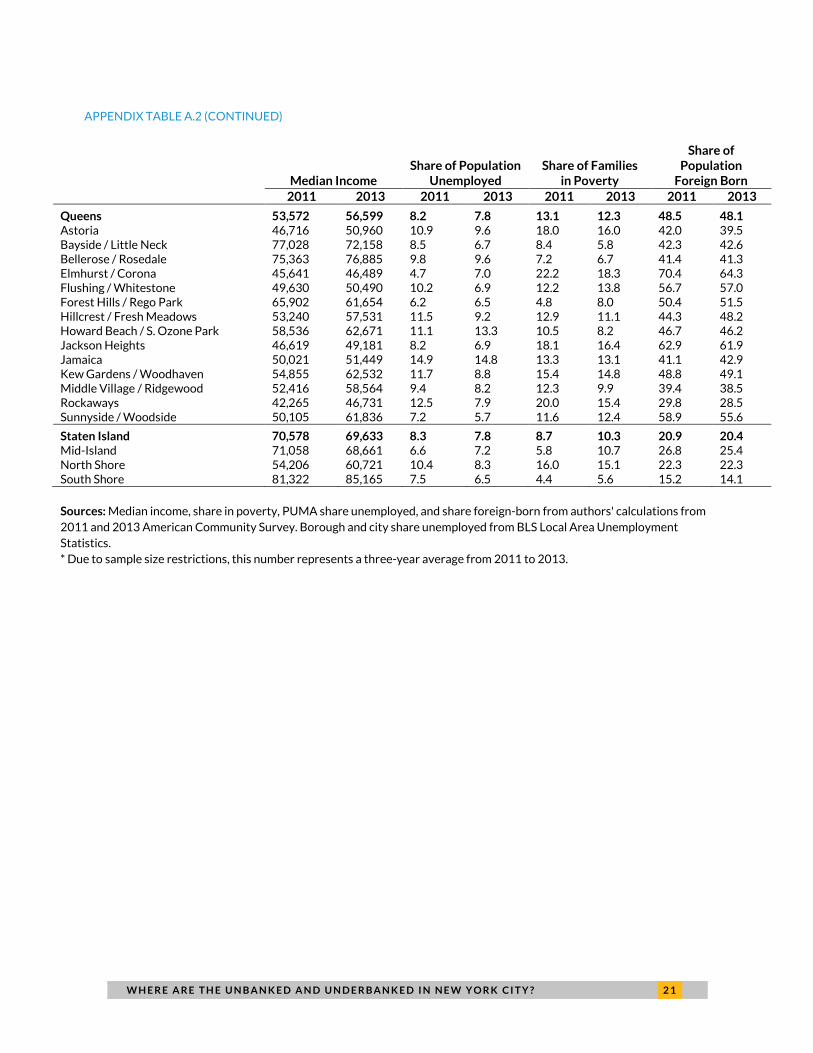
APPENDIX TABLE A.2 (CONTINUED)
Median Income
Share of Population Unemployed
Share of Families in Poverty
Share of Population
Foreign Born 2011 2013 2011 2013 2011 2013 2011 2013
Queens 53,572 56,599 8.2 7.8 13.1 12.3 48.5 48.1 Astoria 46,716 50,960 10.9 9.6 18.0 16.0 42.0 39.5 Bayside / Little Neck 77,028 72,158 8.5 6.7 8.4 5.8 42.3 42.6 Bellerose / Rosedale 75,363 76,885 9.8 9.6 7.2 6.7 41.4 41.3 Elmhurst / Corona 45,641 46,489 4.7 7.0 22.2 18.3 70.4 64.3 Flushing / Whitestone 49,630 50,490 10.2 6.9 12.2 13.8 56.7 57.0 Forest Hills / Rego Park 65,902 61,654 6.2 6.5 4.8 8.0 50.4 51.5 Hillcrest / Fresh Meadows 53,240 57,531 11.5 9.2 12.9 11.1 44.3 48.2 Howard Beach / S. Ozone Park 58,536 62,671 11.1 13.3 10.5 8.2 46.7 46.2 Jackson Heights 46,619 49,181 8.2 6.9 18.1 16.4 62.9 61.9 Jamaica 50,021 51,449 14.9 14.8 13.3 13.1 41.1 42.9 Kew Gardens / Woodhaven 54,855 62,532 11.7 8.8 15.4 14.8 48.8 49.1 Middle Village / Ridgewood 52,416 58,564 9.4 8.2 12.3 9.9 39.4 38.5 Rockaways 42,265 46,731 12.5 7.9 20.0 15.4 29.8 28.5 Sunnyside / Woodside 50,105 61,836 7.2 5.7 11.6 12.4 58.9 55.6
Staten Island 70,578 69,633 8.3 7.8 8.7 10.3 20.9 20.4 Mid-Island 71,058 68,661 6.6 7.2 5.8 10.7 26.8 25.4 North Shore 54,206 60,721 10.4 8.3 16.0 15.1 22.3 22.3 South Shore 81,322 85,165 7.5 6.5 4.4 5.6 15.2 14.1
Sources: Median income, share in poverty, PUMA share unemployed, and share foreign-born from authors' calculations from 2011 and 2013 American Community Survey. Borough and city share unemployed from BLS Local Area Unemployment Statistics. * Due to sample size restrictions, this number represents a three-year average from 2011 to 2013.
W H E R E A R E T H E U N B A N K E D A N D U N D E R B A N K E D I N N E W Y O R K C I T Y ? 2 1

Notes 1. Other top reasons include a “lack of trust in or dislike of dealing with banks” (34.2 percent), privacy concerns
(26.4 percent), and high or unpredictable account fees (30.8 percent; FDIC 2014, p. 25).
2. The Consumer Financial Protection Bureau is working on a definition of financial well-being, which includes control over day-to-day finances, capacity to absorb shocks, being on track to meet financial goals, and having the financial freedom to make choices (CFPB 2015, p. 5).
3. This survey is a supplement to the Current Population Survey (CPS).
4. An analysis of financial insecurity in American cities by CFED (2014) finds a higher share of unbanked New Yorkers: 19.1 percent. Our underlying model and predictions are based on more specific household-level data, whereas CFED's predictions are based on local-area data.
5. New York City had an estimated 3,085,000 households in 2013, according to 2013 American Community Survey one-year estimates (http://factfinder2.census.gov/); 3,085,000 x 0.117 roughly equals 360,000.
6. According to 2013 American Community Survey one-year estimates, available at http://factfinder2.census.gov/ (accessed May 2015).
7. Between 2009 and 2013, unbanked households were most prevalent in 2011. The number of unbanked American households increased from 9.1 million (7.6 percent) in 2009 to 9.9 million (8.2 percent) in 2011, before falling to 9.6 million (7.7 percent) in 2013 (FDIC 2014). The FDIC attributes the decrease in unbanked households between 2011 and 2013 to slightly higher employment and income levels, as well as the fact that households in 2013 were slightly older and better educated than in 2009 (FDIC 2014).
8. Using 2005–09 data, an earlier study commissioned by the New York City Department of Consumer Affairs’ Office of Financial Empowerment, found that 13.4 percent of New York City households were unbanked (Social Compact 2009; New York City Department of Consumer Affairs 2012). While not directly comparable to our study, the comparison provides an indication that the unbanked rate followed national trends—went up in the aftermath of the Great Recession and then declined. The national unbanked rate increased from 7.6 percent in 2009 to 8.2 percent in 2011 and then fell to 7.7 percent in 2013.
9. The neighborhood-level correlation between the two percentages is 0.88, close to the maximum value of 1.
10. New York City had an estimated 3,085,000 households, according to 2013 American Community Survey one-year estimates (http://factfinder2.census.gov/). We estimate that 25.1 percent, or roughly 780,000, are unbanked.
11. The use of alternative financial sector services crept up to the middle class between 2009 and 2011 and increased further between 2011 and 2013 (Mills and Monson 2013, Mills 2015).
12. The neighborhood-level correlation between the percent of households unbanked and the unemployment rate is 0.70.
13. Data on alternative financial services providers come from InfoUSA, a company that provides verified directory, website, business filing, and other source-driven data on businesses.
14. Lack of access to providers is not a key reason households are unbanked. Only 6.8 percent of unbanked households listed “inconvenient hours or locations “as a reason for not having a bank account and only 2.6 percent listed it as the main reason (FDIC 2014, p. 25). 57.5 percent of unbanked households listed not having enough money as a reason.
15. Information on prepaid card use in the past 12 months is not available in the 2011 FDIC unbanked and underbanked survey.
16. The neighborhood-level correlation between the percent of households ever used prepaid card and the percent of households unbanked is 0.80. The correlation with the poverty rate is 0.69.
2 2 W H E R E A R E T H E U N B A N K E D A N D U N D E R B A N K E D I N N E W Y O R K C I T Y ?

References Barr, Michael S. and Rebecca M. Blank. “Savings, Assets, Credit, and Banking Among Low-Income Households:
Introduction and Overview” in Insufficient Funds ed. Michael S. Barr and Rebecca M. Blank. P. 1-22. New York City: Russell Sage Foundation. 2009.
CFED (Corporation for Enterprise Development). 2014. “Financial Insecurity in American Cities.” Assets and Opportunity Local Data Center Data Snapshot. Washington, DC: CFED.
Collins, J. Michael. “Paying for the Unexpected: Making the Case for a New Generation of Strategies to Boost Emergency Savings, Affording Contingencies, and Liquid Resources for Low-Income Families” in A Fragile Balance ed. J. Michael Collins. P. 1-16. New York City: Palgrave Macmillan. 2015.
Consumer Financial Protection Bureau. 2015. “Financial Well-Being: the Goal of Financial Education.” Washington, DC: Consumer Financial Protection Bureau.
FDIC (Federal Deposit Insurance Corporation). 2014. 2013 FDIC National Survey of Unbanked and Underbanked Households. Washington, DC: FDIC.
———. 2012. 2011 FDIC National Survey of Unbanked and Underbanked Households. Washington, DC: FDIC.
Federal Reserve System. 2013. Recent and Long-Term Payment Trends in the United States: 2003-2012. Federal Reserve System.
Gutman, Aliza, Thea Garon, Jeanne Hogarth, and Rachel Schneider. 2015. “Understanding and Improving Consumer Financial Heath in America.” Chicago, IL: Center for Financial Services Innovation.
Mills, Gregory B. 2015. “As the Recovery Progresses, Use of Nonbank Credit Rises”. Income and Wealth Fact Sheet. Washington, DC: Urban Institute.
Mills, Gregory B., and William Monson. 2013. “The Rising Use of Nonbank Credit among U.S. Households: 2009-2011.” Unemployment and Recovery Project Brief 14. Washington, DC: Urban Institute.
New York City Department of Consumer Affairs. 2013. Immigrant Financial Services Study. New York City: Department of Consumer Affairs, Office of Financial Empowerment.
———. 2012. “Findings from the Citywide Financial Services Study.” New York: Department of Consumer Affairs, Office of Financial Empowerment.
Rhine, Sherrie L.W., William H. Greene, and Maude Toussaint-Comeau. 2006. “The Importance of Check-Cashing Businesses to the Unbanked: Racial/Ethnic Differences.” Review of Economics and Statistics 88(1):146-157.
RTI International. 2014. Qualitative Study of Unbanked and Under-Banked Individuals. Research Triangle Park, NC: RTI International.
Social Compact. 2009. “New York Financial Environment.” Presentation prepared for New York City Department of Consumer Affairs, November.
Wilshusen, Stephanie M., Robert M. Hunt, James van Opstal, and Rachel Schneider. 2012. “Consumers’ Use of Prepaid Cards: A Transaction-Based Analysis.” Payment Cards Center Discussion Paper. Philadelphia, PA: Federal Reserve Bank of Philadelphia.
W H E R E A R E T H E U N B A N K E D A N D U N D E R B A N K E D I N N E W Y O R K C I T Y ? 2 3
About the Authors
Caroline Ratcliffe is a senior fellow and economist in the Center on Labor, Human
Services, and Population at the Urban Institute. She is an expert in asset building and
poverty and has published and spoken extensively on the role of emergency savings,
wealth disparities, and childhood poverty. Ratcliffe recently published a chapter, “Is
Poverty Incompatible with Asset Accumulation?” in the Oxford Handbook of the
Economics of Poverty. Her research has also been cited in hundreds of news articles
including the New York Times, Washington Post, Wall Street Journal, and the Economist.
Signe-Mary McKernan is a senior fellow and economist at the Urban Institute, where
she codirects the Opportunity and Ownership initiative. Her research focuses on
access to assets and credit and the impact of safety net programs. She and Michael
Sherraden edited the book Asset Building and Low-Income Families. McKernan’s research
has been published in refereed journals including the American Economic Review Papers
and Proceedings, Demography, and Review of Economics and Statistics.
Emma Kalish is a research assistant in the Center on Labor, Human Services, and
Population. Since joining Urban in 2013, she has contributed to research focused
primarily on asset building, consumer debt, and mobility. In addition to these topics,
Kalish is interested in a broad set of issues affecting family hardship.
Steven Martin is a senior research associate in the Center on Labor, Human Services,
and Population. A demographer who studies a range of characteristics for
disadvantaged and general populations, Martin’s work includes evaluating migration
for local population projections, developing stylized descriptions of populations based
on model coefficients, and analyzing survey data quality. His work has been published
in numerous academic journals and various media sources.
2 4 W H E R E A R E T H E U N B A N K E D A N D U N D E R B A N K E D I N N E W Y O R K C I T Y ?
ABOUT THE URBAN INSTITUTE The nonprofit Urban Institute is dedicated to elevating the debate on social and economic policy. For nearly five decades, Urban scholars have conducted research and offered evidence-based solutions that improve lives and strengthen communities across a rapidly urbanizing world. Their objective research helps expand opportunities for all, reduce hardship among the most vulnerable, and strengthen the effectiveness of the public sector.
Copyright © 2015. New York City Department of Consumer Affairs. Permission is granted for reproduction of this file, with attribution to the City of New York.
2100 M Street NW Washington, DC 20037
www.urban.org
Acknowledgments
The New York City Department of Consumer Affairs’ Office of Financial Empowerment commissioned
this brief and an accompanying interactive map to examine New Yorkers’ banking status; specifically,
which New Yorkers are not accessing mainstream financial services, and where they live. Access to safe
and affordable banking accounts is a goal of the department’s work. We are grateful to them and to all
our funders, who make it possible for Urban to advance its mission. Funders do not, however, determine
our research findings or the insights and recommendations of our experts. The views expressed are
those of the authors and should not be attributed to the Urban Institute, its trustees, or its funders.
W H E R E A R E T H E U N B A N K E D A N D U N D E R B A N K E D I N N E W Y O R K C I T Y ? 2 5