where we came from and where we are going standards 1 function of standards f(s t ) = c 2 dr....
Post on 19-Dec-2015
214 views
TRANSCRIPT
WHERE WE CAME FROM AND WHERE WE ARE GOING
Standards1
Function of Standardsf(st) = c2
DR. BRENNON SAPPOCTOBER 2010 KCTM
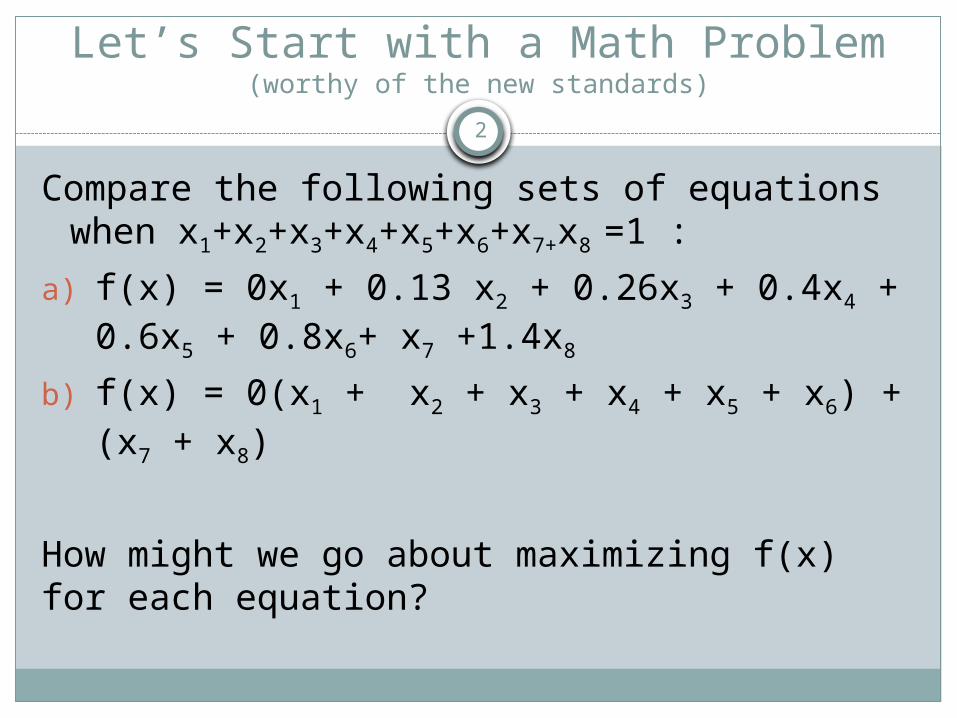
Let’s Start with a Math Problem(worthy of the new standards)
Compare the following sets of equations when x1+x2+x3+x4+x5+x6+x7+x8 =1 :
a) f(x) = 0x1 + 0.13 x2 + 0.26x3 + 0.4x4 + 0.6x5 + 0.8x6+ x7 +1.4x8
b) f(x) = 0(x1 + x2 + x3 + x4 + x5 + x6) + (x7 + x8)
How might we go about maximizing f(x) for each equation?
2
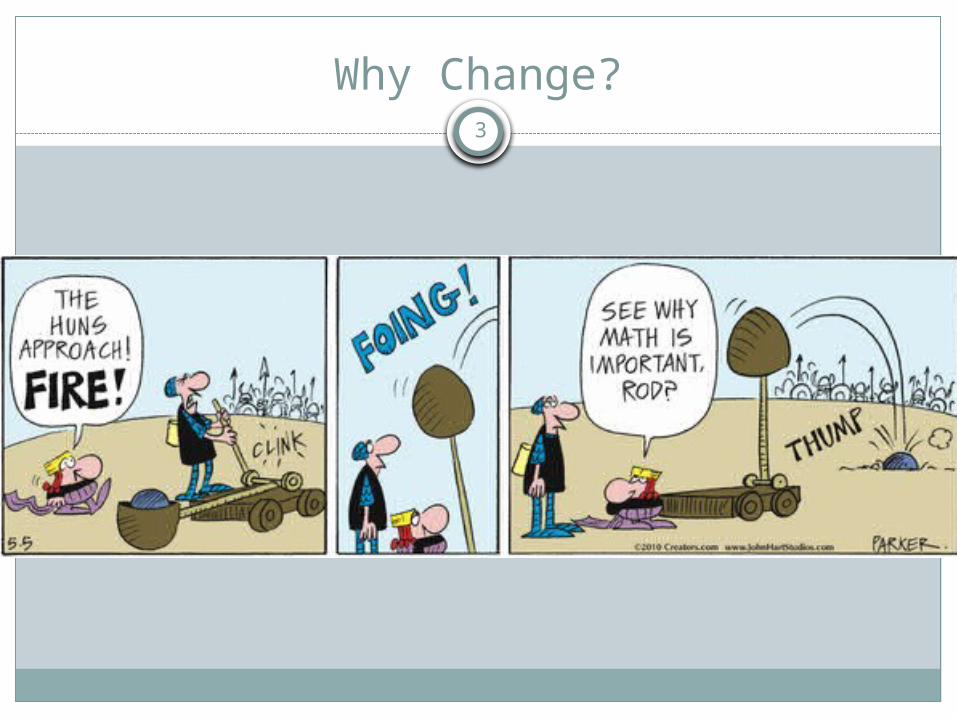
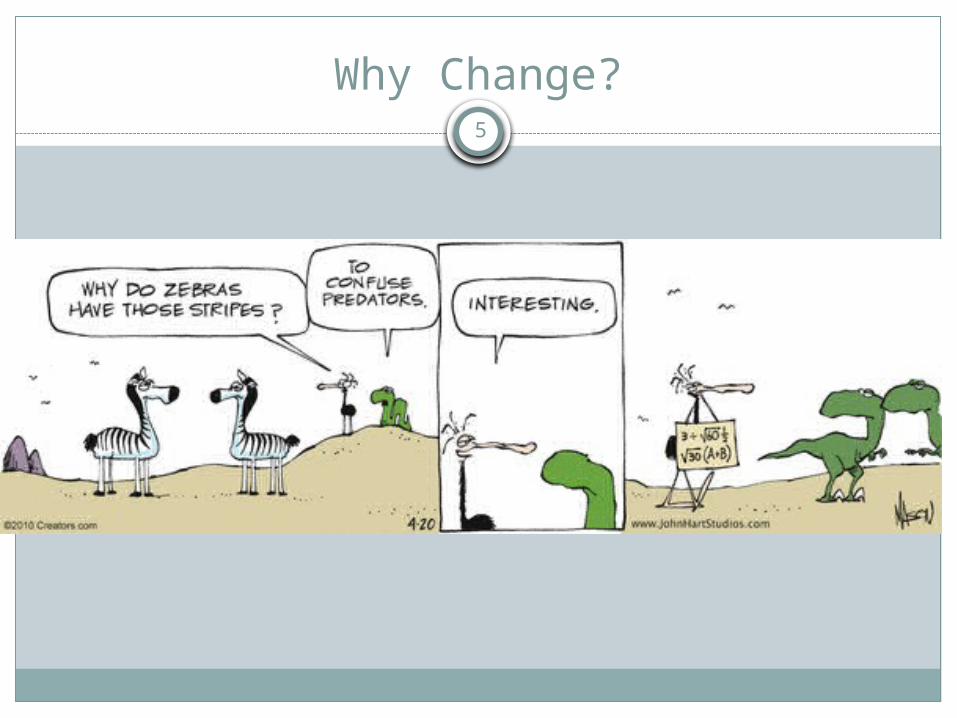
Why Change?3
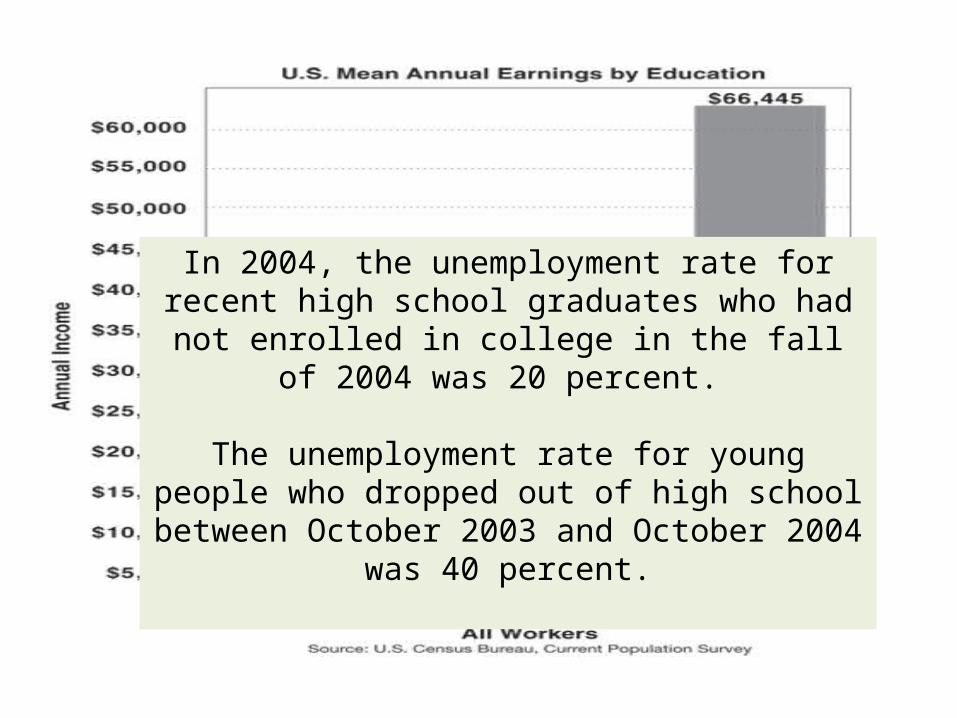
In 2004, the unemployment rate for recent high school graduates who had not enrolled in college
in the fall of 2004 was 20 percent.
The unemployment rate for young people who dropped out of high school between October 2003
and October 2004 was 40 percent.
Why Change?5
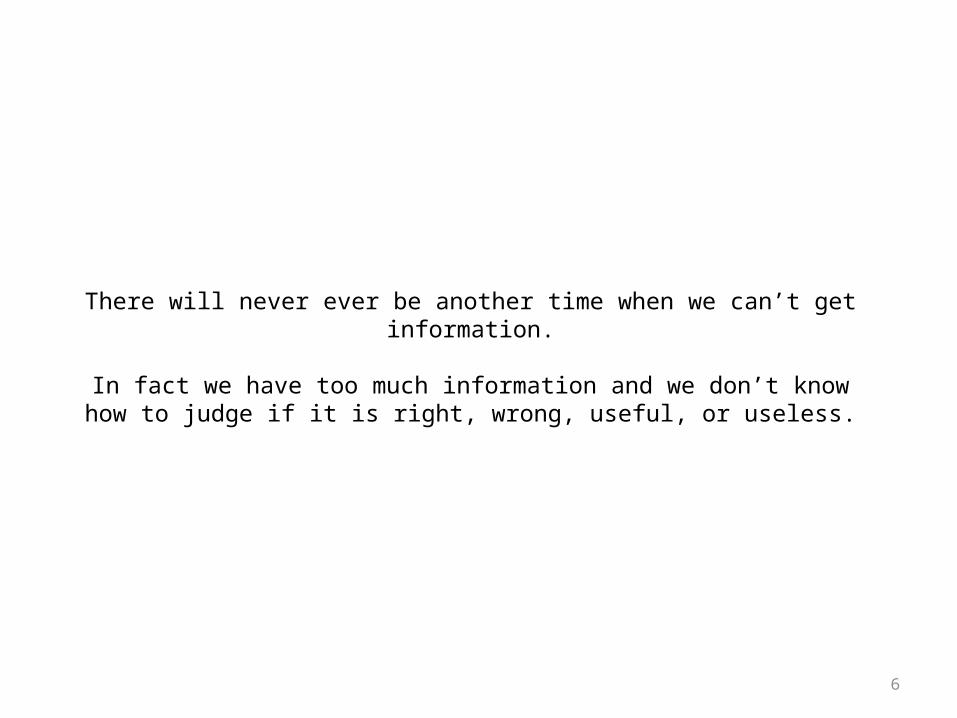
There will never ever be another time when we can’t get information.
In fact we have too much information and we don’t know how to judge if it is right, wrong, useful, or useless.
6
7
Greatest Accomplishment In Mathematics?
Counting
Discovery of Zero
8

9
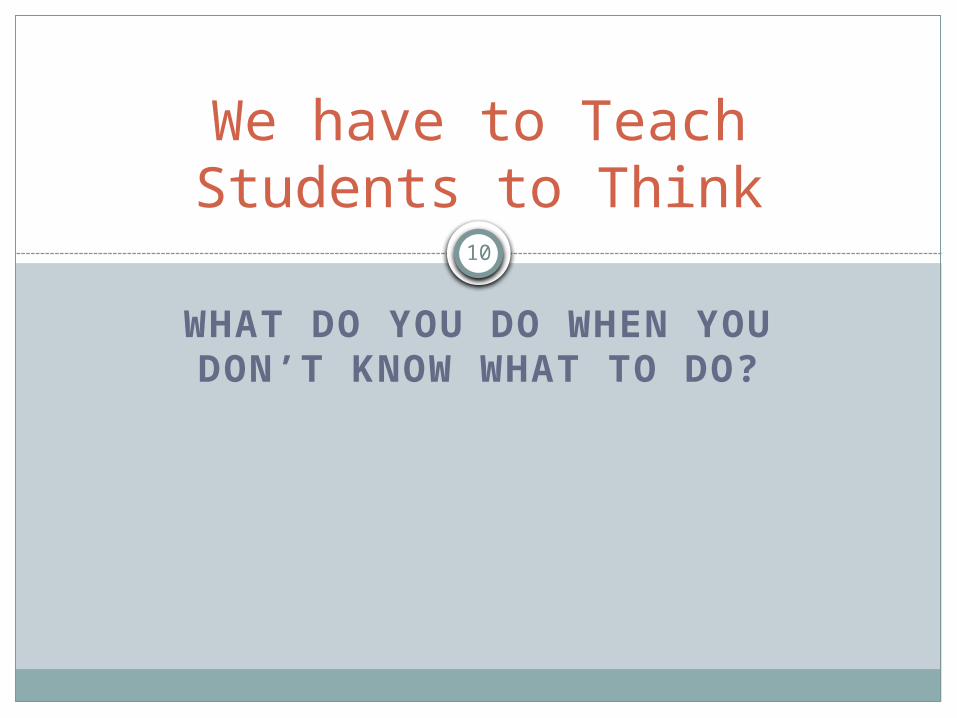
WHAT DO YOU DO WHEN YOU DON’T KNOW WHAT
TO DO?
We have to Teach Students to Think
10
11
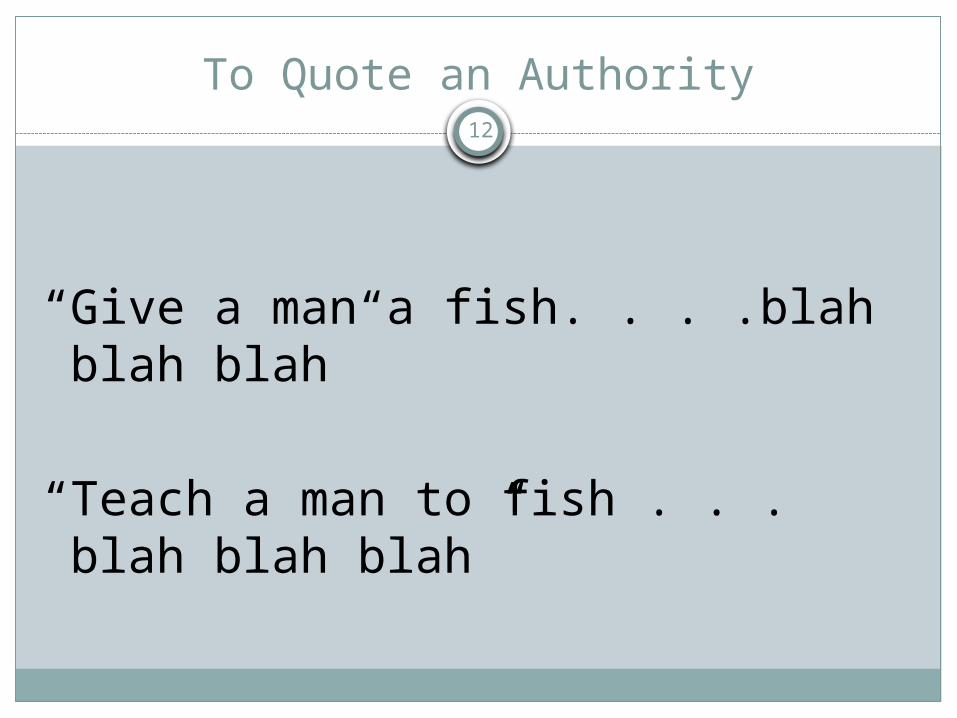
To Quote an Authority
“Give a man a fish. . . .blah blah blah”
“Teach a man to fish . . . blah blah blah”
12

According to the Professionals
“We are living in a world without borders. To meet the realities of the 21st century global economy and maintain America’s competitive edge into the future, we need students who are prepared to compete not only with their American peers, but with students from all across the globe for the jobs of tomorrow.”
CCSSO
13
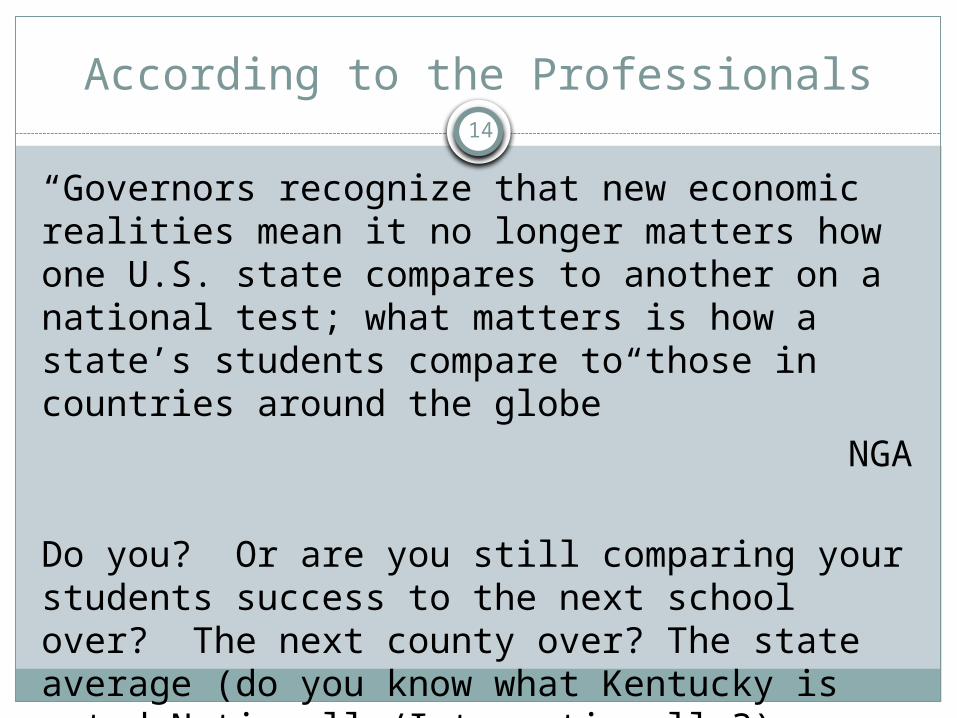
According to the Professionals
“Governors recognize that new economic realities mean it no longer matters how one U.S. state compares to another on a national test; what matters is how a state’s students compare to those in countries around the globe”
NGA
Do you? Or are you still comparing your students success to the next school over? The next county over? The state average (do you know what Kentucky is rated Nationally/Internationally?)
14
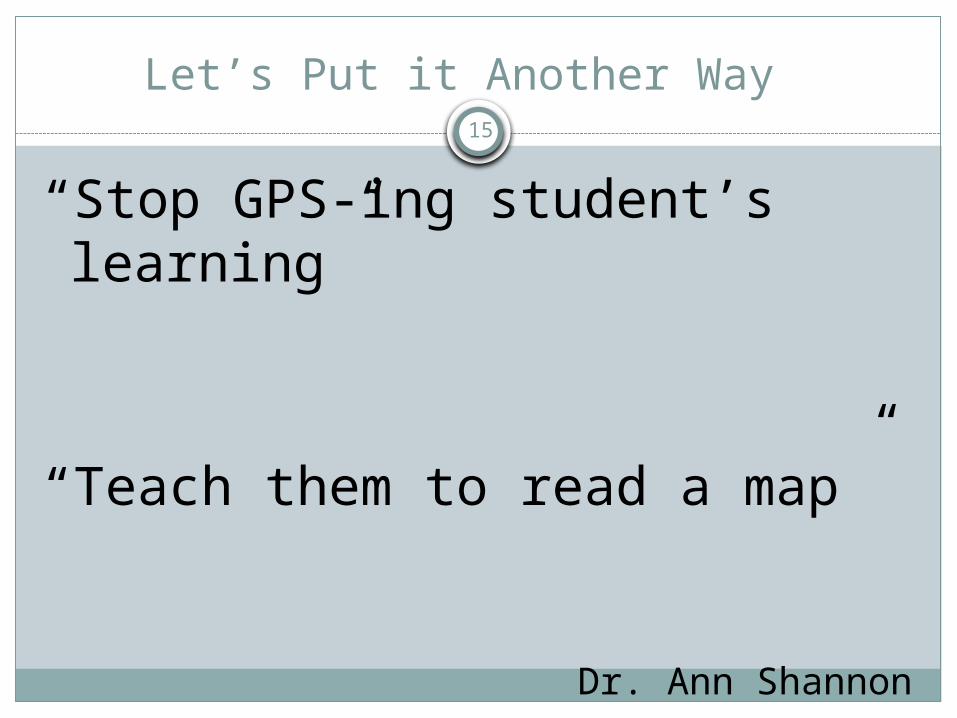
Let’s Put it Another Way
“Stop GPS-ing student’s learning”
“Teach them to read a map”
Dr. Ann ShannonGates Consultant
15
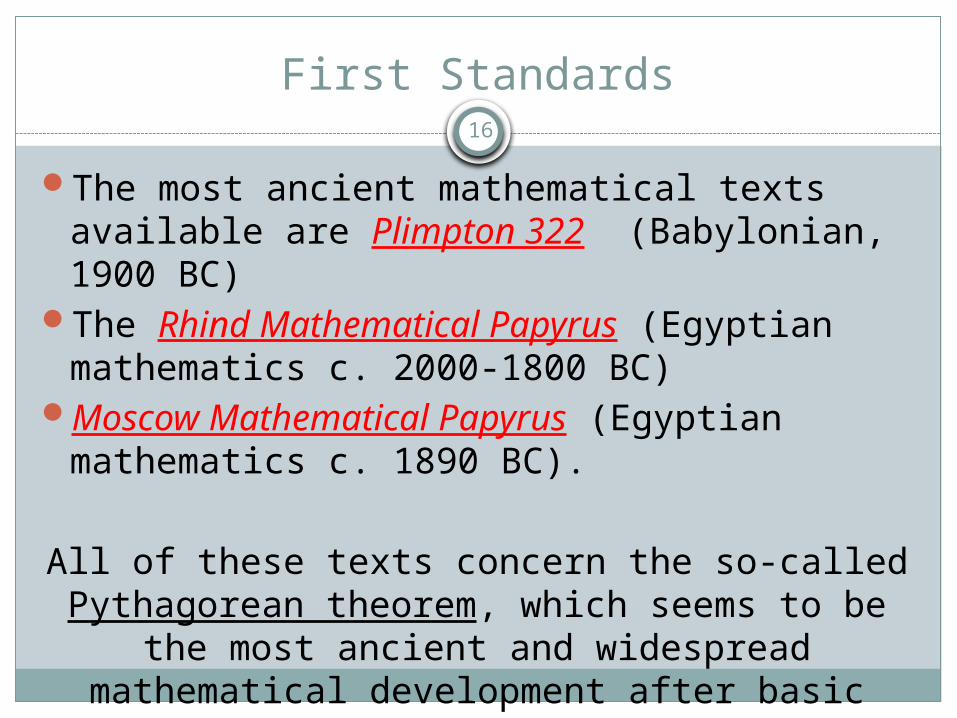
First Standards
The most ancient mathematical texts available are Plimpton 322 (Babylonian, 1900 BC)
The Rhind Mathematical Papyrus (Egyptian mathematics c. 2000-1800 BC)
Moscow Mathematical Papyrus (Egyptian mathematics c. 1890 BC).
All of these texts concern the so-called Pythagorean theorem, which seems to be the most ancient and widespread mathematical
development after basic arithmetic and geometry.
16
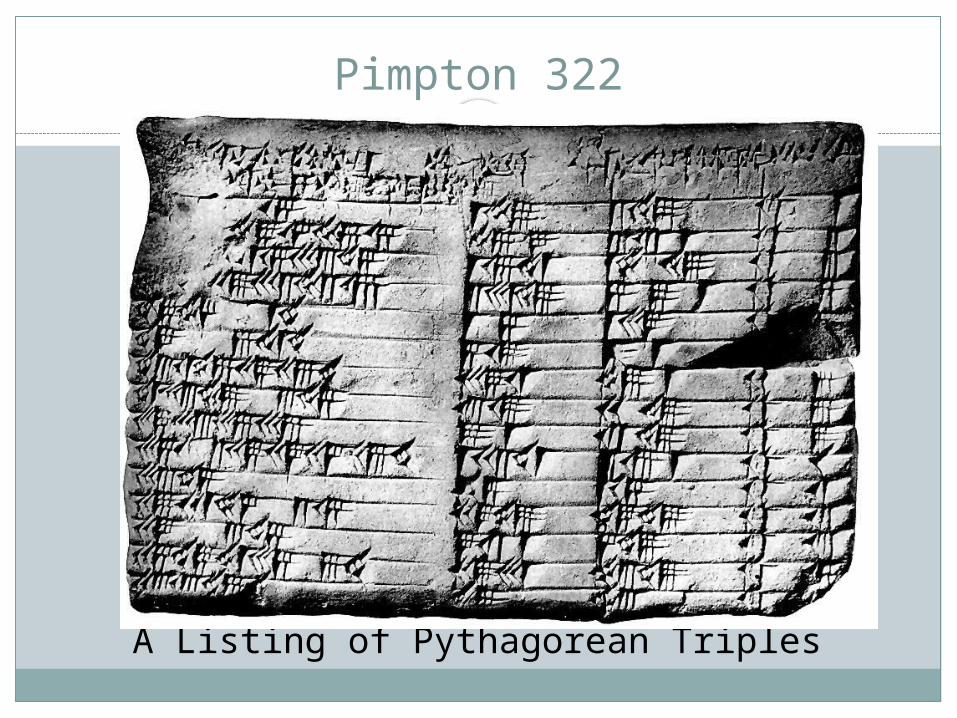
Pimpton 322
A Listing of Pythagorean Triples
17
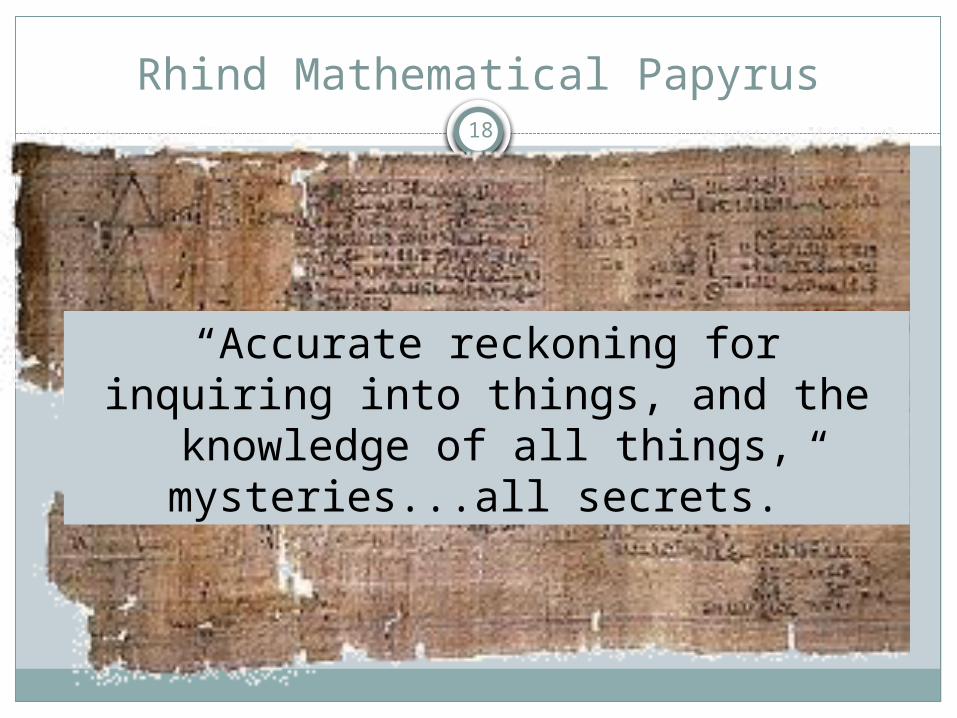
Rhind Mathematical Papyrus18
“Accurate reckoning for inquiring into things, and the knowledge of all things,
mysteries...all secrets.”
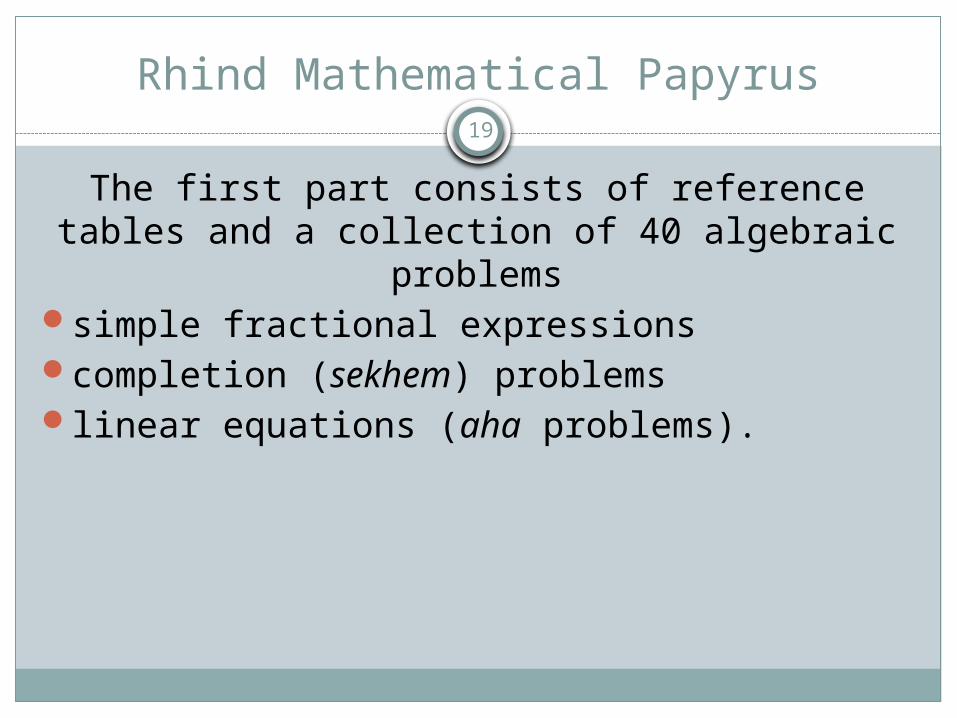
Rhind Mathematical Papyrus19
The first part consists of reference tables and a collection of 40 algebraic problems
simple fractional expressionscompletion (sekhem) problems linear equations (aha problems).
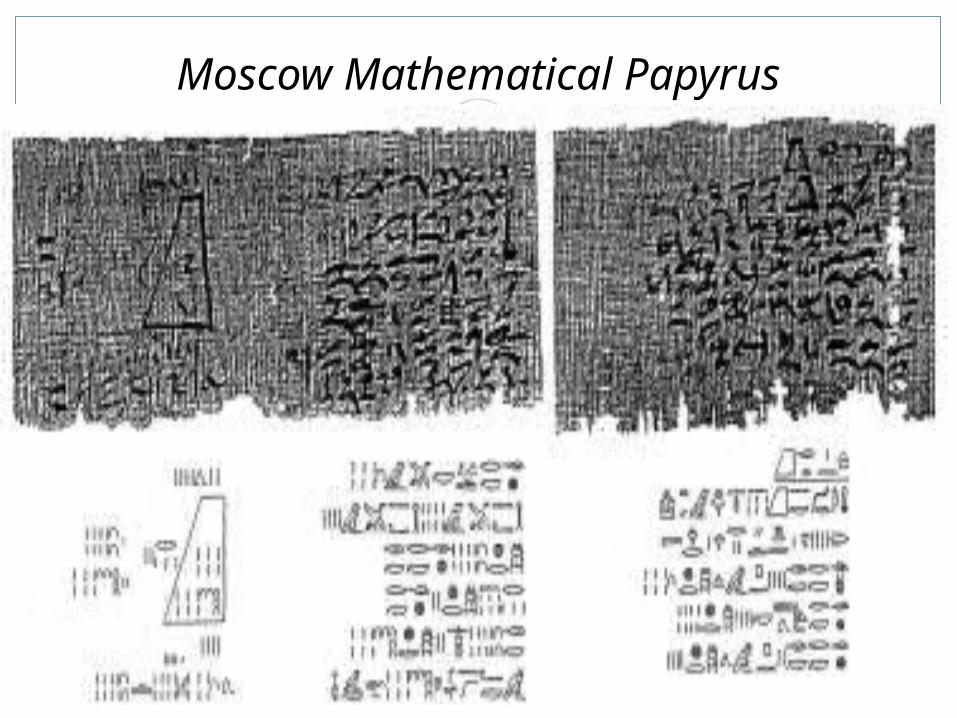
Moscow Mathematical Papyrus20
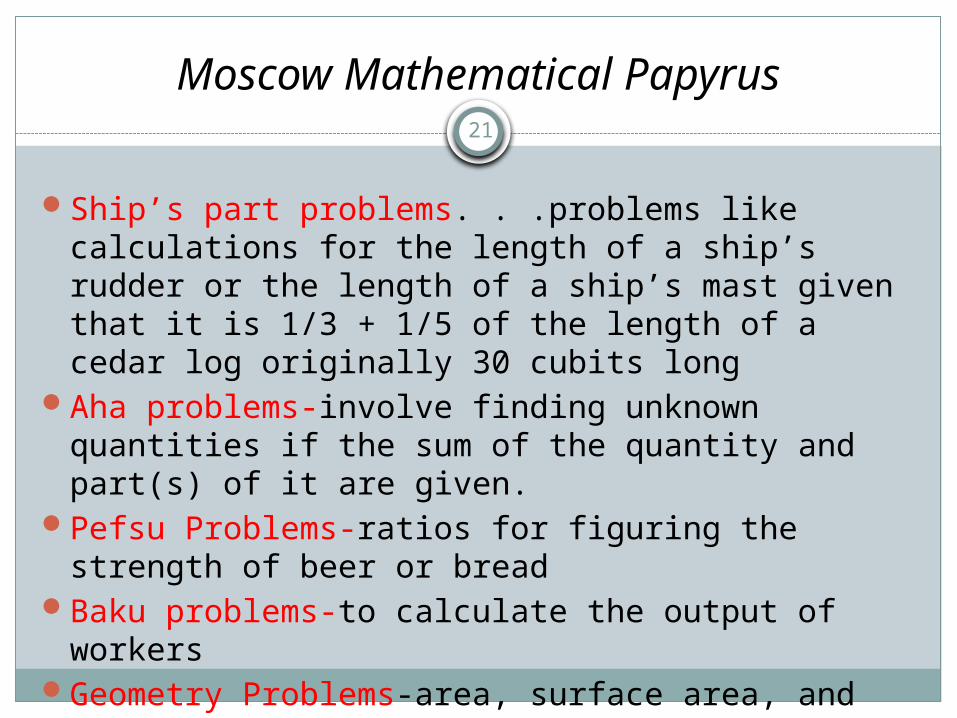
Moscow Mathematical Papyrus
Ship’s part problems. . .problems like calculations for the length of a ship’s rudder or the length of a ship’s mast given that it is 1/3 + 1/5 of the length of a cedar log originally 30 cubits long
Aha problems-involve finding unknown quantities if the sum of the quantity and part(s) of it are given.
Pefsu Problems-ratios for figuring the strength of beer or bread
Baku problems-to calculate the output of workersGeometry Problems-area, surface area, and volume
21
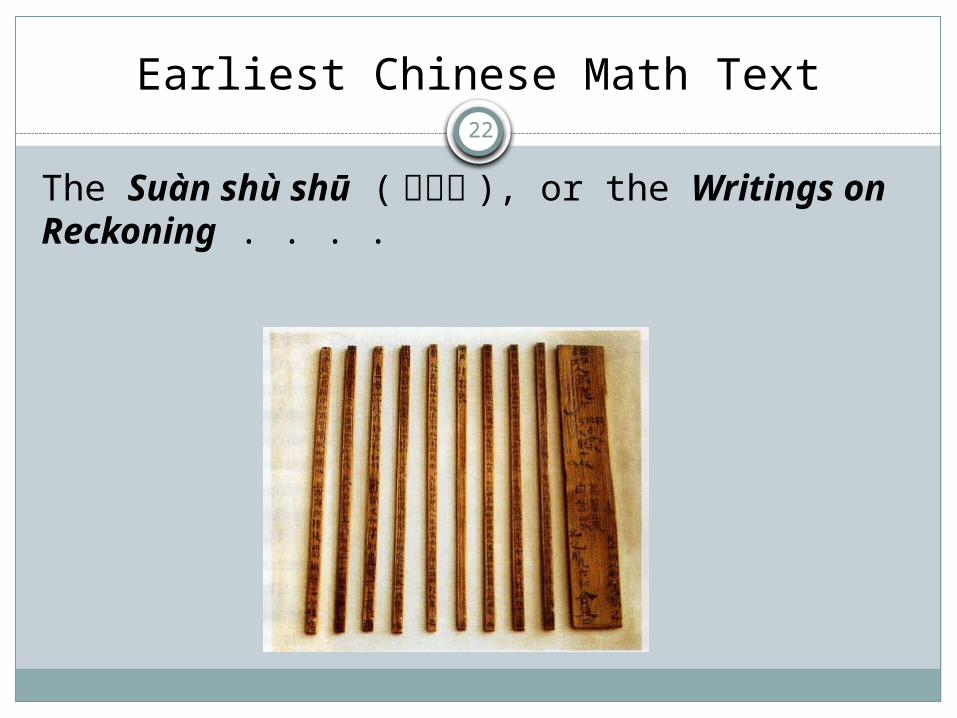
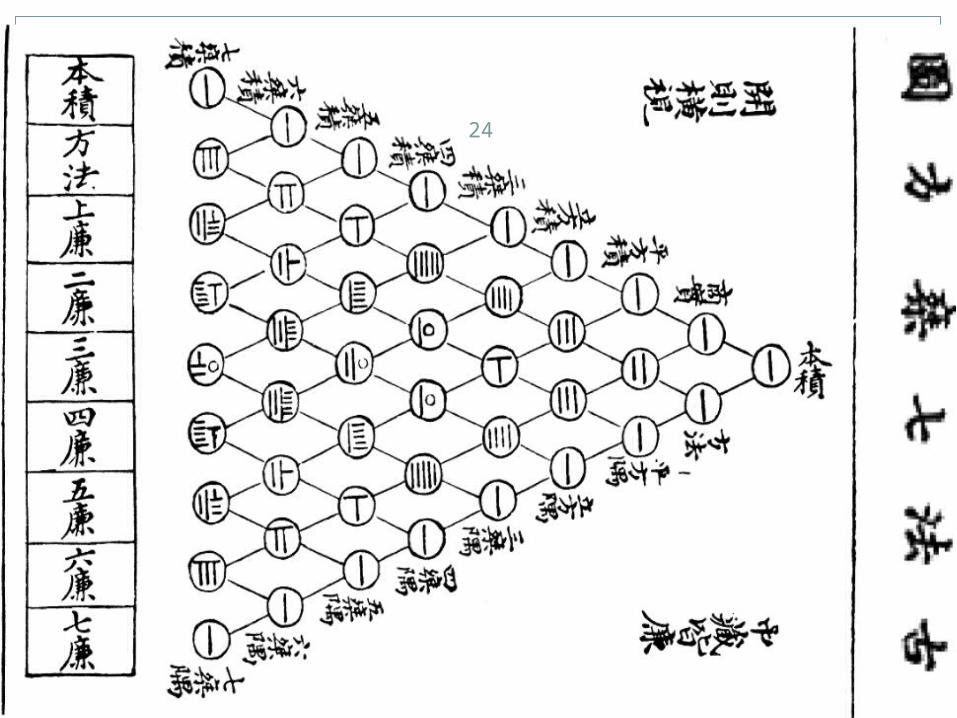
Earliest Chinese Math Text
The Suàn shù shū (筭數書 ), or the Writings on Reckoning . . . .
22

Earliest Chinese Math Text23
24
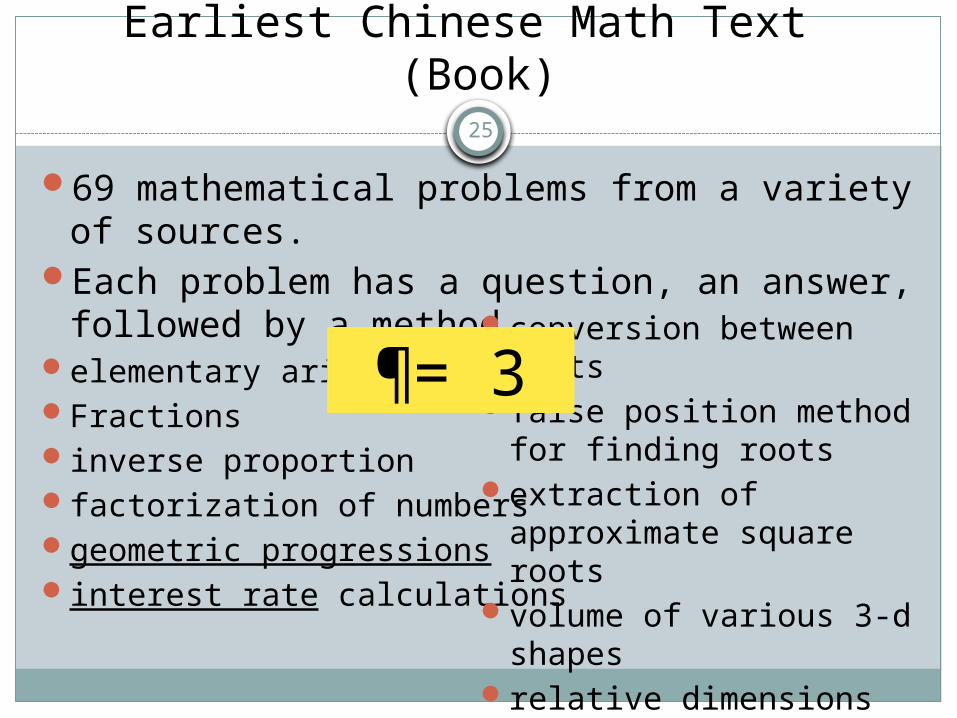
Earliest Chinese Math Text (Book)25
69 mathematical problems from a variety of sources.
Each problem has a question, an answer, followed by a method.
elementary arithmeticFractionsinverse proportionfactorization of numbersgeometric progressionsinterest rate calculations
conversion between unitsfalse position method for
finding roots extraction of approximate
square rootsvolume of various 3-d
shapesrelative dimensions of a
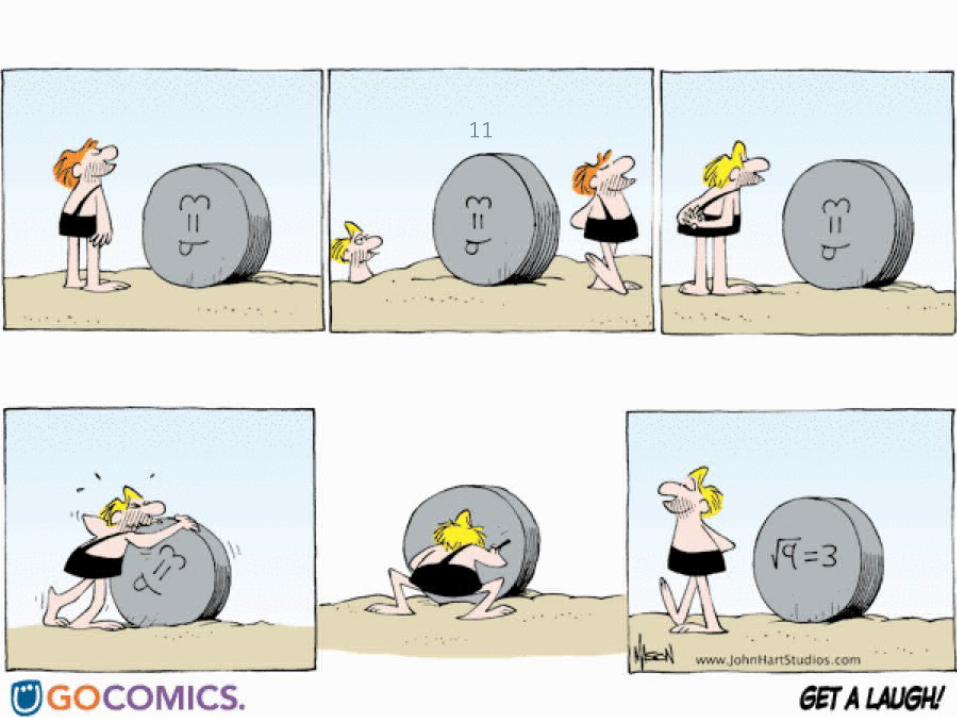
square and its inscribed circle
¶= 3
First Calculators?27
Exponential Time Jump28
KENTUCKY EDUCATION REFORM
ACT (KERA)
When was the first time “We” got standards?
29
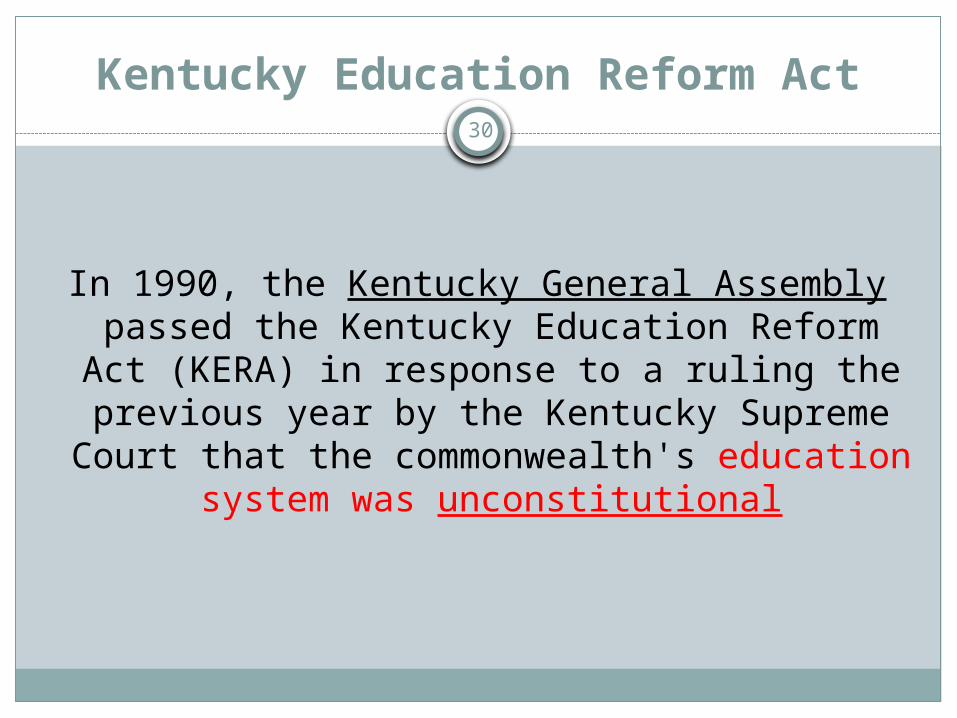
Kentucky Education Reform Act
In 1990, the Kentucky General Assembly passed the Kentucky Education Reform Act (KERA) in response to a ruling the previous
year by the Kentucky Supreme Court that the commonwealth's education system was
unconstitutional
30
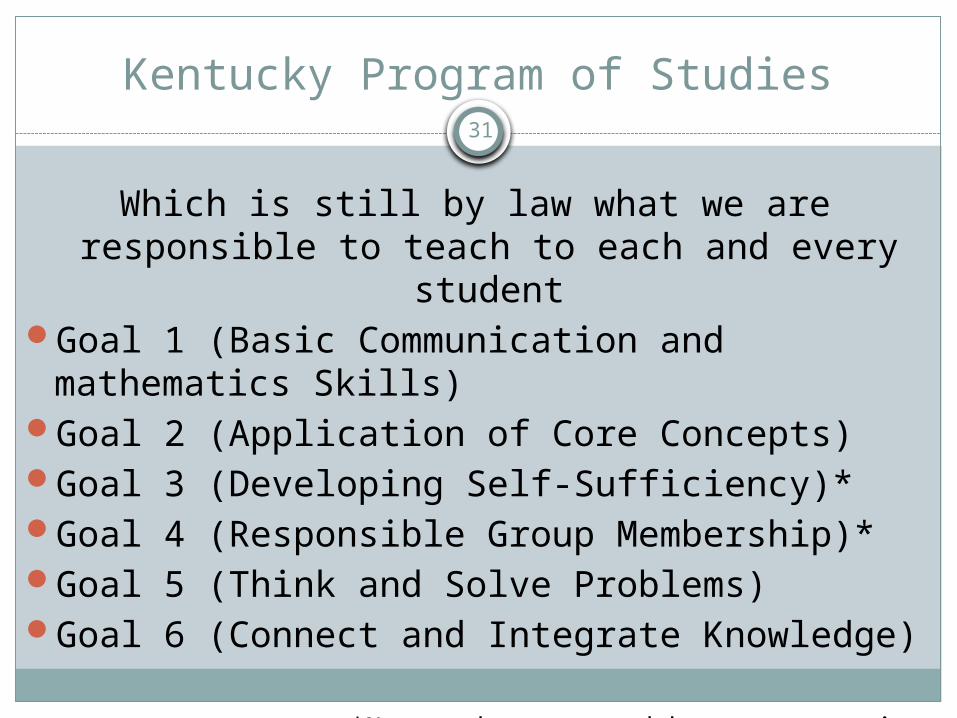
Kentucky Program of Studies
Which is still by law what we are responsible to teach to each and every student
Goal 1 (Basic Communication and mathematics Skills)
Goal 2 (Application of Core Concepts) Goal 3 (Developing Self-Sufficiency)* Goal 4 (Responsible Group Membership)*Goal 5 (Think and Solve Problems) Goal 6 (Connect and Integrate Knowledge)
*Not to be assessed by state testing
31
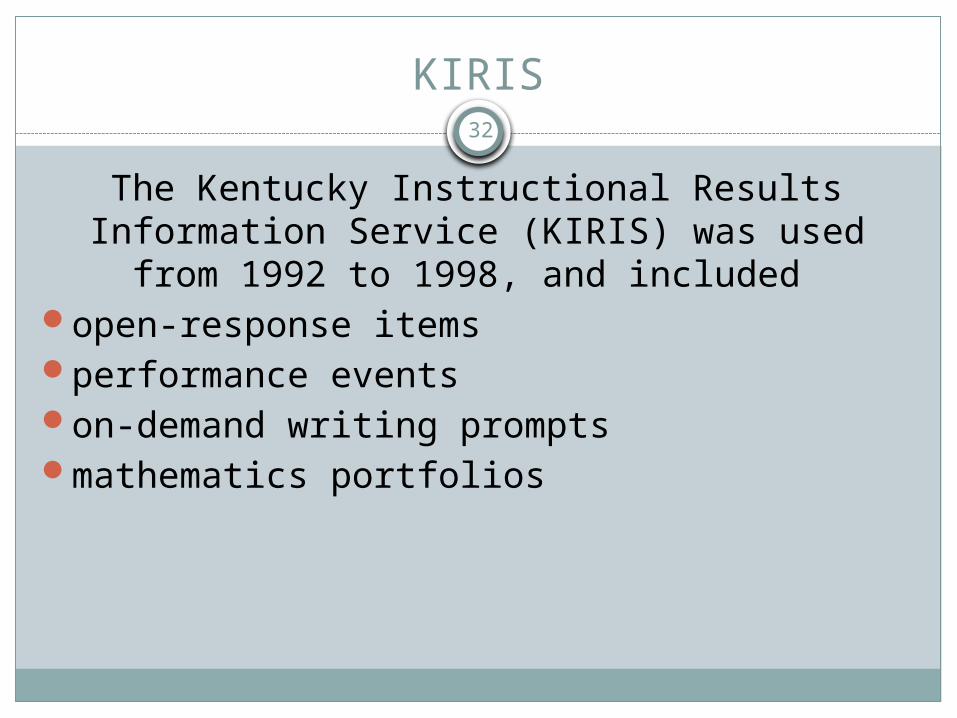
KIRIS
The Kentucky Instructional Results Information Service (KIRIS) was used from 1992 to 1998,
and included open-response itemsperformance eventson-demand writing promptsmathematics portfolios
32
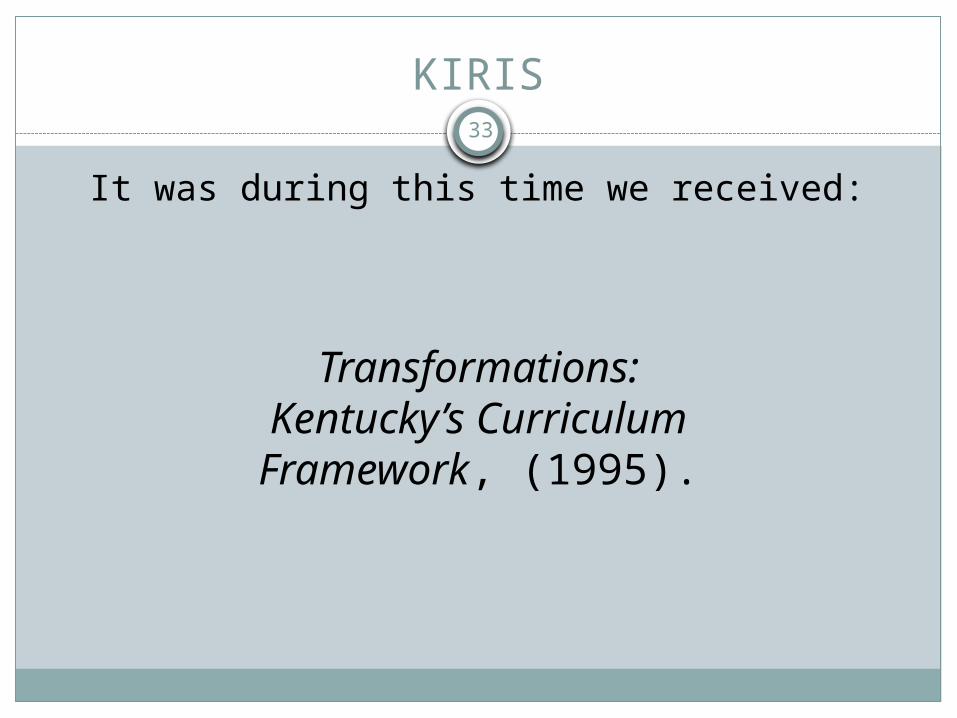
KIRIS
It was during this time we received:
33
Transformations: Kentucky’s Curriculum
Framework, (1995).
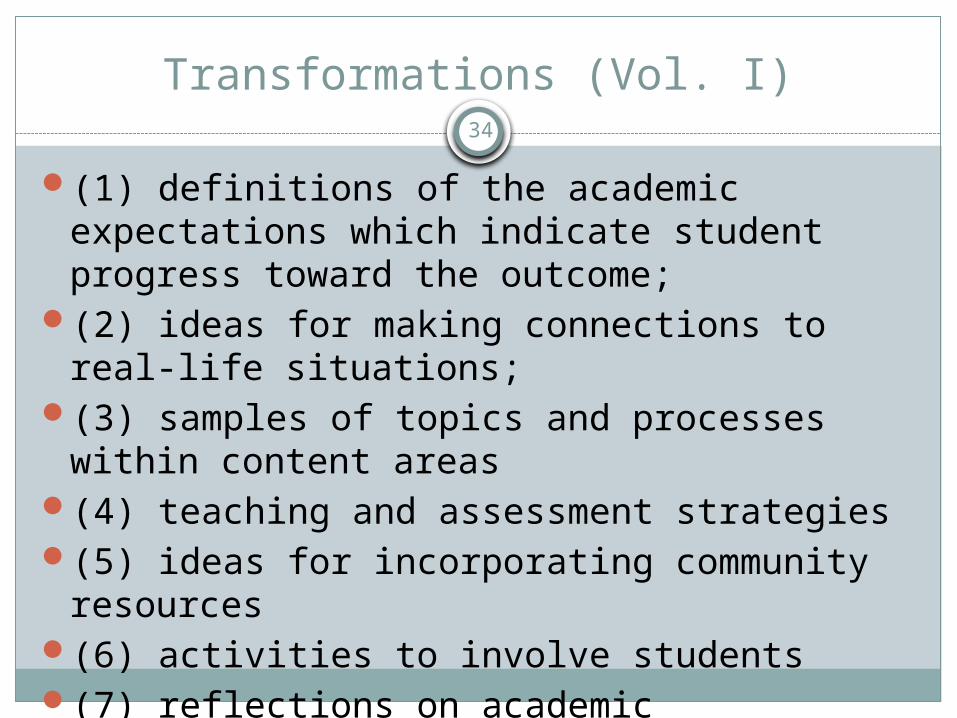
Transformations (Vol. I)
(1) definitions of the academic expectations which indicate student progress toward the outcome;
(2) ideas for making connections to real-life situations;
(3) samples of topics and processes within content areas
(4) teaching and assessment strategies(5) ideas for incorporating community
resources(6) activities to involve students(7) reflections on academic expectations.
34
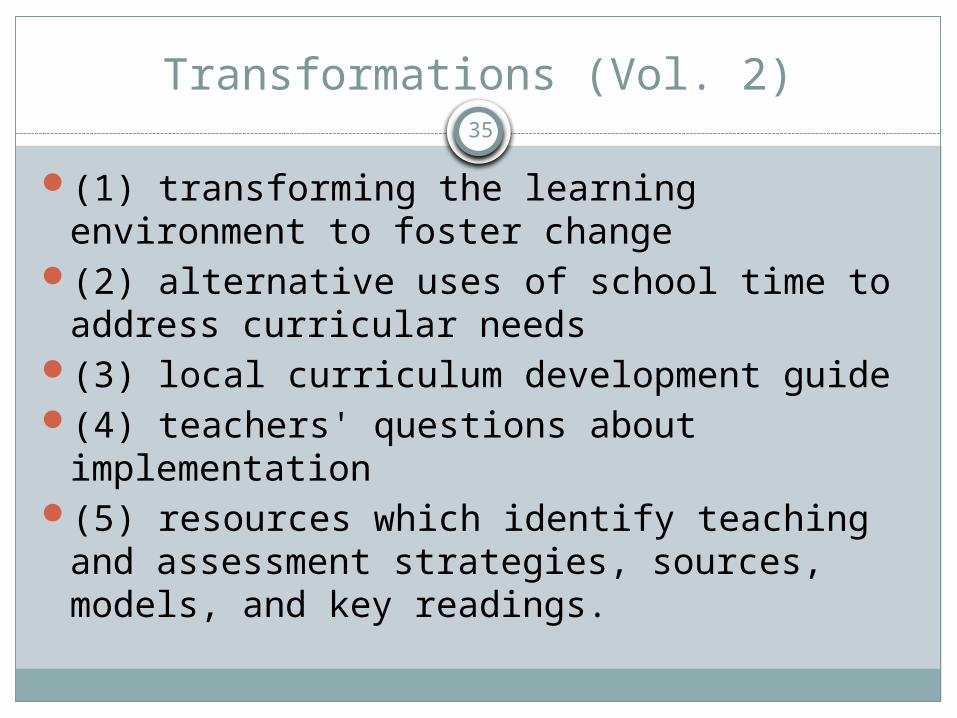
Transformations (Vol. 2)
(1) transforming the learning environment to foster change
(2) alternative uses of school time to address curricular needs
(3) local curriculum development guide(4) teachers' questions about implementation(5) resources which identify teaching and
assessment strategies, sources, models, and key readings.
35

?.?
Core Content36
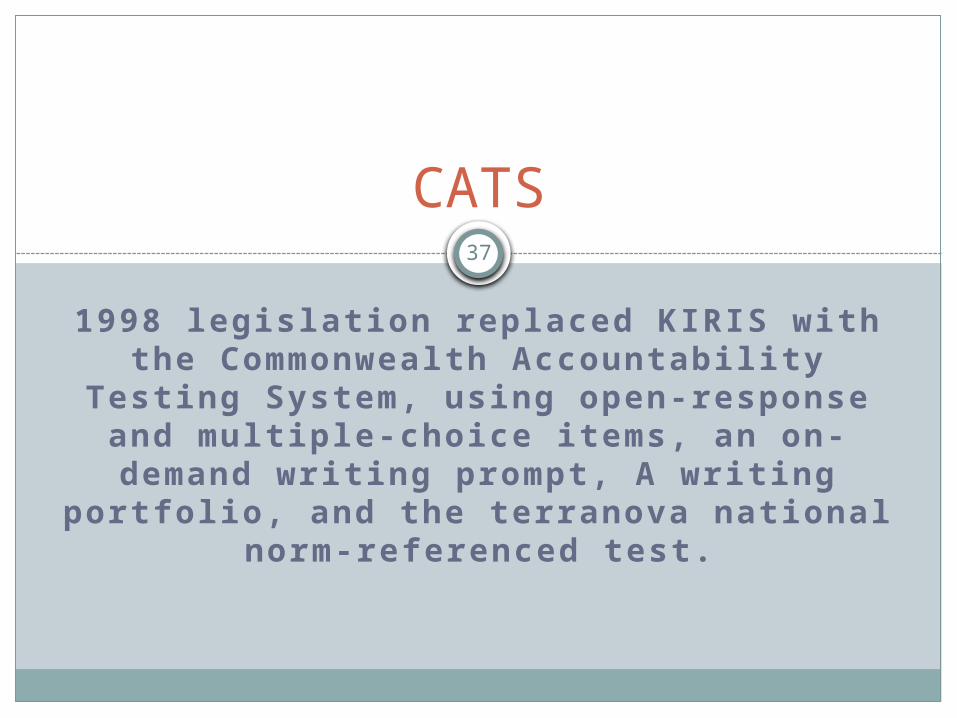
1998 legislat ion replaced KIRIS with the Commonwealth Accountabi l i ty Testing
System, using open-response and mult iple-choice i tems, an on-demand writ ing prompt,
A writ ing portfol io, and the terranova national norm-referenced test .
CATS37
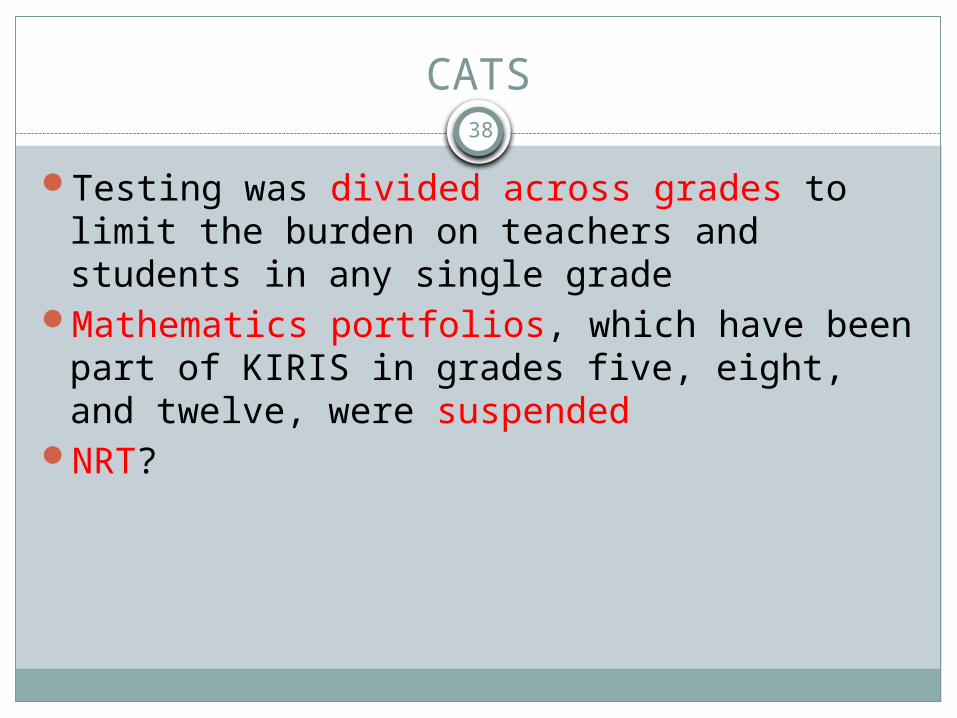
CATS
Testing was divided across grades to limit the burden on teachers and students in any single grade
Mathematics portfolios, which have been part of KIRIS in grades five, eight, and twelve, were suspended
NRT?
38
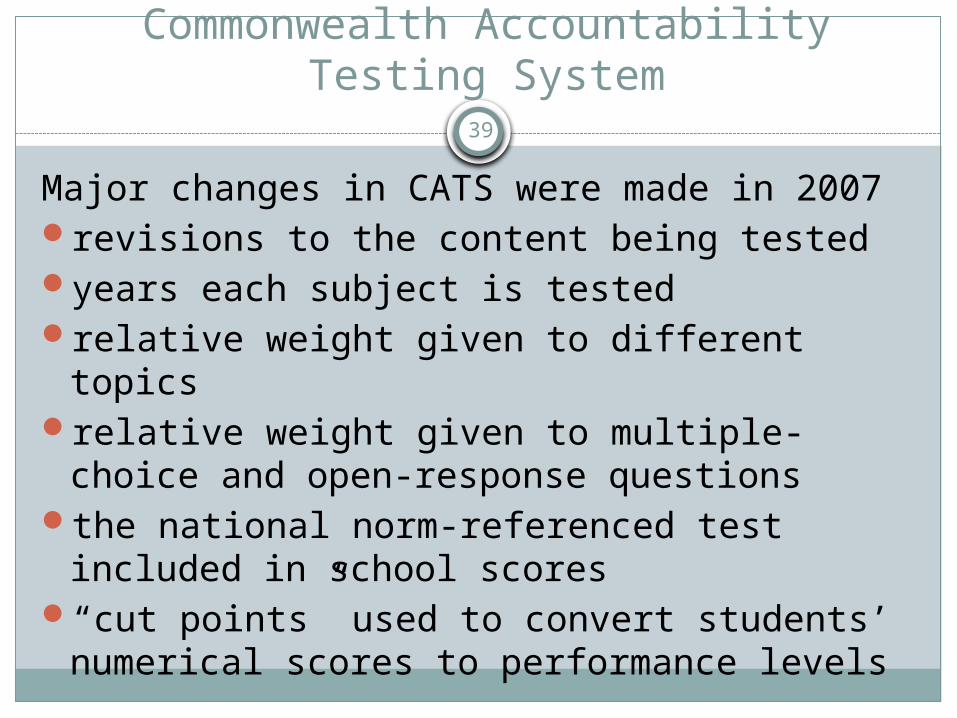
Commonwealth Accountability Testing System
Major changes in CATS were made in 2007revisions to the content being testedyears each subject is testedrelative weight given to different topicsrelative weight given to multiple-choice and
open-response questionsthe national norm-referenced test included in
school scores“cut points” used to convert students’
numerical scores to performance levels
39
FEBRUARY 10, 2009
Senate Bill 140
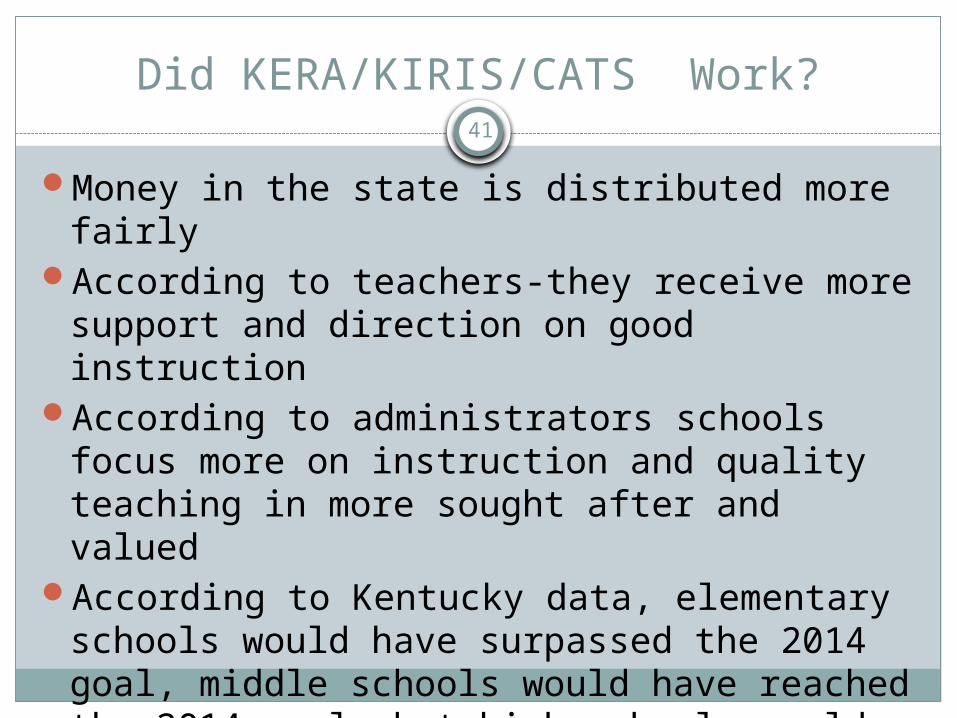
Did KERA/KIRIS/CATS Work?
Money in the state is distributed more fairlyAccording to teachers-they receive more
support and direction on good instruction According to administrators schools focus
more on instruction and quality teaching in more sought after and valued
According to Kentucky data, elementary schools would have surpassed the 2014 goal, middle schools would have reached the 2014 goal, but high schools would have not reached the 2014 goal of proficiency
41
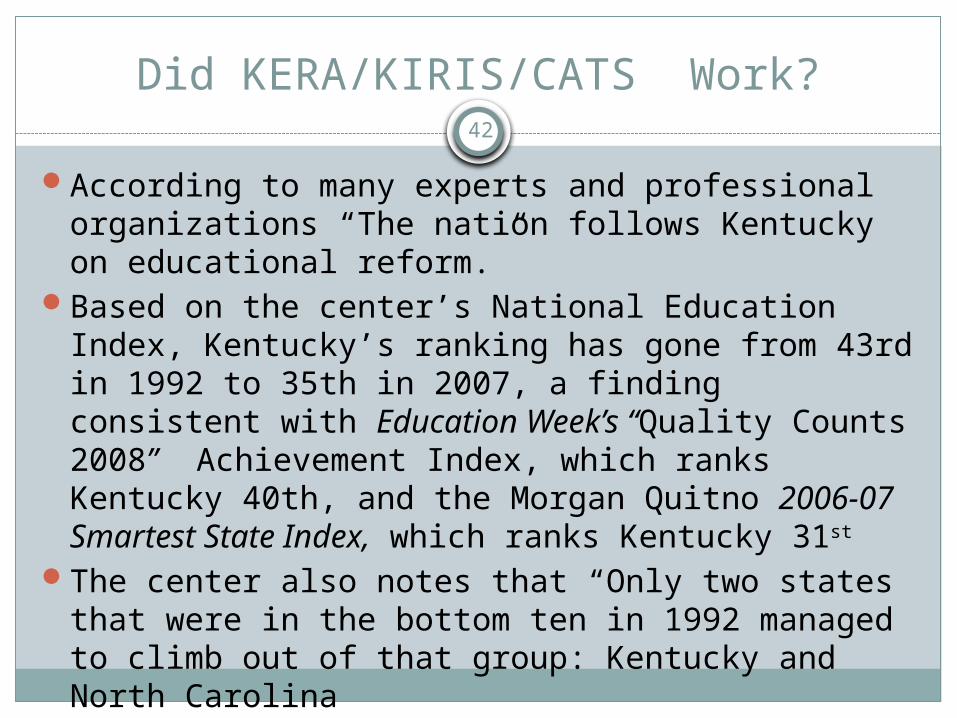
Did KERA/KIRIS/CATS Work?
According to many experts and professional organizations “The nation follows Kentucky on educational reform.”
Based on the center’s National Education Index, Kentucky’s ranking has gone from 43rd in 1992 to 35th in 2007, a finding consistent with Education Week’s “Quality Counts 2008” Achievement Index, which ranks Kentucky 40th, and the Morgan Quitno 2006-07 Smartest State Index, which ranks Kentucky 31st
The center also notes that “Only two states that were in the bottom ten in 1992 managed to climb out of that group: Kentucky and North Carolina
42
COMMON CORE STATE STANDARDS INITIATIVE
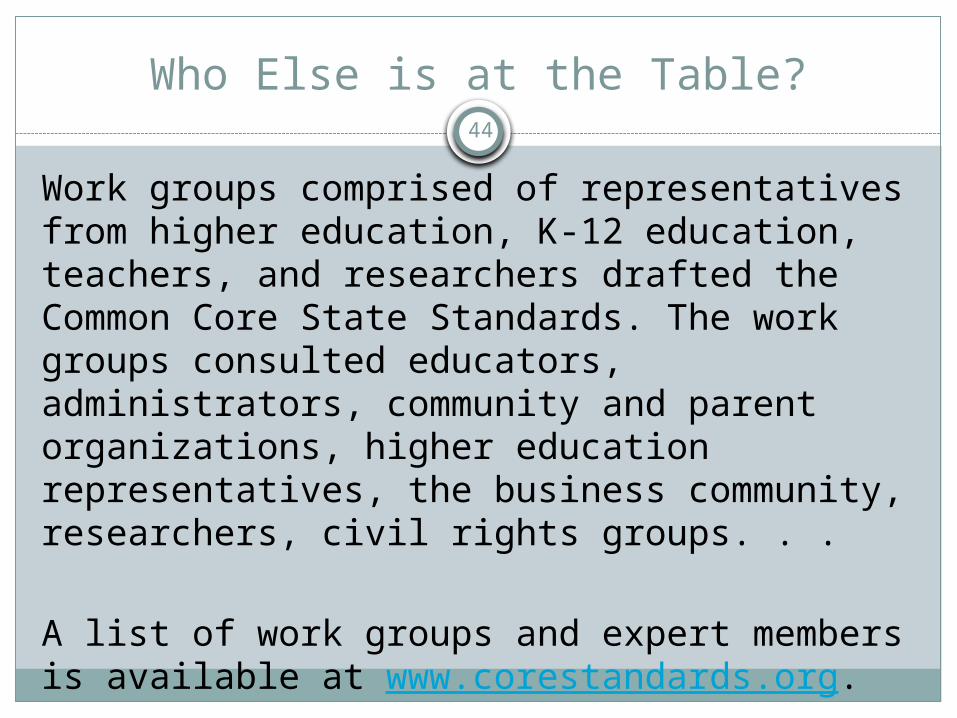
Who Else is at the Table?
Work groups comprised of representatives from higher education, K-12 education, teachers, and researchers drafted the Common Core State Standards. The work groups consulted educators, administrators, community and parent organizations, higher education representatives, the business community, researchers, civil rights groups. . .
A list of work groups and expert members is available at www.corestandards.org.
44
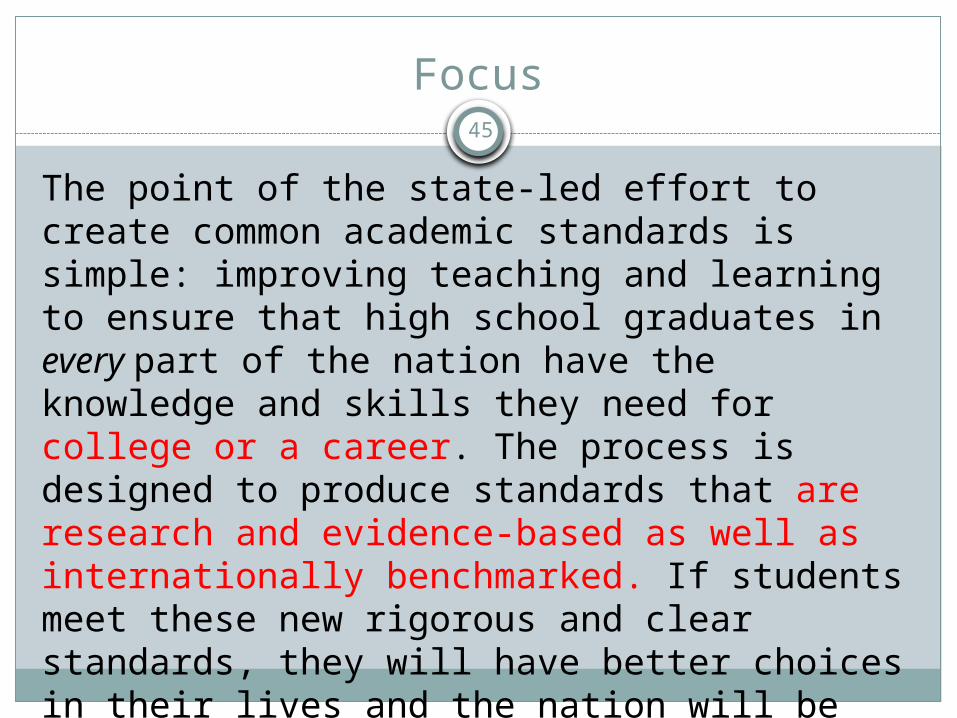
Focus
The point of the state-led effort to create common academic standards is simple: improving teaching and learning to ensure that high school graduates in every part of the nation have the knowledge and skills they need for college or a career. The process is designed to produce standards that are research and evidence-based as well as internationally benchmarked. If students meet these new rigorous and clear standards, they will have better choices in their lives and the nation will be more competitive in today’s global economy.
45
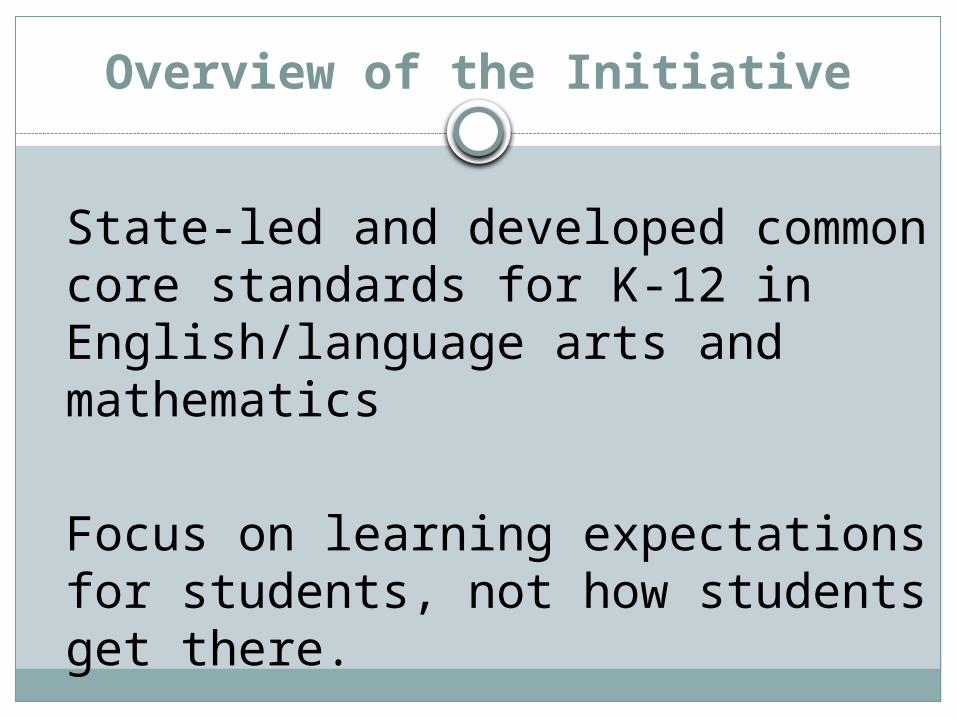
Overview of the Initiative
State-led and developed common core standards for K-12 in English/language arts and mathematics
Focus on learning expectations for students, not how students get there.
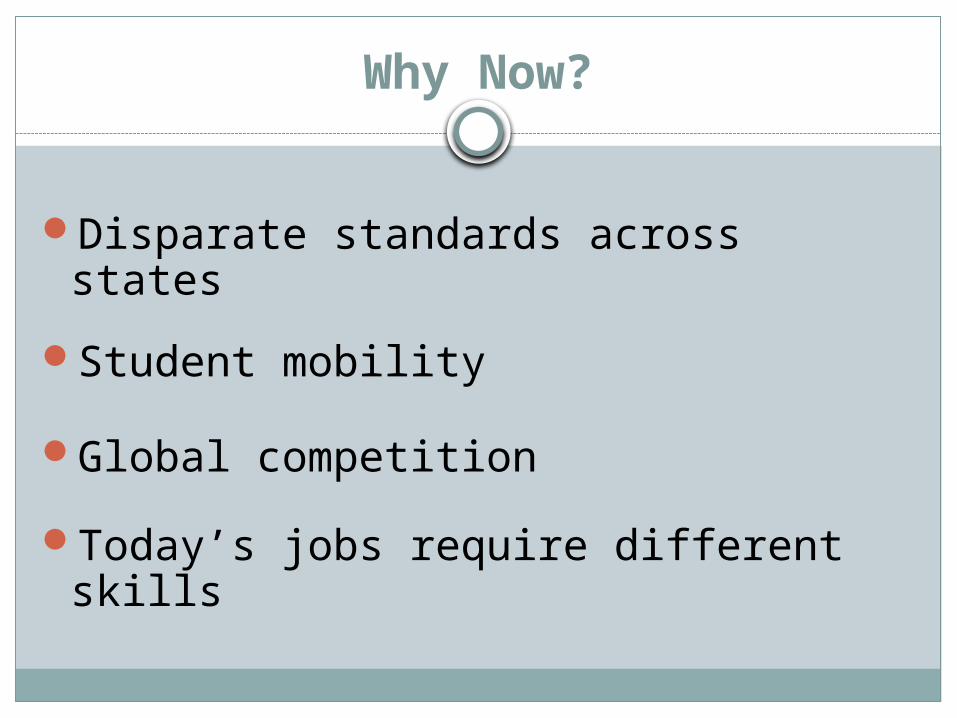
Why Now?
Disparate standards across states
Student mobility
Global competition
Today’s jobs require different skills
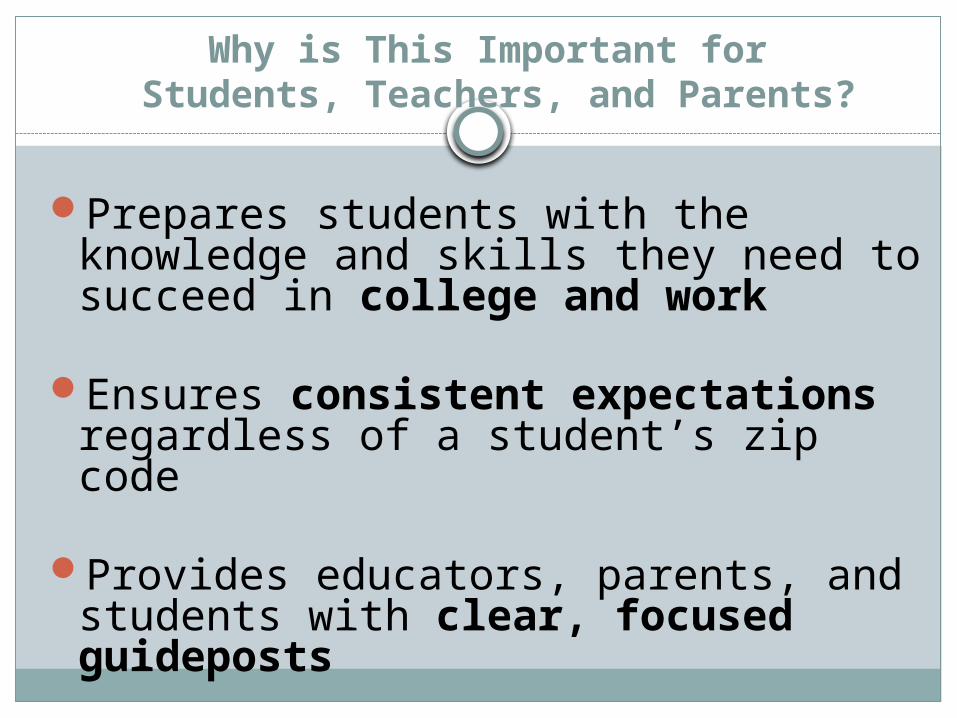
Why is This Important for Students, Teachers, and Parents?
Prepares students with the knowledge and skills they need to succeed in college and work
Ensures consistent expectations regardless of a student’s zip code
Provides educators, parents, and students with clear, focused guideposts
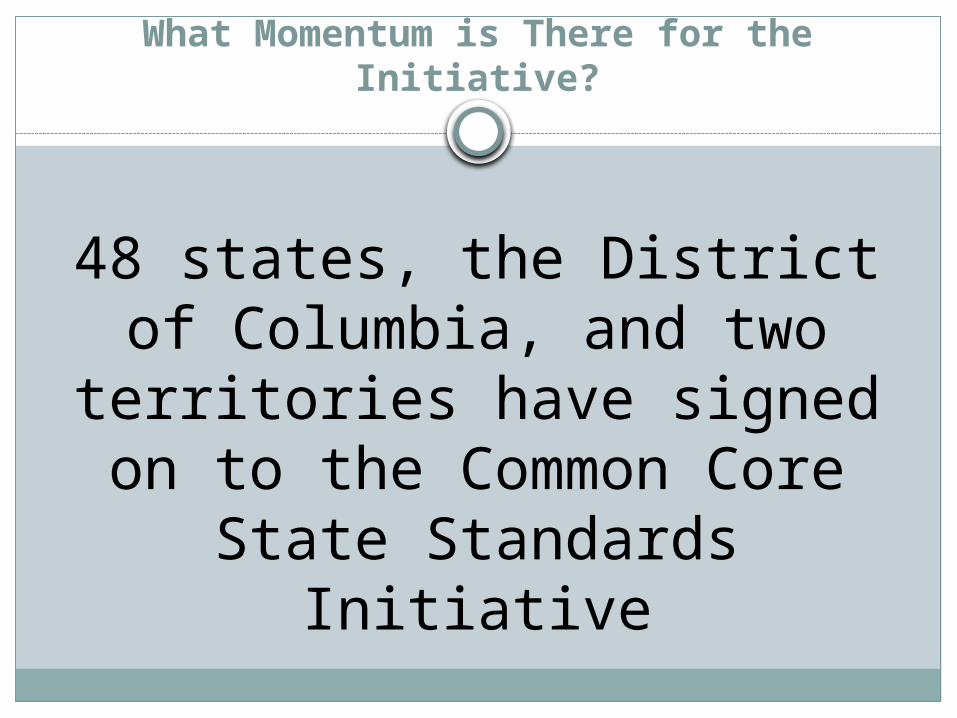
What Momentum is There for the Initiative?
48 states, the District of Columbia, and two
territories have signed on to the Common Core State
Standards Initiative

Criteria for the Standards
Fewer, clearer, and higher
Aligned with college and work expectations
Include rigorous content and application of knowledge through high-order skills
Build upon strengths and lessons of current state standards
Internationally benchmarked, so that all students are prepared to succeed in our global economy and society
Based on evidence and research not professional opinion
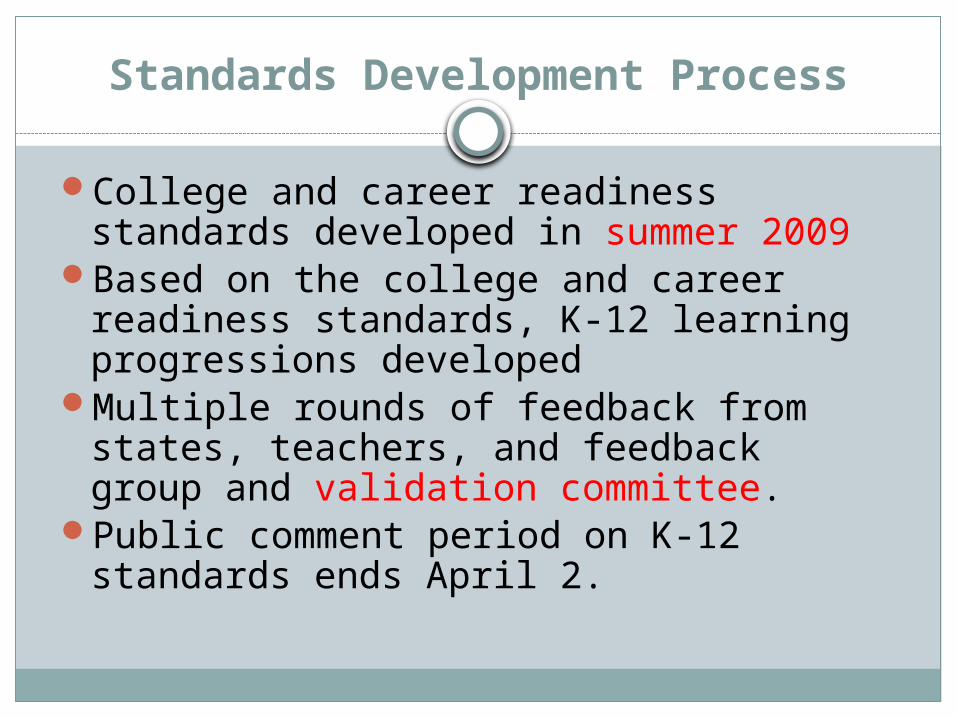
Standards Development Process
College and career readiness standards developed in summer 2009
Based on the college and career readiness standards, K-12 learning progressions developed
Multiple rounds of feedback from states, teachers, and feedback group and validation committee.
Public comment period on K-12 standards ends April 2.
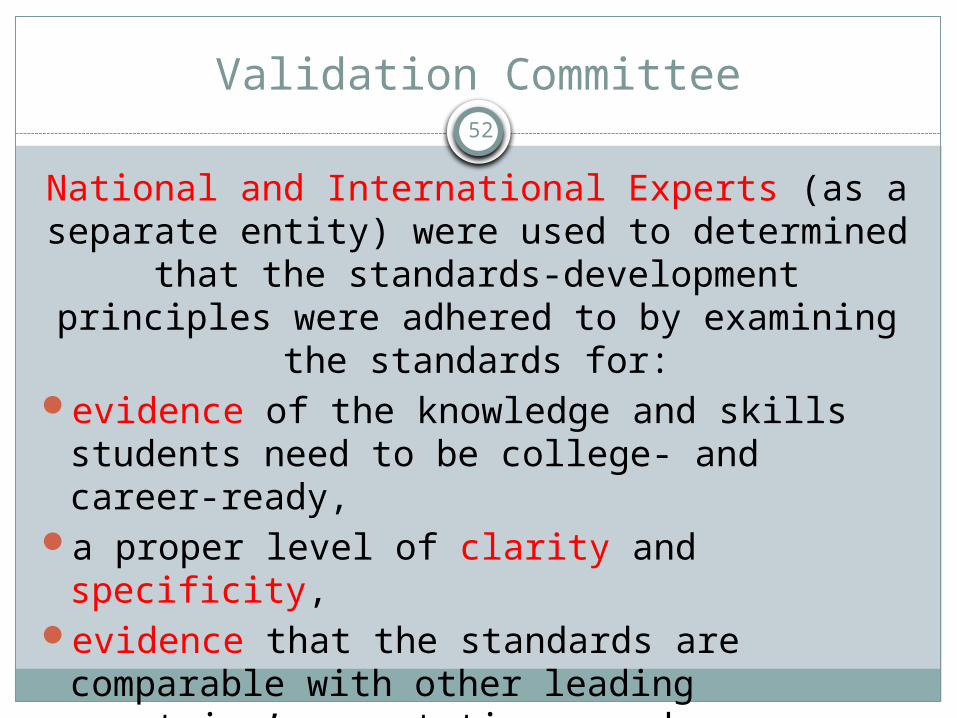
Validation Committee
National and International Experts (as a separate entity) were used to determined that
the standards-development principles were adhered to by examining the standards for:
evidence of the knowledge and skills students need to be college- and career-ready,
a proper level of clarity and specificity,evidence that the standards are comparable
with other leading countries’ expectations, and
a grounding in available evidence and research.
52
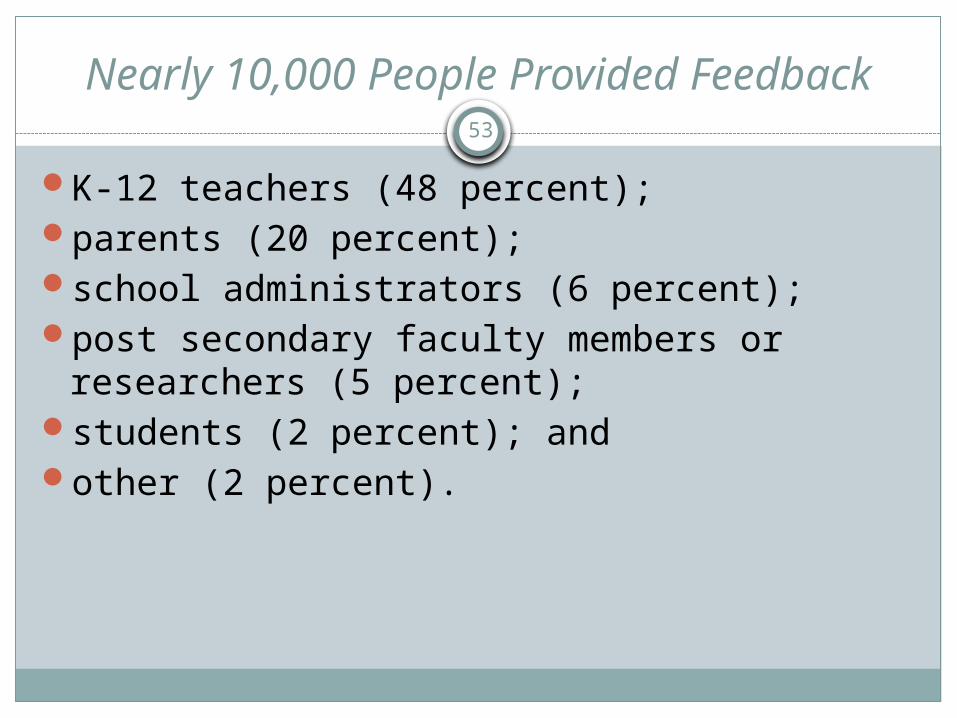
Nearly 10,000 People Provided Feedback
K-12 teachers (48 percent);parents (20 percent);�school administrators (6 percent);�post secondary faculty members or �
researchers (5 percent);students (2 percent); and�other (2 percent).�
53
Math Standards Advances
Focuses on core conceptual understandings and procedures starting in the early grades.
In grades K-5 students gain a solid foundation in whole numbers, addition, subtraction, multiplication, division, fractions, and decimals. For example, students in Kindergarten focus on the number core in order to prepare them for addition and subtraction.
In the middle grades, students build upon the strong foundation in grades K-5 through hands on learning in geometry, algebra, probability, and statistics.
The high school standards call on students to practice applying mathematical ways of thinking to real world issues and challenges and emphasize mathematical modeling.
Difference Now?
Vertically aligned (a k-12 package)
Developmentally appropriate according to research
A continuum of basics to higher level thinking
More specifics
Internationally benchmarked
55
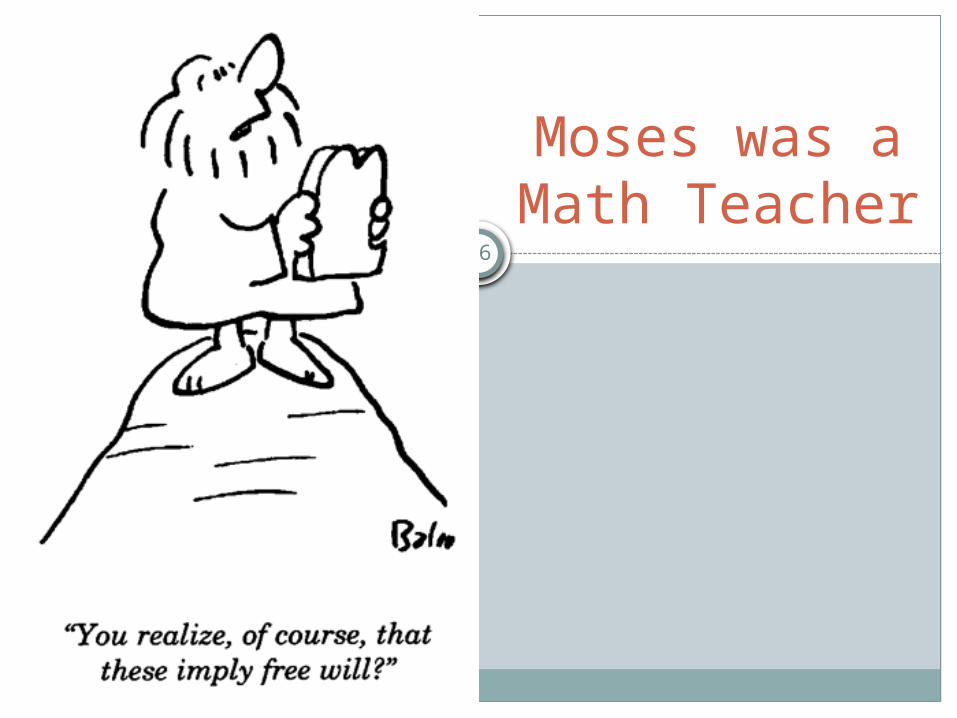
Moses was a Math Teacher
56
Opinion?
A majority of educators agree or strongly agree that the College- and Career-Readiness Standards accurately portray the characteristics exhibited by a student ready for success after high school.
Twenty-five percent of respondents who disagree that the standards are set at the appropriate level of rigor, do so for a variety of reasons but are split between whether they are too high or too low.
57
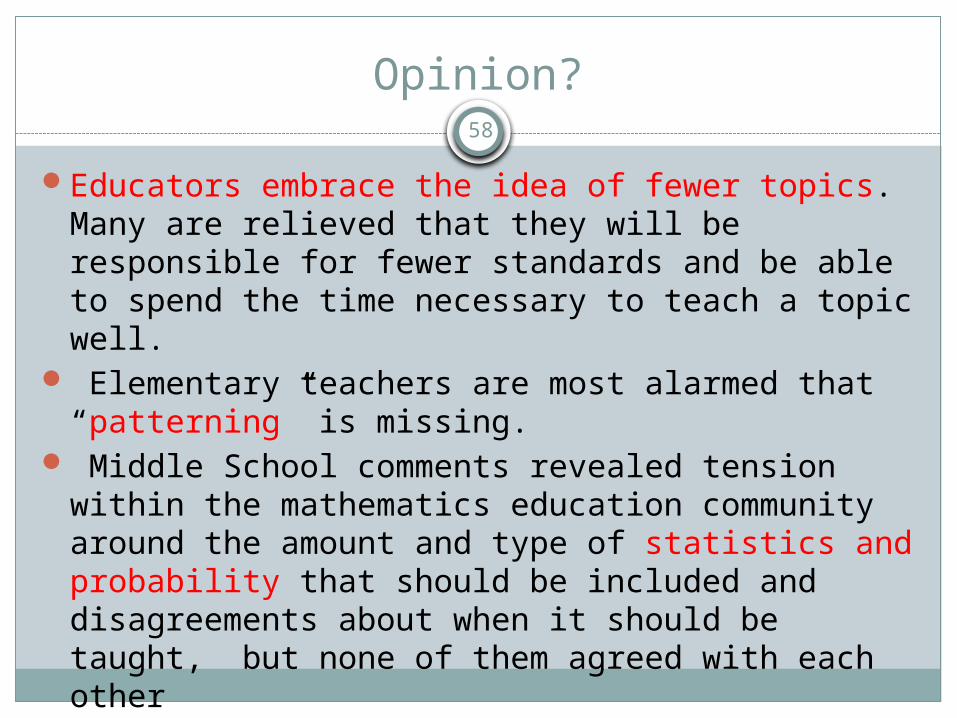
Opinion?
Educators embrace the idea of fewer topics. Many are relieved that they will be responsible for fewer standards and be able to spend the time necessary to teach a topic well.
Elementary teachers are most alarmed that “patterning” is missing.
Middle School comments revealed tension within the mathematics education community around the amount and type of statistics and probability that should be included and disagreements about when it should be taught, but none of them agreed with each other
58
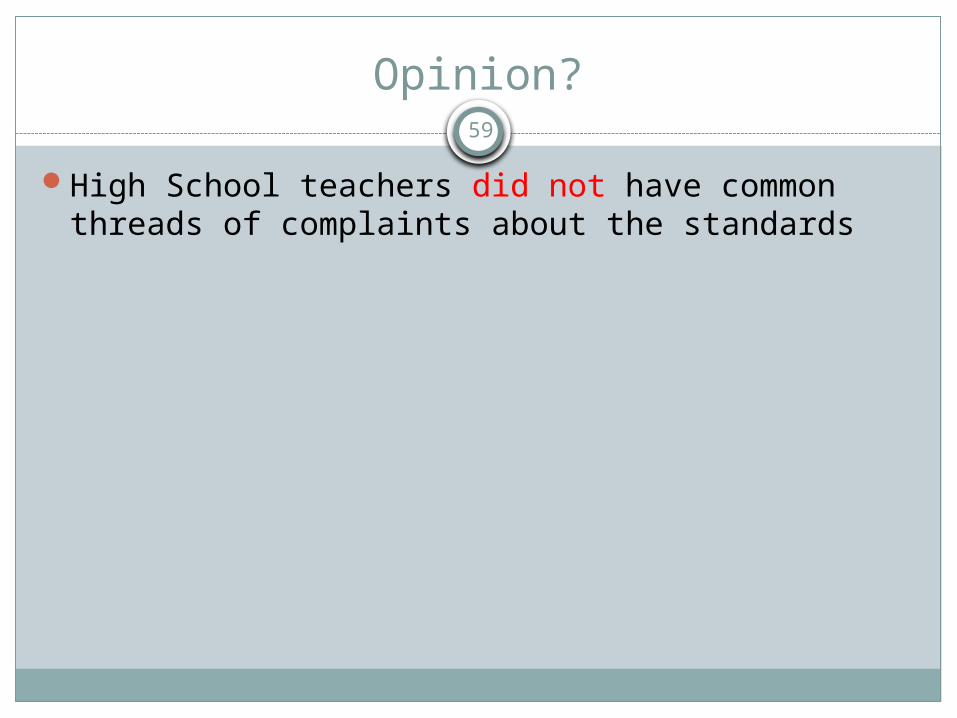
Opinion?
High School teachers did not have common threads of complaints about the standards
59
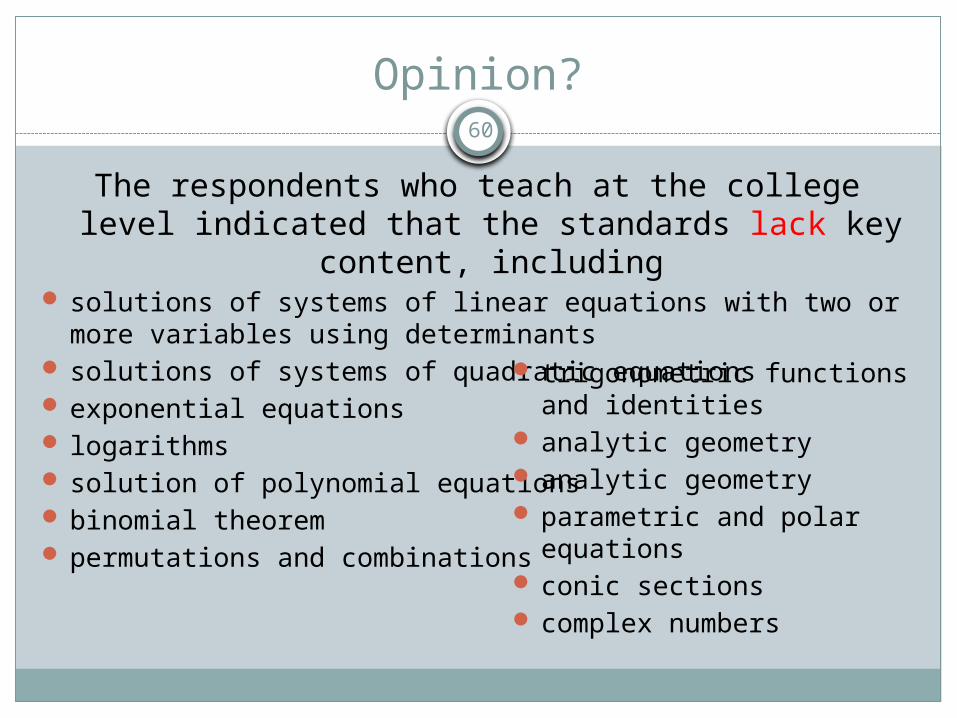
Opinion?
The respondents who teach at the college level indicated that the standards lack key content,
including solutions of systems of linear equations with two or more
variables using determinants solutions of systems of quadratic equations exponential equations logarithms solution of polynomial equations binomial theorem permutations and combinations
60
trigonometric functions and identities
analytic geometry analytic geometry parametric and polar
equations conic sections complex numbers
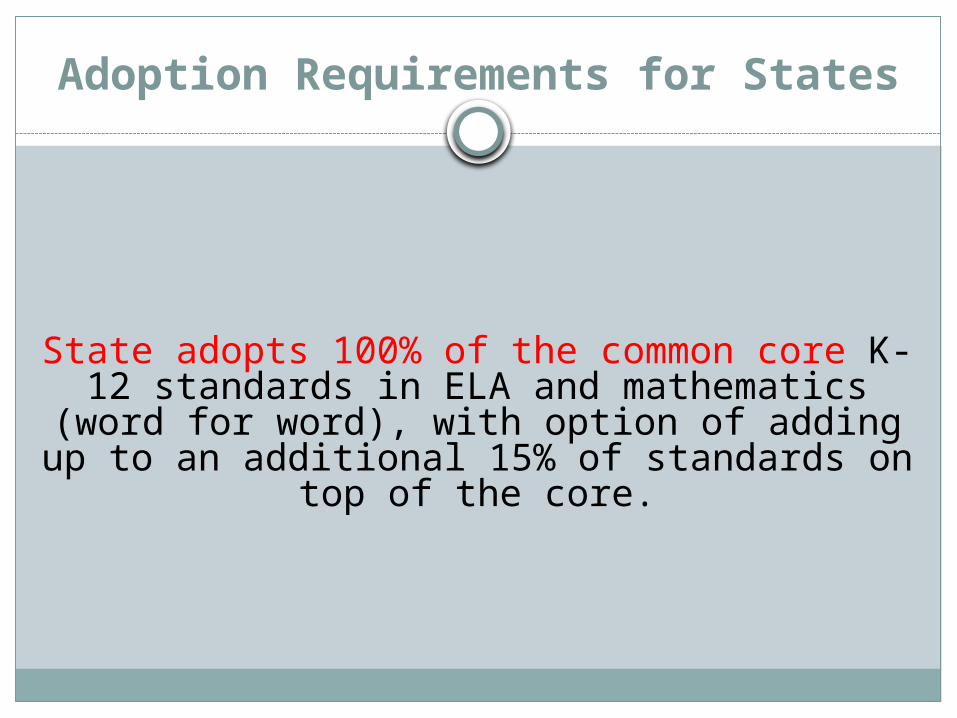
Adoption Requirements for States
State adopts 100% of the common core K-12 standards in ELA and mathematics (word for
word), with option of adding up to an additional 15% of standards on top of the
core.
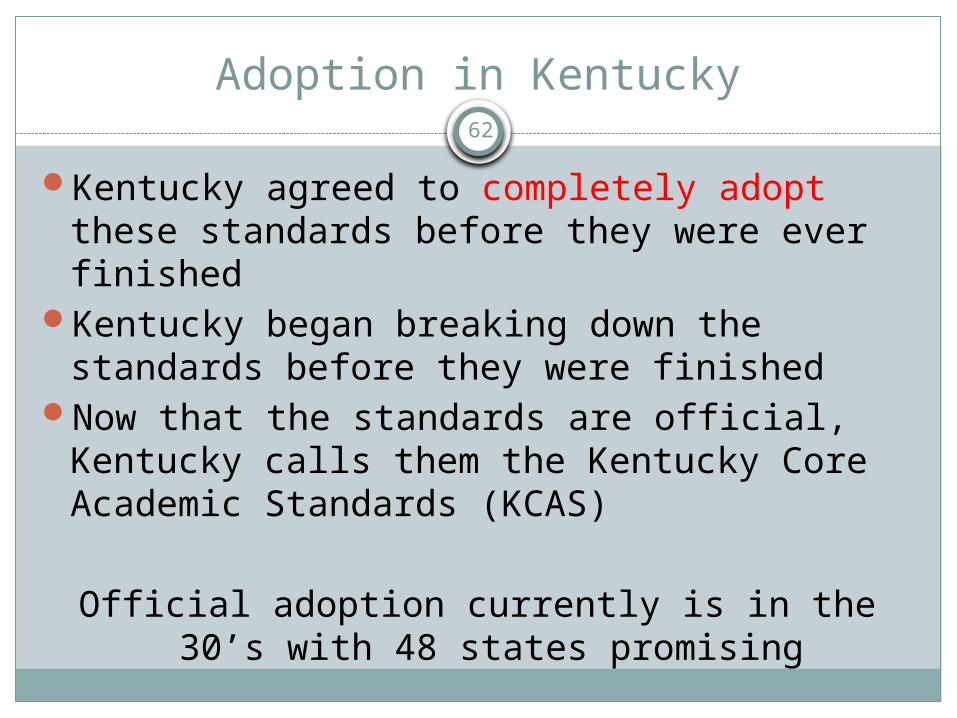
Adoption in Kentucky
Kentucky agreed to completely adopt these standards before they were ever finished
Kentucky began breaking down the standards before they were finished
Now that the standards are official, Kentucky calls them the Kentucky Core Academic Standards (KCAS)
Official adoption currently is in the 30’s with 48 states promising
62
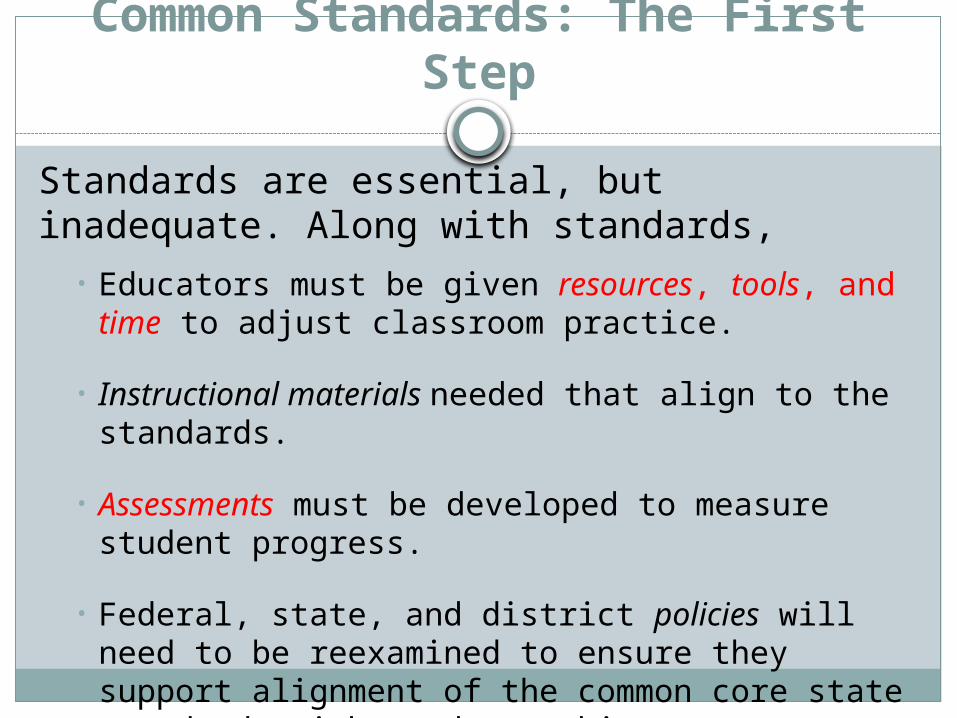
Common Standards: The First Step
Standards are essential, but inadequate. Along with standards,
• Educators must be given resources, tools, and time to adjust classroom practice.
• Instructional materials needed that align to the standards.
• Assessments must be developed to measure student progress.
• Federal, state, and district policies will need to be reexamined to ensure they support alignment of the common core state standards with student achievement.
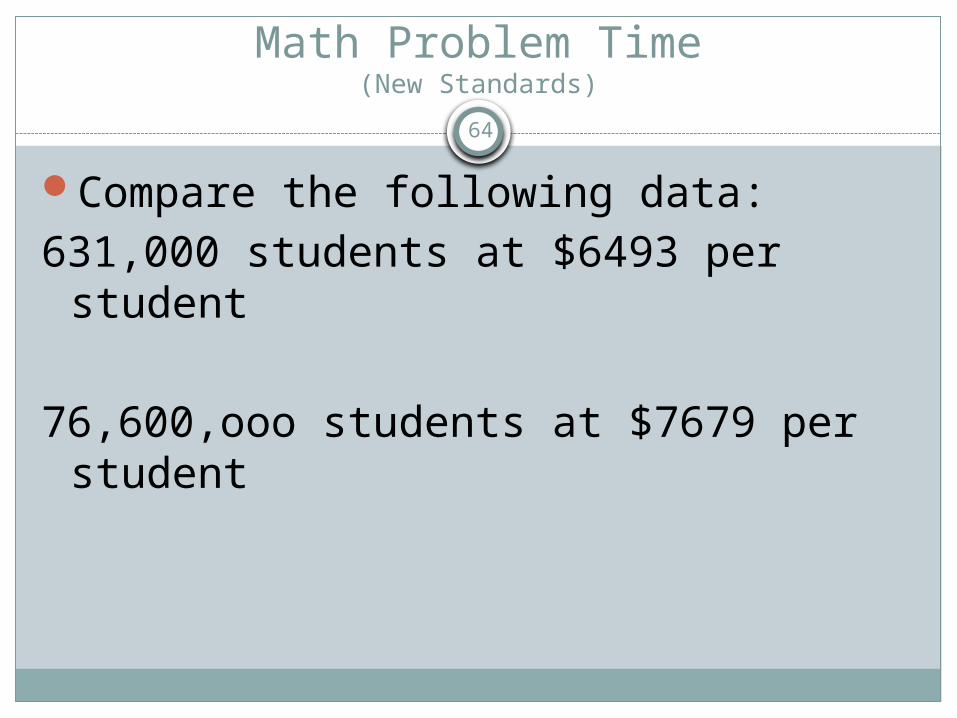
Math Problem Time(New Standards)
Compare the following data:631,000 students at $6493 per student
76,600,ooo students at $7679 per student
64
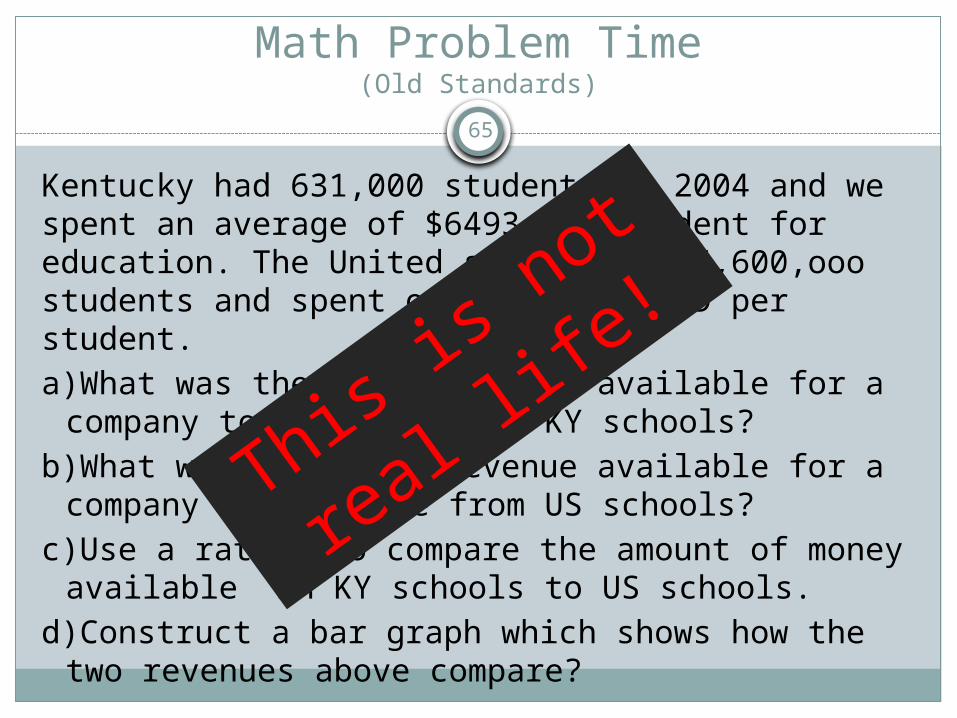
Math Problem Time(Old Standards)
Kentucky had 631,000 students in 2004 and we spent an average of $6493 per student for education. The United states has 76,600,ooo students and spent on average $7679 per student.a)What was the total revenue available for a
company to leverage from KY schools?b)What was the total revenue available for a
company to leverage from US schools?c)Use a ration to compare the amount of money
available in KY schools to US schools.d)Construct a bar graph which shows how the two
revenues above compare?
65
This is
not
real li
fe!
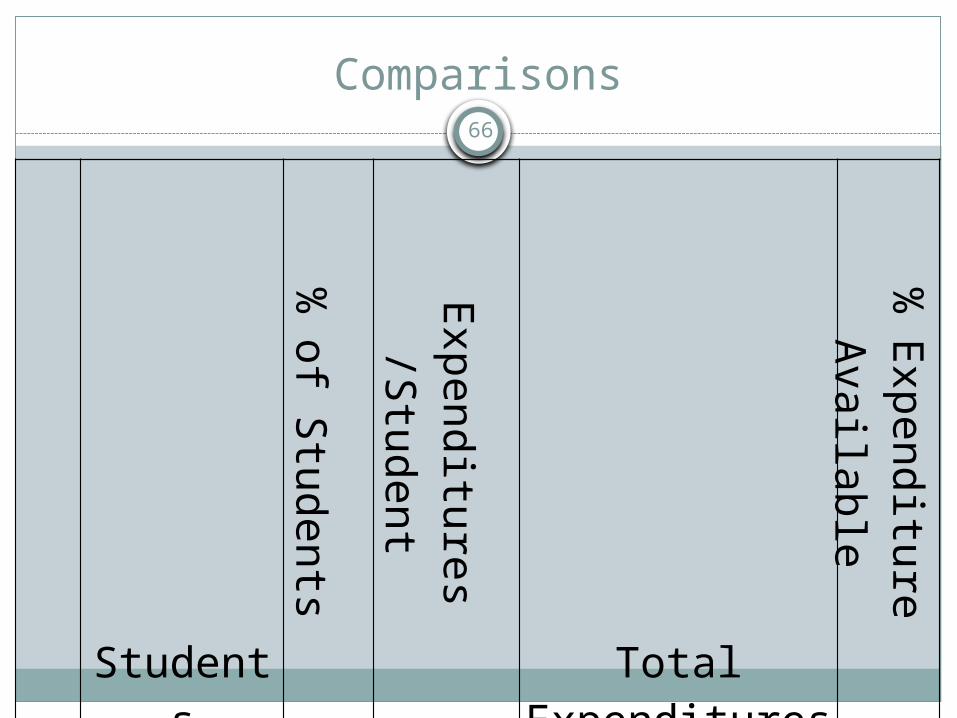
Comparisons66
Students
% of Students
Expenditures
/Student
Total Expenditures
% Expenditu
re Available
KY 631,000 1% $6,493 $4,097,083,000 1%
US 76,600,000 99% $7,679 $588,211,400,000 99%
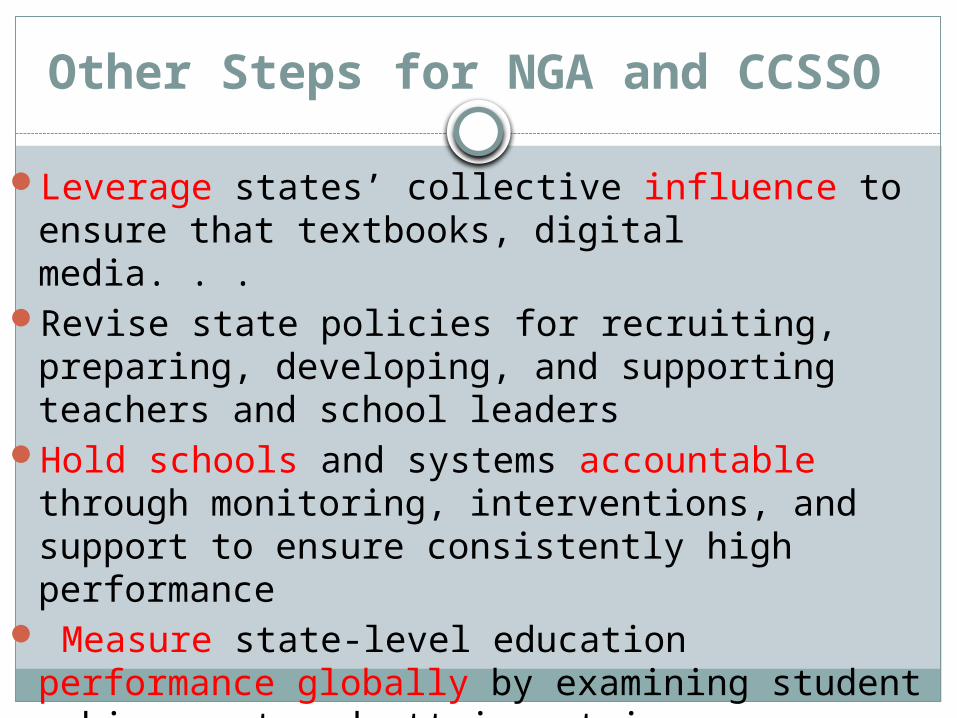
Other Steps for NGA and CCSSO
Leverage states’ collective influence to ensure that textbooks, digital media. . .
Revise state policies for recruiting, preparing, developing, and supporting teachers and school leaders
Hold schools and systems accountable through monitoring, interventions, and support to ensure consistently high performance
Measure state-level education performance globally by examining student achievement and attainment in an international context to ensure that, over time, students are receiving the education they need to compete
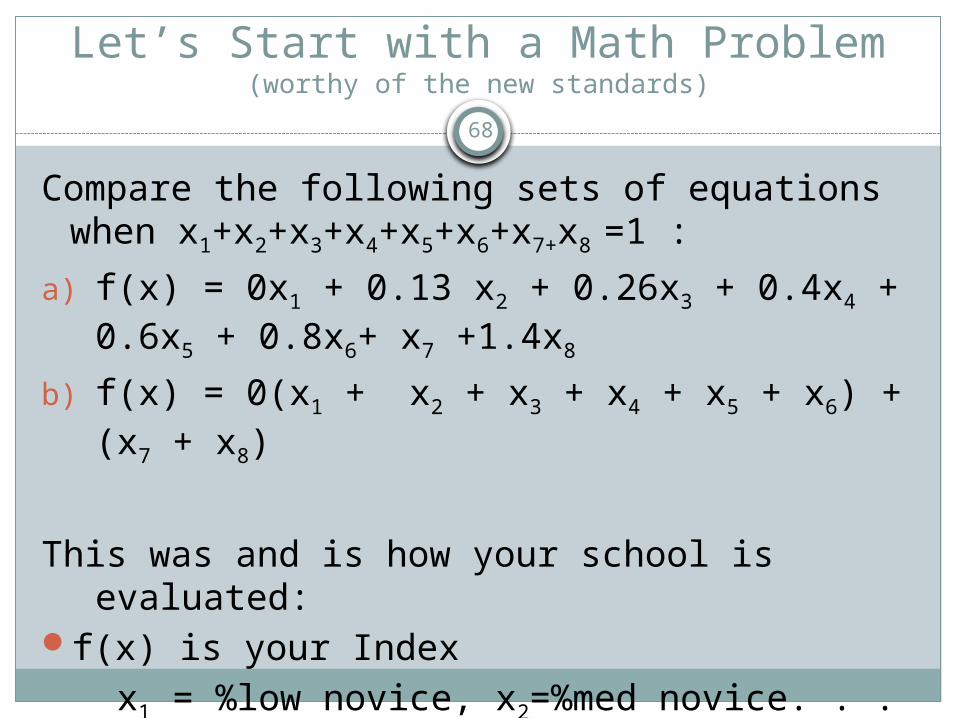
Let’s Start with a Math Problem(worthy of the new standards)
Compare the following sets of equations when x1+x2+x3+x4+x5+x6+x7+x8 =1 :
a) f(x) = 0x1 + 0.13 x2 + 0.26x3 + 0.4x4 + 0.6x5 + 0.8x6+ x7 +1.4x8
b) f(x) = 0(x1 + x2 + x3 + x4 + x5 + x6) + (x7 + x8)
This was and is how your school is evaluated:f(x) is your Index
x1 = %low novice, x2=%med novice. . . . .
x7= %proficient & x8= % distinguished
68
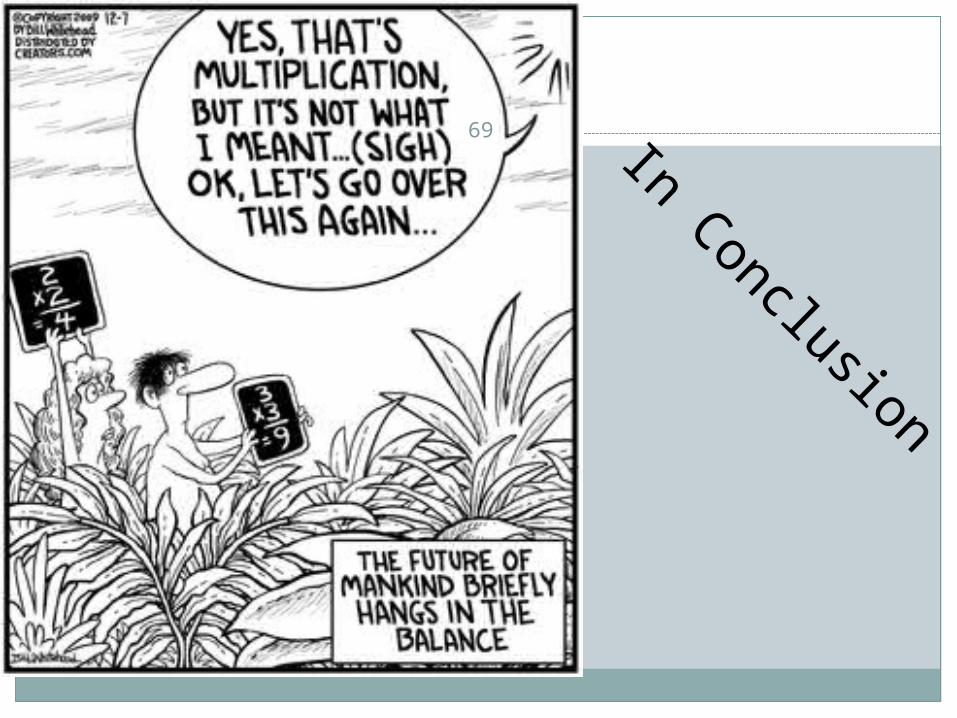
In Conclusion
69
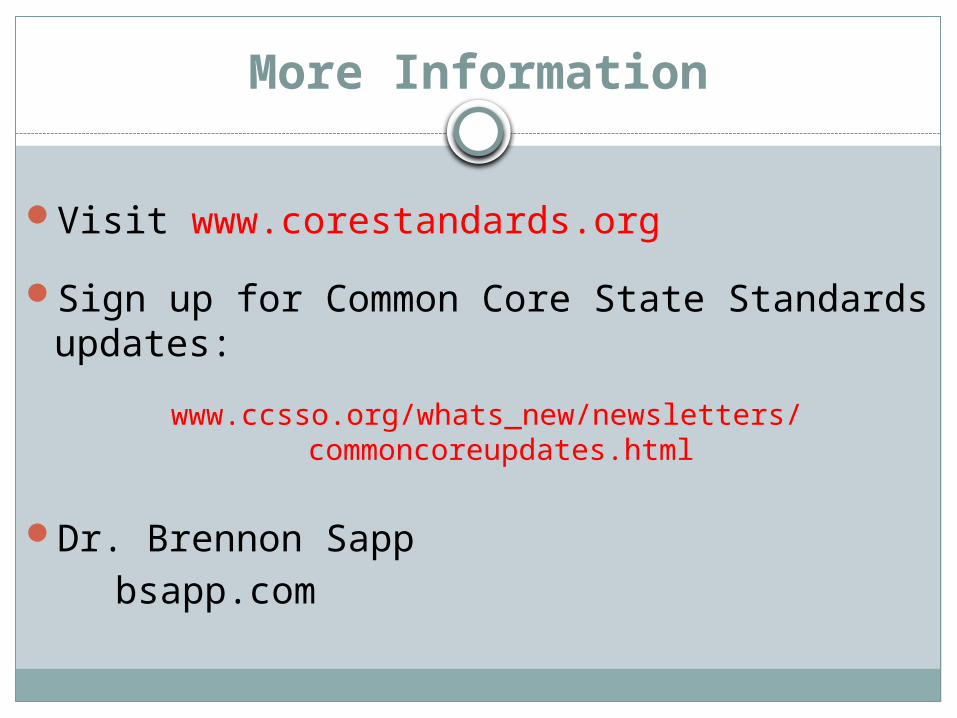
More Information
Visit www.corestandards.org
Sign up for Common Core State Standards updates:
www.ccsso.org/whats_new/newsletters/commoncoreupdates.html
Dr. Brennon Sapp bsapp.com