where’s the innovation? an analysis of the quantity and
TRANSCRIPT

WHERE’S THE INNOVATION?
AN ANALYSIS OF THE QUANTITY AND QUALITIES OF
ANTICIPATED AND OBVIOUS PATENTS
7/6/2012
(Last edited 2/14/2013)
Shawn P. Miller*
Economics Job Market Candidate
George Mason University
Adjunct Professor of Economics
University of San Diego
* Economics Ph.D., George Mason University (December 2012). B.S., Notre Dame, 2000; J.D., Notre Dame, 2004.
USPTO registered patent attorney since 2005. I wish to thank Alex T. Tabarrok, Robin D. Hanson, and Joshua D.
Wright for helpful comments on earlier drafts.

ABSTRACT
While the main theoretical benefit of patent protection is increased innovation, some assert a
swamped U.S. Patent and Trademark Office has granted an inefficiently large number of patents
with negligible innovation value. I test this argument’s plausibility and determine the
characteristics of patents without innovation by analyzing 980 litigated patents subject to
anticipation or obviousness decisions between 2000 and 2010. Using a selection corrected probit
model, I obtain unconditional estimates of the likelihood patents with given characteristics lack
innovation value. I estimate a surprising 28 percent of all patents would be found at least
partially invalid if litigated. Software, business method and licensing firm-owned patents
possess significantly higher innovation-based invalidity rates.

Miller: Where’s the Innovation? 1
1. INTRODUCTION
Increased innovation is the main theoretical economic benefit of patent protection. (Bessen and
Maskin 2009) Of course, we do not enjoy this benefit free. Our patent system includes a costly
application process through the U.S. Patent and Trademark Office (PTO) and costly method of deciding
unresolved patent disputes through federal litigation. These social costs of maintaining our system have
greatly increased in recent decades as both the number of patent applications and filed patent lawsuits
have tripled since the early 1980s (Jaffe and Lerner 2004; Bessen and Meuer, 2005b).
Many of the arguments of economists and legal scholars critical of the health of the patent
system boil down to the idea these burgeoning costs have not been matched by increases in the innovation
benefit. Jaffe and Lerner (2004), in particular, argue an increasingly swamped PTO has granted many
patents with negligible innovation benefit, particularly those covering technologies only recently patented
on a large scale. These include biotechnology, software and business method patents.
Further, opportunistic litigation by licensing firms may disproportionally add to increased costs
because the more uncertain scope of software and methods makes these patents ideal tools to extract rents
from independently inventing producers in “hold up” litigation. (Bessen and Meuer 2008) The evidence
for these arguments remains limited. However, an analysis of judicial decisions on the invalidity defenses
of anticipation and obviousness can assist in determining their credibility.
Anticipated patents are legally invalid because they cover old ideas, which are not innovative by
definition. Obvious patents are invalid because a professional in the same field would have known how
to solve the problem the invention is directed at in the same way. While an obvious solution is new in the
sense the “inventor” was the first to employ the solution, it generated no new knowledge. Thus, whether
judged obvious or anticipated, the implication is the patented ideas have negligible value as innovation so
that resources used to obtain and enforce that patent were wasted.
Despite this extreme implication, we know little about anticipation or obviousness decisions. In
this paper I remedy that gap in our knowledge by analyzing the characteristics of 980 patents subject to
final anticipation or obviousness decisions in 579 cases filed between 2000 and 2010. To account for
Miller: Where’s the Innovation? 2
selection effects and adjudicator bias, I control for many characteristics of the parties and adjudication
and utilize a selection corrected probit model. I thus obtain unconditional estimates of the likelihood a
patent with a given characteristic will be found to lack innovation value.
My results suggest the idea that the patent system’s efficiency is harmed by the existence of too
many non-innovative patents is quite plausible. I estimate 28 percent of patents would be found at least
partially invalid if subject to an anticipation or obviousness decision. Patents covering software and
business methods, the subject to frequent criticism, have unconditional invalidity rates of 39 and 56
percent. The rate for licensing firm owned patents is 61 percent. In contrast, energy, medical and
semiconductor patents have lower than average and biotechnology patents average invalidity rates.
Other results inform our understanding of open patent law and economics issues. Regarding
patent value, I find patents with more claims or citations are not significantly more or less likely to be
invalidated on innovation based grounds. Concerning the rationality of litigious patent owners and in
contrast to Allison, Lemley, and Walker (2011), I find patents asserted in more cases are less likely to be
invalidated. Concerning bias, I find several District Courts have significantly different invalidity rates
and that the Federal Circuit is more likely than trial courts to find innovation-based invalidity.
In Part 2 of this paper I explain anticipation and obviousness, their connection to innovation
value, and why the PTO may regularly grant patents lacking innovation value. Part 3 describes my
analysis, Part 4 reports my results and Part 5 explains them.
2. INNOVATION-BASED PATENT INVALIDITY
I begin by briefly describing the U.S. system of obtaining and enforcing patents, the courts’ role
in enforcing requirements for patentability and the law of anticipation and obviousness.
2.1. The Patent Office, the Courts, and Invalidity Defenses
In the United States, inventors apply for patents from the PTO. The heart of a patent application
is one or more “claims” that specifically define what ideas the patent will protect. The basic requirements
for the ideas expressed in the claims to be legally patentable are that they cover patentable subject matter,

Miller: Where’s the Innovation? 3
are new and useful, and non-obvious. (35 USC §§ 101, 103) If the inventor demonstrates to the PTO that
all requirements are met, the PTO grants the patent.
Once obtained, the patent provides its owner the right to exclude others from making, using,
offering to sell, or selling the invention described in the claims. (35 USC § 271) Parties violating the
owner’s exclusive rights are liable for infringement, and may be sued for damages and injunctive relief.
(35 USC § 271) While there is a legal presumption that PTO-granted patents are valid, meaning they
meet all patentability requirements, invalidity is a defense to patent infringement and an alleged infringer
may overcome the presumption and demonstrate the patent is invalid with “clear and convincing
evidence.” (Microsoft Corporation v. i4i Limited Partnership, et. al., 131 S. Ct. 2238 (2011))
Patent litigation in the United States is exclusively federal and all lawsuits must be filed in a
federal district court. Since 1982, the Federal Circuit Court of Appeals (CAFC) has had exclusive
jurisdiction over appeals of patent cases.
2.2. Anticipation and Obviousness
Anticipation and obviousness are invalidity defenses directly related to two of the basic
patentability requirements. Alleged infringers attack the novelty of a patent by alleging anticipation and
its non-obviousness by alleging obviousness. Validity is determined on a claim-by-claim basis so that all,
part, or none of a patent may be found invalid in patent litigation. Whether a claim is anticipated or
obvious is mainly determined by comparing the ideas contained in the claim to the “prior art”. Prior art
includes all public knowledge at the time of invention related to an invention.
CAFC precedent makes clear the legal distinction between anticipation and obviousness.
“Anticipation requires the presence in a single prior art disclosure of all elements of a claimed invention
arranged as in the claim.” (Connell v. Sears, Roebuck & Co., 722 F.2d 1542, 1548 (Fed. Cir. 1983))
Obviousness, in contrast, may be based on multiple prior art references:
Determining obviousness requires considering whether two or more pieces of prior art
could be combined, or a single piece of prior art could be modified, to produce the claimed
invention. This analysis typically invokes the familiar teaching-suggestion-motivation
(“TSM”) test, asking whether a person having ordinary skill in the art would have found
some teaching, suggestion, or motivation to combine or modify the prior art references.

Miller: Where’s the Innovation? 4
(Comaper v. Best Buy, 596 F.3d 1343, 1352 (Fed. Cir. 2010)) The legal connection between anticipation
and obviousness is apparent—the ideas described in anticipated claims where already contained in a
single earlier work, while obvious claims were partially described in earlier works and it was “obvious” to
combine or modify them to obtain the full content of the claim.
2.3. Anticipation, Obviousness, and Innovation Value
Jaffe and Lerner (2004) explain the clear connection between innovation value as the main
justification for patent protection and the invalidity defenses of anticipation and obviousness.1 They
argue the U.S. patent system is “broken” in large part because institutional and legal changes have
resulted in the PTO granting too many patents with negligible innovation value.
They begin by explaining the fundamental economic justification for patent protection:
If there were no incentives for those who discover and develop new technology, it is
likely that fewer innovations would be developed, slowing progress and the benefits it
brings. Potential inventors realize that without adequate protection rivals will rapidly
copy their discoveries, and that therefore innovation is at best an uncertain route to future
profits. As a result, companies would be unlikely to spend significant amounts of money
on Research and Development that is the source of new products and processes in a
modern economy.
(Jaffe and Lerner 2004) Thus, patent protection benefits society when it increases innovation. Jaffe and
Lerner (2004) continue by explaining that for the system to be effective in furthering this goal:
[T]he party who is the first to invent a given product or process is the party that is
awarded a patent. This analytical construct is embodied in patent law within the idea that
a patent cannot be granted unless the patent application is for an invention that is both
‘novel’ and ‘non-obvious’.
(Jaffe and Lerner 2004) Anticipated and obvious patents are thus invalid because the party who obtained
the patent was not the inventor of the ideas the patents contain.2
1 Note, however, there are other possible economic justifications for patent protection. For example, some argue the
patent system also lowers transaction costs and facilitates trade (see, for example, Kieff 2001). 2 That patent laws exist to ensure the economic justification for patent protection is not surprising given the
Constitution’s explicit reason to grant patent rights—“[T]o promote the progress of . . . the useful Arts.” U.S.
Const., art. 1, § 8, cl. 8. The Supreme Court confirmed this justification in Graham v. John Deere Co., 383 U.S. 1, 9
(1966), stating: “The patent monopoly was not designed to secure to the inventor his natural right in his discoveries.
Rather, it was a reward, an inducement, to bring forth new knowledge.” Further, in Mazer v. Stein, 347 U.S. 201,
219 (1954), the Court explained: “The economic philosophy behind the clause empowering Congress to grant

Miller: Where’s the Innovation? 5
Innovation is knowledge production but anticipated or obvious patents contain no new
knowledge. Thus, such patents lack innovation value. Accordingly, the existence of these invalidity
defenses ensures the enjoyment of the exclusive rights that patents protect is connected to the rationale for
that protection—to incent innovation. Unfortunately, before a court can determine that a patent lacks
innovation it and alleged infringers must expend significant resources in litigation.3 Thus, as measured
after adjudication, the existence of these patents is a net social loss.
2.4. How Rare Are Patents that Lack Innovation Value?
If the PTO is empowered to screen applications that lack the legal requirements, we may wonder
how frequently patents are granted on old or obvious ideas. According to many observers the answer is
often.4 Jaffe and Lerner (2004) argue the PTO has granted many patents of dubious innovation value for
several reasons. First, the number of applications tripled between 1983 and 2002, swamping the PTO’s
examination resources. Second, after the early 1990s, the PTO was no longer tax-payer-funded but
instead operated on the basis of increased patent application fees. This change created incentives for the
PTO to quickly process applications and to be perceived as applicant friendly. (Jaffe and Lerner 2004)
The third reason Jaffe and Lerner (2004) offer pertains to technologies only recently patented on
a large scale—namely software, business methods and biotechnology.5 Jaffe and Lerner (2004) argue that
patents and copyrights is the conviction that encouragement of individual effort by personal gain is the best way to
advance public welfare.” 3 Bessen and Meurer (2008, p. 169) calculate the average cost, in legal fees alone, for a patent case to be litigated
through summary judgment as $500,000 and the cost through trial as $4,000,000. 4 Mandel (2006), citing: Fed. Trade Comm’n (2003), ch. 4, at 8-19 (criticizing a low standard for application of the
non-obvious requirement and citing the testimony of many patent and economic scholars for the same); National
Research Council (2004), at 87-95 (criticizing lenient non-obvious standards, particularly for business method and
biotechnology patents); Shapiro (2004), at 1018 (noting that complaints regarding the PTO “typically allege that the
[PTO] issues many questionable patents” including those that were “obvious at the time the patent application was
filed”); Barton (2003), at 477-78 (arguing that the non-obvious standard applied by the PTO and courts today is not
as strict as that articulated by the Supreme Court in Graham); Parker (2002), at 305-07 (arguing that the PTO has
recently granted a number of obvious patents)); Thomas (2001) (discussing problems at the PTO in conducting non-
obvious analyses); Merges (1999), at 598 (noting that “[t]he easiest way to raise standards [at the PTO],
conceptually, is to tighten the nonobviousness requirement”); and Lemley and O’Brien (1997) at 301 (criticizing
PTO leniency in issuing obvious patents in software. 5 Already recognized as patentable to an extent, CAFC opinions during the 1990s broadened patentable subject
matter in these areas. See In re Alappat, 33 F.3d 1526 (Fed. Cir. 1994) (software); In re Deuel, 51 F.3d 1552 (Fed.
Cir. 1995) (biotechnology); and State St. Bank & Trust Co. v. Signature Fin. Group, 149 F.3d 1368 (Fed. Cir. 1998)
(business methods).

Miller: Where’s the Innovation? 6
when patenting of these subjects increased in the 1990s the PTO lacked examiners knowledgeable in
these fields to thoroughly review the prior art. Perhaps more critical, examiners may have frequently
missed the relevant prior art because of their overreliance on older patents in their prior art searches.
Since these technologies were rarely patented before, the existing art was described in other sources,
including professional journals and pre-existing product descriptions. (Jaffe and Lerner, 2004) Thus,
there are plausible reasons to believe that during the last two decades the PTO has frequently granted
patents on old or obvious ideas.
Existing data on anticipation and obviousness litigation decisions supports this conclusion.
Allison and Lemley (1998) analyzed 299 validity decisions in 239 cases reported in the U.S.P.Q. from
early 1989 to 1996. Of 191 invalidity determinations, 95 (or 50 percent) where based on anticipation or
obviousness.6 Thus, when alleged infringers challenge validity, they are most likely to do so on
innovation-based grounds. Furthermore, alleged infringers frequently win. Allison and Lemley (1998)
report 41 percent of anticipation and 33 percent of obviousness decisions found invalidity. This suggests
it is not rare for courts to conclude the PTO mistakenly granted patents on old or obvious ideas.
Evidence that certain types of patents are more likely to be old or obvious is scant. Allison,
Lemley, and Walker (2011) analyzed the litigation success of 106 “most-litigated” patents asserted in
eight or more lawsuits between 2000 and 2008. They compared their success to a matched sample of
patents litigated once. They found that patents in both their “most litigated” or “once litigated” samples
were more likely to be invalidated if they were non-practicing entity (NPE) owned or covered software—
precisely one of the technologies Jaffe and Lerner (2004) argue the PTO has had difficulty examining.
Allison, Lemley, and Walker (2011) found 60 of the 86 patents that lost in court were invalidated.
While obviousness was not one of the three most common bases for the invalidation, anticipation was
second. They did not report the basis on which each of the 60 patents was invalidated, but we can deduce
a large percentage of the invalidated patents in their sample were invalidated on innovation based
6 Individually, 58 of 191 (42.0 percent) of invalidity determinations were based on obviousness and 37 (26.8
percent) on anticipation. The other common grounds were § 102-non-prior-art (31.2 percent), enablement or written
description (15.2 percent), and best mode (11.6 percent). Many invalidity determinations were on multiple grounds.

Miller: Where’s the Innovation? 7
grounds, were owned by NPEs, covered software and were asserted in many different lawsuits. Thus, the
empirical evidence that exists suggests innovation-based invalidity is frequently litigated and found by
courts despite the fact the PTO is tasked with rejecting applications on old or obvious ideas.
3. STUDY DESIGN
Having explained how anticipation and obviousness support the goal of patent protection and
why these defenses may be increasingly necessary in a system where the PTO frequently grants patents
on old or obvious ideas, I now describe my data and analytical method.
3.1. Data
Many factors may influence whether a patent is invalidated for anticipation or obviousness.
Referencing Marco’s (2004) analysis of patent litigation outcomes, I model the validity decision as a
function of the characteristics of the asserted patents, the parties, and adjudication.
I used two main data sources to create my sample of final innovation–based invalidity decisions.
The first was the Stanford IP Litigation Clearinghouse (IPLC), which details every patent lawsuit filed in
the U.S. from 2000 to the present.7 In the IPLC I identified 980 patents that faced a final decision on
anticipation and/or obviousness in 579 lawsuits filed between 2000 and 2010.8 My unit of analysis is a
patent-case pairing, such that my sample includes multiple data points where innovation-based invalidity
was decided for multiple patents in a single lawsuit.
By final decision, I mean that the adjudications in my sample were either decided by CAFC on
appeal, were immediately appealable, or were grants of summary judgment that a patent was not invalid
for anticipation or obviousness after which the case terminated without appeal. Thus, my data set
includes invalidity determinations by the CAFC, by the trial court on JNOV, bench trial or grant of
summary judgment, and by jury trial. It does not include denials of summary judgment, which merely
hold disputed facts remain to be tried to determine whether or not a patent is invalid. (F.R.C.P. Rule 56)
7 For each patent lawsuit filed, the IPLC database includes a separate webpage with summary data and a list of all
docket entries. Keyword searches may be run of all of these web pages and the content of their docket entries. 8 To identify lawsuits with anticipation or obviousness decisions I searched the IPLC for keywords, including:
“anticipate”, “anticipation”, “obvious”, and “obviousness”.

Miller: Where’s the Innovation? 8
For each patent-case pairing, I gathered adjudication and party information from the IPLC and
internet searches of the litigants. To identify the characteristics of the patents in my sample, I utilized the
2006 NBER U.S. Patent Citations data file (NBER data file) as my second primary source of data. The
NBER data file contains detailed information on over three million U.S. patents granted through 2006.9
3.2. Analytical Method in Light of Adjudicator Bias and Selection Effects
I aim to infer the types of patents more or less likely to lack innovation value. A simple probit
regression model would appear appropriate, but two key biases cast doubt on this strategy. The first,
adjudicator bias, appears easy to control for by considering whether a judge, jury or appeals court makes
the decision and in which district court. It seems unlikely all would err in the same direction but Mandel
(2006) reports compelling evidence from experiments on mock jurors that the non-obviousness
requirement is uniformly applied too stringently due to “hindsight bias.”10
Most scholars, however,
believe the courts are biased towards validating obvious patents.11
I adopt this view cautiously, and
account for adjudicator bias with comprehensive adjudication controls.
Controlling for selection effects, the second bias, is not as simple. Selection effects refer to the
process of parties choosing disputes for trial as opposed to settlement. Priest and Klein (1984) created the
first formal model of this process which predicts both the rate at which disputes will be tried and the
plaintiff’s win rate at trial. (Siegelman and Waldfogel 1999) In the basic model these rates depend on
the: 1) Decision standard; 2) Amount of uncertainty; and 3) Degree of stake asymmetry. (Siegelman and
Waldfogel 1999) Later models predict other factors influence the plaintiff win rate, including asymmetric
information, rent seeking, entry deterrence, or differences in risk aversion. (Cooter and Rubinfeld 1989)
These factors influence plaintiff win rates and confound inferences about the population of
potential disputes (in my case all patents) from the set of disputes selected for adjudication (in my case
9 As a check, I compared the characteristics from that file to electronic PTO patent records.
10 According to Mandel (2006), determining obviousness at the time the invention was made requires the fact-finder
to “step backward in time to a moment when the invention was unknown.” Adjudicators are biased towards finding
obviousness in this determination because of the tendency to apply what has been learned subsequently, to what was
known at the time. (Mandel 2006) Mandel (2006) admits, however, that despite the hindsight bias too many
obvious patents may be upheld by courts because of factors including the presumption of validity. 11
See footnote 4 and accompanying text.

Miller: Where’s the Innovation? 9
innovation-based validity decisions). For example, without accounting for selection bias, I cannot infer
that all amateur inventor patents are more likely to lack innovation value from a result that litigated
inventor patents are more likely to be invalidated. Perhaps amateur inventors have lower stakes than
other owners and thus lose more frequently by litigating weaker patents through final decision.
3.3. Probit Model with Selection Effects
In my multivariate analysis, I attempt to control for selection effects by utilizing an econometric
model based on Heckman’s two-step method (1979). Within Heckman selection models, there are two
equations: 1) The outcome equation; and 2) The selection equation. Selection bias exists when the error
term in the outcome equation is correlated with the error term in the selection equation. Thus, Heckman’s
(1979) insight was showing selection bias is essentially omitted variable bias.
The probit model with selection effects I use may be considered a system of equations for two
unobserved responses, Ii* and Si*. The observed responses, selection for an innovation-based invalidity
decision (“Si”) and invalidity (“Ii”) are generated according to Ii = 1 if Ii* > 0 (Ii = 0 otherwise) and Si = 1
if Si* > 0 (Si = 0 otherwise), where:
(1) Ii* = x’iβ + λεi + ui
(2) Si* = x’iγ + εi + vi
I obtain maximum likelihood estimates for this system of equations using Stata’s “heckprob”.
Whether selection effects exist can be determined from the random effects. ui and vi are random
effects separate to each equation and εi is the shared random effect. If there are selection effects, λ and
thus the correlation between the residuals of the two equations, ρ, is nonzero.
β and γ are observed variables that explain Ii and Si respectively. β includes the patent, party and
adjudication characteristics I describe in the next section. As Marco (2004) explains, patent and patent
owner characteristics that influence validity decisions also theoretically influence selection for such
decisions. I include these traits in γ. However, adjudication and alleged infringer traits are unobserved
for patents not selected for adjudication and thus excluded from the selection equation.

Miller: Where’s the Innovation? 10
To use this model, I need a set of patents not selected for an innovation-based invalidity
determination.12
Following Marco (2004) I create a matched sample that includes two patents for each of
the 980 adjudicated patents. The population of possible matches for each adjudicated patent is all granted
utility patents with the same initial application date. I generate a simple probability weight to account for
the matched patents being only a small set of the entire population.13
Now that I have described my
model, I detail the patent, party and adjudication characteristics I analyze and report my results.
4. RESULTS
In Section 4.1, I report my sample’s overall invalidity rate and explain the patent, party and
adjudication traits that may influence these invalidity decisions. I report descriptive statistics and
bivariate validity rate comparisons for each trait. I report my multivariate results in Section 4.2.
4.1. Descriptive Statistics and Bivariate Comparisons
Innovation-Based Invalidity Rates
For each final decision I located, I determined whether the patent was found invalid in whole or
in part on the basis of anticipation and/or obviousness. Again, patent validity is determined on a claim-
by-claim basis. Thus, I designate as “Part” invalid patents with some but not all claims asserted by the
owner invalidated by the court. I define patents as “All” invalid if the adjudicator invalidated all asserted
claims and “Not” invalid if no claim was invalidated. As seen in Table 1, partial invalidation is least
common. Thus asserted claims usually stand or fall together.14
The validity rates for anticipation and obviousness decisions are very similar—73 versus 68
percent. Demonstrating the tie between these two invalidity defenses, nearly two thirds (647 of 980) of
the patents in my sample faced decisions on both anticipation and obviousness.15
12
To avoid identification problems, the model also requires that the selection equation includes an exclusion
restriction. (Marco 2004) Before presenting my results in Part 4.2, I explain my choice for this key variable. 13
Because there are two matched patents for each adjudicated patent, I weigh each matched patent by one half the
total number of granted patents applied for during the same day as each adjudicated patent. 14
This is consistent with Allison and Lemley (1998), who found courts made separate claim-by-claim invalidity
determinations for only 7 of 299 (2.34 percent) litigated patents in their sample. 15
Anticipation alone was decided for 138 patents and obviousness alone for 195 patents.

Miller: Where’s the Innovation? 11
Because of the similar interpretation I give them—a legal determination that the patent at issue
lack innovation value—I combine anticipation and obviousness decisions for the remainder of my
analysis and refer to them as innovation-based validity decisions (“A or O” in all tables).16
I find that 37
percent of patents subject to an innovation-based validity decision were at least partially invalidated.
Table 1
VALIDITY RATES FOR INNOVATION-BASED DECISIONS
All Invalid Part Invalid Not Invalid Total
Anticipation:
# of Patents 164 49 572 785
% of Total (20.9) (6.2) (72.9)
Obviousness:
# of Patents 226 43 573 842
% of Total (26.8) (5.1) (68.1)
All A or O Part A or O Not A or O Total
Combined:
# of Patents 296 69 615 980
% of Total (30.2) (7.0) (62.8)
Patent Characteristics
Industry and Technology. I assigned each patent to one or more of the industry and technology
categories developed by Allison, Lemley, and Walker (2009) in response to limitations in the PTO
classification system.17
The first three columns of Table 2 report the number (and percentage) of
adjudicated patents in my sample in each industry found “All”, “Part” or “Not” anticipated or obvious.
The fourth column reports the total number of patents in my sample I assigned to that industry.
16
I stress that outside the separate anticipation and obviousness statistics I report at the top of Table 1, my analysis
includes only a single data point for each patent-case pair. Thus, the 23 patents I identify as found obvious but not
anticipated in a single lawsuit and the two found anticipated but not obvious are included only once in my sample. I
code all of these as being found “A or O” invalid since they were in fact invalidated on one of these two bases. 17
These industry and technology categories are precisely defined starting on page 6 of Allison, Lemley, and Walker
(2009). To ensure accuracy, I reviewed the invention description contained in the PTO’s electronic copy of each
patent and compared it to Allison, Lemley, and Walker’s (2009) category definitions. I further compared the
classifications I assigned to the Hall, Jaffe and Tratjenberg (2001) (HJT) PTO-based classification it was assigned in
the NBER data file. I found that Allison, Lemley, and Walker (2009) and HJT’s classifications are overwhelmingly
consistent. HJT (2001) developed a technology classification system based on the 400+ 3-digit main PTO classes.
HJT’s system includes six technology classes (Chemical, Computer & Communication, Medical & Drug, Electrical,
Mechanical and Other) and 37 subclasses. With 13 identified industry categories and 9 technology categories,
Allison, Lemley, and Walker’s (2009) methodology allowed me to analyze more types of patents than if I had used
HJT’s 6 classes, while ensuring there are sufficient data points for each type for econometric analysis.

Miller: Where’s the Innovation? 12
Table 2
INNOVATION-BASED VALIDITY DECISIONS & RATES BY PATENT INDUSTRY
All A or O Part A or O Not A or O Total
*Computer 74 25 102 201
(37%) (12%) (51%)
Semiconductor 4 5 26 35
(11%) (14%) (74%)
Electronics 30 11 70 111
(27%) (10%) (63%)
*Medical 28 8 93 129
(22%) (6%) (72%)
Pharmaceuticals 30 1 72 103
(29%) (1%) (70%)
Biotechnology 10 1 23 34
(29%) (3%) (68%)
Chemical 14 0 26 40
(35%) (0%) (65%)
Communications 39 16 78 133
(29%) (12%) (59%)
Transportation 17 9 40 66
(26%) (14%) (61%)
*Energy & Utility Service 4 1 27 32
(13%) (3%) (84%)
Financial 5 1 11 17
(29%) (6%) (65%)
Consumer Goods & Service 69 15 136 220
(31%) (7%) (62%)
Construction 10 3 24 37
(27%) (8%) (65%)
Other 16 1 38 55
(29%) (2%) (69%)
In bivariate comparison18
, I find that Computer patents were more likely to be invalidated on
innovation-based grounds while Semiconductor, Medical, Pharmaceutical, Biotechnology and Energy
Services patents were less likely. These differences are consistent with conventional opinion of which
industries contain more or less non-innovative patents. However, only the differences for the Computer,
Medical, and Energy Service industry are significant.
18
In Table 2 and subsequent descriptive statistics tables, I identify significantly different validity rates for a given
characteristic with an asterisk (“*”). For categorical variables, I tested the null that there is no difference in the
validity rate between patents with and without that characteristic using both Chi-square and Fisher’s exact tests. For
other variables, I use independent samples t-tests. In each case, significance represents a p value < 0.05.
Miller: Where’s the Innovation? 13
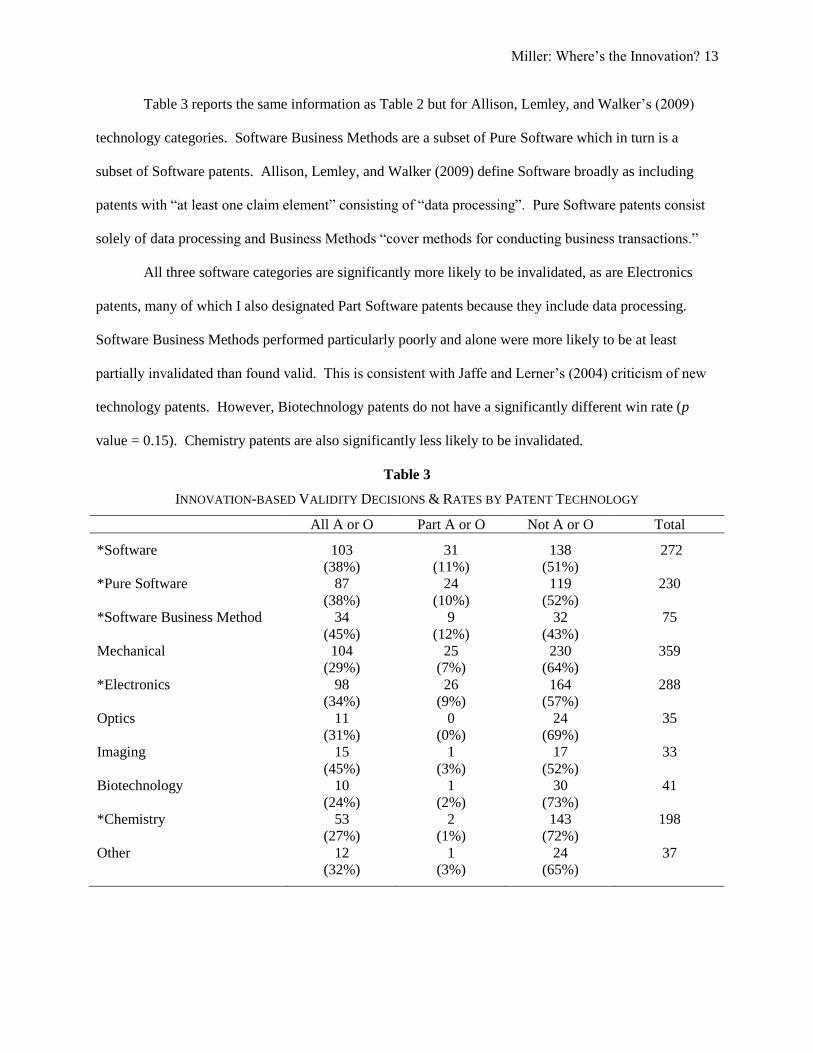
Table 3 reports the same information as Table 2 but for Allison, Lemley, and Walker’s (2009)
technology categories. Software Business Methods are a subset of Pure Software which in turn is a
subset of Software patents. Allison, Lemley, and Walker (2009) define Software broadly as including
patents with “at least one claim element” consisting of “data processing”. Pure Software patents consist
solely of data processing and Business Methods “cover methods for conducting business transactions.”
All three software categories are significantly more likely to be invalidated, as are Electronics
patents, many of which I also designated Part Software patents because they include data processing.
Software Business Methods performed particularly poorly and alone were more likely to be at least
partially invalidated than found valid. This is consistent with Jaffe and Lerner’s (2004) criticism of new
technology patents. However, Biotechnology patents do not have a significantly different win rate (p
value = 0.15). Chemistry patents are also significantly less likely to be invalidated.
Table 3
INNOVATION-BASED VALIDITY DECISIONS & RATES BY PATENT TECHNOLOGY
All A or O Part A or O Not A or O Total
*Software 103 31 138 272
(38%) (11%) (51%)
*Pure Software 87 24 119 230
(38%) (10%) (52%)
*Software Business Method 34 9 32 75
(45%) (12%) (43%)
Mechanical 104 25 230 359
(29%) (7%) (64%)
*Electronics 98 26 164 288
(34%) (9%) (57%)
Optics 11 0 24 35
(31%) (0%) (69%)
Imaging 15 1 17 33
(45%) (3%) (52%)
Biotechnology 10 1 30 41
(24%) (2%) (73%)
*Chemistry 53 2 143 198
(27%) (1%) (72%)
Other 12 1 24 37
(32%) (3%) (65%)

Miller: Where’s the Innovation? 14
Other Patent Characteristics
Prior research has used patent characteristics other than industry and technology to proxy patent
value. From the NBER data file I obtained measures for two of these as well as each patent’s grant year
and the number of days between each patent’s initial filing date and grant date. Summary statistics for
these patent traits are reported in Appendix Table A1.
Application Duration. Patents applications pending before the PTO for a longer period may
have been subject to higher scrutiny with respect to their novelty and non-obviousness such that we
would expect them to better survive an invalidity challenge. Conversely, longer duration may signal the
application’s subject matter was less clear and thus more likely to be invalidated. (Marco 2004) To test
these possibilities, I measure the number of days between each patent’s initial application date and grant
date. I find that patents judged not invalid were on average prosecuted 36 days less than those found at
least partially invalid. However, this difference is insignificant (p value = 0.33).
Grant Year. Older patents may better survive innovation-based invalidity challenges as there
was more time for alleged infringers to litigate their validity and because there is less prior art on which to
invalidate them. Patents judged valid were on average granted a year before those at least partially
invalidated. This difference is statistically significant (p value = 0.00).
Number of Claims. We may expect that patents with more claims are more valuable for two
reasons. First, more claims suggests greater applicant investment since the PTO charges in part by the
number of claims. (Allison, Lemley, and Moore 2004) Second, claims specify the ideas to be protected
and more claims may mean more ideas. (Landjouw and Schankerman 2001) Surprisingly, however, I
find patents judged valid have significantly fewer claims than those judged invalid (p value = 0.03).
Number of Citations. The second value proxy I analyze is the number of other patents that cite
a patent as relevant prior art. (Allison, Lemley, and Walker 2009) I utilize the average number of
citations per claim per year. Inventors may cite a patent because it important to their field. (Shrestha
2001) Thus, patents with more citations may have more innovation value. However, the difference in
citations between valid patents and those at least partially invalidated is insignificant (p value = 0.36).
Miller: Where’s the Innovation? 15
Party Characteristics
Now that I have introduced patent characteristics that may predict differences in win rates in
innovation-based invalidity decisions, I turn to characteristics of the litigants themselves. I begin with the
type of patent owner, the party characteristic most relevant to current arguments that certain types of
patents are more likely to have negligible value as innovation.
Type of Patent Owner. Given the widespread criticism of the value of the patents enforced by
so called patent “trolls” which variously include patent licensing firms alone or all non-practicing entities
(NPEs), the types of patent owners asserting the adjudicated patents in my sample is potentially very
important. NPEs as defined by Allison, Lemley, and Walker (2011) include licensing firms, individual
inventors, and not-for profit research entities. I expect these to have different ownership motivations,
enforcement behavior and types of patents. Accordingly, I categorize patent owners in my sample as
product firms, individual inventors, licensing firms and others.
I categorized owners by first obtaining their names from the IPLC and then obtaining their
description from internet searches. Product companies are those identified as offering any product or
service for sale that embodies their patented ideas. I separated product firms into large and small, with
large firms being publicly traded or included on Forbes’ list of the Largest Private Companies.19
The owners I name individual inventors were named parties to the lawsuits in my sample or
litigated in the name of a shell LLC that solely enforces that inventor’s patents. In both cases, I verified
the individual was the patent’s inventor from PTO records or court pleadings.
Patent licensing firms were either self identified as such in court pleadings, firm websites or in
media coverage of their litigation. I sought to narrowly include in this category only firms in the business
of generating revenue from the patents they own. I designated close cases as either product companies or
inventors. Finally, a few patent owners in my sample were government, university or other not-for-profit
research organizations. I designated these owners as “Other”.
19
Forbes’ list for 2011 is available at http://www.forbes.com/lists/2011/21/private-companies-11_rank.html.

Miller: Where’s the Innovation? 16
Table 4 reports that three owner types possess significantly different invalidity rates. Licensing
firm and inventor patents were less likely to be judged valid (48.3 and 52.6 percent respectively). Thus,
licensing firm patents join business methods as a rare species more likely to be at least partially
invalidated. Finally, small product firm patents had a higher validity rate than other patents.
Table 4
OWNER TYPE SUBJECT TO INNOVATION-BASED INVALIDITY DECISIONS
All A or O Part A or O Not A or O Total
*Inventor 42 3 50 95
(44.2%) (3.2%) (52.6%)
*Licensing Firm 56 20 71 147
(38.1%) (13.6%) (48.3%)
Large Product 131 26 295 452
(29.0%) (5.7%) (65.3%)
*Small Product 60 15 183 258
(23.3%) (5.8%) (70.9%)
Other 7 5 16 28
(25.0%) (17.9%) (57.1%)
Other Party/Suit Characteristics
Now that I have discussed the owner type, I turn to other characteristics of the parties that may
impact the likelihood a patent is invalidated on innovation-based grounds. Invalidity rates for the first
three characteristics, which are indicators, are listed in Appendix Table A2. Summary statistics for each
of the second three numerical variables are listed in Appendix Table A3.
Foreign Party. Whether a patent owner or an alleged infringer is a foreign or U.S. entity may
predict success in innovation-based invalidity decisions as it may be more expensive for foreign entities
to litigate in the United States. I thus determined whether patent owners and alleged infringers were
foreign or domestic entities. I find foreign owned patents were not significantly more or less likely to be
invalidated (p value = 0.43). In contrast, foreign alleged infringers were significantly less successful in
proving invalidity (28.5 versus 38.9% with a p value = 0.02).
Large Alleged Infringer. The financial resources of alleged infringers should predict their
success in proving invalidity. All alleged infringers in my sample are product firms, which makes sense
given infringement requires making, using or selling embodiments of the patented technology. As with
Miller: Where’s the Innovation? 17
product firm owners, I determined whether alleged infringers in my sample are large or small.20
With
more resources, I expect large firms may mount more effective invalidity challenges. Consistent with my
expectations, patents asserted against large alleged infringers are significantly more likely to be at least
partially invalidated (40.6% versus 29.9% with a p value = 0.00).
Referencing Table A2, it is also interesting that nearly 70 percent of patents in my sample were
asserted against large firms. This may represent a combination of large firms being more likely to defend
through adjudication and patent owners targeting large firms with deeper pockets.
Number of Patents Asserted. I collected the number of patents asserted in each case by the
“primary” patent owner. By “primary” I mean the instigator of infringement allegations and do not
include patents asserted in infringement counter-claims against that “primary” owner. Owners asserting
more patents at once may possess strong patent portfolios less likely to be invalidated. (Allison, Lemley,
and Moore 2004) However, I find patents invalidated on innovation-based grounds are asserted in cases
where their owners are asserting significantly more total patents (p value = 0.03).
Number of Cases Patent Asserted. I next determine the total number of filed lawsuits in which
each of the patents in my sample was asserted. The relationship between this and the likelihood a patent
is invalid is interesting in light of Allison, Lemley, and Walker’s (2011) rejection of the idea patent
owners who file multiple lawsuits “might do so because they have a stronger than average patent and
therefore face less risk of invalidity.” Allison, Lemley, and Walker (2011) report that owners of the
“most-litigated” patents lost adjudicated lawsuits much more frequently than once-litigated patent owners.
Allison, Lemley, and Walker (2011) results suggest the possibility that repeat patent plaintiffs are
irrational in not suing all alleged infringers in one action so as to avoid re-litigating validity issues.
Measured as a simple count of total lawsuits filed, I find that the patents that survived innovation-
based invalidity challenges were asserted in significantly more cases than those found invalid (p value =
0.02). This is at odds with Allison, Lemley, and Walker’s (2011) results and suggests owners do not
20
Where there are multiple alleged infringers in a lawsuit, I designate the alleged infringer as large if one or more of
the alleged infringers is large.
Miller: Where’s the Innovation? 18
irrationally litigate patents with dubious validity in multiple suits. I leave detailed investigation of this
discrepancy to my next article. For now, I note that when I compare the validity rates of the most
litigated patents in my sample, as defined by Allison, Lemley, and Walker (2011), to those litigated once,
I find the most-litigated are less likely to be invalidated (24.0% versus 41.5%, p value = 0.02). Allison,
Lemley, and Walker’s (2011) findings do not appear to apply to innovation-based invalidity.
Number of Alleged Infringers. Finally, I consider the number of alleged infringers in the
lawsuit. There may be a positive relationship between this number and the invalidation rate if the
infringers join their resources in a common defense. (Allison, Lemley, and Walker 2011) However, there
may be a negative relationship if owners assert stronger patents against many alleged infringers. I find
support for the second theory in that patents judged valid were asserted against more alleged infringers.
However, this difference is not significant (p value = 0.34).
Adjudication Characteristics
I now discuss adjudication characteristics that may influence innovation-based invalidity
decisions. The number of patents found invalid, by trait, is listed in Appendix Table A4.
Date of Adjudication. Courts may have become more likely to invalidate patents on the basis of
obviousness after the U.S. Supreme Court’s decision in KSR Int’l Co. v. Teleflex, Inc. (550 U.S. 398
[2007]). In KSR, the Court empowered lower courts to consider more types of evidence of obviousness
than previously available in rigidly applying the TSM test.21
Analyzing annual invalidity rates, I found evidence courts may be utilizing this extra discretion.
The innovation-based validity rate in cases in my sample decided before 2007 was 67 percent. This
dropped to 52 percent in 2007. Thereafter, the rate increased to 63 percent. To test whether KSR had a
significant effect, I generated a variable indicating whether the invalidity decision was made after KSR
was decided on April 30, 2007. I find the validity rate did in fact decrease from 66.1 to 60.7 percent.
However, this result barely misses statistical significance (p value = 0.08).
21
See Simic (2009) for a detailed description of the KSR decision.

Miller: Where’s the Innovation? 19
Declaratory Judgment. I determined whether patents were litigated in infringement actions
brought by the owner or in declaratory actions. Common sense suggests alleged infringers are more
likely to initiate a declaratory action against patents with dubious validity. But Moore (2000) provides an
alternative explanation—that juries are pro-plaintiff.22
Regardless of the reason, I find patents are more
likely to be at least partially invalidated in declaratory actions (47% versus 36% with p value = 0.03).
Level of Adjudication. I next determine whether final judgment was on summary judgment,
trial (or JNOV) or appeal. The validity rate is not significantly different for summary judgment (p value
= 0.32). However, trial decisions are more likely (73.3% with p value = 0.00) and decisions on appeal
less likely (54.3% with p value = 0.00) to find validity.23
The lower rate for CAFC decisions is in
contrast to prior work suggesting CAFC is biased in favor of patent owners. (Thomas 2001; Barton 2003)
District Court. Forum shopping research finds factors including speed of adjudication, trial
rate and patent owner win rate vary significantly by district court. (Lemley 2010; Moore 2005) I extend
this work by determining whether innovation-based validity also varies by district court. My sample
includes cases from 68 district courts, with most missing districts covering rural areas. Appendix Table
A5 includes the 21 districts with 15 or more innovation-based validity decisions in my sample. The first
12 districts listed include the 10 districts with the most filed patent lawsuits according to the IPLC.24
These facts suggest my sample is geographically representative.
One may expect owners to gravitate towards patent-friendly districts, particularly because they
have discretion in selecting the district in which to file suit. The significantly higher 76 percent validity
rate for the Eastern District of Texas (“TXED”), known as particularly owner-friendly, supports this idea.
However, several of the most patent-litigation intensive districts in my sample have significantly lower
22
Moore (2000) finds patent owners win 65% of infringement suits but only 42% of declaratory actions decided by
juries. She found the patent owner win rate nearly identical and close to 50% when the judge adjudicated.
However, juries decide innovation-based validity much more frequently than judges. 23
The lower trial invalidity rate is driven by the prevalence of juries. Of the 648 invalidity decisions either finally
adjudicated at trial or adjudicated there before a later appellate decision, 70% were decided by juries. And in my
sample, juries validated patents significantly more often than judges (76.9% versus 63.9% with p value = 0.01). 24
While the Middle District of Florida (“FLMD”) and the Western District of Wisconsin (“WIWD”) are not in the
IPLC top 10, they are also active districts for patent litigation.

Miller: Where’s the Innovation? 20
validity rates. These include the Northern District of California (“CAND”), the Northern District of
Illinois (“ILND”), the Eastern District of Michigan (“MIED”) and the District of Nevada (“NV”).
Before offering owners of patents with questionable innovation value advice on where to file suit,
however, I must determine if these differences persist after accounting for differences in other relevant
patent, party and adjudication characteristics. I thus now report my multivariate results.
4.2. Multivariate Analysis
But before reporting the significant predictors of innovation-based invalidity from the selection
corrected probit model described in section 3.3, I address a lingering econometric issue with this model.
Because the explanatory variables I use for my selection equation are a subset of those in the invalidity
equation, there may be an identification problem. (Marco 2004) I can resolve this issue with at least one
variable in the selection equation that does not influence the win rate. However, it is difficult to
theoretically eliminate any of my patent characteristics from the invalidity equation.
The best candidate for an exclusion restriction among the characteristics I analyze is whether or
not a patent is foreign owned. I theorize that foreign patent owners are less likely to litigate their patents
through adjudication because it is relatively more expensive. In contrast, foreign owners should not be
more or less likely to win innovation based validity decisions after they have chosen to incur those
costs.25
I confirmed these ideas through unreported regressions of the likelihood a patent is invalidated on
the foreign patent owner indicator. In none of these was foreign ownership even close to a significant
predictor of invalidity. However, it is a negative and highly significant predictor of selection for an
invalidity decision. Accordingly, I utilize foreign patent ownership as my exclusion restriction.
The first two columns of Table 5 report my results for both an uncorrected and selection corrected
probit. The third column reports estimates for the selection equation used in the selection corrected
regression. Concerning the invalidity equation, I include all patent, party and adjudication characteristics
in both the uncorrected and corrected specification. This includes indicator variables for the most active
25
My adjudication controls account for the possibility that some adjudicators may be biased against foreign owners.
Foreign ownership is not a significant predictor of innovation-based invalidity even if these controls are excluded.
Miller: Where’s the Innovation? 21
district courts and I report their coefficients and significance in Table 6. I omit small product firm owner
and trial adjudication categories. In the selection equation, I include all patent and owner characteristics.
To simplify discussion of my results, I consolidate several of the industry and technology
categories described in my bivariate analysis. I merge the Software and Pure Software categories into one
Software indicator including all patents primarily claiming data processing.26
Because they have been
particularly criticized, I include a Business Method indicator for the subset of Software patents within that
category. I use a “pure” Electronics technology category that omits all patents with at least one software
claim. Finally, I omit Biotechnology as an industry category since all such patents in my sample fall
within both the Biotechnology industry and technology category.
Selection Bias and the Selection Equation
Surprisingly, the estimates in Tables 5 and 6 and their significance is similar for both the
uncorrected and corrected model. The reported correlation between the error terms of the two equations,
ρ, is not significantly different than zero. Further, I cannot reject the null that the coefficients of the
uncorrected and corrected models are the same, using either the likelihood-ratio (chi-squared = 1.45 (p >
0.23)) or related Wald test (chi-squared = 0.05 (p > 0.82)). Thus the outcome equation does not appear to
suffer from significant selection bias.
Nevertheless, the selection equation shows that there are interesting selection effects. Computer,
Electronics, Medical, Pharmaceutical, Communications, Energy, Consumer, Construction, and Other
industry patents are more likely to face an innovation-based validity decision. Concerning technology,
Software, Method, Mechanical, Biotechnology and Chemistry patents are more, and Imaging patents less,
likely to be selected. Concerning ownership, licensing firm patents are more likely and inventor and
other-owned patents less likely to face an invalidity decision. Finally, patents with more claims and
citations are more likely to be selected.
26
Upon inspection, the Software patents in my sample that do not fall within Allison, Lemley, and Walker’s (2009)
Pure Software category are substantially data processing with non-software components describing the electronic
means to implement the software’s task. For example, patent number 6,035,027 claims data processing methods of
minimizing long distance telephone fees but describes the architecture that can implement those methods.

Miller: Where’s the Innovation? 22
Table 5
PROBIT ESTIMATION OF LIKELIHOOD A PATENT IS INVALIDATED FOR ANTICIPATION OR OBVIOUSNESS
Uncorrected Probit Selection Corrected Selection Equation
Industry:
Computer -.153 (.195) -.134 (.240) .343** (.090)
Semiconductor -.652* (.307) -.643* (.307) -.025 (.162)
Electronics -.129 (.191) -.104 (.210) .217* (.100)
Medical -.489* (.196) -.450+ (.270) .333** (.084)
Pharmaceutical .071 (.260) .123 (.386) .767** (.103)
Chemical .184 (.268) .180 (.266) .068 (.087)
Communications -.162 (.174) -.131 (.256) .444** (.090)
Transportation -.140 (.230) -.125 (.233) .105 (.080)
Energy/Utility Service -.625* (.342) -.644+ (.349) .165
+ (.095)
Financial -.698* (.404) -.621 (.454) .429 (.322)
Consumer Good/Service -.062 (.169) -.017 (.294) .614** (.077)
Construction -.147 (.259) -.113 (.295) .385** (.114)
Other -.287 (.263) -.271 (.297) .360** (.093)
Technology:
Software .551* (.255) .580* (.259) .184+ (.100)
Business Method .479* (.212) .515* (.255) .530** (.144)
Mechanical .296 (.181) .317 (.218) .333** (.074)
Electronics .261 (.179) .260 (.179) .075 (.074)
Optics .135 (.283) .130 (.285) -.010 (.121)
Imaging .158 (.316) .151 (.338) -.291** (.100)
Biotechnology -.289 (.336) -.206 (.374) .432** (.118)
Chemistry -.197 (.197) -.170 (.217) .219** (.071)
Other .208 (.291) .225 (.289) .042 (.113)
Other Patent:
Application Duration -.00013 (.00010) -.00013 (.00010) -.00002 (.00005)
Grant Year .0403** (.0112) .0422** (.0139) -.0186* (.0041)
Log # Claims -.092 (.061) -.069 (.145) .308** (.031)
Ave Citations / Clm / Yr -.776 (.549) -.687 (.732) 1.13** (.21)
Ave Citations Squared .311 (.346) .290 (.356) -.155 (.101)
Patent Owner:
Inventor .214 (.178) .212 (.200) -.212** (.062)
Licensing Firm .672** (.188) .735* (.366) 1.057** (.142)
Large Product Firm .206 (.138) .213 (.140) .044 (.047)
Other .567+ (.328) .546 (.365) -.382** (.095)
Party:
Foreign Owner -.387** (.042)
Foreign Defendant -.298* (.139) -.302* (.138)
Large Defendant .188 (.125) .191 (.124)
# Patents Asserted .0033 (.0084) .003 (.008)
# Suits Patent Asserted -.0423* (.0195) -.0411* (.0193)
# Defendants in Suit -.0326* (.0161) -.0339* (.0160)
Adjudication:
Decided after KSR -.011 (.105) -.020 (.105)
Declaratory Judgment .505** (.162) .500** (.163)
Appeal .507** (.104) .496** (.105)
Summary Judgment -.082 (.147) -.086 (.147)
NOTE.—Sample includes 980 patents litigated in 579 cases filed between 2000 and 2010. Robust standard errors
included in parenthesis. + p < .10. * p < .05. ** p < .01.
Miller: Where’s the Innovation? 23
Table 6
DISTRICT COURT PREDICTORS FOR TABLE 5 ESTIMATION
Uncorrected Probit Selection Corrected
District Court:
TXED -.524** (.181) -.522** (.181)
CAND .196 (.195) .197 (.194)
DE -.351+ (.214) -.352
+ (.214)
CACD .010 (.205) .009 (.205)
ILND .399+ (.236) .399
+ (.236)
MA -.478* (.229) -.474* (.230)
NJ .410 (.271) .406 (.271)
CASD -.486+ (.289) -.484
+ (.288)
MN -.191 (.273) -.188 (.273)
FLMD .005 (.292) .005 (.292)
WIWD -.288 (.322) -.289 (.321)
NYSD .042 (.326) .031 (.333)
AZ -.986* (.479) -.982* (.479)
TXSD .236 (.375) .239 (.374)
MIED 1.03** (.39) 1.03** (.39)
OR -.304 (.364) -.299 (.364)
MOED .319 (.393) .318 (.392)
NV .510 (.360) .508 (.359)
FLSD -.335 (.359) -.334 (.359)
OHND -.083 (.368) -.083 (.368)
TXWD -.347 (.321) -.344 (.321)
NOTE.— Robust standard errors included in parenthesis. + p < .10.
* p < .05.
** p < .01.
Significant Predictors of Innovation-Based Invalidity
Turning to the invalidity equation, both Software and Business Method patents are significantly
more likely to be invalidated. In the basic probit, Semiconductor, Medical, Energy and Financial patents
are significantly less likely to be invalidated. However, in the selection-corrected model the Financial
category is insignificance. The Energy and Medical categories are only significant to a 90 percent level.
Neither of the two patent characteristics frequently used to proxy value—number of claims and
average citations—is a significant predictor of innovation-based validity. However, as noted, both are
positive predictors that they will be selected for such decisions. Allison, Lemley, and Moore (2004)
argue litigated patents tend to be more valuable to their owners than non-litigated patents because
litigation is costly. If this theory is true, my results support the distinction that number of claims and
average citations proxy private value but not a lower chance of lacking innovation value.
Miller: Where’s the Innovation? 24
As for the remaining two prosecution-related patent characteristics, the first, grant year, is
significant across all specifications. Thus, older patents are less likely to be invalidated. However, the
second, application duration, is uniformly insignificant.
Licensing Firm is the only significant ownership predictor that a patent is invalidated. The
indicator for Other owners is significant to the 90% confidence level in the uncorrected but not the
corrected specification. For other party characteristics, patents asserted against foreign alleged infringers
are significantly less likely to be invalidated. The number of alleged infringers and the total number of
lawsuits in which a patent has been asserted are significant negative predictors that a patent is invalidated.
Finally, patents adjudged by CAFC are significantly more likely to be invalidated, as are those
defended in declaratory actions. TXED, AZ, DE, MA and CASD are less likely, while MIED and ILND
are more likely, to find validity. These results suggest forum-shopping opportunities exist.
Unconditional Probabilities
Just how many old or obvious patents exist? From my selection corrected model, I obtain
estimates of the likelihood any patent within my population would be found invalid, regardless of whether
it has been adjudicated.27
I find the unconditional probability a patent is at least partially invalidated as
anticipated or obvious is 0.28.28
In other words, more than one in four patents granted by the PTO has at
least one non-innovative claim. This result strongly supports Jaffe and Lerner’s (2004) argument that the
PTO has granted many patents on non-innovative ideas.
I estimate fewer non-innovative patents in most of the industries that are significant negative
predictors of innovation-based invalidity. The unconditional probability that patents are at least partially
invalidated is 0.13 for the energy industry, 0.16 for the semiconductor industry, and 0.20 for the medical
industry. Financial patents have an unconditional probability of 0.38, higher than the rate for all patents.
Why then is the financial industry category such a large, significantly negative predictor of innovation
27
In section 3.3, I defined my population as all patents applied for during the same days as the adjudicated patents. 28
I determine this probability with all independent variables measured at their means. For the reported industry and
technology probabilities, industry and technology variables are measured based on the percentage of patents in a
given category that fall within each of the industry and technology categories. All other patent and adjudication
characteristics are measured at their means.

Miller: Where’s the Innovation? 25
based invalidity? The answer is that all financial industry patents in my sample protect either Software or
Business Method technology. Thus, while financial patents have a higher than average invalidity rate,
they are less likely invalid than other software patents.
Excluding business methods, Software patents have an unconditional probability of being at least
partially invalid of 0.39. The probability is far higher for Business Methods (0.56). Finally, I estimate
the unconditional probability that a licensing-firm-owned patent will be found at least partially invalid as
0.61, higher than that of the software and method patents they typically enforce.
5. DISCUSSION
My results have implications for many patent law and economics issues including the use of
patent characteristics as value proxies and forum shopping. In this discussion, however, I focus on
investigating the significantly different innovation-based invalidity rates across industries and
technologies and for licensing firms.
5.1. Industry and Technology Differences
In both my basic probit and selection-corrected probit model I include many patent, party and
adjudication characteristics that control for adjudication bias and selection effects including uncertainty,
case quality, litigation costs, stake asymmetries and case value. 29
Across both models, and despite these
controls, patents from several of the industries and technologies I analyze are uniformly significantly
more or less likely to be adjudicated invalid as lacking innovation. These results strongly suggest that,
whether or not litigated, patents in some industries or covering some technologies are in fact more or less
likely to lack of innovation value. But what explains these differences?
Recall Jaffe and Lerner’s (2004) argument that the PTO’s examination process has been well
functioning for established industries that rely on patents, but has failed to reject applications for patents
on old ideas in “new” technologies. This distinction between old and established versus newly patented
technology fits my results quite well. I find software and business methods are significantly more likely
29
See Marco (2004, pp. 7-12) for a detailed description of Waldfogel’s (1995) version of the Priest-Klein model
(1984) as applied to patent disputes and how different selection effects influence the observed win rate in relation to
the population win rate.

Miller: Where’s the Innovation? 26
to be invalidated on innovation-based grounds. Furthermore, patenting has long been important to the
energy and medical device industries30
and these patents have lower invalidity rates. (Arora 1997; Bessen
and Meurer 2005a)
However, Jaffe and Lerner’s (2004) third newly patented category, biotechnology, is not a
significant predictor of innovation-based invalidity. Further, semiconductor firms did not rely on patents
until after semiconductor patent rights were strengthened in the 1980s. (Hall and Ziedonis 2000) Thus,
semiconductor patents which are less likely to be invalidated may also be considered a category of newly
patented technology. There is, however, a clear distinction between medical, energy, semiconductor and
biotechnology patents on the one hand and software and business method patents on the other—the first
group consists of more definite and concrete claims while the second group covers more abstract ideas.
In contrast with Jaffe and Lerner (2004), Bessen and Meurer (2008) argue the main failure of the
U.S. patent system has been the breakdown in notice of what particular patents protect. A key source of
this breakdown was the increased patenting of software and business methods, which claim abstract ideas.
With abstract ideas it is more difficult to “relate the words that describe patent boundaries to actual
technologies.” (Bessen and Meuer 2008) They argue the proliferation of patents with more uncertain
scope exacerbated the increase in costly patent litigation. (Bessen and Meurer 2008)
Bessen and Meuer (2008) recognize that an increase in the number of patents with “fuzzy
boundaries” is not inconsistent with the conclusion that there are more non-innovative patents. This is
because PTO examiners are not immune from the greater uncertainty surrounding software and business
methods, and may have been more likely to grant old or obvious patents covering these technologies.
Thus, the underlying determinant of the likelihood a patent is invalidated on innovation-based grounds
that I observe is not specifically whether the type of technology has been patented for only a short time
but generally whether it is more difficult for the PTO to review.
In contrast to the abstract claims of software and method patents, claimed biotechnology and
semiconductor innovation is concrete embodying, for example, a newly discovered use of one particular
30
Medical devices comprise 75 percent of the Medical patents in my sample.

Miller: Where’s the Innovation? 27
genetic trait or a new semiconductor mask. While all four types of patents are relatively new, software
and business method patents claim much more abstract content. This distinction both explain both why
biotechnology and semiconductor patents are less likely to lack innovation value and why opportunistic
licensing firms may be more likely to assert software and business method patents
5.2. Non-Practicing Entities Are Different
I found that regardless of technology, licensing firm owned patents are more likely to be
invalidated on innovation-based grounds. Many theorize these entities engage in opportunistic litigation
against large independently inventing product firms to induce licensing. (Bessen and Meuer 2005a)
Opportunistic litigation is most successful where the scope of patent claims is uncertain. (Bessen and
Meuer 2005a) Thus we may expect entrepreneurial owners of weak patents to focus on new technology
patents with “fuzzy boundaries.” (Bessen and Meuer 2008) That licensing firms asserted software or
method patents in 75.5 percent (111 of 147) of their decisions in my sample supports this conjecture.
Further, referencing my selection effects discussion I observe that regardless of technology
licensing firm patents are significantly more likely to be selected for an invalidity decision. If this reflects
uncertainty, then it suggests some licensing firms may strategically assert patents whose content is even
more uncertain than the average software and business method patent. Of course, the higher selection rate
may also indicate higher valued disputes. But this is also consistent with the theory that licensing firms
target the large producers of an industry with patents of potentially broad scope.
Whether they indicate more uncertainty, higher dispute values or both, the higher selection rate is
consistent with the theory that licensing firms strategically litigate patents of broad and uncertain scope
against product firms in litigation with potentially high damage awards. It just so happens that this
business model utilizes the types of patents most likely to lack innovation value.
5.3. Uncertain Welfare and Policy Implications
While there are many non-innovative software and business method patents, many protect
valuable innovation. This is evidenced by the fact courts frequently find these types of patents novel and
non-obvious and grant their owners, including licensing firms, large damage awards. Conversely, alleged

Miller: Where’s the Innovation? 28
infringers in the energy industry, the category least likely to lack innovation value, would still likely
complain that a 13-percent unconditional invalidity rate is too high. My results thus suggest the PTO
could tighten its prior art review regardless of the patent application’s industry, technology or ownership.
Whether it would be welfare improving for the PTO to do so, however, is an open question. Less
than two percent of granted patents are litigated. (Lemley & Shapiro 2005) Further, two-thirds of patents
expire before their full term because their owners chose not to pay PTO maintenance fees. (Lemley 2001).
If owners of the vast majority of patents are unwilling to invest in their defense or maintenance after they
are granted, then it is likely wasteful to increase the scrutiny that all patents receive during prosecution.
Thus, if any legal reform targeting non-innovative patents is welfare improving, it will likely
focus on patents considered particularly valuable by owners and prospective infringers. Perhaps the best
option is to increase the ability of potential infringers to challenge the validity of claimed ideas during the
application process or at least prior to litigation. The recently signed America Invents Act includes such
reforms31
but it will be some time before we possess sufficient data to determine their effect.
6. CONCLUSION
Exploring the characteristics of anticipation and obviousness adjudications is important because
of the extreme ex post economic implication for the particular patents invalidated in these decisions.
After years of PTO examination and litigation to a final decision on the merits, the trier-of-fact
determined, by clear and convincing evidence, that these patents where never entitled to legal protection
because they protect old or obvious ideas. Thus, they imposed significant costs on the PTO, alleged
infringers and the courts without disclosing any appreciable innovation.
I estimate a surprising 28 percent of all patents would be at least partially invalidated as
anticipated or obvious if litigated. I cannot say whether this number is inefficiently high, but this estimate
strongly supports Jaffe and Lerner’s (2004) assertion that non-innovative patents are common. Further,
consistent with their and other recent criticism, software and business method are even more likely to lack
31
The Act retains existing ex parte reexamination (35 U.S.C. § 302), adds preissuance submissions by third parties
(amending 35 U.S.C. § 122), expands interpartes reexamination (modifying 35 U.S.C. §§ 311-320) and adds post-
grant review (adding 35 U.S.C. §§ 321-330).
Miller: Where’s the Innovation? 29
innovation value. Patents protecting innovation in the semiconductor, medical and energy industries are
less likely to lack innovation value. These differences plausibly depend on the relative difficulty PTO
examiners face in comparing claimed ideas to the relevant prior art. In turn, this difficulty likely depends
on the size of the existing body of relevant prior art and relative uncertainty of the content of the claims.
I find evidence that licensing firms are strategic, aggressively asserting software and business
method patents with more uncertain meaning and scope. This business model is costly, however, as the
patents they select are even more likely to lack innovation value than the average software or method
patent. In my next paper I will further investigate the behavior of licensing firms and other repeat patent
plaintiffs in light of my finding here of a negative relationship between the number of lawsuits in which a
patent is asserted and its likelihood of lacking innovation. This contrasts with Allison, Lemley, and
Walker’s (2011) conclusion that owners of the “most-litigated” patents act irrationally.
Finally my analysis has revealed other interesting characteristics of innovation-based invalidity
decisions. These inform past patent litigation research on the connection between patent characteristics
and value and the bias of different adjudicators.

Miller: Where’s the Innovation? 30
REFERENCES
Allison, John R., Mark A. Lemley, and Kimberly A. Moore. 2004. Valuable Patents. 92 Geo. L.J. 435.
Allison, John R., Mark A. Lemley, and Joshua Walker. 2011. Patent Quality and Settlement Among
Repeat Patent Litigants. 99 Geo. L.J. 677.
Allison, John R., Mark A. Lemley, and Joshua Walker. 2009. Extreme Value or Trolls on Top? The
Characteristics of the Most-Litigated Patents. 158 U. Pa. L. Rev. 1-37.
Barton, John H. 2003. Non-Obviousness. 43 IDEA 475.
Bessen, James, and Eric Maskin. 2009. Sequential Innovation, Patents, and Imitation. RAND Journal of
Economics 40(4):611-635.
Bessen, James, and Michael J. Meurer. 2008. Patent Failure: How Judges, Bureaucrats, and Lawyers
Put Innovators At Risk. Princeton, N.J.: Princeton University Press.
Bessen, James, and Michael J. Meurer. 2005a. Lessons for Patent Policy from Empirical Research on
Patent Litigation. 9 Lewis & Clark L. Rev. 1.
Bessen, James, and Michael J. Meurer. 2005b. The Patent Litigation Explosion. Working Paper No. 05-
18. Boston University School of Law, Boston, Mass.
Cooter, Robert D., and Daniel L. Rubinfeld. 1989. Economic Analysis of Legal Disputes and Their
Resolution. Journal of Economic Literature 27:1067-1097.
U.S. Federal Trade Commission. 2003. To Promote Innovation: The Proper Balance of Competition and
Patent Law and Policy. http://www.ftc.gov/os/2003/10/innovationrpt.pdf.
Hall, Bronwyn H., Adam B. Jaffe, and Manuel Tratjenberg. 2001. The NBER Patent Citation Data File:
Lessons, Insights and Methodological Tools. Working Paper No. 8498. National Bureau of
Economic Research, Cambridge, Mass.
Hall, Bronwyn H., and R. Ziedonis. 2001. The Patent Paradox Revisited: An Empirical Study of
Patenting in the US Semiconductor Industry, 1979-95. RAND Journal of Economics 32(1):1-128.
Heckman, James J. 1979. Sample Selection Bias as a Specification Error. Econometrica 47(1):53-161.
Jaffe, Adam B., and Josh Lerner. 2004. Innovation and Its Discontents: How Our Broken Patent System
is Endangering Innovation and Progress, and What to Do about It. Princeton, N.J.: Princeton
University Press.
Kieff, F. Scott. 2001. Property Rights and Property Rules for Commercializing Inventions. 85 Minn. L.
Rev. 697.
Landjouw, Jean O., and Mark Schankerman. 2001. Characteristics of Patent Litigation: A Window on
Competition. RAND Journal of Economics 32(1):129-151.
Lemley, Mark A. 2001. Rational Ignorance at the Patent Office. 95 NW. U. L. Rev. 1495.
Lemley, Mark A., and Carl Shapiro. 2005. Probabilistic Patents. J. Econ. Persp. Spring 2005 75.

Miller: Where’s the Innovation? 31
Lemley, Mark A., and D. O’Brien. 1997. Encouraging Software Reuse. 49 Stan. L. Rev. 255.
Marco, Alan C. 2004. The Selection Effects (and Lack Thereof) in Patent Litigation: Evidence from
Trials. Topics in Economic Analysis & Policy 4(1): Art. 21.
Merges, Robert P. 1999. As Many as Six Impossible Patents Before Breakfast: Property Rights for
Business Concepts and Patent System Reform. 14 Berkeley Tech. L.J. 577.
Moore, Kimberly A. 2000. Judges, Juries, and Patent Cases – An Empirical Peek Inside the Black Box.
99 Mich. L. Rev. 365.
National Research Council. 2004. A Patent System for the 21st Century. Stephen A. Merrill et al. ed.
Washington, D.C.: The National Academies Press.
Parker, Ashley N. 2002. Problem Patents: Is Reexamination Truly a Viable Alternative to Litigation? 3
N.C. J.L. & Tech. 305.
Priest, George L., and Benjamin Klein. 1984. The Selection of Disputes for Litigation. The Journal of
Legal Studies 13(1):1-55.
Shapiro, Carl. 2004. Patent System Reform: Economic Analysis and critique. 19 Berkeley Tech. L.J.
1017.
Shrestha, Sannu K. 2010. Trolls or Market-Makers? An Empirical Analysis of Nonpracticing Entities.
110 Columbia L. Rev. 114.
Siegelman, Peter, and Joel Waldfogel. 1999. Toward a Taxonomy of Disputes: New Evidence Through
the Prism of the Priest/Klein Model. The Journal of Legal Studies 28(1): 101-130.
Simic, Emer. 2009. The TSM Test is Dead! Long Live the TSM Test! The Aftermath of KSR, What
Was All the Fuss About? AIPLA Quarterly Journal 37(2): 227-256.
Thomas, John R. 2001. Collusion and Collective Action in the Patent System: A Proposal for Patent
Bounties. 2001 U. Ill. L. Rev. 305.

Miller: Where’s the Innovation? 32
APPENDIX
Table A1
SUMMARY AND INVALIDITY STATISTICS FOR OTHER PATENT CHARACTERISTICS
All A or O Part A or O Not A or O Total
Application Duration:
Mean 853.2 823.0 882.4 869.1
Median 714 791 740 736
Standard deviation 483.9 304.0 609.6 556.7
Year PTO Granted Patent:
Mean 1999.4 1998.2 1997.8 1998.2
Median 2000 1999 1998 1999
Standard deviation 4.63 4.99 5.12 5.01
# of Patent Claims:
Mean 29.8 27.5 25.6 27.0
Median 21 21 20 20
Standard deviation 34.5 21.4 22.6 26.8
# of Citations / Claim / Year:
Mean 0.102 0.113 0.119 0.113
Median 0.035 0.044 0.048 0.044
Standard deviation 0.393 0.192 0.206 0.277
Table A2
INNOVATION-BASED VALIDITY DECISIONS & RATES BY PARTY INDICATOR CHARACTERISTICS
All A or O Part A or O Not A or O Total
Party Domicile:
Foreign Patent Owner 37 6 83 126
(29.4%) (4.7%) (65.9%)
Domestic Patent Owner 259 63 532 854
(30.3%) (7.4%) (62.3%)
*Foreign Alleged Infringer 36 7 108 151
(23.8%) (4.6%) (71.5%)
*Domestic Alleged Infringer 260 62 507 829
(31.4%) (7.5%) (61.1%)
Size of Alleged Infringer:
*Large Firm 227 47 402 676
(33.6%) (7.0%) (59.5%)
*Small Firm 69 22 213 304
(22.7%) (7.2%) (70.1%)

Miller: Where’s the Innovation? 33
Table A3
SUMMARY AND INVALIDITY STATISTICS FOR NUMERICAL PARTY/SUIT CHARACTERISTICS
A or O Part A or O Not A or O Total
# of Patents Asserted:
Mean 5.08 4.58 4.21 4.50
Median 3 3 3 3
Standard deviation 5.64 8.58 5.00 5.53
# of Cases Patent Asserted:
Mean 2.61 2.39 3.30 3.02
Median 2 2 2 2
Standard deviation 2.85 2.32 5.31 4.55
# of Alleged Infringers:
Mean 2.39 2.64 2.64 2.56
Median 1 1 1 1
Standard deviation 2.73 3.27 3.57 3.32
Table A4
INNOVATION-BASED VALIDITY DECISIONS & RATES BY ADJUDICATION CHARACTERISTIC
All A or O Part A or O Not A or O Total
Date of Adjudication
Before KSR 98 28 246 372
(26.3%) (7.5%) (66.1%)
After KSR 198 41 369 608
(32.6%) (6.7%) (60.7%)
Declaratory versus Infringement:
*Infringement Action 261 58 564 883
(29.6%) (6.6%) (63.9%)
*Declaratory Action 35 11 51 97
(36.1%) (11.3%) (52.6%)
Level of Adjudication
*Appeal 191 34 267 492
(38.8%) (6.9%) (54.3%)
*Trial or JNOV 77 15 253 345
(22.3%) (4.3%) (73.3%)
Summary Judgment 28 20 95 143
(19.6%) (14.0%) (66.4)
Judge versus Jury
*Bench or JNOV 67 3 123 193
(34.7%) (1.6%) (63.7%)
*Jury 84 21 350 455
(18.5%) (4.6%) (76.9%)

Miller: Where’s the Innovation? 34
Table A5
INNOVATION-BASED INVALIDITY DECISION BY DISTRICT COURT HEARING SUIT
District Court All A or O Part A or O Not A or O Total
*TXED 26 (20) 5 (4) 99 (76) 130
*CAND 31 (34) 13 (14) 46 (51) 90
*DE 15 (19) 3 (4) 62 (78) 80
CACD 24 (38) 3 (5) 36 (57) 63
*ILND 30 (55) 4 (7) 21 (38) 55
MA 10 (23) 3 (7) 31 (70) 44
NJ 15 (39) 1 (3) 22 (58) 38
CASD 8 (23) 2 (6) 25 (71) 35
MN 10 (35) 0 (0) 19 (66) 29
FLMD 10 (37) 0 (0) 17 (63) 27
WIWD 2 (8) 6 (25) 16 (67) 24
NYSD 8 (42) 0 (0) 11 (58) 19
AZ 2 (11) 1 (6) 15 (83) 18
TXSD 6 (33) 1 (6) 11 (61) 18
*MIED 9 (53) 4 (24) 4 (24) 17
OR 3 (18) 4 (24) 10 (59) 17
MOED 4 (25) 1 (6) 11 (69) 16
*NV 7 (44) 3 (19) 6 (38) 16
FLSD 5 (33) 0 (0) 10 (67) 15
OHND 4 (27) 1 (7) 10 (67) 15
TXWD 8 (53) 0 (0) 7 (47) 15
Other 47 59 (29.6) 14 (7.0) 126 (63.3) 199
Total 296 (30.2) 69 (7.0) 615 (62.8) 854
NOTE.—Percentage of patents adjudicated by each court that fall within each decision category in parenthesis.