whey market outlook - c.ymcdn.comc.ymcdn.com/sites/ · oric rise in the global dairy trade pricing...
TRANSCRIPT

GLOBAL DAIRY
Market OutlookU.S. exports (MT, Jan-Feb): NDM/SMP 66,823 15% CHEESE 43,598 9% WHEY 74,147 10% BUTTERFAT 8,478 29% DETAILS, PAGE 3
U.S. DairyExport Council
April 23, 2013
Volume 17 No. 3
Undersupplied market takes offBy Alan Levitt, Marc Beck and Brad Gehrke
The market situation and psychology has shifted dra-matically in just the last six weeks, as the widely report-ed New Zealand drought sent Oceania prices rallying to record highs. Milk pow-der prices are up more than 50% since the beginning of March, and butterfat and whey prices have posted double-digit increases. Rising Oceania prices have pulled U.S. and European prices higher as well.
We caution that the mete-
oric rise in the Global Dairy Trade pricing is primarily a reflection of meager offerings on the auction platform. Just 13,912 tons and 15,019 tons, respectively, were traded at the two April auctions – a far cry from the average of more than 50,000 tons traded per event from August 2012 to January 2013. In the April auctions, just 425-600 tons of New Zealand SMP was offered per contract month.
Still, many buyers were caught short by the rapid market turnaround, and now are scrambling to get coverage in a rising market. We expect
to see undersupplied con-ditions through the second and third quarters as buyers cope with declining produc-tion in Oceania, Europe and Argentina. Besides the New Zealand drought, a brutally cold winter and delayed spring has pinched milk pro-duction across the EU – a marked contrast from a year ago, when a mild winter and warm spring gave a lift to milk flows. We estimate milk production in the top five exporting regions (New Zea-land, EU-27, United States, Australia and Argentina) Turn to Undersupplied, p. 2
U.S. off to good start in 2013 By Alan Levitt, Marc Beck and Brad Gehrke
U.S. dairy exports in the first two months of the year were up 3% by value and 4% by volume compared with a year ago. Data is not in yet, but U.S. shipments have reportedly improved in March and April as U.S. pricing has become relatively more favorable. Turn to Good start, p. 2
Oceania SMP prices jump U.S. cheese exports (p. 4) Milk production lower (p. 8)
Oceania SMP prices are up almost
$2,000/ton in 6 weeks U.S. cheese exports have increased since November
Milk production from the five major suppliers was down about 1.0% in Jan-Feb. (*2013 is
USDEC estimate)
2101 Wilson Blvd., Suite 400 › Arlington, VA 22201 › U.S.A. › PHONE 703.528.3049 › FAX 703.528.3705 › usdec.org Managed by Dairy Management Inc.™
© Copyright 2013 U.S. Dairy Export Council. All rights reserved by copyright owners. Reproductions
of all portions of this newsletter is permitted with proper credit to U.S. Dairy Export Council.
THIS ISSUE AT-A-GLANCE
U.S. exports start strong in 2013 .......... 3
World milk production is lower ...........8
Global trade is up in 2013 ...................10
Prices are significantly higher .............11
U.S. dollar is steady ..............................13
ACCESS TRADE DATA ONLINE
Visit usdec.org and click “Why U.S. Dairy,” then “Export Trade Data“
U.S. Exports ...................3
Exports: 5 Year Trend ....7
Global Milk Production ..8
Key Suppliers .................9
World Dairy Trade ........10
World Prices .................11
Currency Exchange .....13
US
2010 2011 2012 2013
2,820
3,540
4,260
4,980
5,700
($/M
T)
EUOceania
37,000
49,000
61,000
73,000
85,000
2010 2011 2012 2013
(rolling quarters)
(MT)
2011 2012 2013
J F M A M J J A S O N D
(000
MT)
20,940
21,580
22,220
22,860
23,500

2
U.S. Dairy Export Council › Global Dairy Market Outlook › Visit us at usdec.org APRIL 23, 2013 • VOLUME 17 NO. 3
OVERVIEW
U.S. Dairy Export Council › Global Dairy Market Outlook › Visit us at usdec.org
Undersupplied (cont.)Continued from page 1
will be down more than 1.0% in the first half of 2013, a shortfall of 1.6 million tons of milk vs. a year ago.
New Zealand has welcomed good rains in the last two weeks, easing the driest summer in 30 years. Pasture growth rates are improv-ing though they’re still below normal for this time of year. The season has all but ended, so it won’t make much difference for 2012/13. But it should improve conditions for 2013/14.
In the meantime, product shortages from the end of Oceania’s season should present
opportunities for U.S. and European sup-pliers to fill the gaps. New Zealand suppliers have already warned of the need to ration their dwindling supply in the months ahead.
Demand remains persistent, but look-ing ahead we expect to see continued sup-ply rationing as higher prices take hold. In addition, higher farmgate milk prices and improved margins should spur a strong supply response across the globe. Fonterra increased its payout in late March from NZ$5.50/kg MS to NZ$5.80, and another boost is expected lat-er this month. European processors also have
topped up pay rates. Meanwhile, U.S. grain prices plunged at the end of March on a more bearish supply outlook.
The impact of price-induced product substitution and supply enhancement will determine if the market is oversupplied again by the time the new Oceania season comes on in September-October. But in the short- and medium-term, conditions should stay firm, with prices sustainable at histori-cally high levels.
ABOUT THIS ISSUE
Global Dairy Market Outlook is written and distributed monthly by the U.S. Dairy Export
Council (USDEC), 2101 Wilson Blvd., Suite 400, Arlington, VA 22201, USA, (703) 528-
3049, FAX (703) 528-3705, website www.usdec.org. Data is compiled and analyzed
by Alan Levitt, vice president of communications and market analysis; Marc Beck,
executive vice president of strategy and insights; and Brad Gehrke, director of global
trade analysis. Analysis is supported by USDEC's network of nine international offices.
This issue of Global Dairy Market Outlook covers conditions at mid-April 2013.
USDEC uses sources believed to be reliable but cannot warrant the accuracy of the
information herein. Global Dairy Market Outlook is solely for information purposes and
is not to be construed as commercial trading advice.
USDEC, primarily funded by Dairy Management Inc. through the producer checkoff,
works closely with its member processors, trading companies and others to build
global demand for U.S. dairy products.
Source: GTIS & USDA.
Good start (cont.)
Continued from page 1
In 2013, the United States has increased exports of cheese, WPC, butterfat, lactose and fluid milk compared with last year. Shipments of NDM/SMP and dry whey are lower.
Among the top five exporters, the New Zea-land moved its flush production aggressively in the first two months of 2013, increas-ing volumes by 16% vs. the prior year. The United States and Australia mostly held their share. EU sales were down 5%, and Argentina exports dropped off by 10%.
AGGREGATE EXPORT VOLUME SMP, WMP, CHEESE, BUTTERFAT, WHEY
(MT)
2010 2011 2012 2013
62,000
124,000
186,000
248,000
310,000
EU NZ US AUSTRALIA ARGENTINA

3
U.S. Dairy Export Council › Global Dairy Market Outlook › Visit us at usdec.org APRIL 23, 2013 • VOLUME 17 NO. 3
U.S. ExportsU.S. DAIRy EXPORTS, TOP 10 MARkETS (JAnUARY-APRil And % CHAngE vS. PRioR YEAR)
NDM/SMP ................................................ 4
Cheese ........................................................ 4
Butterfat ..................................................... 4
Whey .......................................................... 5
Lactose ....................................................... 6
WMP ......................................................... 6
Food Preps (Blends) ................................... 6
Fluid Milk/Cream ...................................... 6
U.S. exported 13.5% of its milk production (TSB) in February yTD volumes +4% vs. prior year: PAGE 7
U.S. exports trending higher in early 2013
Source: USDA, USDEC, National Milk Producers Federation.
U.S. dairy exports continued to improve in February, posting their highest levels since second quarter of 2012. Overall volumes were up for the second straight month (+8% vs. January on a daily-average basis) and value was up for the fourth straight month (+9% vs. January). Pricing relationships were more favorable for U.S. suppliers in February, and anticipated tight supply from com-peting exporters has buyers looking to the United States.
Nonfat dry milk/skim milk pow-der (NDM/SMP), cheese, butterfat, lactose and fluid milk volumes all are trending higher.
The improvement of NDM/SMP is particularly encouraging: Febru-ary volumes were 35,152 tons, up 23% from January (daily average) and the most since last August. Vol-umes are still below a year ago, but recent advances represent a change
in the trend. Exports were equivalent to 43% of production for the month, just below the five-year average.
Cheese exports in February were 21,638 tons, up 9% from January (daily average) and the most since last June. Exports were equivalent to 5.4% of total cheese production.
Butterfat exports in in February were 4,426 tons, a nine-month high. Volume was up 9% from January (daily average).
Dry whey exports were on par with prior months, with slight improve-ment in WPC and a slight decline in dry whey.
Lactose exports were 28,057 tons, the most ever on a daily-average basis.
In February, exporters shipped $439.3 million worth of dairy prod-ucts. Exports were equivalent to 13.5% of U.S. milk solids production. Meanwhile, imports as a percent of milk solids production were 3.0%.
SOUTH AMERICA
$43m�14%
MEXICO
$208m �2%
CANADA
$109m �15%
CHINA
$58m�12%
SOUTH KOREA
$42m�49%
SOUTHEAST ASIA
$146m�7%
OCEANIA
$45m�46%
CARIBBEAN
$27m�16%
MIDDLE EAST/NORTH AFRICA
$78m�3%
Change (%)
JAPAN
$58m�18%
0% –
0-15%
15% +
U.S. DAIRy EXPORTS, TOP 10 MARkETS (JAnUARY-FEBRUARY And % CHAngE vS. PRioR YEAR)
U.S. EXPORTS AS % OF PRODUCTION
PRODUCT JAN-FEB 2013 YR AGO
NDM/SMP u 40% 45%
Total cheese u 5.4% 5.0%
Butterfat u 5.2% 4.2%
Dry sweet whey u 45% 46%
Lactose u 75% 66%
Total milk solids u 12.9% 12.5%
U.S. EXPORTS AND IMPORTS AS % OF PRODUCTION
IMPORTSEXPORTS
4.0
7.0
10.0
13.0
16.0
2008 2009 2010 2011 2012 2013
% o
f mik
pro
duc
tion
(TS
B)

NDM/SMP, Cheese & Butterfat4
U.S. Dairy Export Council › Global Dairy Market Outlook › Visit us at usdec.org APRIL 23, 2013 • VOLUME 17 NO. 3
U.S. EXPORTS
NDM/SMP
U.S. exports in the Decem-ber-February period were 99,277 tons, up 6.1% vs. last month but down 11.4% vs. the same period in the prior year. In the first two months of the year, volumes to Mexico were flat, while sales to other top regions were below 2012 levels.
ChEESE
U.S. exports in the December-February period were 64,500 tons, up 5.2% vs. last month and up 6.7% vs. the same period in the prior year. In the first two months of 2013, shipments to Mexico were up 9% vs. prior year, and South Korea (+30%), Japan (+44%) and Egypt (+291%) also posted large gains.
BUTTERfaT
U.S. exports in the latest three-month period were 11,705 tons, up 18.1% vs. last month and up 19.2% vs. the same period in the prior year. So far in 2013, nearly 87% of the volume has gone to the Middle East/North Africa region, primarily Saudi Arabia and Iran.
U.S. NDM/SMP EXPORTS - ROLLING QUARTERS (MT)
U.S. CHEESE EXPORTS - ROLLING QUARTERS (MT)
U.S. BUTTERFAT EXPORTS - ROLLING QUARTERS (MT)
U.S. NDM/SMP CUSTOMERS (MT)
U.S. CHEESE CUSTOMERS (MT)
U.S. BUTTERFAT CUSTOMERS (MT)
Source: USDA.
56,000
77,000
98,000
119,000
140,000
2010 2011 2012 2013
29,000
43,000
57,000
71,000
85,000
2010 2011 2012 2013
2010 2011 2012 2013
7,400
11,800
16,200
20,600
25,000
JAN. - FEB. 2012 JAN. - FEB. 2013
7,000
14,000
21,000
28,000
35,000
2,200
4,400
6,600
8,800
11,000
JAN. - FEB. 2012 JAN. - FEB. 2013
840
1,680
2,520
3,360
4,200
JAN. - FEB. 2012 JAN. - FEB. 2013

Whey Products5
U.S. Dairy Export Council › Global Dairy Market Outlook › Visit us at usdec.org APRIL 23, 2013 • VOLUME 17 NO. 3
U.S. EXPORTS
U.S. exports of whey products in the most recent three months were 107,850 tons, down 1.1% vs. last month and down 0.3% vs. the previous year. China remains the major customer for U.S. whey products, with YTD purchases up 31% vs. 2012. Overall WPC exports were up 39% in the first two months of the year, while dry whey shipments continue to lag.
U.S. TOTAL WHEy EXPORTS - ROLLING QUARTERS (MT)
U.S. DRy WHEy EXPORTS - ROLLING QUARTERS (MT)
U.S. WPC EXPORTS - ROLLING QUARTERS (MT)
U.S. WPI EXPORTS - ROLLING QUARTERS (MT)
U.S. TOTAL WHEy CUSTOMERS (MT)
U.S. DRy WHEy CUSTOMERS (MT)
U.S. WPC CUSTOMERS (MT)
U.S. WPI CUSTOMERS (MT)
Source: USDA.
99,000
108,000
117,000
126,000
135,000
2010 2011 2012 2013
48,000
56,000
64,000
72,000
80,000
2010 2011 2012 2013
43,000
51,000
59,000
67,000
75,000
2010 2011 2012 2013
3,460
3,920
4,380
4,840
5,300
2010 2011 2012 2013
China SE Asia Mexico Canada Japan
JAN. - FEB. 2012 JAN. - FEB. 2013
5,200
10,400
15,600
20,800
26,000
China SE Asia Canada Japan Mexico
JAN. - FEB. 2012 JAN. - FEB. 2013
2,400
4,800
7.200
9,600
12,000
China SE Asia Mexico So. Korea Canada
JAN. - FEB. 2012 JAN. - FEB. 2013
3,000
6,000
9,000
12,000
15,000
Canada EU SE Asia BrazilO ceania
JAN. - FEB. 2012 JAN. - FEB. 2013
240
480
720
960
4,200

Other Products6
U.S. Dairy Export Council › Global Dairy Market Outlook › Visit us at usdec.org APRIL 23, 2013 • VOLUME 17 NO. 3
U.S. EXPORTS
Lactose exports remain strong. In the December-February period, lactose export volume was 80,492 tons, up 2.8% from the prior month and up 5.0% from the prior year. In addition, exports of fluid milk/cream continue to trend higher: YTD shipments of 14.5 million liters were 42% higher than the volume posted a year earlier.
U.S. LACTOSE EXPORTS - ROLLING QUARTERS (MT)
U.S. WMP EXPORTS - ROLLING QUARTERS (MT)
U.S. FOOD PREPS (BLENDS) EXPORTS - ROLLING QUARTERS (MT)
U.S. FLUID MILk/CREAM EXPORTS - ROLLING QUARTERS (000 liTERS)
U.S. LACTOSE CUSTOMERS (MT) (MT)
U.S. WMP CUSTOMERS (MT)
U.S. FOOD PREPS (BLENDS) CUSTOMERS (MT)
U.S. FLUID MILk/CREAM CUSTOMERS (000 liTERS)
Source: USDA.
2010 2011 2012 2013
49,000
58,000
67,000
76,000
85,000
2010 2011 2012 2013
6,000
12,000
18,000
24,000
2010 2011 2012 2013
15,500
18,500
21,500
24,500
2010 2011 2012 2013
12,400
14,800
17,200
19,600
22,000
5,200
7,800
10,400
13,000
JAN. - FEB. 2012 JAN. - FEB. 2013
2,600
360
180
540
720
900
JAN. - FEB. 2012 JAN. - FEB. 2013
1,400
4,200
5,600
7,000
2,800
JAN. - FEB. 2012 JAN. - FEB. 2013
1,600
3,200
4,800
6,400
8,000
JAN. - FEB. 2012 JAN. - FEB. 2013

5 Year Trend7
U.S. Dairy Export Council › Global Dairy Market Outlook › Visit us at usdec.org APRIL 23, 2013 • VOLUME 17 NO. 3
U.S. EXPORTS
U.S. EXPORTS volUME And vAlUE
NDM/SMP (MT)
TOTAL WHEy (MT)
WPI (MT)
FOOD PREPS (BLENDS) (MT)
CHEESE (MT)
DRy WHEy (MT)
LACTOSE (MT)
FLUID MILk/CREAM (000 liTERS)
BUTTERFAT (MT)
WPC (MT)
WMP (MT)
TOTAL EXPORT VALUE (Million $)
Source: USDA, USDEC.
Above charts: YTdToTAl
Feb exports $439 millionU.S. exports have been relatively consistent from month to month since spring 2010. In the last 35 months, aggregate export volume of dry ingredients (milk powder, whey products and lactose), cheese and butterfat has averaged 132,558 tons and the value of all exports has averaged $396.7 million. In the first two months of 2013, the largest sales gains (vs. a year ago) came from South Korea, New Zealand and Canada.
*volume includes SMP, WMP, food preps, whey, cheese, butterfat, lactose
209
288
367
446
525
73,000
96,000
119,000
142,000
165,000
Valu
e (m
illio
n $)
Volu
me
(MT)
AGGREGATE VOLUME, SELECTED PRODUCTS* TOTAL DOLLAR VALUE
2008 2009 2010 2011 2012 2013
2009 2010 2011 2012 2013
96,000 192,000 288,000 384,000 480,000
2009 2010 2011 2012 2013
54,000108,000162,000216,000270,000
2009 2010 2011 2012 2013
14,00028,00042,00056,00070,000
2009 2010 2011 2012 2013
50,000100,000150,000200,000 250,000
2009 2010 2011 2012 2013
60,000 120,000 180,000 240,000 300,000
2009 2010 2011 2012 2013
100,000 200,000 300,000 400,000 500,000
2009 2010 2011 2012 2013
4,000 8,000
12,000 16,000 20,000
2009 2010 2011 2012 2013
66,000 132,000 198,000 264,000 330,000
2009 2010 2011 2012 2013
15,000
30,000
45,000
60,000
2009 2010 2011 2012 2013
1,070 2,140 3,210 4,280 5,350
2009 2010 2011 2012 2013
16,000 32,000 48,000 64,000 80,000
2009 2010 2011 2012 2013
16,00032,00048,00064,00080,000

Global Milk Production8
U.S. Dairy Export Council › Global Dairy Market Outlook › Visit us at usdec.org APRIL 23, 2013 • VOLUME 17 NO. 3
MILk PRODUCTION - CHANGE FROM PRIOR yEAR (000 MT)
TOTAL MILk PROD. FROM MAJOR EXPORTERS
World output trailing year-earlier levels
U.S. cheese production higher in January-February: PAGE 9
EU-27
Poor weather has stunted EU milk produc-tion. Deliveries were estimated to be off 1.2% in January-February (adjusted for leap day). Production in the UK, France, Germany, Ireland and Italy, among others, are trailing year-ago levels.
UNITED STaTES
Milk production in the first two months of the year was up 0.3% vs. the prior year (adjusted for leap day). A cold, wet spring is depressing the spring flush. Margins are improving as milk prices rise and feed costs soften.
NEW ZEalaND
Milk production in January-February was up 1.0% from the prior year (adjusted for leap day). But drought knocked output down 15-20% in March and probably at least that much in April. For the full 2012/13 season, we estimate production will be down about 0.3% from the prior year’s record volume.
aUSTRalIa
Milk production was down 5.7% in January-February (adjusted for leap day) as poor weather and margins took their toll. 2012-13 production is projected to be down about 3%.
aRgENTINa
Output continues to lag; milk deliveries in January-February were estimated to be down 10.4% (adjusted for leap day).
Milk production continued to lag in early 2013. Output from the five major exporters (EU, U.S., New Zealand, Australia and Argentina) was estimated to be down 1.0% in the first two months of the year (adjusted for leap day), and March isn’t likely to be any better.
Source: USDA, EuroStat, DairyAustralia, DCANZ, Argentina Ministry of Agriculture.
includes EU, U.S., new Zealand, Australia and Argentina. EU and Argentina are milk deliveries. 30-day months. February 2012 adjusted for leap day. * 2013 USdEC estimate
*Feb 2012 adjusted for leap day
(600)
(300)
300
600
900
1,200 2010 2011 2012 2013
EU U.S. NZ AUSTRALIA ARGENTINA
2011(000 MT) 2012 2013*
20,540
21,280
22,020
22,760
23,500

Key Suppliers9
U.S. Dairy Export Council › Global Dairy Market Outlook › Visit us at usdec.org APRIL 23, 2013 • VOLUME 17 NO. 3
MIlK PRODUCTION
NEW ZEALAND MILk PRODUCTION (% CHg vS. PRioR YEAR)
U.S. NDM/SMP PRODUCTION (MT, 30 dAY MoS.)
ARGENTINA MILk DELIVERIES (% CHg vS. PRioR YEAR)
U.S. BUTTER PRODUCTION (MT, 30 dAY MoS.) U.S. DRy WHEy PRODUCTION (MT, 30 dAY MoS.) U.S. WPC PRODUCTION (MT, 30 dAY MoS.)
EUROPEAN UNION MILk DELIVERIES (% CHg vS. PRioR YEAR)
U.S. MILk PRODUCTION (000 MT, 30 dAY MoS.)
U.S. Production
AUSTRALIA MILk PRODUCTION (% CHg vS. PRioR YEAR)
U.S. CHEESE PRODUCTION (MT, 30 dAY MoS.)
Q1-2012 adjusted for leap day.
Source: USDA, EuroStat, DairyAustralia, DCANZ.
2010
Q1 Q2 Q3 Q4 Q2 Q2Q3 Q4Q1 Q1 Q3 Q4-10.0
-4.0
2.0
8.0
14.0
20.0 37%
2011 2012
2010 2011 2012
Q1 Q2 Q3 Q4 Q1 Q2 Q3 Q4 Q1 Q2 Q3 Q4-6.0
-3.6
-1.2
1.2
3.6
6.0 2010 2011 2012
Q1 Q2 Q3 Q4 Q1 Q2 Q3 Q4 Q1 Q2 Q3 Q4-8.0
-3.2
1.6
6.4
11.2
16.0
-1.9
-0.8
0.3
1.4
2.5
3.6 2010
Q1 Q2 Q3 Q4 Q2 Q2Q3 Q4Q1 Q1 Q3 Q4
2011 2012
2011 2012 2013
7,000
7,400
7,600
7,800
8,000
60,000
70,000
80,000
90,000
100,000 2011 2012 2013
360,000
384,000
396,000
408,000
420,000 2011 2012 2013
61,000
67,000
73,000
79,000
85,000
2011 2012 2013
33,600
36,200
38,800
41,400
44,000
2011 2012 2013
15,120
15,840
16,560
17,280
18,000
2011 2012 2013

World Dairy Trade10
U.S. Dairy Export Council › Global Dairy Market Outlook › Visit us at usdec.org APRIL 23, 2013 • VOLUME 17 NO. 3
IMPORTS, MAJOR BUyERS, SELECTED PRODUCTS (000 MT)
IMPORTS, MAJOR BUyERS, SELECTED PRODUCTS SMP, WMP, CHEESE, BUTTERFAT, WHEY - Rolling QUARTERS
Rolling quarters. Buyers include China, SE Asia-5, Russia, Mexico, Japan, Algeria. Products include SMP, WMP, cheese, butterfat and whey.
Early China buying boosts market
Butterfat trade led by New Zealand
Imports from key customers were mostly higher in early 2013, led by record purchases from China.
In January-February, China imported 231,378 tons of milk pow-der, whey products, cheese and but-terfat, up 12% from the prior year. Gains were driven by a 50% increase in purchases of WMP vs. last year. In addition, cheese imports were up 21%. This offset declines in purchases of SMP, whey and butterfat.
Russia imports pulled back from Q4 levels, but January-February totals came in 19% above last year. Cheese and butterfat purchases were up 12%
and 56%, respectively.Mexico started the year strong, with
January imports up 11% vs. last year. Cheese and whey purchases were up by more than a third and butterfat imports nearly doubled, but NDM/SMP imports were down 12%.
Japan imports were flat in the first two months of the year.
Data is not complete for Southeast Asia, but purchases in the early part of 2013 appear to be flat across the region.
South Korea posted a 19% gain in the first two months of the year, led by a 42% increase in cheese imports.
Source: GTIS.
(000
MT)
CHINA SE ASIA-5 RUSSIA MEXICO JAPAN ALGERIA
68
136
204
272
340
2008 20132010 2011 20122009
620
740
860
980
1,100
2009 20102008 2011 2012 2013
World Prices11
U.S. Dairy Export Council › Global Dairy Market Outlook › Visit us at usdec.org APRIL 23, 2013 • VOLUME 17 NO. 3
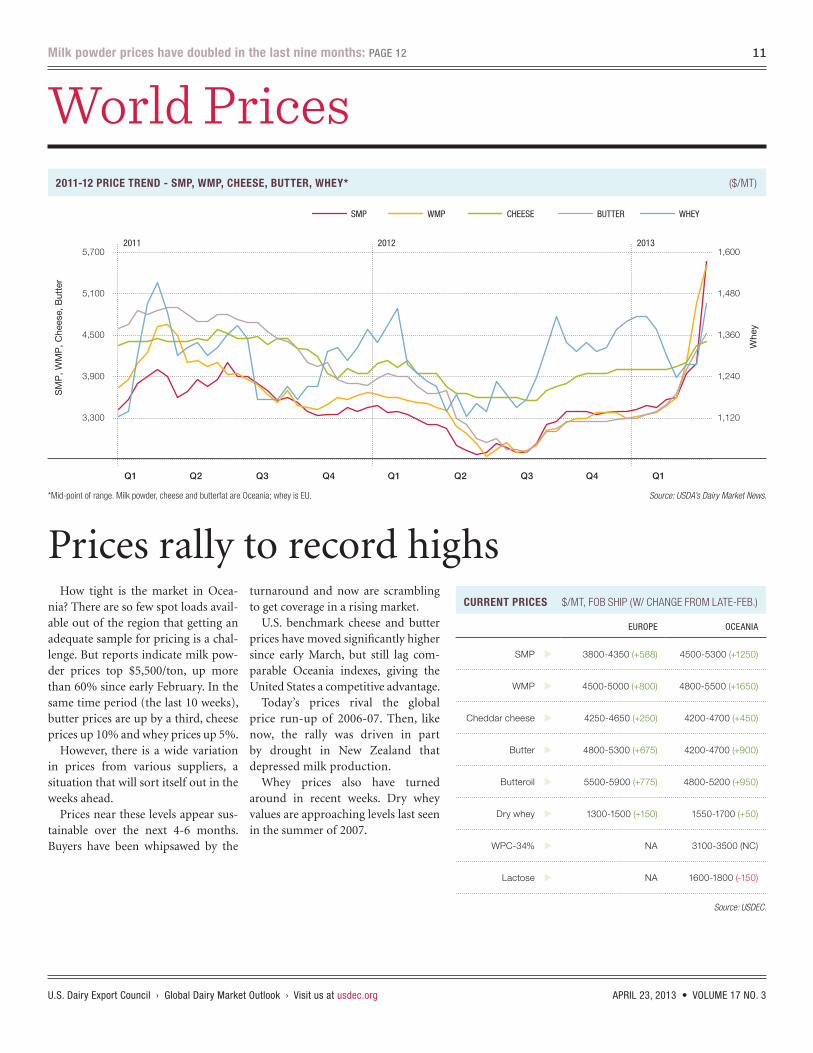
How tight is the market in Ocea-nia? There are so few spot loads avail-able out of the region that getting an adequate sample for pricing is a chal-lenge. But reports indicate milk pow-der prices top $5,500/ton, up more than 60% since early February. In the same time period (the last 10 weeks), butter prices are up by a third, cheese prices up 10% and whey prices up 5%.
However, there is a wide variation in prices from various suppliers, a situation that will sort itself out in the weeks ahead.
Prices near these levels appear sus-tainable over the next 4-6 months. Buyers have been whipsawed by the
turnaround and now are scrambling to get coverage in a rising market.
U.S. benchmark cheese and butter prices have moved significantly higher since early March, but still lag com-parable Oceania indexes, giving the United States a competitive advantage.
Today’s prices rival the global price run-up of 2006-07. Then, like now, the rally was driven in part by drought in New Zealand that depressed milk production.
Whey prices also have turned around in recent weeks. Dry whey values are approaching levels last seen in the summer of 2007.
Prices rally to record highs
Milk powder prices have doubled in the last nine months: PAGE 12
CURRENT PRICES $/MT, FoB SHiP (W/ CHAngE FRoM lATE-FEB.)
EUROPE OCEANIA
SMP u 3800-4350 (+588) 4500-5300 (+1250)
WMP u 4500-5000 (+800) 4800-5500 (+1650)
Cheddar cheese u 4250-4650 (+250) 4200-4700 (+450)
Butter u 4800-5300 (+675) 4200-4700 (+900)
Butteroil u 5500-5900 (+775) 4800-5200 (+950)
Dry whey u 1300-1500 (+150) 1550-1700 (+50)
WPC-34% u NA 3100-3500 (NC)
Lactose u NA 1600-1800 (-150)
2011-12 PRICE TREND - SMP, WMP, CHEESE, BUTTER, WHEy* ($/MT)
Source: USDEC.
Source: USDA’s Dairy Market News. *Mid-point of range. Milk powder, cheese and butterfat are oceania; whey is EU.
1,120
1,240
1,360
1,480
1,600
3,300
3,900
4,500
5,100
5,700
Whe
y
SM
P, W
MP
, Che
ese,
But
ter
SMP WMP CHEESE BUTTER WHEY
2012 2011 2013

6 Year Trend12
U.S. Dairy Export Council › Global Dairy Market Outlook › Visit us at usdec.org APRIL 23, 2013 • VOLUME 17 NO. 3
WORlD PRICES
WMP ($/MT)
BUTTER ($/MT)
SMP ($/MT)
CHEDDAR ($/MT)
DRy WHEy ($/MT)
Source: USDA’s Dairy Market News.
OCEANIA EU US
2,360
3,220
4,080
4,940
5,800
2008 2009 2010 2011 2012 2013
2,960
3,620
4,280
4,940
5,600
USOCEANIA
2008 2009 2010 2011 2012 2013
2,480
3,460
4,440
5,420
6,400
OCEANIA EU US
2008 2009 2010 2011 2012 2013
560
920
1,280
1,640
2,000
EU US
2008 2009 2010 2011 2012 2013
2,360
3,220
4,080
4,940
5,800
OCEANIA EU US
2008 2009 2010 2011 2012 2013

Currency Exchange13
U.S. Dairy Export Council › Global Dairy Market Outlook › Visit us at usdec.org APRIL 23, 2013 • VOLUME 17 NO. 3
Top chart: If line is trending up, currency is strengthening vs. U.S. dollar (U.S. dollar is weakening). This is favorable for U.S. competitiveness. If line is trending down, currency is weakening vs. U.S. dollar (U.S. dollar is strengthening). This is unfavorable for U.S. competitiveness.
Bottom chart: If line is trending up, currency is strengthening vs. U.S. dollar (U.S. dollar is weakening). This is favorable for exports, because it increases import purchasing power. If line is trending down, currency is weakening vs. U.S. dollar (U.S. dollar is strength-ening). This is unfavorable for exports, because it decreases import purchasing power.
Japanese yen down 20% vs. U.S. dollar since September
EXCHANGE RATES RELATIVE TO U.S. DOLLAR, EXPORTING COUNTRIES indEXEd To JAn. 1, 2011
EXCHANGE RATES RELATIVE TO U.S. DOLLAR, IMPORTING COUNTRIES indEXEd To JAn. 1, 2011
Source: Oanda.com.
U.S. dollar steady vs. exporter currencies
95.0
100.0
105.0
110.0
115.0
EURO NEW ZEALAND DOLLAR AUSTRALIA DOLLAR
2011
1/5 2/5 3/5 4/5 5/5 6/5 7/5 8/5 9/5 10/5 11/5 12/5 1/5 2/5 3/5 4/5 5/5 6/5 7/5 8/5 9/5 10/5 11/5 12/5 1/5 2/5 3/5 4/5
2012 2013
JAPAN YEN CHINA YUAN MEXICAN PESO KOREAN WON
86.0
92.0
98.0
104.0
110.0
1/5 2/5 3/5 4/5 5/5 6/5 7/5 8/5 9/5 10/5 11/5 12/5 1/5 2/5 3/5 4/5 5/5 6/5 7/5 8/5 9/5 10/5 11/5 12/5 1/5 2/5 3/5 4/5
2012 2011 2013