which country is the largest oil producer in the world
TRANSCRIPT

American Journal of Energy Engineering 2021; 9(1): 8-18 http://www.sciencepublishinggroup.com/j/ajee doi: 10.11648/j.ajee.20210901.12 ISSN: 2329-1648 (Print); ISSN: 2329-163X (Online)
Which Country Is the Largest Oil Producer in the World – the USA, Russia or Saudi Arabia: The Question of Measurement – What and How
Eugene Khartukov
Department of Management and Marketing, Moscow State Institute, University for International Relations (MGIMO MFA), Moscow, Russia
Email address:
To cite this article: Eugene Khartukov. Which Country Is the Largest Oil Producer in the World – the USA, Russia or Saudi Arabia: The Question of
Measurement – What and How. American Journal of Energy Engineering. Vol. 9, No. 1, 2021, pp. 8-18. doi: 10.11648/j.ajee.20210901.12
Received: January 11, 2021; Accepted: February 17, 2021; Published: March 26, 2021
Abstract: Current and past statuses and dynamics of oil production and methods of oil measurements in different countries –
under different temperatures and preassures – are considered and analyzed. The author uses methods of comparative and
systematic analyses, which are implemented for assessing oil production in the USA, Saudi Arabia and Russia – the world’s
leading oil producers – and globally (in the world’s context) in the past, currently and in the foreseeable future (throughout
2050). Crude oil and field (crude + lease NGLs) are considered. Oil developments in the USA, Saudi Arabia and Russia are
analyzed separately with their main oil fields being covered. In the past a status of the world’s largest oil producer was taken in
rotation by Russia and Saudi Arabia. Before 1992 the world supremacy in oil belonged to Russia but afterwards and until 2014
– mainly to Saudi Arabia. The article mainly concludes that now (since 2014) the USA produce more oil (crude oil + field
condensate) than any other country of the world, even without accounting for indigenous biofuel liquids and mostly thanks to
the massive tight-oil production.
Keywords: Crude Oil, Natural Gas Liquids/Condensate, Temperature, Pressure, STP, The USA, Russia, Saudi Arabia
1. Introduction
It is widely accepted that the current top oil producers are the
USA, Russia and Saudi Arabia, which produced all together in
2019 some two fifths of the world’s field production of oil (that
is of the global crude oil and lease conden-sate output) (Figures
1-3), but there are some nuances… (see below).
Figure 1. Monthly Oil Production in Russia, the USA and Saudi Arabia in 2011-2019, in mln b/d [1].

American Journal of Energy Engineering 2021; 9(1): 8-18 9
Figure 2. Oil Production (in mln b/d) in the USA, Russia and Saudi Arabia
and Shares of These Producers in Global Oil Supply (in %%) in 2019.
Source: Ten largest oil producers
https://www.valuewalk.com/2020/06/largest-oil-producers-2020 [2]
Individually speaking, Saudi Arabia is not king of the oil
production hill, for its nemesis – the country that sought to
undo every production quota OPEC could come up with, is
the United States. On its own, the United States produced
19.51 million barrels of oil (and other petroleum liquids) per
day, besting both Saudi Arabia and Russia, and controlling
19% of the world’s oil supplies (Figure 3).
Source: https://oilprice.com/Energy/ Crude-Oil [3]
Figure 3. Field Oil Production in the USA, Saudi Arabia and Russia in
2019, in mln b/d.
In its turn, the highly reliable statistics of BP (with actual
annual data for 2020 being expected only in June-July 2021)
tell that the USA, Russia and Saudi Arabia produced in 2019
746.7, 568.1 and 556.6 mln tonnes of crude oil and other oil
liquids (NGL) correspondingly (or nearly 42% as a total)
(Figure 4).
Source: compiled and drawn by the author based on https//: BP Statistical Review of World Energy June 2020 [4]
Figure 4. Annual Crude Oil and Field NGLs Production in the USA, Russia and Saudi Arabia in 1985-2019, in mln tonnes.
1.1. Russia
At the end of 2016, according to the Russian statistical
agency (Roskomstat), the country once again became the
world’s largest oil producer, having outstripped in December
Saudi Arabia (10.509 mln b/d compared with 10.424 mln b/d
in November vs. 10.474 and 10.623 mln b/d in Saudi Arabia)
[5] (see also Table 3).
1.1.1. Current Status
As per the well-informed US Energy Information
Administration (EIA/DoE), Russia’s production of crude oil
+ lease condensate was on the average (in kb/d) as follows:
in 2015 -10,551, in 2016 – 10,580, in 2017 – 10,759 and in
2018 – 10,847 [6].
Table 1. Production of Crude Oil and Lease/Mixed Condensate in Russia in
2016-2020 (according to the CDU/RF Minenergo).
Mln tonnes Mln b/d
2016 547.5 10.965
2017 546.8 10.985
2018 555.84 11.166
2019 560.2 11.246
2020 470. 22 9.414E
2016-2020 2 680.36 10.755E
Source: compiled and calculated on the basis of Ministerstvo energetiki RF
https://minenergo.gov.ru/activity/statistic [7]

10 Eugene Khartukov: Which Country Is the Largest Oil Producer in the World – the USA, Russia or Saudi Arabia: The Question of Measurement – What and How
Sourse: https://www.themoscowtimes.com/2019/08/07 [6]
Figure 5. Monthly Crude Oil and Field Condensate Production in Russia in 2014-2019, in kb/d.
1.1.2. A Bit of History
Talking about the history, Russia’s oil production reached its peak in 1987 (11,416 mln b/d of field oil, according to BP)
before a great dip of the 90s, caused by total disorganization of the industry (and the national economy), – down to less than 6
mln b/d in the second half of the 90s (Figure 6).
Source: Russian crude oil production https://en.wikipedia.org/ wiki/Petroleum_industry_in_Russia#/media/File: Russia_Oil_Production [9].
Figure 6. Russian Oil Production and Exports in 1960-2015, in mln b/d.
It is noteworthy that remaining oil reserves of Russia are
considered hard-to-recover ones and are located quite
unevenly. In 2019, up to 80% of Russia’s reco-verable oil
reserves was associated with operating oil fields while a
share of hard-to-recover oil reserves was estimated by
Russia’s Minprirody at 60% [10]. Most of oil reserves is
concentrated at 11 unique (≥ 300 mln tonnes per Russian
classification) and 179 large (≥ 30 mln tonnes of recoverable
oil) fields of mainly the Khanty-Mansi autonomous okrug
(KhMAO), in the Western Siberia, which contain as a total
some 70% of reserves and account for two thirds of oil
production in the country [11]. Russian oil production was growing despite Russia
participated in the so-called OPEC + deal. It is well known that,
in December 2016, 24 oil producers (13 OPEC members and 11
non-member countries) had struck a deal to withdraw from the
world oil market since the start of 2017 1.8 mln b/d of their
combind oil production (compared with October 2016) to buoy
American Journal of Energy Engineering 2021; 9(1): 8-18 11
up the declining world oil prices. Russia pled-ged to cut its oil
production by 300 kb/d (but I wonder which Russian profitably
oil-producing company was about to do it as it was the promise
of the Russian officials who – by law – have no right to regulate
an entity’s output… Neither it would be possible to command
any decrease in national oil production as the oil industry in
Russia is currently almost entirely privatized …) while Saudi
Arabia – the leading cutter – obliged to reduce its national oil
production by 486 kb/d. The accord was extended several times
and its terms were changed depending on the market’s status. In
particular, it was decided until the end of 2019 to decrease the
collective oil production by 1.2 mln b/d (compared with October
2018) while the combined cut in the first quarter of 2020 was set
at 1.7 mln b/d.
In December 2019, Russia managed to exclude gas
condensate from the agreement’s all national pleges to make
them in line with the OPEC quotas. As a result, at the end of
2019, the RF should lower its oil output by from a new basic
level of 10.626 mln b/d (instead of 11.421 mln b/d of crude
and field condensate) while in the 1Q of 2020 – only by 300
kb/d [12]. Moreover, the practical difficulty lies in the fact
that neiter the Roscomstat, the Russian statistical state
agency, nor the CDU TEK, the RF Minenergo’s official
information service, report Russian oil production excluding
condensate…
Furthermore, at least since the beginning of 2020, the RF
Minenergo started to falsify Russian oil production data to
make them more consistent with the OPEC + pledge.
1.2. Saudi Arabia
With its some 260+ remaining known oil reserves is the
world’s largest holder of conventional oil and can keep
production at 12 mln b/d until at least 2033.
1.2.1. Current Situation
As for the recent years, the omniscient U.S. Energy
Information Administration of the US Minenergo (EIA/DoE)
determines it in Saudi Arabia as follows (in kb/d, average):
2015 – 10,168; 2016 – 10,461; 2017 – 10,134; 2018 – 10,425
and 2019 (showing an obvious decrease) – 9,826 [13].
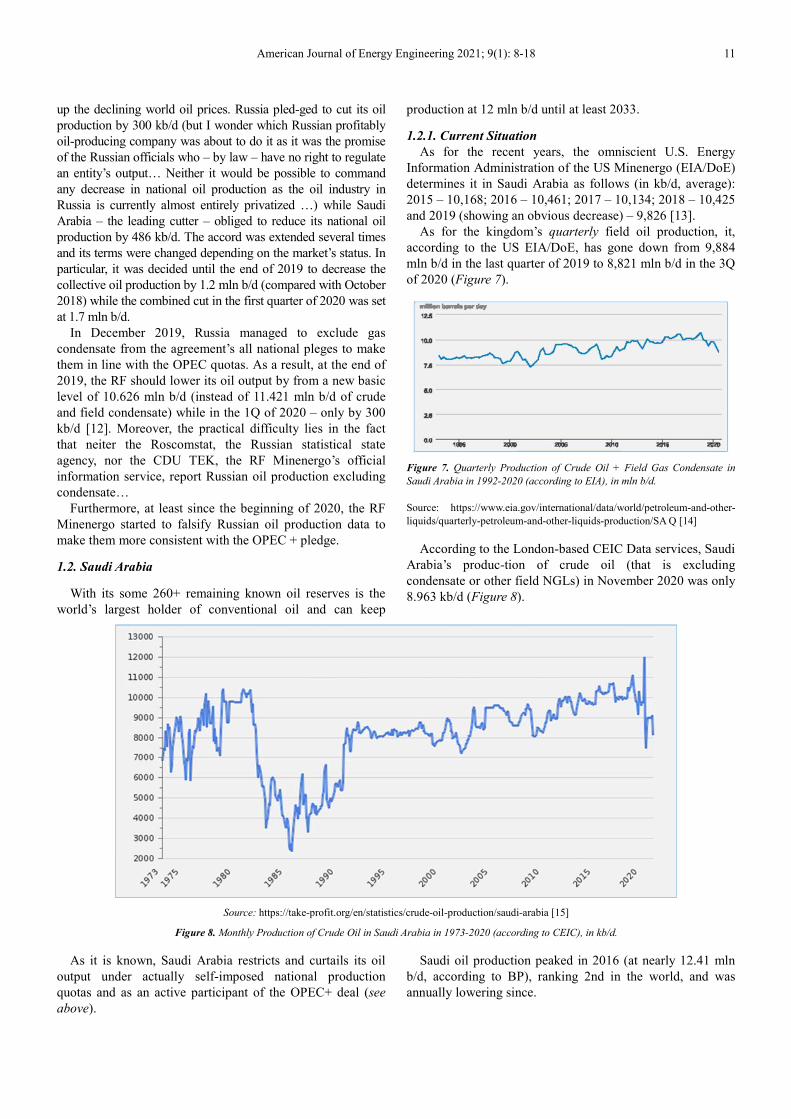
As for the kingdom’s quarterly field oil production, it,
according to the US EIA/DoE, has gone down from 9,884
mln b/d in the last quarter of 2019 to 8,821 mln b/d in the 3Q
of 2020 (Figure 7).
Figure 7. Quarterly Production of Crude Oil + Field Gas Condensate in
Saudi Arabia in 1992-2020 (according to EIA), in mln b/d.
Source: https://www.eia.gov/international/data/world/petroleum-and-other-
liquids/quarterly-petroleum-and-other-liquids-production/SA Q [14]
According to the London-based CEIC Data services, Saudi
Arabia’s produc-tion of crude oil (that is excluding
condensate or other field NGLs) in November 2020 was only
8.963 kb/d (Figure 8).
Source: https://take-profit.org/en/statistics/crude-oil-production/saudi-arabia [15]
Figure 8. Monthly Production of Crude Oil in Saudi Arabia in 1973-2020 (according to CEIC), in kb/d.
As it is known, Saudi Arabia restricts and curtails its oil
output under actually self-imposed national production
quotas and as an active participant of the OPEC+ deal (see
above).
Saudi oil production peaked in 2016 (at nearly 12.41 mln
b/d, according to BP), ranking 2nd in the world, and was
annually lowering since.

12 Eugene Khartukov: Which Country Is the Largest Oil Producer in the World – the USA, Russia or Saudi Arabia: The Question of Measurement – What and How
Figure 9. Location of Saudi Main HC Fields.
1.2.2. Main Fields
Current Saudi production comes mostly from five giant but
aging and fast-depleting oilfields (Ghawar, Safaniya, Hanifa,
Khurais and Zuluf), all of which are more than 70 years old
and are being kept producing by a huge injection of water.
They have over the years accounted for more than 90% of
Saudi oil production with the Ghawar field providing some
half of the total [3].
Ghawar, in the Eastern Province, is the largest
conventional oil field in the world located at 280 km × 30
km. It was discove-red in 1948, started production in 1951,
and is owned and operated by Saudi Aramco. Some sources
claim that the Ghawar peaked in 2005, though this is denied
by the field ope-rators. The field holds estimated 170 billion
barrels of original oil in place (OOIP), with some 140 bln bbl
being regarded as recoverable [16].
1.2.3. Production Capacity
Saudi Arabia has the world’s largest spare capacity in oil
production and used to utilize it for being a swing oil
producer within the OPEC (as well as globally) (Table 2).
Table 2. Oil Production Capacity and Production in Selected Countries (in April 2020 and as of the start of 2020), in kb/d. (1) April production vs recent peak.
(2) Assumes 400 kb/d from Saudi-Kuwait Neutral Zone
Spare capacity, in kb/d
Immediately available (1) Additional available by January 2020 (2)
Saudi Arabia 1,190 200
UAE 270 180
Iraq 120 260
Kuwait 200 0
Russia 220 150
Subtotal 2,000 790
Production in April, in kb/d Potential Downside, in kb/d
Iran 2,750 − 650
Venezuela 850 − 500
Subtotal 3,600 − 1,150
Source: Oil Supply Crunch to Test OPEC’s Spare Capacity https://www.oilandgas360.com/oil-supply-crunch-to-test-opecs-spare-capacity [17]
1.2.4. Outlook
The future of the kingdom’s oil production is, however,
quite gloomy, which is felt even now. Due to natural
depletion of discovered oil fields and the recent lack of major
discoveries in the country, its oil output goes down, which is
especially the case for the foreseeable future. Unsurprisingly,
already in 2007 some Western oil analysts (particularly, Euan
Mearns of the University of Aberdeen) foresaw Saudi
Arabia’s an-nual oil output going down to some 6 mln b/d by
the end of the 20s from the pre-dicted peak of nearly 12 mln
b/d in around 2011 (Figure 8).
Source: http://theoildrum.com/node/9321 [18]
Figure 10. Oil Production in Saudi Arabia in 1936-2028, in kb/d.

American Journal of Energy Engineering 2021; 9(1): 8-18 13
Back in the beginning of 2020, there were quite difficult
negotiations on production cuts between Saudi Arabia and
Russia within the OPEC+ deal (see above), which were
immediately labeled by Western journalists as the price war.
In fact, there was no war as such, simply Russian officials
did not agree with initially recommended cuts (and the deal
was crucially at stake) but the impasse had ended in April
2020 and the OPEC + agreement was extended further, with
the pleged cuts of nearly 10 mln b/d [19]. As a result, average
spot price of Brent blend and of Dubai and WTI crudes has
gone up from some $3/bbl at end-April and got stabilezed at
around $40/bbl in the 3Q of 2020 (Figure 12).
Figure 11. Friendly Meeting of Saudi and Russia Leaders in April 2020.
Source: https://img.datawrapper.de/JDTXk/full [20]
Figure 12. Dynamics of Average Spot Price of Brent, Dubai and WTI Oils in January-October 2020, in US$/bbl.
Saudi Arabia’s economy relies heavily on petroleum.
According to the Forbes magazine, petroleum accounts for
roughly 87 percent of the country’s budget reve-nues, 32
percent of GDP, and 81 percent of export earnings [21]. A
look at the dis-tribution of global oil reserves by country
shows that only Venezuela possesses a higher share in global
oil reserves than this Arab state [22].
Figure 13. Location of the Prudhoe Bay Field.
1.3. USA
In October 2018, thanks to aggressively growing “shale-
oil” (tight-oil) production, the country, which produced in
that month as a total 11,554 kb/d of crude oil and lease
condensate, according to the EIA [23], has become the
world’s largest oil producer, having overtaken this world
supremacy status from Russia (see also Table 3).
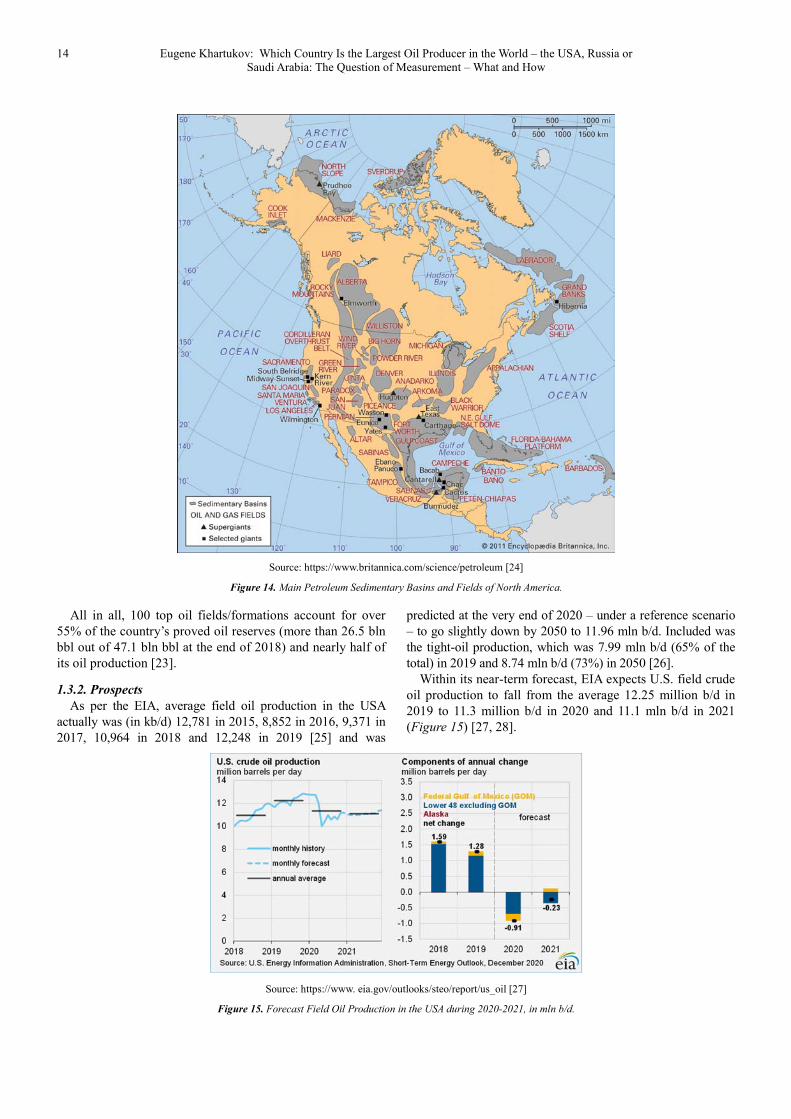
1.3.1. Where
The largest oil-producing fields (forma-tions) in the USA
include the Permian in Texas and in New Mexico, the Eagle
Ford Shale in Texas, and the Bakken formation in North
Dakota and Montana, Prudhoe Bay field in northern Alaska
(by the way, the largest oil field in both the United States and
North America, discovered in 1967 and located at 213,543
acres), the Wattenberg Field in Colorado (producing both gas
and oil), the Shenzi field in the Gulf of Mexico, the Kuparuk
River field in northern Alaska, west of the Prudhoe Bay, the
Midway-Sunset oil field in California, the Atlantis oil field in
the Gulf of Mexico, and Sugarkane field in Texas (Figure 14).
14 Eugene Khartukov: Which Country Is the Largest Oil Producer in the World – the USA, Russia or Saudi Arabia: The Question of Measurement – What and How
Source: https://www.britannica.com/science/petroleum [24]
Figure 14. Main Petroleum Sedimentary Basins and Fields of North America.
All in all, 100 top oil fields/formations account for over
55% of the country’s proved oil reserves (more than 26.5 bln
bbl out of 47.1 bln bbl at the end of 2018) and nearly half of
its oil production [23].
1.3.2. Prospects
As per the EIA, average field oil production in the USA
actually was (in kb/d) 12,781 in 2015, 8,852 in 2016, 9,371 in
2017, 10,964 in 2018 and 12,248 in 2019 [25] and was
predicted at the very end of 2020 – under a reference scenario
– to go slightly down by 2050 to 11.96 mln b/d. Included was
the tight-oil production, which was 7.99 mln b/d (65% of the
total) in 2019 and 8.74 mln b/d (73%) in 2050 [26].
Within its near-term forecast, EIA expects U.S. field crude
oil production to fall from the average 12.25 million b/d in
2019 to 11.3 million b/d in 2020 and 11.1 mln b/d in 2021
(Figure 15) [27, 28].
Source: https://www. eia.gov/outlooks/steo/report/us_oil [27]
Figure 15. Forecast Field Oil Production in the USA during 2020-2021, in mln b/d.

American Journal of Energy Engineering 2021; 9(1): 8-18 15
Moreover, the estimated pandemic-driven 0.8 million bpd
year-over-year out-put fall in 2021 is the largest annual decline
in US crude oil production on record, the EIA says [28].
At any rate, “shale-oil” (tight-oil) production was
instrumental in rising US total oil output up to and over 10 mln
b/d – while conventional oil production was rougfly stable – at
around 4,000-5,000 kb/d, – tight-oil one was dramatically
increasing with only inconsiderable decrease during an obvious
fall of domestic oil prices in 2014-2016 (Figure 16).
Source: https://www.stlouisfed.org/on-the-economy/2018/may/rise-shale-oil [29]
Figure 16. US Oil Production in 2010-2018, in kb/d.
2. What Should Be Noted
It is important not to overlook the fact that available oil
production data usually relate to the production of crude oil +
lease (or mixed/field) condensate.
Bearing in mind the differencies in measuring oil volumes
at standard tempera-ture and pressure (or, shortly, STP),
which are currently accepted in Russia and the USA (and
actually worldwide, excluding Russia and some major buyers
of Russian crude), it noteworthy that in order of bringing the
Russian oil volumes (traditional-ly and officially measured at
20°C and 760 mmHg) to the US conditions (60°F and and
14.696 psia) one needs to decrease the Russian volume by
1.54% (Figure 17) [30].
Figure 17. Oil Volumes under the U.S. and Russian Current STP, in %.
Source: Khartukov, E. and Novak, A. Measuring Oil and Gas Volumes in
Different Countries: Thе USA and Russian Cases. – Oilman, January-
February 2021, pp. 28-30 [30]
3. Who Is the Leader
All in all, if we consider a period since the middle of the
80s, when oil production data for Russia started to be
published, and typical field oil production data (that of crude
oil + lease condensate), the world’s largest oil producer
varied as follows: until 1992 it was Russia, then until 2009 a
status of the biggest oil-producing country was surely held by
Saudi Arabia, then again – for a short time, until 2011 – it
was overtaken by Russia, in 2011 Saudi Arabia anew though
shortly has acquired the status of the world’s oil leader, in
2016 this status has moved from the USA for two years only
back to Russia and finally since 2018 the USA have become
the world’s largest oil producer – thanks to their fast-growing
tight-oil pro-duction – for how long?.. (Table 3).
Table 3. Annual Field Oil Production by the World’s Largest Oil-Producing
Countries in 1985-2020, in kb/d.
Year USA Russia Saudi Arabia
1985 10,580 10,863 3,601
1986 10,231 11,247 5,208
1987 9,944 11,416 4,450
1988 9,765 11,373 5,656
1989 9,159 11,070 5,636
1990 8,914 10,342 7,106
1991 9,076 9,264 8,820
1992 8,868 7,978 9,092
1993 8,583 7,119 8,893
1994 8,389 6,371 8,983
1995 8,322 6,236 8,974
1996 8,295 6,062 9,087
1997 8,269 6,171 9,005
1998 8,011 6,110 9,267
1999 7,731 6,119 8,524
2000 7,733 6,583 9,121
2001 7,670 7,106 8,935
2002 7,624 7,755 8,207
2003 7,368 8,602 9,628
2004 7,250 9,335 10,306
2005 6,901 9,598 10,839
2006 6,825 9,834 10,671
2007 6,857 10,057 10,269
2008 6,783 9,965 10,655
2009 7,267 10,152 9,709
2010 7,558 10,379 9,865
2011 7,883 10,533 11,079
2012 8,926 10,656 11,622
2013 10,099 10,807 11,393
2014 11,801 10,860 11,519
2015 12,781 11,007 11,998
2016 8,852 10,551 10,461
2017 9,371 10,580 10,134
2018 10,964 10,759 10,425
2019 12,248 10,847 10,145
2020 11,100F 9,414E 9,140E
Note: 1985-1999 – production of crude oil + field NGLs, according to BP;
from 2000 – field production (crude oil + lease/field condensate), according
to the EIA
Source: compiled by the author based mainly on https//: BP Statistical
Review of World Energy June 2020 [4] and
https://www.eia.gov/international/data [6]

16 Eugene Khartukov: Which Country Is the Largest Oil Producer in the World – the USA, Russia or Saudi Arabia: The Question of Measurement – What and How
4. No NGL
However, if we consider only crude oil (that is exclude
lease/field condensate or any other NGLs, a lot of which is
produced in Russia – on the average, some 0.75 mb/d in the
recent years or around 7% of its total oil output – and in the
USA – 5.4 mb/d (0.44%) in 2019) [23], some differencies in
the world’s supremacy in 1985, 1991, 2014-2015 and 2018
occur but they, though important for those years, do not
considerably change the general picture (Figure 19).
Figure 18. It is how NGLs look.
Figure 19. Annual Production of Field Oil by the World’s Largest Oil-Producing Countries in 1985-2020, in kb/d.
Source: estimated and drawn by the author mainly based on Table 3, https://take-profit.org/en/statistics/crude-oil-production/saudi-arabia [15],
https://www.eia. gov/dnav/pet/hist/LeafHandler.ashx?n=PET&s=MCRFPUS1/2&f [23]
5. Outlooks Thoughout 2050
In line with the last annual report of the interna-tional peak-oil
organization (ASPO), the 3 top oil producing countries will
produce by 2050 slightly less of their oil (Figure 20).
Source: http://peakoilbarrel.com/world-oil-2018-2050 [31]
Figure 20. Actual and Projected Field Oil Production in 1980-2050, in mln
tonnes.
5.1. USA
According to the last long-term forecast (the beginning of
2021) of the Energy Information Administration of the US
Department of Energy (EIA/ DoE), field oil production in the
country must decrease by 2050, under a reference scenario,
from a maximum of more than 14 mln b/d in 2027-2035 to a
bit less than 12 mln b/d (Figure 21).
Figure 21. The USA’s Field Annual Oil Production in 2010-2050 (according
to EIA).
Source: Saudi Arabia Eyes Total Dominance In Oil
https://oilprice.com/Energy/ Crude-Oil [3]

American Journal of Energy Engineering 2021; 9(1): 8-18 17
5.2. Russia
As for Russia’s long-term prospects, the Moscow-based
Energy Research Institute of The Russian Academy of
Sciences (ERI RAS) predicts oil pro-duction by 2040 in its
basic scenario the following way (Figure 22):
Source: http://peakoilbarrel. com/russias-take [32]
Figure 22. Oil + Lease Condensate Production in 2010-2040, in mln b/d
(originally converted from tonnes using 7.27 barrels per tonne).
In its turn, the all-knowing EIA predicts, however, that
Russian annual field oil production must go up by 2050 from
less than 11 mb/d to more than 13 mb/d and Russia must
overtake the USA in this respect (Figure 23).
Figure 23. The EIA’s Flrecast of Russia’s Annual Field Oil Output till 2050,
in mln b/d.
Source: https://www.rt.com/business/469653-russia-overtakes-us-oil-
production [33]
5.3. Saudi Arabia
Based on the ASPO estimates, the Saudi oil production is
projected to peak in 2030 at 606 million tonnes and to lessen
to around 500 mln t per year by the middle of this century
(Figure 24).
Source: http://peakoilbarrel.com/world-oil-2018-2050 [31]
Figure 24. Actual and Projected Annual Field Oil Production in Saudi
Arabia in 1980-2050, in mln tonnes per year.
6. Conclusion
So, based on the above considerations, and if all field
NGLs are included, currently, since 2019, the world’s largest
oil producer is the USA, fol-lowed by Saudi Arabia and
Russia, and this is unlikely to change in near future.
References
[1] The United States has become the world's biggest crude oil producer ahead of Russia and Saudi Arabia [Available in the Internet at: http://fingfx.thomsonreuters.com/gfx/editorcharts/OIL-PRODUCTION] (Accessed 20 December 2020).
[2] Ten largest oil producers [Available in the Internet at: https://www.valuewalk.com/2020/06/largest-oil-producers-2020] (Accessed: 13 January 2021).
[3] Saudi Arabia Eyes Total Dominance In Oil [Available in the Internet at: https://oilprice.com/Crude-Oil] (Accessed: 13 January 2021).
[4] Oil Production [Available in the Internet at: https//:BP Statistical Review of World Energy June 2020] (Accessed: 3 January 2021).
[5] Russia and Saudia have crossed hoses [Available in the Internet at: http://sr.fondedin.ru/new/fullnews_arch_to.php? subaction=showfull &id= 14913074 (Accessed: 31 December 2020).
[6] International - U.S. Energy Information Administration [Available in the Internet at: https://www.eia.gov/international/data] (Accessed: 31 December 2020).

18 Eugene Khartukov: Which Country Is the Largest Oil Producer in the World – the USA, Russia or Saudi Arabia: The Question of Measurement – What and How
[7] Russian Oil and Gas Output Continues Rising Despite Setbacks [Available in the Internet at: https://www.themoscowtimes.com/2019/08/07] (Ac-cessed: 31 December 2020).
[8] Ministerstvo energetiki RF [Available in the Internet at: https://minenergo.gov.ru/activity/statistic] (Accessed: 1 January 2021).
[9] Russian crude oil production [Available in the Internet at: https://en.wikipedia.org/wiki/Petroleum_industry_in_Russia#/media/File:Rus-sia_Oil_Production (Accessed: 1 January 2021).
[10] Hard-to-recover oil reserves are estimated in the Minprirody [Available in the Internet at: https://www.dp.ru/a/2019/08/27] (Ac-cessed: 1 January 2021).
[11] Where there is more oil? [Available in the Internet at: https://www.cdu.ru/tek_russia/issue/2019/5] (Accessed: 1 January 2021).
[12] Rossiya postavila postsovetskiy record po dobyche nefti v 2019 g. [Available in the Internet at: https://neftegaz.ru/news/dobycha/516403] (Accessed: 1 January 2021).
[13] International - U.S. Energy Information Administration [Available in the Internet at: https://www.eia.gov/international/data] (Accessed: 1 January 2021).
[14] International - U.S. Energy Information Administration (EIA) [Available in the Internet at: https://www.eia.gov/international/data/world/petroleum-and-other-liquids/quarterly-petroleum-and-other-liquids-production/SA Q] (Accessed: 1 January 2021).
[15] Saudi Arabia Crude Oil: Production [Available in the Internet at: https://take-profit.org/en/statistics/crude-oil-production/saudi-arabia (Accessed: 1 January 2021).
[16] Ghawar Field [Available in the Internet at: https://en.wikipedia.org/wiki/Ghawar_Field] (Accessed: 1 January 2021).
[17] Oil Supply Crunch to Test OPEC’s Spare Capacity [Available in the Internet at: https://www.oilandgas360.com/oil-supply-crunch-to-test-opecs-spare-capacity (Accessed: 1 January 2021).
[18] Tech Talk - The "Best of the Rest" in Saudi Arabia [Available in the In-ternet at: http://theoildrum.com/node/9321 (Accessed: 1 January 2021).
[19] OPEC + reaches deal to cut oil production by 9.7 million barrels per day [Available in the Internet at: https://edition.cnn.com/2020/04/12/energy/opec-deal-production-cut (Accessed: 1 January 2021).
[20] Crude oil price rising [Available in the Internet at: https://img.data-wrapper.de/JDTXk/full (Accessed: 1 January 2021).
[21] Saudi Arabia - Market Overview [Available in the Internet at: https://www.export.gov/article?series=Country_Commercial_kav (Accessed: 3 January 2021).
[22] Inflation in Saudi Arabia since 1985 [Available in the Internet at: https:/ /www.statista.com/statistics/268062] (Accessed: 3 January 2021).
[23] Petroleum & other liquids [Available in the Internet at: https://www.eia.gov/dnav/pet/hist/LeafHandler.ashx?n=PET&s=MCRFPUS1/2&f (Accessed: 1 January 2021).
[24] Major-oil-producing-countries [Available in the Internet at: https://www.britannica.com/science/petroleum (Accessed: 1 January 2021).
[25] U.S. Field Production of Crude Oil [Available in the Internet at: https://www.eia.gov/dnav/pet/hist/LeafHandler.ashx?n=PET&s= MCRFPUS-2&f] (Accessed: 1 January 2021).
[26] Annual Energy Outlook (AEO): Evaluation of AEO2020 Reference Case Projections Oil and Gas Supply [Available in the Internet at: https://www. eia.gov/petroleum/supply (Accessed: 1 January 2021).
[27] Short-Term Energy Outlook [Available in the Internet at: https://www. eia.gov/outlooks/steo/report/us_oil (Accessed: 26 December 2020).
[28] US crude oil production forecast to fall in 2020, 2021 [Available in the In-ternet at: https:/ /www.aa.com. tr/en/energy/stock-market] (Accessed: 26 December 2020).
[29] The Rise of Shale Oil 2021 [Available in the Internet at: https://www. stlouisfed.org/on-the-economy/2018/may/rise-shale-oil] (Accessed: 3 January 2021).
[30] Khartukov, E. and Novak, A. Measuring Oil and Gas Volumes in Different Countries: Thе USA and Russian Cases. – Oilman, January-February 2021, pp. 28-30.
[31] World Oil 2018-2050: World Energy Annual Report (Part 2) [Available in the Internet at: http://peakoilbarrel.com/world-oil-2018-2050] (Accessed: 13 January 2021).
[32] Global and Russian Energy Outlook to 2040 [Available in the Internet at:http://peakoilbarrel. com/russias-take] (Accessed: 13 January 2021).
[33] Russia will eclipse American oil production by 2050 – US energy agency https://www.rt.com/business/469653-russia-overtakes-us-oil-production] (Accessed: 13 January 2021).
Biography
Eugene Khartukov, Professor of the
Moscow State Institute/University for
International Relations (MGIMO MFA), Head
of the World Analyses and Forecasting Group
(GAPMER) and of the Center for Petroleum
Business Studies (CPBS) and Vice President
(for Eurasia) of the Geneva-based Petro-
Logistics SA. Author of more than 360
publications oil, gas and energy forecasting and speaker at over
170 international energy and economic fora